Global Agrivoltaics Market, By System, By Crop Type, By Mounting Type, By Application, By Region & Segmental Insights Trends and Forecast, 2023 – 2034

  • Industry: Agriculture
  • Report ID: TNR-110-1303
  • Number of Pages: 420
  • Table/Charts : Yes
  • September, 2024
  • Base Year : 2024
  • No. of Companies : 10+
  • No. of Countries : 29
  • Views : 10165
  • Covid Impact Covered: Yes
  • War Impact Covered: Yes
  • Formats : PDF, Excel, PPT

Agrivoltaics, also known as agrophotovoltaics, is the innovative practice of combining solar energy production with agricultural activities on the same land. This approach optimizes land use by enabling both farming and energy generation, contributing to sustainability. The agrivoltaics market is expanding due to the growing demand for renewable energy and sustainable farming.

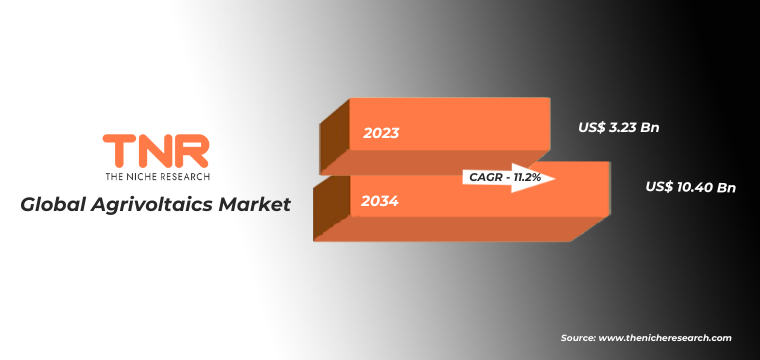
Applications include integrating solar panels in crop fields, orchards, and livestock farms. A notable example is a project in Germany’s Heggelbach farm, launched in 2016, where solar panels were installed above crops, boosting energy production while maintaining crop yield. In Japan, since 2013, agrivoltaic systems have been implemented to support small-scale farmers by generating additional income from solar power. End users, such as farmers, benefit from increased revenue streams, reduced carbon footprints, and enhanced crop resilience to climate variability. In terms of revenue, the global agrivoltaics market was worth US$ 3.23 Bn in 2023, anticipated to witness CAGR of 11.2% During 2024 – 2034.

Growth Drivers of Global Agrivoltaics Market

  • Rising Demand for Renewable Energy and Sustainable Agriculture: The global push for renewable energy is driving the growth of the agrivoltaics market. As countries aim to reduce carbon emissions, agrivoltaic systems are increasingly being adopted to combine energy generation with sustainable agriculture. For example, Japan has been investing in agrivoltaics since 2013, with the Shizen Energy project integrating solar panels with crop production. This approach supports farmers by providing an additional revenue stream from energy production, while maintaining crop yield. As governments worldwide promote clean energy initiatives, agrivoltaics is becoming an essential solution for optimizing land use and reducing environmental impact.


  • Climate Change Resilience and Agricultural Protection: Agrivoltaic systems offer farmers a way to protect crops from extreme weather while generating electricity. The shade provided by solar panels can reduce heat stress and improve water retention in soil, helping crops survive in areas affected by climate change. A notable example is the 2016 Heggelbach farm project in Germany, where solar panels shielded crops from excessive sunlight, improving resilience during heatwaves. This dual benefit of energy production and agricultural protection is a key driver for agrivoltaics adoption, especially as climate-related challenges intensify globally.

Technology Analysis of Agrivoltaics:

Technology Component Description Example Benefits
Photovoltaic (PV) Panels Solar panels used to convert sunlight into electricity, typically installed above or alongside agricultural land. Heggelbach Farm, Germany (2016): PV panels were installed above crops like potatoes and wheat. Dual land use for energy generation and farming. – Energy cost savings. – Provides shade, which can protect crops from excessive sunlight and heat.
Bifacial Solar Panels Panels that absorb sunlight from both sides, increasing efficiency by capturing reflected light from the ground. Shizen Energy, Japan (2013): Bifacial panels used in vegetable farms to increase energy generation. Increased solar energy efficiency. – Optimized land use, particularly beneficial for low-light conditions. – Additional energy generation from light reflected off crops or soil.
Dynamic Solar Panel Systems Panels that adjust their orientation to follow the sun’s path, optimizing both energy production and light exposure for crops. Sun’Agri, France (2020): Dynamic panels move to provide optimal sunlight for vineyards. Maximizes energy production throughout the day. – Can be adjusted to protect crops from excessive sunlight or frost. – Enables precision farming in sunlight management.
Semi-Transparent Solar Panels Panels that allow partial sunlight to pass through, providing light for crops while still generating electricity. Toshiba, Japan (2020): Semi-transparent solar panels used in rice fields to allow both sunlight and power generation. Crops receive necessary sunlight for growth. – Energy generation while maintaining full crop productivity. – Aesthetic appeal and efficient space use in greenhouses or crop fields.
Thin-Film Solar Cells Lightweight and flexible solar cells that can be applied to various surfaces, including greenhouses and irregular structures. Solaris Agrivoltaics, Italy (2021): Thin-film solar cells applied to greenhouse rooftops. Flexibility in application on diverse surfaces. – Less intrusive compared to traditional panels, maintaining more light for crops. – Lower weight load, making them suitable for rooftops.
Concentrated Solar Power (CSP) Mirrors or lenses concentrate sunlight onto a small area to generate high-temperature heat for electricity production. California, U.S. (2017): CSP technology tested in combination with farming near solar power plants. High efficiency in energy generation. – Possible application in remote areas with limited space. – Potential integration with large-scale farming operations.

Global Agrivoltaics Market Revenue & Forecast, (US$ Million), 2016 – 2034

Global Agrivoltaics Market By System

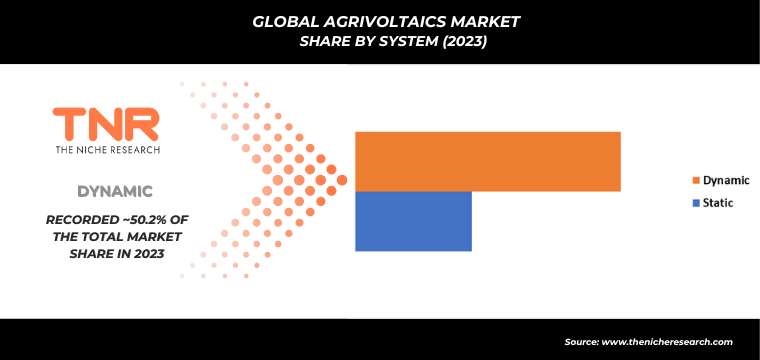
In 2023, dynamic systems dominated the global agrivoltaics market, accounting for 50.2% of the market’s revenue share. These systems, which adjust the angle of solar panels to follow the sun’s path, optimize both energy generation and crop growth. An example of this technology is the Sun’Agri project in France, where dynamic solar panels were installed over vineyards in 2020. The system allows panels to move in real-time, adapting to the specific needs of crops, such as providing shade during intense sunlight or maximizing exposure during cooler periods, making it a highly efficient solution for sustainable farming and energy production.

Global Agrivoltaics Market By Crop Type

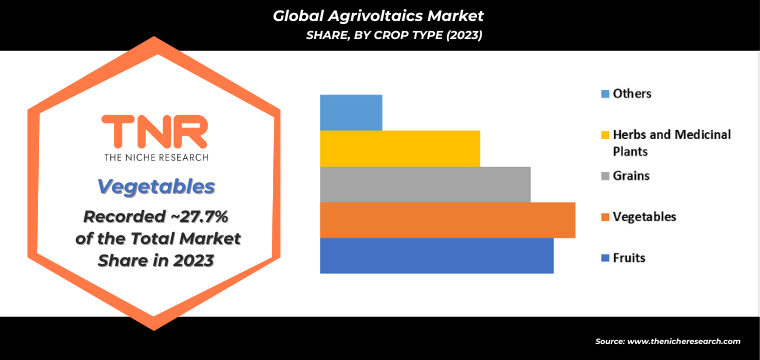
Herbs and medicinal plants are expected to experience the fastest growth in the agrivoltaics market during the forecast period. These plants thrive under partially shaded conditions, making them ideal for cultivation beneath solar panels. In Japan, a 2020 agrivoltaic project focused on growing medicinal herbs like ginseng under semi-transparent solar panels, which provided the right balance of sunlight for plant growth while generating renewable energy. This dual-purpose system not only enhances plant health and yield but also boosts income for farmers, as demand for natural and medicinal products continues to rise globally, fueling further adoption of agrivoltaics in this segment.

Global Agrivoltaics Market By Mounting Type

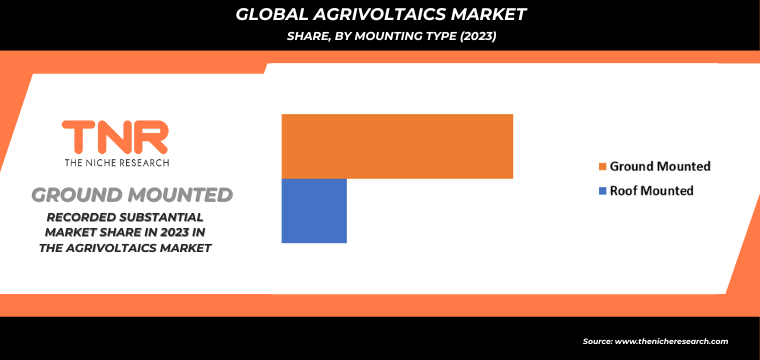
Ground mounted agrivoltaics led the global market in 2023 with a revenue share of 78.1%. These systems involve installing solar panels directly on agricultural land, allowing for large-scale energy generation while maintaining crop cultivation. For instance, in 2016, Germany’s Heggelbach farm successfully implemented a ground-mounted agrivoltaic system, where solar panels were strategically placed above crops like potatoes and wheat. This setup maximized land use efficiency, providing shade for crops while producing renewable energy. The widespread adoption of ground-mounted systems is driven by their flexibility, scalability, and suitability for various agricultural environments, making them a dominant solution in the market.

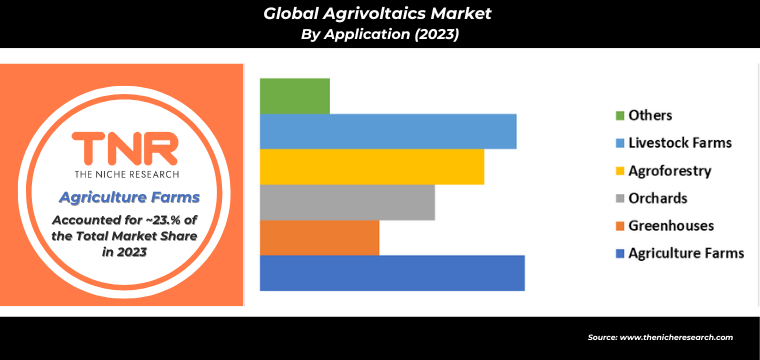
Global Agrivoltaics Market By Application

In 2023, orchards captured 15.8% of the revenue share in the global agrivoltaics market and are projected to be the fastest-growing segment. The integration of solar panels into orchards not only optimizes land use but also enhances crop protection. For instance, in 2020, Sun’Agri in France implemented agrivoltaic systems in vineyards, using dynamic panels to shield crops from excessive sunlight while generating renewable energy. This model is gaining traction in orchards, where solar panels provide shade, reduce water evaporation, and protect fruits from harsh weather. The dual benefits of energy production and improved agricultural output are driving rapid adoption in this sector.

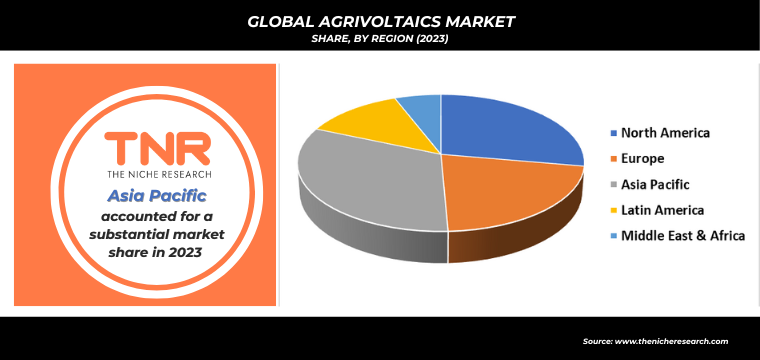
Global Agrivoltaics Market By Region

In 2023, Asia Pacific dominated the global agrivoltaics market, holding a 32.2% revenue share. The region’s leadership is driven by large-scale projects and government support for renewable energy initiatives. Japan has been a key player, with significant investments in agrivoltaics since 2013, including Shizen Energy’s project that integrates solar panels with crop cultivation. Additionally, China has rapidly expanded its agrivoltaic installations to enhance rural electrification while supporting sustainable agriculture. These countries’ focus on optimizing land use for both energy and food production has positioned Asia Pacific as the leading region in the global agrivoltaics market.

Competitive Landscape

Some of the players operating in the agrivoltaics market are

  • Agrivoltaic Solution LLC
  • BayWa AG
  • Boralex
  • Enel Green Power
  • Mackin Energy
  • REM TEC
  • Sun Agri
  • Sunrise Power Solutions
  • Suntech Power Holdings
  • TotalEnergies SE
  • Other Industry Participants

Global Agrivoltaics Market Scope:

Report Specifications Details
Market Revenue in 2023 US$ 3.23 Bn
Market Size Forecast by 2034 US$ 10.40 Bn
Growth Rate (CAGR) 11.2%
Historic Data 2016 – 2022
Base Year for Estimation 2023
Forecast Period 2024 – 2034
Report Inclusions Market Size & Estimates, Market Dynamics, Competitive Scenario, Trends, Growth Factors, Market Determinants, Key Investment Segmentation, Product/Service/Solutions Benchmarking
Segments Covered By System, By Crop Type, By Mounting Type, By Application, By Region
Regions Covered North America, Europe, Asia Pacific, Middle East & Africa, Latin America
Countries Covered U.S., Canada, Mexico, Rest of North America,  France, The UK, Spain, Germany, Italy, Nordic Countries (Denmark, Finland, Iceland, Sweden, Norway), Benelux Union (Belgium, The Netherlands, Luxembourg), Rest of Europe,  China, Japan, India, New Zealand, Australia, South Korea, Southeast Asia (Indonesia, Thailand, Malaysia, Singapore, Rest of Southeast Asia), Rest of Asia Pacific,  Saudi Arabia, UAE, Egypt, Kuwait, South Africa, Rest of Middle East & Africa,  Brazil, Argentina, Rest of Latin America
Key Players Agrivoltaic Solution LLC, BayWa AG, Boralex, Enel Green Power, Mackin Energy, REM TEC, Sun Agri, Sunrise Power Solutions, Suntech Power Holdings, TotalEnergies SE
Customization Scope Customization allows for the inclusion/modification of content pertaining to geographical regions, countries, and specific market segments.
Pricing & Procurement Options Explore purchase options tailored to your specific research requirements
Contact Details Consult With Our Expert

Japan (Toll-Free):  +81 663-386-8111

South Korea (Toll-Free):  +82-808- 703-126

Saudi Arabia (Toll-Free):  +966 800-850-1643

United Kingdom: +44 753-710-5080

United States: +1 302-232-5106

E-mail:  askanexpert@thenicheresearch.com


Global Agrivoltaics Market

By System

  • Static
  • Dynamic

By Crop Type

  • Fruits
  • Vegetables
  • Grains
  • Herbs and Medicinal Plants
  • Others

By Mounting Type

  • Roof Mounted
  • Ground Mounted

By Application

  • Agriculture Farms
  • Greenhouses
  • Orchards
  • Agroforestry
  • Livestock Farms
  • Others

By Region

  • North America (U.S., Canada, Mexico, Rest of North America)
  • Europe (France, The UK, Spain, Germany, Italy, Nordic Countries (Denmark, Finland, Iceland, Sweden, Norway), Benelux Union (Belgium, The Netherlands, Luxembourg), Rest of Europe)
  • Asia Pacific (China, Japan, India, New Zealand, Australia, South Korea, Southeast Asia (Indonesia, Thailand, Malaysia, Singapore, Rest of Southeast Asia), Rest of Asia Pacific)
  • Middle East & Africa (Saudi Arabia, UAE, Egypt, Kuwait, South Africa, Rest of Middle East & Africa)
  • Latin America (Brazil, Argentina, Rest of Latin America)

Report Layout:

Layout

Table of Contents

.

1.Market Scope
1.1.Market Segmentation
1.2.Years Considered
1.2.1.Historic Years: 2016 – 2022
1.2.2.Base Year: 2023
1.2.3.Forecast Years: 2024 – 2034
2.Key Target Audiences
3.Research Methodology
3.1.Primary Research
3.1.1.Research Questionnaire
3.1.2.Global Percentage Breakdown
3.1.3.Primary Interviews: Key Opinion Leaders (KOLs)
3.2.Secondary Research
3.2.1.Paid Databases
3.2.2.Secondary Sources
3.3.Market Size Estimates
3.3.1.Top-Down Approach
3.3.2.Bottom-Up Approach
3.4.Data Triangulation Methodology
3.5.Research Assumptions
4.Recommendations and Insights from TNR’s Perspective**
5.Holistic Overview of Agrivoltaics Market
6.Market Synopsis: Agrivoltaics Market
7.Agrivoltaics Market Analysis: Qualitative Perspective
7.1.Introduction
7.1.1.Product Definition
7.1.2.Industry Development
7.2.Market Dynamics
7.2.1.Drivers
7.2.2.Restraints
7.2.3.Opportunities
7.2.4.Challenges
7.3.Trends in Agrivoltaics Market
7.4.Market Determinants Radar Chart
7.5.Macro-Economic and Micro-Economic Indicators: Agrivoltaics Market
7.6.Industry Gross Margin Overview
7.7.Porter’s Five Force Analysis
7.8.Impact of Covid-19 on Agrivoltaics Market
7.9.PESTEL Analysis
7.10.Value Chain Analysis
7.11.Pricing Analysis, By Region (2023)
7.11.1.North America
7.11.2.Europe
7.11.3.Asia Pacific
7.11.4.Middle East and Africa
7.11.5.Latin America
8.Global Agrivoltaics Market Analysis and Forecasts, 2024 – 2034
8.1.Overview
8.1.1.Global Agrivoltaics Market Revenue (US$ Mn)
8.2.Global Agrivoltaics Market Revenue (US$ Mn) and Forecasts, By System
8.2.1.Static
8.2.1.1.Definition
8.2.1.2.Market Estimation and Penetration, 2016 – 2023
8.2.1.3.Market Forecast, 2024 – 2034
8.2.1.4.Compound Annual Growth Rate (CAGR)
8.2.1.5.Regional Bifurcation
8.2.1.5.1.North America
8.2.1.5.1.1.Market Estimation, 2016 – 2023
8.2.1.5.1.2.Market Forecast, 2024 – 2034
8.2.1.5.2.Europe
8.2.1.5.2.1.Market Estimation, 2016 – 2023
8.2.1.5.2.2.Market Forecast, 2024 – 2034
8.2.1.5.3.Asia Pacific
8.2.1.5.3.1.Market Estimation, 2016 – 2023
8.2.1.5.3.2.Market Forecast, 2024 – 2034
8.2.1.5.4.Middle East and Africa
8.2.1.5.4.1.Market Estimation, 2016 – 2023
8.2.1.5.4.2.Market Forecast, 2024 – 2034
8.2.1.5.5.Latin America
8.2.1.5.5.1.Market Estimation, 2016 – 2023
8.2.1.5.5.2.Market Forecast, 2024 – 2034
8.2.2.Dynamic
8.2.2.1.Definition
8.2.2.2.Market Estimation and Penetration, 2016 – 2023
8.2.2.3.Market Forecast, 2024 – 2034
8.2.2.4.Compound Annual Growth Rate (CAGR)
8.2.2.5.Regional Bifurcation
8.2.2.5.1.North America
8.2.2.5.1.1.Market Estimation, 2016 – 2023
8.2.2.5.1.2.Market Forecast, 2024 – 2034
8.2.2.5.2.Europe
8.2.2.5.2.1.Market Estimation, 2016 – 2023
8.2.2.5.2.2.Market Forecast, 2024 – 2034
8.2.2.5.3.Asia Pacific
8.2.2.5.3.1.Market Estimation, 2016 – 2023
8.2.2.5.3.2.Market Forecast, 2024 – 2034
8.2.2.5.4.Middle East and Africa
8.2.2.5.4.1.Market Estimation, 2016 – 2023
8.2.2.5.4.2.Market Forecast, 2024 – 2034
8.2.2.5.5.Latin America
8.2.2.5.5.1.Market Estimation, 2016 – 2023
8.2.2.5.5.2.Market Forecast, 2024 – 2034
8.3.Key Segment for Channeling Investments
8.3.1.By System
9.Global Agrivoltaics Market Analysis and Forecasts, 2024 – 2034
9.1.Overview
9.2.Global Agrivoltaics Market Revenue (US$ Mn) and Forecasts, By Crop Type
9.2.1.Fruits
9.2.1.1.Definition
9.2.1.2.Market Estimation and Penetration, 2016 – 2023
9.2.1.3.Market Forecast, 2024 – 2034
9.2.1.4.Compound Annual Growth Rate (CAGR)
9.2.1.5.Regional Bifurcation
9.2.1.5.1.North America
9.2.1.5.1.1.Market Estimation, 2016 – 2023
9.2.1.5.1.2.Market Forecast, 2024 – 2034
9.2.1.5.2.Europe
9.2.1.5.2.1.Market Estimation, 2016 – 2023
9.2.1.5.2.2.Market Forecast, 2024 – 2034
9.2.1.5.3.Asia Pacific
9.2.1.5.3.1.Market Estimation, 2016 – 2023
9.2.1.5.3.2.Market Forecast, 2024 – 2034
9.2.1.5.4.Middle East and Africa
9.2.1.5.4.1.Market Estimation, 2016 – 2023
9.2.1.5.4.2.Market Forecast, 2024 – 2034
9.2.1.5.5.Latin America
9.2.1.5.5.1.Market Estimation, 2016 – 2023
9.2.1.5.5.2.Market Forecast, 2024 – 2034
9.2.2.Vegetables
9.2.2.1.Definition
9.2.2.2.Market Estimation and Penetration, 2016 – 2023
9.2.2.3.Market Forecast, 2024 – 2034
9.2.2.4.Compound Annual Growth Rate (CAGR)
9.2.2.5.Regional Bifurcation
9.2.2.5.1.North America
9.2.2.5.1.1.Market Estimation, 2016 – 2023
9.2.2.5.1.2.Market Forecast, 2024 – 2034
9.2.2.5.2.Europe
9.2.2.5.2.1.Market Estimation, 2016 – 2023
9.2.2.5.2.2.Market Forecast, 2024 – 2034
9.2.2.5.3.Asia Pacific
9.2.2.5.3.1.Market Estimation, 2016 – 2023
9.2.2.5.3.2.Market Forecast, 2024 – 2034
9.2.2.5.4.Middle East and Africa
9.2.2.5.4.1.Market Estimation, 2016 – 2023
9.2.2.5.4.2.Market Forecast, 2024 – 2034
9.2.2.5.5.Latin America
9.2.2.5.5.1.Market Estimation, 2016 – 2023
9.2.2.5.5.2.Market Forecast, 2024 – 2034
9.2.3.Grains
9.2.3.1.Definition
9.2.3.2.Market Estimation and Penetration, 2016 – 2023
9.2.3.3.Market Forecast, 2024 – 2034
9.2.3.4.Compound Annual Growth Rate (CAGR)
9.2.3.5.Regional Bifurcation
9.2.3.5.1.North America
9.2.3.5.1.1.Market Estimation, 2016 – 2023
9.2.3.5.1.2.Market Forecast, 2024 – 2034
9.2.3.5.2.Europe
9.2.3.5.2.1.Market Estimation, 2016 – 2023
9.2.3.5.2.2.Market Forecast, 2024 – 2034
9.2.3.5.3.Asia Pacific
9.2.3.5.3.1.Market Estimation, 2016 – 2023
9.2.3.5.3.2.Market Forecast, 2024 – 2034
9.2.3.5.4.Middle East and Africa
9.2.3.5.4.1.Market Estimation, 2016 – 2023
9.2.3.5.4.2.Market Forecast, 2024 – 2034
9.2.3.5.5.Latin America
9.2.3.5.5.1.Market Estimation, 2016 – 2023
9.2.3.5.5.2.Market Forecast, 2024 – 2034
9.2.4.Herbs and Medicinal Plants
9.2.4.1.Definition
9.2.4.2.Market Estimation and Penetration, 2016 – 2023
9.2.4.3.Market Forecast, 2024 – 2034
9.2.4.4.Compound Annual Growth Rate (CAGR)
9.2.4.5.Regional Bifurcation
9.2.4.5.1.North America
9.2.4.5.1.1.Market Estimation, 2016 – 2023
9.2.4.5.1.2.Market Forecast, 2024 – 2034
9.2.4.5.2.Europe
9.2.4.5.2.1.Market Estimation, 2016 – 2023
9.2.4.5.2.2.Market Forecast, 2024 – 2034
9.2.4.5.3.Asia Pacific
9.2.4.5.3.1.Market Estimation, 2016 – 2023
9.2.4.5.3.2.Market Forecast, 2024 – 2034
9.2.4.5.4.Middle East and Africa
9.2.4.5.4.1.Market Estimation, 2016 – 2023
9.2.4.5.4.2.Market Forecast, 2024 – 2034
9.2.4.5.5.Latin America
9.2.4.5.5.1.Market Estimation, 2016 – 2023
9.2.4.5.5.2.Market Forecast, 2024 – 2034
9.2.5.Others
9.2.5.1.Definition
9.2.5.2.Market Estimation and Penetration, 2016 – 2023
9.2.5.3.Market Forecast, 2024 – 2034
9.2.5.4.Compound Annual Growth Rate (CAGR)
9.2.5.5.Regional Bifurcation
9.2.5.5.1.North America
9.2.5.5.1.1.Market Estimation, 2016 – 2023
9.2.5.5.1.2.Market Forecast, 2024 – 2034
9.2.5.5.2.Europe
9.2.5.5.2.1.Market Estimation, 2016 – 2023
9.2.5.5.2.2.Market Forecast, 2024 – 2034
9.2.5.5.3.Asia Pacific
9.2.5.5.3.1.Market Estimation, 2016 – 2023
9.2.5.5.3.2.Market Forecast, 2024 – 2034
9.2.5.5.4.Middle East and Africa
9.2.5.5.4.1.Market Estimation, 2016 – 2023
9.2.5.5.4.2.Market Forecast, 2024 – 2034
9.2.5.5.5.Latin America
9.2.5.5.5.1.Market Estimation, 2016 – 2023
9.2.5.5.5.2.Market Forecast, 2024 – 2034
9.3.Key Segment for Channeling Investments
9.3.1.By Crop Type
10.Global Agrivoltaics Market Analysis and Forecasts, 2024 – 2034
10.1.Overview
10.2.Global Agrivoltaics Market Revenue (US$ Mn) and Forecasts, By Mounting Type
10.2.1.Roof Mounted
10.2.1.1.Definition
10.2.1.2.Market Estimation and Penetration, 2016 – 2023
10.2.1.3.Market Forecast, 2024 – 2034
10.2.1.4.Compound Annual Growth Rate (CAGR)
10.2.1.5.Regional Bifurcation
10.2.1.5.1.North America
10.2.1.5.1.1.Market Estimation, 2016 – 2023
10.2.1.5.1.2.Market Forecast, 2024 – 2034
10.2.1.5.2.Europe
10.2.1.5.2.1.Market Estimation, 2016 – 2023
10.2.1.5.2.2.Market Forecast, 2024 – 2034
10.2.1.5.3.Asia Pacific
10.2.1.5.3.1.Market Estimation, 2016 – 2023
10.2.1.5.3.2.Market Forecast, 2024 – 2034
10.2.1.5.4.Middle East and Africa
10.2.1.5.4.1.Market Estimation, 2016 – 2023
10.2.1.5.4.2.Market Forecast, 2024 – 2034
10.2.1.5.5.Latin America
10.2.1.5.5.1.Market Estimation, 2016 – 2023
10.2.1.5.5.2.Market Forecast, 2024 – 2034
10.2.2.Ground Mounted
10.2.2.1.Definition
10.2.2.2.Market Estimation and Penetration, 2016 – 2023
10.2.2.3.Market Forecast, 2024 – 2034
10.2.2.4.Compound Annual Growth Rate (CAGR)
10.2.2.5.Regional Bifurcation
10.2.2.5.1.North America
10.2.2.5.1.1.Market Estimation, 2016 – 2023
10.2.2.5.1.2.Market Forecast, 2024 – 2034
10.2.2.5.2.Europe
10.2.2.5.2.1.Market Estimation, 2016 – 2023
10.2.2.5.2.2.Market Forecast, 2024 – 2034
10.2.2.5.3.Asia Pacific
10.2.2.5.3.1.Market Estimation, 2016 – 2023
10.2.2.5.3.2.Market Forecast, 2024 – 2034
10.2.2.5.4.Middle East and Africa
10.2.2.5.4.1.Market Estimation, 2016 – 2023
10.2.2.5.4.2.Market Forecast, 2024 – 2034
10.2.2.5.5.Latin America
10.2.2.5.5.1.Market Estimation, 2016 – 2023
10.2.2.5.5.2.Market Forecast, 2024 – 2034
10.3.Key Segment for Channeling Investments
10.3.1.By Mounting Type
11.Global Agrivoltaics Market Analysis and Forecasts, 2024 – 2034
11.1.Overview
11.2.Global Agrivoltaics Market Revenue (US$ Mn) and Forecasts, By Application
11.2.1.Agriculture Farms
11.2.1.1.Definition
11.2.1.2.Market Estimation and Penetration, 2016 – 2023
11.2.1.3.Market Forecast, 2024 – 2034
11.2.1.4.Compound Annual Growth Rate (CAGR)
11.2.1.5.Regional Bifurcation
11.2.1.5.1.North America
11.2.1.5.1.1.Market Estimation, 2016 – 2023
11.2.1.5.1.2.Market Forecast, 2024 – 2034
11.2.1.5.2.Europe
11.2.1.5.2.1.Market Estimation, 2016 – 2023
11.2.1.5.2.2.Market Forecast, 2024 – 2034
11.2.1.5.3.Asia Pacific
11.2.1.5.3.1.Market Estimation, 2016 – 2023
11.2.1.5.3.2.Market Forecast, 2024 – 2034
11.2.1.5.4.Middle East and Africa
11.2.1.5.4.1.Market Estimation, 2016 – 2023
11.2.1.5.4.2.Market Forecast, 2024 – 2034
11.2.1.5.5.Latin America
11.2.1.5.5.1.Market Estimation, 2016 – 2023
11.2.1.5.5.2.Market Forecast, 2024 – 2034
11.2.2.Greenhouses
11.2.2.1.Definition
11.2.2.2.Market Estimation and Penetration, 2016 – 2023
11.2.2.3.Market Forecast, 2024 – 2034
11.2.2.4.Compound Annual Growth Rate (CAGR)
11.2.2.5.Regional Bifurcation
11.2.2.5.1.North America
11.2.2.5.1.1.Market Estimation, 2016 – 2023
11.2.2.5.1.2.Market Forecast, 2024 – 2034
11.2.2.5.2.Europe
11.2.2.5.2.1.Market Estimation, 2016 – 2023
11.2.2.5.2.2.Market Forecast, 2024 – 2034
11.2.2.5.3.Asia Pacific
11.2.2.5.3.1.Market Estimation, 2016 – 2023
11.2.2.5.3.2.Market Forecast, 2024 – 2034
11.2.2.5.4.Middle East and Africa
11.2.2.5.4.1.Market Estimation, 2016 – 2023
11.2.2.5.4.2.Market Forecast, 2024 – 2034
11.2.2.5.5.Latin America
11.2.2.5.5.1.Market Estimation, 2016 – 2023
11.2.2.5.5.2.Market Forecast, 2024 – 2034
11.2.3.Orchards
11.2.3.1.Definition
11.2.3.2.Market Estimation and Penetration, 2016 – 2023
11.2.3.3.Market Forecast, 2024 – 2034
11.2.3.4.Compound Annual Growth Rate (CAGR)
11.2.3.5.Regional Bifurcation
11.2.3.5.1.North America
11.2.3.5.1.1.Market Estimation, 2016 – 2023
11.2.3.5.1.2.Market Forecast, 2024 – 2034
11.2.3.5.2.Europe
11.2.3.5.2.1.Market Estimation, 2016 – 2023
11.2.3.5.2.2.Market Forecast, 2024 – 2034
11.2.3.5.3.Asia Pacific
11.2.3.5.3.1.Market Estimation, 2016 – 2023
11.2.3.5.3.2.Market Forecast, 2024 – 2034
11.2.3.5.4.Middle East and Africa
11.2.3.5.4.1.Market Estimation, 2016 – 2023
11.2.3.5.4.2.Market Forecast, 2024 – 2034
11.2.3.5.5.Latin America
11.2.3.5.5.1.Market Estimation, 2016 – 2023
11.2.3.5.5.2.Market Forecast, 2024 – 2034
11.2.4.Agroforestry
11.2.4.1.Definition
11.2.4.2.Market Estimation and Penetration, 2016 – 2023
11.2.4.3.Market Forecast, 2024 – 2034
11.2.4.4.Compound Annual Growth Rate (CAGR)
11.2.4.5.Regional Bifurcation
11.2.4.5.1.North America
11.2.4.5.1.1.Market Estimation, 2016 – 2023
11.2.4.5.1.2.Market Forecast, 2024 – 2034
11.2.4.5.2.Europe
11.2.4.5.2.1.Market Estimation, 2016 – 2023
11.2.4.5.2.2.Market Forecast, 2024 – 2034
11.2.4.5.3.Asia Pacific
11.2.4.5.3.1.Market Estimation, 2016 – 2023
11.2.4.5.3.2.Market Forecast, 2024 – 2034
11.2.4.5.4.Middle East and Africa
11.2.4.5.4.1.Market Estimation, 2016 – 2023
11.2.4.5.4.2.Market Forecast, 2024 – 2034
11.2.4.5.5.Latin America
11.2.4.5.5.1.Market Estimation, 2016 – 2023
11.2.4.5.5.2.Market Forecast, 2024 – 2034
11.2.5.Livestock Farms
11.2.5.1.Definition
11.2.5.2.Market Estimation and Penetration, 2016 – 2023
11.2.5.3.Market Forecast, 2024 – 2034
11.2.5.4.Compound Annual Growth Rate (CAGR)
11.2.5.5.Regional Bifurcation
11.2.5.5.1.North America
11.2.5.5.1.1.Market Estimation, 2016 – 2023
11.2.5.5.1.2.Market Forecast, 2024 – 2034
11.2.5.5.2.Europe
11.2.5.5.2.1.Market Estimation, 2016 – 2023
11.2.5.5.2.2.Market Forecast, 2024 – 2034
11.2.5.5.3.Asia Pacific
11.2.5.5.3.1.Market Estimation, 2016 – 2023
11.2.5.5.3.2.Market Forecast, 2024 – 2034
11.2.5.5.4.Middle East and Africa
11.2.5.5.4.1.Market Estimation, 2016 – 2023
11.2.5.5.4.2.Market Forecast, 2024 – 2034
11.2.5.5.5.Latin America
11.2.5.5.5.1.Market Estimation, 2016 – 2023
11.2.5.5.5.2.Market Forecast, 2024 – 2034
11.2.6.Others
11.2.6.1.Definition
11.2.6.2.Market Estimation and Penetration, 2016 – 2023
11.2.6.3.Market Forecast, 2024 – 2034
11.2.6.4.Compound Annual Growth Rate (CAGR)
11.2.6.5.Regional Bifurcation
11.2.6.5.1.North America
11.2.6.5.1.1.Market Estimation, 2016 – 2023
11.2.6.5.1.2.Market Forecast, 2024 – 2034
11.2.6.5.2.Europe
11.2.6.5.2.1.Market Estimation, 2016 – 2023
11.2.6.5.2.2.Market Forecast, 2024 – 2034
11.2.6.5.3.Asia Pacific
11.2.6.5.3.1.Market Estimation, 2016 – 2023
11.2.6.5.3.2.Market Forecast, 2024 – 2034
11.2.6.5.4.Middle East and Africa
11.2.6.5.4.1.Market Estimation, 2016 – 2023
11.2.6.5.4.2.Market Forecast, 2024 – 2034
11.2.6.5.5.Latin America
11.2.6.5.5.1.Market Estimation, 2016 – 2023
11.2.6.5.5.2.Market Forecast, 2024 – 2034
11.3.Key Segment for Channeling Investments
11.3.1.By Application
12.North America Agrivoltaics Market Analysis and Forecasts, 2024 – 2034
12.1.Overview
12.1.1.North America Agrivoltaics Market Revenue (US$ Mn)
12.2.North America Agrivoltaics Market Revenue (US$ Mn) and Forecasts, By System
12.2.1.Static
12.2.2.Dynamic
12.3.North America Agrivoltaics Market Revenue (US$ Mn) and Forecasts, By Crop Type
12.3.1.Fruits
12.3.2.Vegetables
12.3.3.Grains
12.3.4.Herbs and Medicinal Plants
12.3.5.Others
12.4.North America Agrivoltaics Market Revenue (US$ Mn) and Forecasts, By Mounting Type
12.4.1.Roof Mounted
12.4.2.Ground Mounted
12.5.North America Agrivoltaics Market Revenue (US$ Mn) and Forecasts, By Application
12.5.1.Agriculture Farms
12.5.2.Greenhouses
12.5.3.Orchards
12.5.4.Agroforestry
12.5.5.Livestock Farms
12.5.6.Others
12.6.North America Agrivoltaics Market Revenue (US$ Mn) and Forecasts, By Country
12.6.1.U.S
12.6.1.1.U.S Agrivoltaics Market Revenue (US$ Mn) and Forecasts, By System
12.6.1.1.1.Static
12.6.1.1.2.Dynamic
12.6.1.2.U.S Agrivoltaics Market Revenue (US$ Mn) and Forecasts, By Crop Type
12.6.1.2.1.Fruits
12.6.1.2.2.Vegetables
12.6.1.2.3.Grains
12.6.1.2.4.Herbs and Medicinal Plants
12.6.1.2.5.Others
12.6.1.3.U.S Agrivoltaics Market Revenue (US$ Mn) and Forecasts, By Mounting Type
12.6.1.3.1.Roof Mounted
12.6.1.3.2.Ground Mounted
12.6.1.4.U.S Agrivoltaics Market Revenue (US$ Mn) and Forecasts, By Application
12.6.1.4.1.Agriculture Farms
12.6.1.4.2.Greenhouses
12.6.1.4.3.Orchards
12.6.1.4.4.Agroforestry
12.6.1.4.5.Livestock Farms
12.6.1.4.6.Others
12.6.2.Canada
12.6.2.1.Canada Agrivoltaics Market Revenue (US$ Mn) and Forecasts, By System
12.6.2.1.1.Static
12.6.2.1.2.Dynamic
12.6.2.2.Canada Agrivoltaics Market Revenue (US$ Mn) and Forecasts, By Crop Type
12.6.2.2.1.Fruits
12.6.2.2.2.Vegetables
12.6.2.2.3.Grains
12.6.2.2.4.Herbs and Medicinal Plants
12.6.2.2.5.Others
12.6.2.3.Canada Agrivoltaics Market Revenue (US$ Mn) and Forecasts, By Mounting Type
12.6.2.3.1.Roof Mounted
12.6.2.3.2.Ground Mounted
12.6.2.4.Canada Agrivoltaics Market Revenue (US$ Mn) and Forecasts, By Application
12.6.2.4.1.Agriculture Farms
12.6.2.4.2.Greenhouses
12.6.2.4.3.Orchards
12.6.2.4.4.Agroforestry
12.6.2.4.5.Livestock Farms
12.6.2.4.6.Others
12.6.3.Mexico
12.6.3.1.Mexico Agrivoltaics Market Revenue (US$ Mn) and Forecasts, By System
12.6.3.1.1.Static
12.6.3.1.2.Dynamic
12.6.3.2.Mexico Agrivoltaics Market Revenue (US$ Mn) and Forecasts, By Crop Type
12.6.3.2.1.Fruits
12.6.3.2.2.Vegetables
12.6.3.2.3.Grains
12.6.3.2.4.Herbs and Medicinal Plants
12.6.3.2.5.Others
12.6.3.3.Mexico Agrivoltaics Market Revenue (US$ Mn) and Forecasts, By Mounting Type
12.6.3.3.1.Roof Mounted
12.6.3.3.2.Ground Mounted
12.6.3.4.Mexico Agrivoltaics Market Revenue (US$ Mn) and Forecasts, By Application
12.6.3.4.1.Agriculture Farms
12.6.3.4.2.Greenhouses
12.6.3.4.3.Orchards
12.6.3.4.4.Agroforestry
12.6.3.4.5.Livestock Farms
12.6.3.4.6.Others
12.6.4.Rest of North America
12.6.4.1.Rest of North America Agrivoltaics Market Revenue (US$ Mn) and Forecasts, By System
12.6.4.1.1.Static
12.6.4.1.2.Dynamic
12.6.4.2.Rest of North America Agrivoltaics Market Revenue (US$ Mn) and Forecasts, By Crop Type
12.6.4.2.1.Fruits
12.6.4.2.2.Vegetables
12.6.4.2.3.Grains
12.6.4.2.4.Herbs and Medicinal Plants
12.6.4.2.5.Others
12.6.4.3.Rest of North America Agrivoltaics Market Revenue (US$ Mn) and Forecasts, By Mounting Type
12.6.4.3.1.Roof Mounted
12.6.4.3.2.Ground Mounted
12.6.4.4.Rest of North America Agrivoltaics Market Revenue (US$ Mn) and Forecasts, By Application
12.6.4.4.1.Agriculture Farms
12.6.4.4.2.Greenhouses
12.6.4.4.3.Orchards
12.6.4.4.4.Agroforestry
12.6.4.4.5.Livestock Farms
12.6.4.4.6.Others
12.7.Key Segment for Channeling Investments
12.7.1.By Country
12.7.2.By System
12.7.3.By Crop Type
12.7.4.By Mounting Type
12.7.5.By Application
13.Europe Agrivoltaics Market Analysis and Forecasts, 2024 – 2034
13.1.Overview
13.1.1.Europe Agrivoltaics Market Revenue (US$ Mn)
13.2.Europe Agrivoltaics Market Revenue (US$ Mn) and Forecasts, By System
13.2.1.Static
13.2.2.Dynamic
13.3.Europe Agrivoltaics Market Revenue (US$ Mn) and Forecasts, By Crop Type
13.3.1.Fruits
13.3.2.Vegetables
13.3.3.Grains
13.3.4.Herbs and Medicinal Plants
13.3.5.Others
13.4.Europe Agrivoltaics Market Revenue (US$ Mn) and Forecasts, By Mounting Type
13.4.1.Roof Mounted
13.4.2.Ground Mounted
13.5.Europe Agrivoltaics Market Revenue (US$ Mn) and Forecasts, By Application
13.5.1.Agriculture Farms
13.5.2.Greenhouses
13.5.3.Orchards
13.5.4.Agroforestry
13.5.5.Livestock Farms
13.5.6.Others
13.6.Europe Agrivoltaics Market Revenue (US$ Mn) and Forecasts, By Country
13.6.1.France
13.6.1.1.France Agrivoltaics Market Revenue (US$ Mn) and Forecasts, By System
13.6.1.1.1.Static
13.6.1.1.2.Dynamic
13.6.1.2.France Agrivoltaics Market Revenue (US$ Mn) and Forecasts, By Crop Type
13.6.1.2.1.Fruits
13.6.1.2.2.Vegetables
13.6.1.2.3.Grains
13.6.1.2.4.Herbs and Medicinal Plants
13.6.1.2.5.Others
13.6.1.3.France Agrivoltaics Market Revenue (US$ Mn) and Forecasts, By Mounting Type
13.6.1.3.1.Roof Mounted
13.6.1.3.2.Ground Mounted
13.6.1.4.France Agrivoltaics Market Revenue (US$ Mn) and Forecasts, By Application
13.6.1.4.1.Agriculture Farms
13.6.1.4.2.Greenhouses
13.6.1.4.3.Orchards
13.6.1.4.4.Agroforestry
13.6.1.4.5.Livestock Farms
13.6.1.4.6.Others
13.6.2.The UK
13.6.2.1.The UK Agrivoltaics Market Revenue (US$ Mn) and Forecasts, By System
13.6.2.1.1.Static
13.6.2.1.2.Dynamic
13.6.2.2.The UK Agrivoltaics Market Revenue (US$ Mn) and Forecasts, By Crop Type
13.6.2.2.1.Fruits
13.6.2.2.2.Vegetables
13.6.2.2.3.Grains
13.6.2.2.4.Herbs and Medicinal Plants
13.6.2.2.5.Others
13.6.2.3.The UK Agrivoltaics Market Revenue (US$ Mn) and Forecasts, By Mounting Type
13.6.2.3.1.Roof Mounted
13.6.2.3.2.Ground Mounted
13.6.2.4.The UK Agrivoltaics Market Revenue (US$ Mn) and Forecasts, By Application
13.6.2.4.1.Agriculture Farms
13.6.2.4.2.Greenhouses
13.6.2.4.3.Orchards
13.6.2.4.4.Agroforestry
13.6.2.4.5.Livestock Farms
13.6.2.4.6.Others
13.6.3.Spain
13.6.3.1.Spain Agrivoltaics Market Revenue (US$ Mn) and Forecasts, By System
13.6.3.1.1.Static
13.6.3.1.2.Dynamic
13.6.3.2.Spain Agrivoltaics Market Revenue (US$ Mn) and Forecasts, By Crop Type
13.6.3.2.1.Fruits
13.6.3.2.2.Vegetables
13.6.3.2.3.Grains
13.6.3.2.4.Herbs and Medicinal Plants
13.6.3.2.5.Others
13.6.3.3.Spain Agrivoltaics Market Revenue (US$ Mn) and Forecasts, By Mounting Type
13.6.3.3.1.Roof Mounted
13.6.3.3.2.Ground Mounted
13.6.3.4.Spain Agrivoltaics Market Revenue (US$ Mn) and Forecasts, By Application
13.6.3.4.1.Agriculture Farms
13.6.3.4.2.Greenhouses
13.6.3.4.3.Orchards
13.6.3.4.4.Agroforestry
13.6.3.4.5.Livestock Farms
13.6.3.4.6.Others
13.6.4.Germany
13.6.4.1.Germany Agrivoltaics Market Revenue (US$ Mn) and Forecasts, By System
13.6.4.1.1.Static
13.6.4.1.2.Dynamic
13.6.4.2.Germany Agrivoltaics Market Revenue (US$ Mn) and Forecasts, By Crop Type
13.6.4.2.1.Fruits
13.6.4.2.2.Vegetables
13.6.4.2.3.Grains
13.6.4.2.4.Herbs and Medicinal Plants
13.6.4.2.5.Others
13.6.4.3.Germany Agrivoltaics Market Revenue (US$ Mn) and Forecasts, By Mounting Type
13.6.4.3.1.Roof Mounted
13.6.4.3.2.Ground Mounted
13.6.4.4.Germany Agrivoltaics Market Revenue (US$ Mn) and Forecasts, By Application
13.6.4.4.1.Agriculture Farms
13.6.4.4.2.Greenhouses
13.6.4.4.3.Orchards
13.6.4.4.4.Agroforestry
13.6.4.4.5.Livestock Farms
13.6.4.4.6.Others
13.6.5.Italy
13.6.5.1.Italy Agrivoltaics Market Revenue (US$ Mn) and Forecasts, By System
13.6.5.1.1.Static
13.6.5.1.2.Dynamic
13.6.5.2.Italy Agrivoltaics Market Revenue (US$ Mn) and Forecasts, By Crop Type
13.6.5.2.1.Fruits
13.6.5.2.2.Vegetables
13.6.5.2.3.Grains
13.6.5.2.4.Herbs and Medicinal Plants
13.6.5.2.5.Others
13.6.5.3.Italy Agrivoltaics Market Revenue (US$ Mn) and Forecasts, By Mounting Type
13.6.5.3.1.Roof Mounted
13.6.5.3.2.Ground Mounted
13.6.5.4.Italy Agrivoltaics Market Revenue (US$ Mn) and Forecasts, By Application
13.6.5.4.1.Agriculture Farms
13.6.5.4.2.Greenhouses
13.6.5.4.3.Orchards
13.6.5.4.4.Agroforestry
13.6.5.4.5.Livestock Farms
13.6.5.4.6.Others
13.6.6.Nordic Countries
13.6.6.1.Nordic Countries Agrivoltaics Market Revenue (US$ Mn) and Forecasts, By System
13.6.6.1.1.Static
13.6.6.1.2.Dynamic
13.6.6.2.Nordic Countries Agrivoltaics Market Revenue (US$ Mn) and Forecasts, By Crop Type
13.6.6.2.1.Fruits
13.6.6.2.2.Vegetables
13.6.6.2.3.Grains
13.6.6.2.4.Herbs and Medicinal Plants
13.6.6.2.5.Others
13.6.6.3.Nordic Countries Agrivoltaics Market Revenue (US$ Mn) and Forecasts, By Mounting Type
13.6.6.3.1.Roof Mounted
13.6.6.3.2.Ground Mounted
13.6.6.4.Nordic Countries Agrivoltaics Market Revenue (US$ Mn) and Forecasts, By Application
13.6.6.4.1.Agriculture Farms
13.6.6.4.2.Greenhouses
13.6.6.4.3.Orchards
13.6.6.4.4.Agroforestry
13.6.6.4.5.Livestock Farms
13.6.6.4.6.Others
13.6.6.5.Nordic Countries Agrivoltaics Market Revenue (US$ Mn) and Forecasts, By Country
13.6.6.5.1.Denmark
13.6.6.5.2.Finland
13.6.6.5.3.Iceland
13.6.6.5.4.Sweden
13.6.6.5.5.Norway
13.6.7.Benelux Union
13.6.7.1.Benelux Union Agrivoltaics Market Revenue (US$ Mn) and Forecasts, By System
13.6.7.1.1.Static
13.6.7.1.2.Dynamic
13.6.7.2.Benelux Union Agrivoltaics Market Revenue (US$ Mn) and Forecasts, By Crop Type
13.6.7.2.1.Fruits
13.6.7.2.2.Vegetables
13.6.7.2.3.Grains
13.6.7.2.4.Herbs and Medicinal Plants
13.6.7.2.5.Others
13.6.7.3.Benelux Union Agrivoltaics Market Revenue (US$ Mn) and Forecasts, By Mounting Type
13.6.7.3.1.Roof Mounted
13.6.7.3.2.Ground Mounted
13.6.7.4.Benelux Union Agrivoltaics Market Revenue (US$ Mn) and Forecasts, By Application
13.6.7.4.1.Agriculture Farms
13.6.7.4.2.Greenhouses
13.6.7.4.3.Orchards
13.6.7.4.4.Agroforestry
13.6.7.4.5.Livestock Farms
13.6.7.4.6.Others
13.6.7.5.Benelux Union Agrivoltaics Market Revenue (US$ Mn) and Forecasts, By Country
13.6.7.5.1.Belgium
13.6.7.5.2.The Netherlands
13.6.7.5.3.Luxembourg
13.6.8.Rest of Europe
13.6.8.1.Rest of Europe Agrivoltaics Market Revenue (US$ Mn) and Forecasts, By System
13.6.8.1.1.Static
13.6.8.1.2.Dynamic
13.6.8.2.Rest of Europe Agrivoltaics Market Revenue (US$ Mn) and Forecasts, By Crop Type
13.6.8.2.1.Fruits
13.6.8.2.2.Vegetables
13.6.8.2.3.Grains
13.6.8.2.4.Herbs and Medicinal Plants
13.6.8.2.5.Others
13.6.8.3.Rest of Europe Agrivoltaics Market Revenue (US$ Mn) and Forecasts, By Mounting Type
13.6.8.3.1.Roof Mounted
13.6.8.3.2.Ground Mounted
13.6.8.4.Rest of Europe Agrivoltaics Market Revenue (US$ Mn) and Forecasts, By Application
13.6.8.4.1.Agriculture Farms
13.6.8.4.2.Greenhouses
13.6.8.4.3.Orchards
13.6.8.4.4.Agroforestry
13.6.8.4.5.Livestock Farms
13.6.8.4.6.Others
13.7.Key Segment for Channeling Investments
13.7.1.By Country
13.7.2.By System
13.7.3.By Crop Type
13.7.4.By Mounting Type
13.7.5.By Application
14.Asia Pacific Agrivoltaics Market Analysis and Forecasts, 2024 – 2034
14.1.Overview
14.1.1.Asia Pacific Agrivoltaics Market Revenue (US$ Mn)
14.2.Asia Pacific Agrivoltaics Market Revenue (US$ Mn) and Forecasts, By System
14.2.1.Static
14.2.2.Dynamic
14.3.Asia Pacific Agrivoltaics Market Revenue (US$ Mn) and Forecasts, By Crop Type
14.3.1.Fruits
14.3.2.Vegetables
14.3.3.Grains
14.3.4.Herbs and Medicinal Plants
14.3.5.Others
14.4.Asia Pacific Agrivoltaics Market Revenue (US$ Mn) and Forecasts, By Mounting Type
14.4.1.Roof Mounted
14.4.2.Ground Mounted
14.5.Asia Pacific Agrivoltaics Market Revenue (US$ Mn) and Forecasts, By Application
14.5.1.Agriculture Farms
14.5.2.Greenhouses
14.5.3.Orchards
14.5.4.Agroforestry
14.5.5.Livestock Farms
14.5.6.Others
14.6.Asia Pacific Agrivoltaics Market Revenue (US$ Mn) and Forecasts, By Country
14.6.1.China
14.6.1.1.China Agrivoltaics Market Revenue (US$ Mn) and Forecasts, By System
14.6.1.1.1.Static
14.6.1.1.2.Dynamic
14.6.1.2.China Agrivoltaics Market Revenue (US$ Mn) and Forecasts, By Crop Type
14.6.1.2.1.Fruits
14.6.1.2.2.Vegetables
14.6.1.2.3.Grains
14.6.1.2.4.Herbs and Medicinal Plants
14.6.1.2.5.Others
14.6.1.3.China Agrivoltaics Market Revenue (US$ Mn) and Forecasts, By Mounting Type
14.6.1.3.1.Roof Mounted
14.6.1.3.2.Ground Mounted
14.6.1.4.China Agrivoltaics Market Revenue (US$ Mn) and Forecasts, By Application
14.6.1.4.1.Agriculture Farms
14.6.1.4.2.Greenhouses
14.6.1.4.3.Orchards
14.6.1.4.4.Agroforestry
14.6.1.4.5.Livestock Farms
14.6.1.4.6.Others
14.6.2.Japan
14.6.2.1.Japan Agrivoltaics Market Revenue (US$ Mn) and Forecasts, By System
14.6.2.1.1.Static
14.6.2.1.2.Dynamic
14.6.2.2.Japan Agrivoltaics Market Revenue (US$ Mn) and Forecasts, By Crop Type
14.6.2.2.1.Fruits
14.6.2.2.2.Vegetables
14.6.2.2.3.Grains
14.6.2.2.4.Herbs and Medicinal Plants
14.6.2.2.5.Others
14.6.2.3.Japan Agrivoltaics Market Revenue (US$ Mn) and Forecasts, By Mounting Type
14.6.2.3.1.Roof Mounted
14.6.2.3.2.Ground Mounted
14.6.2.4.Japan Agrivoltaics Market Revenue (US$ Mn) and Forecasts, By Application
14.6.2.4.1.Agriculture Farms
14.6.2.4.2.Greenhouses
14.6.2.4.3.Orchards
14.6.2.4.4.Agroforestry
14.6.2.4.5.Livestock Farms
14.6.2.4.6.Others
14.6.3.India
14.6.3.1.India Agrivoltaics Market Revenue (US$ Mn) and Forecasts, By System
14.6.3.1.1.Static
14.6.3.1.2.Dynamic
14.6.3.2.India Agrivoltaics Market Revenue (US$ Mn) and Forecasts, By Crop Type
14.6.3.2.1.Fruits
14.6.3.2.2.Vegetables
14.6.3.2.3.Grains
14.6.3.2.4.Herbs and Medicinal Plants
14.6.3.2.5.Others
14.6.3.3.India Agrivoltaics Market Revenue (US$ Mn) and Forecasts, By Mounting Type
14.6.3.3.1.Roof Mounted
14.6.3.3.2.Ground Mounted
14.6.3.4.India Agrivoltaics Market Revenue (US$ Mn) and Forecasts, By Application
14.6.3.4.1.Agriculture Farms
14.6.3.4.2.Greenhouses
14.6.3.4.3.Orchards
14.6.3.4.4.Agroforestry
14.6.3.4.5.Livestock Farms
14.6.3.4.6.Others
14.6.4.New Zealand
14.6.4.1.New Zealand Agrivoltaics Market Revenue (US$ Mn) and Forecasts, By System
14.6.4.1.1.Static
14.6.4.1.2.Dynamic
14.6.4.2.New Zealand Agrivoltaics Market Revenue (US$ Mn) and Forecasts, By Crop Type
14.6.4.2.1.Fruits
14.6.4.2.2.Vegetables
14.6.4.2.3.Grains
14.6.4.2.4.Herbs and Medicinal Plants
14.6.4.2.5.Others
14.6.4.3.New Zealand Agrivoltaics Market Revenue (US$ Mn) and Forecasts, By Mounting Type
14.6.4.3.1.Roof Mounted
14.6.4.3.2.Ground Mounted
14.6.4.4.New Zealand Agrivoltaics Market Revenue (US$ Mn) and Forecasts, By Application
14.6.4.4.1.Agriculture Farms
14.6.4.4.2.Greenhouses
14.6.4.4.3.Orchards
14.6.4.4.4.Agroforestry
14.6.4.4.5.Livestock Farms
14.6.4.4.6.Others
14.6.5.Australia
14.6.5.1.Australia Agrivoltaics Market Revenue (US$ Mn) and Forecasts, By System
14.6.5.1.1.Static
14.6.5.1.2.Dynamic
14.6.5.2.Australia Agrivoltaics Market Revenue (US$ Mn) and Forecasts, By Crop Type
14.6.5.2.1.Fruits
14.6.5.2.2.Vegetables
14.6.5.2.3.Grains
14.6.5.2.4.Herbs and Medicinal Plants
14.6.5.2.5.Others
14.6.5.3.Australia Agrivoltaics Market Revenue (US$ Mn) and Forecasts, By Mounting Type
14.6.5.3.1.Roof Mounted
14.6.5.3.2.Ground Mounted
14.6.5.4.Australia Agrivoltaics Market Revenue (US$ Mn) and Forecasts, By Application
14.6.5.4.1.Agriculture Farms
14.6.5.4.2.Greenhouses
14.6.5.4.3.Orchards
14.6.5.4.4.Agroforestry
14.6.5.4.5.Livestock Farms
14.6.5.4.6.Others
14.6.6.South Korea
14.6.6.1.South Korea Agrivoltaics Market Revenue (US$ Mn) and Forecasts, By System
14.6.6.1.1.Static
14.6.6.1.2.Dynamic
14.6.6.2.South Korea Agrivoltaics Market Revenue (US$ Mn) and Forecasts, By Crop Type
14.6.6.2.1.Fruits
14.6.6.2.2.Vegetables
14.6.6.2.3.Grains
14.6.6.2.4.Herbs and Medicinal Plants
14.6.6.2.5.Others
14.6.6.3.South Korea Agrivoltaics Market Revenue (US$ Mn) and Forecasts, By Mounting Type
14.6.6.3.1.Roof Mounted
14.6.6.3.2.Ground Mounted
14.6.6.4.South Korea Agrivoltaics Market Revenue (US$ Mn) and Forecasts, By Application
14.6.6.4.1.Agriculture Farms
14.6.6.4.2.Greenhouses
14.6.6.4.3.Orchards
14.6.6.4.4.Agroforestry
14.6.6.4.5.Livestock Farms
14.6.6.4.6.Others
14.6.7.Southeast Asia
14.6.7.1.Southeast Asia Agrivoltaics Market Revenue (US$ Mn) and Forecasts, By System
14.6.7.1.1.Static
14.6.7.1.2.Dynamic
14.6.7.2.Southeast Asia Agrivoltaics Market Revenue (US$ Mn) and Forecasts, By Crop Type
14.6.7.2.1.Fruits
14.6.7.2.2.Vegetables
14.6.7.2.3.Grains
14.6.7.2.4.Herbs and Medicinal Plants
14.6.7.2.5.Others
14.6.7.3.Southeast Asia Agrivoltaics Market Revenue (US$ Mn) and Forecasts, By Mounting Type
14.6.7.3.1.Roof Mounted
14.6.7.3.2.Ground Mounted
14.6.7.4.Southeast Asia Agrivoltaics Market Revenue (US$ Mn) and Forecasts, By Application
14.6.7.4.1.Agriculture Farms
14.6.7.4.2.Greenhouses
14.6.7.4.3.Orchards
14.6.7.4.4.Agroforestry
14.6.7.4.5.Livestock Farms
14.6.7.4.6.Others
14.6.7.5.Southeast Asia Agrivoltaics Market Revenue (US$ Mn) and Forecasts, By Country
14.6.7.5.1.Indonesia
14.6.7.5.2.Thailand
14.6.7.5.3.Malaysia
14.6.7.5.4.Singapore
14.6.7.5.5.Rest of Southeast Asia
14.6.8.Rest of Asia Pacific
14.6.8.1.Rest of Asia Pacific Agrivoltaics Market Revenue (US$ Mn) and Forecasts, By System
14.6.8.1.1.Static
14.6.8.1.2.Dynamic
14.6.8.2.Rest of Asia Pacific Agrivoltaics Market Revenue (US$ Mn) and Forecasts, By Crop Type
14.6.8.2.1.Fruits
14.6.8.2.2.Vegetables
14.6.8.2.3.Grains
14.6.8.2.4.Herbs and Medicinal Plants
14.6.8.2.5.Others
14.6.8.3.Rest of Asia Pacific Agrivoltaics Market Revenue (US$ Mn) and Forecasts, By Mounting Type
14.6.8.3.1.Roof Mounted
14.6.8.3.2.Ground Mounted
14.6.8.4.Rest of Asia Pacific Agrivoltaics Market Revenue (US$ Mn) and Forecasts, By Application
14.6.8.4.1.Agriculture Farms
14.6.8.4.2.Greenhouses
14.6.8.4.3.Orchards
14.6.8.4.4.Agroforestry
14.6.8.4.5.Livestock Farms
14.6.8.4.6.Others
14.7.Key Segment for Channeling Investments
14.7.1.By Country
14.7.2.By System
14.7.3.By Crop Type
14.7.4.By Mounting Type
14.7.5.By Application
15.Middle East and Africa Agrivoltaics Market Analysis and Forecasts, 2024 – 2034
15.1.Overview
15.1.1.Middle East and Africa Agrivoltaics Market Revenue (US$ Mn)
15.2.Middle East and Africa Agrivoltaics Market Revenue (US$ Mn) and Forecasts, By System
15.2.1.Static
15.2.2.Dynamic
15.3.Middle East and Africa Agrivoltaics Market Revenue (US$ Mn) and Forecasts, By Crop Type
15.3.1.Fruits
15.3.2.Vegetables
15.3.3.Grains
15.3.4.Herbs and Medicinal Plants
15.3.5.Others
15.4.Middle East and Africa Agrivoltaics Market Revenue (US$ Mn) and Forecasts, By Mounting Type
15.4.1.Roof Mounted
15.4.2.Ground Mounted
15.5.Middle East and Africa Agrivoltaics Market Revenue (US$ Mn) and Forecasts, By Application
15.5.1.Agriculture Farms
15.5.2.Greenhouses
15.5.3.Orchards
15.5.4.Agroforestry
15.5.5.Livestock Farms
15.5.6.Others
15.6.Middle East and Africa Agrivoltaics Market Revenue (US$ Mn) and Forecasts, By Country
15.6.1.Saudi Arabia
15.6.1.1.Saudi Arabia Agrivoltaics Market Revenue (US$ Mn) and Forecasts, By System
15.6.1.1.1.Static
15.6.1.1.2.Dynamic
15.6.1.2.Saudi Arabia Agrivoltaics Market Revenue (US$ Mn) and Forecasts, By Crop Type
15.6.1.2.1.Fruits
15.6.1.2.2.Vegetables
15.6.1.2.3.Grains
15.6.1.2.4.Herbs and Medicinal Plants
15.6.1.2.5.Others
15.6.1.3.Saudi Arabia Agrivoltaics Market Revenue (US$ Mn) and Forecasts, By Mounting Type
15.6.1.3.1.Roof Mounted
15.6.1.3.2.Ground Mounted
15.6.1.4.Saudi Arabia Agrivoltaics Market Revenue (US$ Mn) and Forecasts, By Application
15.6.1.4.1.Agriculture Farms
15.6.1.4.2.Greenhouses
15.6.1.4.3.Orchards
15.6.1.4.4.Agroforestry
15.6.1.4.5.Livestock Farms
15.6.1.4.6.Others
15.6.2.UAE
15.6.2.1.UAE Agrivoltaics Market Revenue (US$ Mn) and Forecasts, By System
15.6.2.1.1.Static
15.6.2.1.2.Dynamic
15.6.2.2.UAE Agrivoltaics Market Revenue (US$ Mn) and Forecasts, By Crop Type
15.6.2.2.1.Fruits
15.6.2.2.2.Vegetables
15.6.2.2.3.Grains
15.6.2.2.4.Herbs and Medicinal Plants
15.6.2.2.5.Others
15.6.2.3.UAE Agrivoltaics Market Revenue (US$ Mn) and Forecasts, By Mounting Type
15.6.2.3.1.Roof Mounted
15.6.2.3.2.Ground Mounted
15.6.2.4.UAE Agrivoltaics Market Revenue (US$ Mn) and Forecasts, By Application
15.6.2.4.1.Agriculture Farms
15.6.2.4.2.Greenhouses
15.6.2.4.3.Orchards
15.6.2.4.4.Agroforestry
15.6.2.4.5.Livestock Farms
15.6.2.4.6.Others
15.6.3.Egypt
15.6.3.1.Egypt Agrivoltaics Market Revenue (US$ Mn) and Forecasts, By System
15.6.3.1.1.Static
15.6.3.1.2.Dynamic
15.6.3.2.Egypt Agrivoltaics Market Revenue (US$ Mn) and Forecasts, By Crop Type
15.6.3.2.1.Fruits
15.6.3.2.2.Vegetables
15.6.3.2.3.Grains
15.6.3.2.4.Herbs and Medicinal Plants
15.6.3.2.5.Others
15.6.3.3.Egypt Agrivoltaics Market Revenue (US$ Mn) and Forecasts, By Mounting Type
15.6.3.3.1.Roof Mounted
15.6.3.3.2.Ground Mounted
15.6.3.4.Egypt Agrivoltaics Market Revenue (US$ Mn) and Forecasts, By Application
15.6.3.4.1.Agriculture Farms
15.6.3.4.2.Greenhouses
15.6.3.4.3.Orchards
15.6.3.4.4.Agroforestry
15.6.3.4.5.Livestock Farms
15.6.3.4.6.Others
15.6.4.Kuwait
15.6.4.1.Kuwait Agrivoltaics Market Revenue (US$ Mn) and Forecasts, By System
15.6.4.1.1.Static
15.6.4.1.2.Dynamic
15.6.4.2.Kuwait Agrivoltaics Market Revenue (US$ Mn) and Forecasts, By Crop Type
15.6.4.2.1.Fruits
15.6.4.2.2.Vegetables
15.6.4.2.3.Grains
15.6.4.2.4.Herbs and Medicinal Plants
15.6.4.2.5.Others
15.6.4.3.Kuwait Agrivoltaics Market Revenue (US$ Mn) and Forecasts, By Mounting Type
15.6.4.3.1.Roof Mounted
15.6.4.3.2.Ground Mounted
15.6.4.4.Kuwait Agrivoltaics Market Revenue (US$ Mn) and Forecasts, By Application
15.6.4.4.1.Agriculture Farms
15.6.4.4.2.Greenhouses
15.6.4.4.3.Orchards
15.6.4.4.4.Agroforestry
15.6.4.4.5.Livestock Farms
15.6.4.4.6.Others
15.6.5.South Africa
15.6.5.1.South Africa Agrivoltaics Market Revenue (US$ Mn) and Forecasts, By System
15.6.5.1.1.Static
15.6.5.1.2.Dynamic
15.6.5.2.South Africa Agrivoltaics Market Revenue (US$ Mn) and Forecasts, By Crop Type
15.6.5.2.1.Fruits
15.6.5.2.2.Vegetables
15.6.5.2.3.Grains
15.6.5.2.4.Herbs and Medicinal Plants
15.6.5.2.5.Others
15.6.5.3.South Africa Agrivoltaics Market Revenue (US$ Mn) and Forecasts, By Mounting Type
15.6.5.3.1.Roof Mounted
15.6.5.3.2.Ground Mounted
15.6.5.4.South Africa Agrivoltaics Market Revenue (US$ Mn) and Forecasts, By Application
15.6.5.4.1.Agriculture Farms
15.6.5.4.2.Greenhouses
15.6.5.4.3.Orchards
15.6.5.4.4.Agroforestry
15.6.5.4.5.Livestock Farms
15.6.5.4.6.Others
15.6.6.Rest of Middle East & Africa
15.6.6.1.Rest of Middle East & Africa Agrivoltaics Market Revenue (US$ Mn) and Forecasts, By System
15.6.6.1.1.Static
15.6.6.1.2.Dynamic
15.6.6.2.Rest of Middle East & Africa Agrivoltaics Market Revenue (US$ Mn) and Forecasts, By Crop Type
15.6.6.2.1.Fruits
15.6.6.2.2.Vegetables
15.6.6.2.3.Grains
15.6.6.2.4.Herbs and Medicinal Plants
15.6.6.2.5.Others
15.6.6.3.Rest of Middle East & Africa Agrivoltaics Market Revenue (US$ Mn) and Forecasts, By Mounting Type
15.6.6.3.1.Roof Mounted
15.6.6.3.2.Ground Mounted
15.6.6.4.Rest of Middle East & Africa Agrivoltaics Market Revenue (US$ Mn) and Forecasts, By Application
15.6.6.4.1.Agriculture Farms
15.6.6.4.2.Greenhouses
15.6.6.4.3.Orchards
15.6.6.4.4.Agroforestry
15.6.6.4.5.Livestock Farms
15.6.6.4.6.Others
15.7.Key Segment for Channeling Investments
15.7.1.By Country
15.7.2.By System
15.7.3.By Crop Type
15.7.4.By Mounting Type
15.7.5.By Application
16.Latin America Agrivoltaics Market Analysis and Forecasts, 2024 – 2034
16.1.Overview
16.1.1.Latin America Agrivoltaics Market Revenue (US$ Mn)
16.2.Latin America Agrivoltaics Market Revenue (US$ Mn) and Forecasts, By System
16.2.1.Static
16.2.2.Dynamic
16.3.Latin America Agrivoltaics Market Revenue (US$ Mn) and Forecasts, By Crop Type
16.3.1.Fruits
16.3.2.Vegetables
16.3.3.Grains
16.3.4.Herbs and Medicinal Plants
16.3.5.Others
16.4.Latin America Agrivoltaics Market Revenue (US$ Mn) and Forecasts, By Mounting Type
16.4.1.Roof Mounted
16.4.2.Ground Mounted
16.5.Latin America Agrivoltaics Market Revenue (US$ Mn) and Forecasts, By Application
16.5.1.Agriculture Farms
16.5.2.Greenhouses
16.5.3.Orchards
16.5.4.Agroforestry
16.5.5.Livestock Farms
16.5.6.Others
16.6.Latin America Agrivoltaics Market Revenue (US$ Mn) and Forecasts, By Country
16.6.1.Brazil
16.6.1.1.Brazil Agrivoltaics Market Revenue (US$ Mn) and Forecasts, By System
16.6.1.1.1.Static
16.6.1.1.2.Dynamic
16.6.1.2.Brazil Agrivoltaics Market Revenue (US$ Mn) and Forecasts, By Crop Type
16.6.1.2.1.Fruits
16.6.1.2.2.Vegetables
16.6.1.2.3.Grains
16.6.1.2.4.Herbs and Medicinal Plants
16.6.1.2.5.Others
16.6.1.3.Brazil Agrivoltaics Market Revenue (US$ Mn) and Forecasts, By Mounting Type
16.6.1.3.1.Roof Mounted
16.6.1.3.2.Ground Mounted
16.6.1.4.Brazil Agrivoltaics Market Revenue (US$ Mn) and Forecasts, By Application
16.6.1.4.1.Agriculture Farms
16.6.1.4.2.Greenhouses
16.6.1.4.3.Orchards
16.6.1.4.4.Agroforestry
16.6.1.4.5.Livestock Farms
16.6.1.4.6.Others
16.6.2.Argentina
16.6.2.1.Argentina Agrivoltaics Market Revenue (US$ Mn) and Forecasts, By System
16.6.2.1.1.Static
16.6.2.1.2.Dynamic
16.6.2.2.Argentina Agrivoltaics Market Revenue (US$ Mn) and Forecasts, By Crop Type
16.6.2.2.1.Fruits
16.6.2.2.2.Vegetables
16.6.2.2.3.Grains
16.6.2.2.4.Herbs and Medicinal Plants
16.6.2.2.5.Others
16.6.2.3.Argentina Agrivoltaics Market Revenue (US$ Mn) and Forecasts, By Mounting Type
16.6.2.3.1.Roof Mounted
16.6.2.3.2.Ground Mounted
16.6.2.4.Argentina Agrivoltaics Market Revenue (US$ Mn) and Forecasts, By Application
16.6.2.4.1.Agriculture Farms
16.6.2.4.2.Greenhouses
16.6.2.4.3.Orchards
16.6.2.4.4.Agroforestry
16.6.2.4.5.Livestock Farms
16.6.2.4.6.Others
16.6.3.Rest of Latin America
16.6.3.1.Rest of Latin America Agrivoltaics Market Revenue (US$ Mn) and Forecasts, By System
16.6.3.1.1.Static
16.6.3.1.2.Dynamic
16.6.3.2.Rest of Latin America Agrivoltaics Market Revenue (US$ Mn) and Forecasts, By Crop Type
16.6.3.2.1.Fruits
16.6.3.2.2.Vegetables
16.6.3.2.3.Grains
16.6.3.2.4.Herbs and Medicinal Plants
16.6.3.2.5.Others
16.6.3.3.Rest of Latin America Agrivoltaics Market Revenue (US$ Mn) and Forecasts, By Mounting Type
16.6.3.3.1.Roof Mounted
16.6.3.3.2.Ground Mounted
16.6.3.4.Rest of Latin America Agrivoltaics Market Revenue (US$ Mn) and Forecasts, By Application
16.6.3.4.1.Agriculture Farms
16.6.3.4.2.Greenhouses
16.6.3.4.3.Orchards
16.6.3.4.4.Agroforestry
16.6.3.4.5.Livestock Farms
16.6.3.4.6.Others
16.7.Key Segment for Channeling Investments
16.7.1.By Country
16.7.2.By System
16.7.3.By Crop Type
16.7.4.By Mounting Type
16.7.5.By Application
17.Competitive Benchmarking
17.1.Brand Benchmarking
17.2.Market Share Analysis, 2023
17.3.Global Presence and Growth Strategies
17.3.1.Mergers and Acquisitions
17.3.2.Product Launches
17.3.3.Investments Trends
17.3.4.R&D Initiatives
18.Player Profiles
18.1.Agrivoltaic Solution LLC
18.1.1.Company Details
18.1.2.Company Overview
18.1.3.Product Offerings
18.1.4.Key Developments
18.1.5.Financial Analysis
18.1.6.SWOT Analysis
18.1.7.Business Strategies
18.2.BayWa AG
18.2.1.Company Details
18.2.2.Company Overview
18.2.3.Product Offerings
18.2.4.Key Developments
18.2.5.Financial Analysis
18.2.6.SWOT Analysis
18.2.7.Business Strategies
18.3.Boralex
18.3.1.Company Details
18.3.2.Company Overview
18.3.3.Product Offerings
18.3.4.Key Developments
18.3.5.Financial Analysis
18.3.6.SWOT Analysis
18.3.7.Business Strategies
18.4.Enel Green Power
18.4.1.Company Details
18.4.2.Company Overview
18.4.3.Product Offerings
18.4.4.Key Developments
18.4.5.Financial Analysis
18.4.6.SWOT Analysis
18.4.7.Business Strategies
18.5.Mackin Energy
18.5.1.Company Details
18.5.2.Company Overview
18.5.3.Product Offerings
18.5.4.Key Developments
18.5.5.Financial Analysis
18.5.6.SWOT Analysis
18.5.7.Business Strategies
18.6.REM TEC
18.6.1.Company Details
18.6.2.Company Overview
18.6.3.Product Offerings
18.6.4.Key Developments
18.6.5.Financial Analysis
18.6.6.SWOT Analysis
18.6.7.Business Strategies
18.7.Sun Agri
18.7.1.Company Details
18.7.2.Company Overview
18.7.3.Product Offerings
18.7.4.Key Developments
18.7.5.Financial Analysis
18.7.6.SWOT Analysis
18.7.7.Business Strategies
18.8.Sunrise Power Solutions
18.8.1.Company Details
18.8.2.Company Overview
18.8.3.Product Offerings
18.8.4.Key Developments
18.8.5.Financial Analysis
18.8.6.SWOT Analysis
18.8.7.Business Strategies
18.9.Suntech Power Holdings
18.9.1.Company Details
18.9.2.Company Overview
18.9.3.Product Offerings
18.9.4.Key Developments
18.9.5.Financial Analysis
18.9.6.SWOT Analysis
18.9.7.Business Strategies
18.10.TotalEnergies SE
18.10.1.Company Details
18.10.2.Company Overview
18.10.3.Product Offerings
18.10.4.Key Developments
18.10.5.Financial Analysis
18.10.6.SWOT Analysis
18.10.7.Business Strategies
18.11.Other Industry Participants
19.Key Findings

.

Note: This ToC is tentative and can be changed according to the research study conducted during the course of report completion.

**Exclusive for Multi-User and Enterprise User.

Global Agrivoltaics Market

By System

  • Static
  • Dynamic

By Crop Type

  • Fruits
  • Vegetables
  • Grains
  • Herbs and Medicinal Plants
  • Others

By Mounting Type

  • Roof Mounted
  • Ground Mounted

By Application

  • Agriculture Farms
  • Greenhouses
  • Orchards
  • Agroforestry
  • Livestock Farms
  • Others

By Region

  • North America (U.S., Canada, Mexico, Rest of North America)
  • Europe (France, The UK, Spain, Germany, Italy, Nordic Countries (Denmark, Finland, Iceland, Sweden, Norway), Benelux Union (Belgium, The Netherlands, Luxembourg), Rest of Europe)
  • Asia Pacific (China, Japan, India, New Zealand, Australia, South Korea, Southeast Asia (Indonesia, Thailand, Malaysia, Singapore, Rest of Southeast Asia), Rest of Asia Pacific)
  • Middle East & Africa (Saudi Arabia, UAE, Egypt, Kuwait, South Africa, Rest of Middle East & Africa)
  • Latin America (Brazil, Argentina, Rest of Latin America)

The Niche Research approach encompasses both primary and secondary research methods to provide comprehensive insights. While primary research is the cornerstone of our studies, we also incorporate secondary research sources such as company annual reports, premium industry databases, press releases, industry journals, and white papers.

Within our primary research, we actively engage with various industry stakeholders, conducting paid interviews and surveys. Our meticulous analysis extends to every market participant in major countries, allowing us to thoroughly examine their portfolios, calculate market shares, and segment revenues.

Our data collection primarily focuses on individual countries within our research scope, enabling us to estimate regional market sizes. Typically, we employ a bottom-up approach, meticulously tracking trends in different countries. We analyze growth drivers, constraints, technological innovations, and opportunities for each country, ultimately arriving at regional figures.Our process begins by examining the growth prospects of each country. Building upon these insights, we project growth and trends for the entire region. Finally, we utilize our proprietary model to refine estimations and forecasts.

Our data validation standards are integral to ensuring the reliability and accuracy of our research findings. Here’s a breakdown of our data validation processes and the stakeholders we engage with during our primary research:

  • Supply Side Analysis: We initiate a supply side analysis by directly contacting market participants, through telephonic interviews and questionnaires containing both open-ended and close-ended questions. We gather information on their portfolios, segment revenues, developments, and growth strategies.
  • Demand Side Analysis: To gain insights into adoption trends and consumer preferences, we reach out to target customers and users (non-vendors). This information forms a vital part of the qualitative analysis section of our reports, covering market dynamics, adoption trends, consumer behavior, spending patterns, and other related aspects.
  • Consultant Insights: We tap into the expertise of our partner consultants from around the world to obtain their unique viewpoints and perspectives. Their insights contribute to a well-rounded understanding of the markets under investigation.
  • In-House Validation: To ensure data accuracy and reliability, we conduct cross-validation of data points and information through our in-house team of consultants and utilize advanced data modeling tools for thorough verification.

The forecasts we provide are based on a comprehensive assessment of various factors, including:

  • Market Trends and Past Performance (Last Five Years): We accurately analyze market trends and performance data from preceding five years to identify historical patterns and understand the market’s evolution.
  • Historical Performance and Growth of Market Participants: We assess the historical performance and growth trajectories of key market participants. This analysis provides insights into the competitive landscape and individual company strategies.
  • Market Determinants Impact Analysis (Next Eight Years): We conduct a rigorous analysis of the factors that are projected to influence the market over the next eight years. This includes assessing both internal and external determinants that can shape market dynamics.
  • Drivers and Challenges for the Forecast Period:Identify the factors expected to drive market growth during the forecast period, as well as the challenges that the industry may face. This analysis aids in deriving an accurate growth rate projection.
  • New Acquisitions, Collaborations, or Partnerships: We keep a close watch on any new acquisitions, collaborations, or partnerships within the industry. These developments can have a significant impact on market dynamics and competitiveness.
  • Macro and Micro Factors Analysis:A thorough examination of both macro-level factors (e.g., economic trends, regulatory changes) and micro-level factors (e.g., technological advancements, consumer preferences) that may influence the market during the forecast period.
  • End-User Sentiment Analysis: To understand the market from the end-user perspective, we conduct sentiment analysis. This involves assessing the sentiment, preferences, and feedback of the end-users, which can provide valuable insights into market trends.
  • Perspective of Primary Participants: Insights gathered directly from primary research participants play a crucial role in shaping our forecasts. Their perspectives and experiences provide valuable qualitative data.
  • Year-on-Year Growth Trend: We utilize a year-on-year growth trend based on historical market growth and expected future trends. This helps in formulating our growth projections, aligning them with the market’s historical performance.

Research process adopted by TNR involves multiple stages, including data collection, validation, quality checks, and presentation. It’s crucial that the data and information we provide add value to your existing market understanding and expertise. We have also established partnerships with business consulting, research, and survey organizations across regions and globally to collaborate on regional analysis and data validation, ensuring the highest level of accuracy and reliability in our reports.


Procure Comprehensive Study of

Global Agrivoltaics Market

Online Only

  • Online Access
  • Read Only File
  • Validity 3 Months
  • Print, Copy, Paste & Download
  • PPT, Excel
  • Cost-Free Report in the Next Update
$3300
Buy Now

Single User

  • Access to One User on One System
  • Read Only File
  • Validity 6 Months
  • Limited Print,Copy, Paste
  • PPT, Excel
  • Cost-Free Report in the Next Update
$4200
Buy Now

Multi User

  • Access to Fiver Users
  • PDF File
  • Validity 1 Year
  • Upto FivePrints
  • Cost-Free Report in the Next Update
  • PPT, Excel
$6000
Buy Now

Enterprise User

  • Access to Unlimited Users
  • PDF, PPT, Excel
  • Unlimited Validity, Prints&Downloads
  • 1 Hour Cost-Free & Dedicated Analyst Support
  • 10% Cost-Free Customization
  • Cost-Free Report Update Twice in a Year
  • Recommendations for Business Strategies
  • Authorization to Quote TNR, The Niche Research
$7300
Buy Now

Library Access

  • Online Access to Content Publications
  • Access Player Profiles Online
  • Get Immediate Access to Newly Added Content
  • Acquire 12 PDF Downloads
  • Acquire 5 Excel Data Sets
  • Gain Access to 290+ PDFs of Company Profiles
  • Round-the-clock Email and Phone Assistance
  • Dashboard Usage and Trends
  • Renewal & Upgrade Assistance
  • Assessing Customization Options and Alerts for New Reports
$10788
Buy Now
*Taxes/Fees, if applicable will be added during checkout. All prices in USD

Why TNR The Niche Research?

  • Unwavering Commitment to Excellence

  • Veteran Team of Researchers

  • Accurate and Timely Insights

  • Ethical Practices and Customized Service

  • Uninterrupted Availability Around the Clock

Scroll to Top