Global Sustainable Manufacturing Market By Offering, By Enterprise Size, By Industry Vertical, By Region & Segmental Insights Trends and Forecast, 2024 – 2034
- Industry: Construction & Manufacturing
- Report ID: TNR-110-1318
- Number of Pages: 420
- Table/Charts : Yes
- September, 2024
- Base Year : 2024
- No. of Companies : 10+
- No. of Countries : 29
- Views : 10019
- Covid Impact Covered: Yes
- War Impact Covered: Yes
- Formats : PDF, Excel, PPT
Sustainable manufacturing focuses on minimizing negative environmental impacts while conserving energy and resources. It is used across various industries like automotive, electronics, textiles, and food. For example, Ford Motor Company implemented energy-efficient processes in its Michigan assembly plant in 2020, reducing carbon emissions by 20%. In day-to-day life, sustainable manufacturing plays a crucial role by providing eco-friendly products. Unilever, in 2022, reduced plastic use in its packaging, promoting sustainable consumer goods. In electronics, Dell uses recycled materials for its computers, reducing electronic waste.
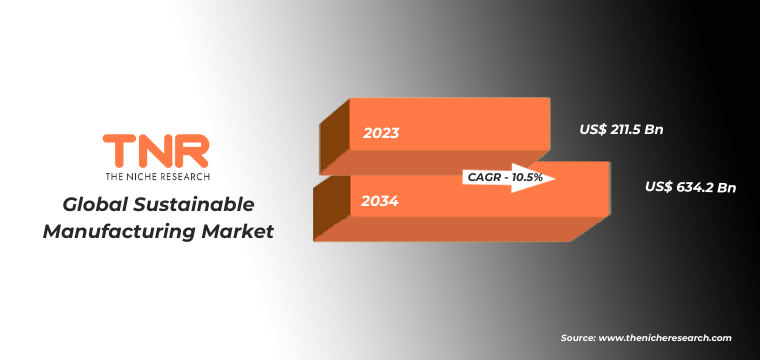
This approach is vital for environmental safety. It reduces waste, energy consumption, and emissions, helping combat climate change. For instance, Patagonia, a clothing brand, introduced recycled polyester in 2019, demonstrating the long-term benefits of sustainability for future generations. “In Terms of Revenue, the Global Sustainable Manufacturing Market Was Worth US$ 211.5 Bn in 2023, Anticipated to Witness a CAGR of 10.5% During 2024 – 2034”.
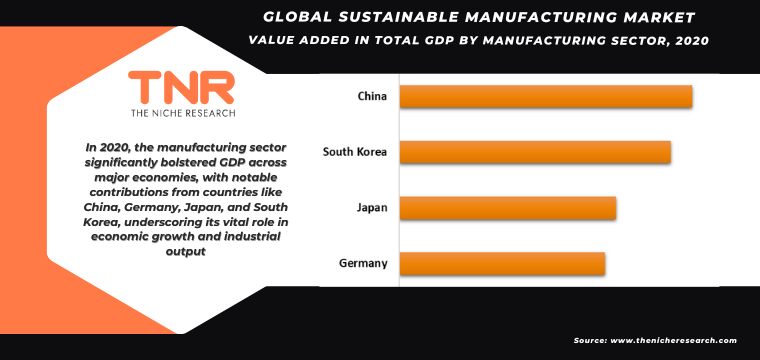
Value Added in Total GDP by Manufacturing Sector:
In 2020, the manufacturing sector significantly contributed to the GDP of key economies. Germany’s manufacturing sector added approximately €671 billion, driven by automotive and machinery industries. Japan contributed around ¥52 trillion, with strong performance in electronics and automotive manufacturing.
South Korea’s manufacturing value added reached ₩407 trillion, fueled by shipbuilding and technology. Meanwhile, China led with a staggering ¥31.2 trillion, reflecting its status as the world’s manufacturing powerhouse, particularly in electronics and textiles.
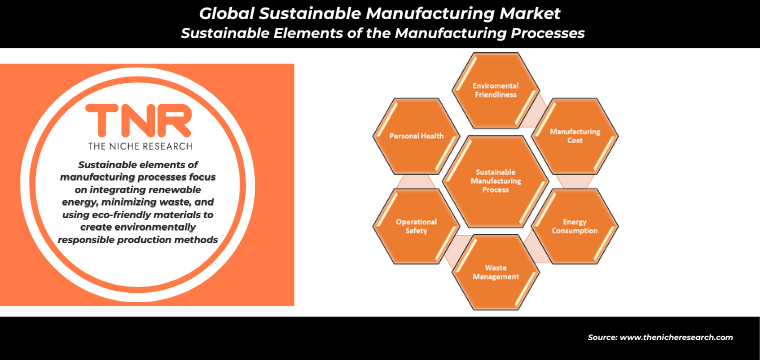
Sustainable Elements of the Manufacturing Processes:
Sustainable elements in manufacturing processes focus on reducing environmental impact and promoting resource efficiency. Key practices include using renewable energy sources, such as solar or wind power, to minimize carbon footprints. For example, IKEA transitioned to 100% renewable energy in its operations by 2020.
Additionally, implementing waste reduction strategies, like recycling and reusing materials, enhances sustainability; Ford has aimed to achieve zero waste to landfill in its manufacturing plants since 2021. Employing eco-friendly materials, such as biodegradable plastics, further supports sustainability; Coca-Cola has been integrating recycled content into its packaging since 2022. These elements collectively foster a more sustainable manufacturing landscape.
Global Sustainable Manufacturing Market Dynamics
Global Sustainable Manufacturing Market Growth Drivers:
- Rising Consumer Demand for Eco-friendly Products: The growing awareness of environmental issues has fueled consumer demand for sustainable products. For example, IKEA, in 2021, committed to using only renewable and recycled materials by 2030, driving the need for sustainable manufacturing practices to meet consumer preferences for greener goods.
- Stringent Environmental Regulations: Governments worldwide are implementing stricter regulations to reduce emissions and industrial waste. In 2020, the European Union’s Green Deal pushed industries to adopt sustainable manufacturing practices, emphasizing energy efficiency and reduced carbon footprints, further accelerating the market growth across multiple sectors, such as automotive and electronics.
Global Sustainable Manufacturing Market Restraints:
- High Initial Investment Costs: Implementing sustainable manufacturing requires significant upfront investment in energy-efficient technologies and eco-friendly materials. For example, in 2021, Tesla faced increased costs when upgrading its Gigafactory to use renewable energy, which can deter smaller companies from adopting sustainable practices quickly.
- Limited Access to Sustainable Materials: The availability of sustainable raw materials can be limited, especially in developing regions. In 2020, H&M encountered supply chain challenges when sourcing organic cotton, leading to delays in sustainable product launches, highlighting the difficulty in maintaining consistent access to eco-friendly resources globally.
Global Sustainable Manufacturing Market Opportunities:
- Technological Advancements in Green Manufacturing: Emerging technologies like 3D printing and automation provide opportunities to reduce waste and energy consumption. For instance, in 2022, Siemens introduced energy-efficient robotics in its factories, showcasing how innovations can revolutionize sustainable manufacturing and lower environmental impacts across industries.
- Growing Circular Economy Initiatives: The shift toward a circular economy encourages manufacturers to focus on recycling and reusing materials. In 2021, Adidas launched its “Made to be Remade” program, producing shoes designed for recycling, illustrating how businesses can capitalize on sustainability trends while reducing waste and resource depletion.
Global Sustainable Manufacturing Market Trends:
- Increased Adoption of Renewable Energy in Manufacturing: Manufacturers are increasingly integrating renewable energy into production processes. In 2021, Apple powered all its global facilities with 100% renewable energy, setting a trend for other companies to reduce carbon footprints and adopt clean energy sources for sustainable manufacturing.
- Rise of Green Certifications and Standards: Businesses are increasingly pursuing certifications like ISO 14001 and LEED to demonstrate sustainability efforts. For example, in 2020, Unilever achieved LEED Gold Certification for its New Jersey headquarters, reflecting the growing trend of aligning manufacturing processes with recognized environmental standards to appeal to eco-conscious consumers.
Global Sustainable Manufacturing Market Segmental Analysis:
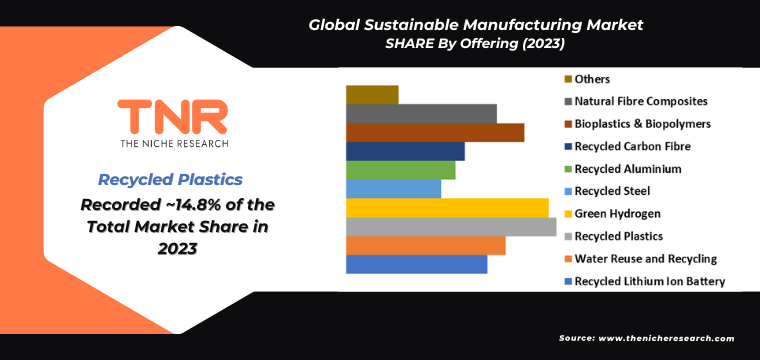
Sustainable Manufacturing Market By Offering
- Recycled Lithium Ion Battery
- Water Reuse and Recycling
- Recycled Plastics
- Green Hydrogen
- Recycled Steel
- Recycled Aluminium
- Recycled Carbon Fibre
- Bioplastics & Biopolymers
- Natural Fibre Composites
- Others
By offering, recycled plastics subjugated the global sustainable manufacturing market, capturing a revenue share of 14.8% in 2023. This growth was driven by industries prioritizing eco-friendly alternatives to traditional plastics. For instance, Coca-Cola, in 2022, launched bottles made from 100% recycled plastic across key markets, significantly reducing virgin plastic use. Similarly, PepsiCo announced its commitment to use 50% recycled content in plastic packaging by 2030. The automotive industry also embraced this trend, with Ford using recycled plastics in vehicle components like underbody shields. This shift not only reduces waste but also promotes the circular economy, addressing global concerns over plastic pollution.
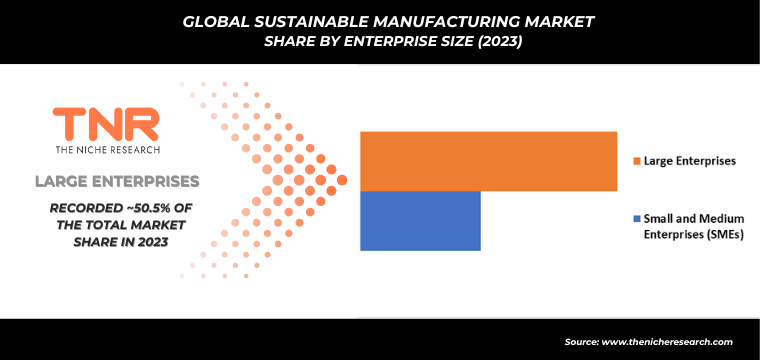
Sustainable Manufacturing Market By Enterprise Size
- Small and Medium Enterprises (SMEs)
- Large Enterprises
Small and medium enterprises (SMEs) segment is projected to be the fastest-growing segment in the global sustainable manufacturing market, capturing a notable revenue share of 49.5%. SMEs increasingly adopt eco-friendly practices to enhance competitiveness and meet consumer demands. For example, Allbirds, a small footwear company, gained prominence by using sustainable materials like merino wool and recycled plastic, achieving a low carbon footprint. Additionally, Oatly, a mid-sized Swedish oat milk company, scaled sustainably, reducing greenhouse gas emissions through innovative processing. These examples highlight how SMEs leverage sustainable manufacturing to drive growth while addressing environmental concerns and meeting global market trends.
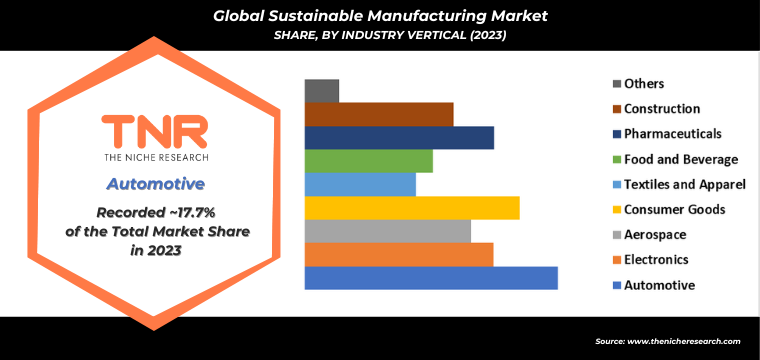
Sustainable Manufacturing Market By Industry Vertical
- Automotive
- Electronics
- Aerospace
- Consumer Goods
- Textiles and Apparel
- Food and Beverage
- Pharmaceuticals
- Construction
- Others
Automotive segment by industry vertical dominated the global sustainable manufacturing market in 2023, commanding a significant revenue share of 17.7%. The industry’s focus on reducing carbon emissions and embracing eco-friendly practices contributed to this growth. For example, Tesla led the way with its electric vehicles (EVs), utilizing renewable energy and recycled materials in production since 2021. Similarly, BMW committed to reducing CO2 emissions by 40% in its manufacturing by 2030, employing green technologies like energy-efficient machinery. Toyota also implemented circular economy practices, such as reusing parts from older models. These innovations reflect the automotive sector’s increasing investment in sustainable manufacturing processes.
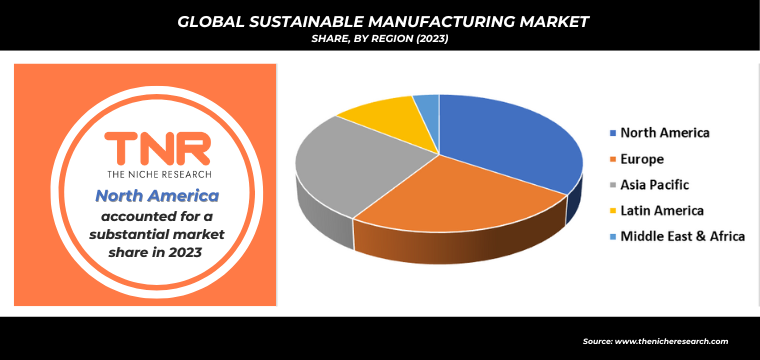
Sustainable Manufacturing Market By Region
- North America (U.S., Canada, Mexico, Rest of North America)
- Europe (France, The UK, Spain, Germany, Italy, Nordic Countries (Denmark, Finland, Iceland, Sweden, Norway), Benelux Union (Belgium, The Netherlands, Luxembourg), Rest of Europe)
- Asia Pacific (China, Japan, India, New Zealand, Australia, South Korea, Southeast Asia (Indonesia, Thailand, Malaysia, Singapore, Rest of Southeast Asia), Rest of Asia Pacific)
- Middle East & Africa (Saudi Arabia, UAE, Egypt, Kuwait, South Africa, Rest of Middle East & Africa)
- Latin America (Brazil, Argentina, Rest of Latin America)
Middle East & Africa is projected to be the fastest-growing region in the sustainable manufacturing market during the forecast period, driven by government initiatives and investments in renewable energy. For example, Saudi Arabia’s Vision 2030 promotes sustainability by reducing oil dependency and encouraging green manufacturing. In 2021, Masdar, a UAE-based company, launched a solar energy project to power manufacturing plants with renewable energy. Similarly, South Africa’s Green Economy Strategy focuses on eco-friendly industrial practices to lower carbon emissions. These efforts reflect the region’s growing commitment to sustainable manufacturing, attracting investments and fostering innovation in green technologies.
Competitive Landscape
The global sustainable manufacturing market is characterized by intense competition as key players innovate to enhance their eco-friendly practices. Companies like Siemens and General Electric are investing heavily in renewable energy technologies and energy-efficient manufacturing processes. For instance, in 2022, Siemens launched a sustainable factory initiative that integrates smart technologies to minimize waste and energy consumption.
Similarly, BASF has committed to achieving carbon neutrality by 2025, focusing on sustainable product development. Unilever also emphasizes sustainable sourcing, pledging that all its products will be made with renewable or recycled materials by 2025. This competitive landscape drives continuous improvements in sustainability, enabling companies to meet rising consumer demands and regulatory standards.
- In May 2024, Saltigo, a chemical manufacturer, launched its “Net Zero Custom Manufacturing” products, which focus on using sustainably sourced energy and eco-friendly raw materials.
- In April 2024, Veolia Huafei, a subsidiary of Veolia, partnered with L’Oreal Group to support multiple environmental goals, facilitating L’Oreal’s shift towards a circular economy for plastics.
- Also in April 2024, Cirba Solutions unveiled the “SustainABILITY 10,000” initiative. This program aims to engage communities across North America by dedicating 10,000 hours to promoting sustainable practices and educating residents on eco-friendly living, creating a strong network of environmental advocates.
Some of the players operating in the sustainable manufacturing market are
- ACCUREC-Recycling GmbH
- ArcelorMittal
- Berry Global Inc.
- Biffa
- Braskem
- Cirba Solutions
- Dow
- ECOBAT BATTERY
- European Metal Recycling Ltd.
- Indorama Ventures Public Company Limited
- Manufacturing Technology Centre
- NatureWorks LLC
- Novelis (Hindalco Industries Limited)
- Procotex
- Toshiba Energy Systems & Solutions Corporation
- Umicore
- UNIFI, Inc.
- Veolia
- Other Industry Participants
Global Sustainable Manufacturing Market Scope:
| Report Specifications | Details |
| Market Revenue in 2023 | US$ 211.5 Bn |
| Market Size Forecast by 2034 | US$ 634.2 Bn |
| Growth Rate (CAGR) | 10.5% |
| Historic Data | 2016 – 2022 |
| Base Year for Estimation | 2023 |
| Forecast Period | 2024 – 2034 |
| Report Inclusions | Market Size & Estimates, Market Dynamics, Competitive Scenario, Trends, Growth Factors, Market Determinants, Key Investment Segmentation, Product/Service/Solutions Benchmarking |
| Segments Covered | By Offering, By Enterprise Size, By Industry Vertical, By Region |
| Regions Covered | North America, Europe, Asia Pacific, Middle East & Africa, Latin America |
| Countries Covered | U.S., Canada, Mexico, Rest of North America, France, The UK, Spain, Germany, Italy, Nordic Countries (Denmark, Finland, Iceland, Sweden, Norway), Benelux Union (Belgium, The Netherlands, Luxembourg), Rest of Europe, China, Japan, India, New Zealand, Australia, South Korea, Southeast Asia (Indonesia, Thailand, Malaysia, Singapore, Rest of Southeast Asia), Rest of Asia Pacific, Saudi Arabia, UAE, Egypt, Kuwait, South Africa, Rest of Middle East & Africa, Brazil, Argentina, Rest of Latin America |
| Key Players | ACCUREC-Recycling GmbH, ArcelorMittal, Berry Global Inc., Biffa, Braskem, Cirba Solutions, Dow, ECOBAT BATTERY, European Metal Recycling Ltd., Indorama Ventures Public Company Limited, Manufacturing Technology Centre, NatureWorks LLC, Novelis (Hindalco Industries Limited), Procotex, Toshiba Energy Systems & Solutions Corporation, Umicore, UNIFI, Inc., Veolia |
| Customization Scope | Customization allows for the inclusion/modification of content pertaining to geographical regions, countries, and specific market segments. |
| Pricing & Procurement Options | Explore purchase options tailored to your specific research requirements |
| Contact Details | Consult With Our Expert
Japan (Toll-Free): +81 663-386-8111 South Korea (Toll-Free): +82-808- 703-126 Saudi Arabia (Toll-Free): +966 800-850-1643 United Kingdom: +44 753-710-5080 United States: +1 302-232-5106 E-mail: askanexpert@thenicheresearch.com
|
Report Layout:
Table of Contents
Note: This ToC is tentative and can be changed according to the research study conducted during the course of report completion.
**Exclusive for Multi-User and Enterprise User.
Global Sustainable Manufacturing Market:
By Offering
- Recycled Lithium Ion Battery
- Water Reuse and Recycling
- Recycled Plastics
- Green Hydrogen
- Recycled Steel
- Recycled Aluminium
- Recycled Carbon Fibre
- Bioplastics & Biopolymers
- Natural Fibre Composites
- Others
By Enterprise Size
- Small and Medium Enterprises (SMEs)
- Large Enterprises
By Industry Vertical
- Automotive
- Electronics
- Aerospace
- Consumer Goods
- Textiles and Apparel
- Food and Beverage
- Pharmaceuticals
- Construction
- Others
By Region
- North America
- S.
- Canada
- Mexico
- Rest of North America
- Europe
- France
- The UK
- Spain
- Germany
- Italy
- Nordic Countries
- Denmark
- Finland
- Iceland
- Sweden
- Norway
- Benelux Union
- Belgium
- The Netherlands
- Luxembourg
- Rest of Europe
- Asia Pacific
- China
- Japan
- India
- New Zealand
- Australia
- South Korea
- Southeast Asia
- Indonesia
- Thailand
- Malaysia
- Singapore
- Rest of Southeast Asia
- Rest of Asia Pacific
- Middle East & Africa
- Saudi Arabia
- UAE
- Egypt
- Kuwait
- South Africa
- Rest of Middle East & Africa
- Latin America
- Brazil
- Argentina
- Rest of Latin America
The Niche Research approach encompasses both primary and secondary research methods to provide comprehensive insights. While primary research is the cornerstone of our studies, we also incorporate secondary research sources such as company annual reports, premium industry databases, press releases, industry journals, and white papers.
Within our primary research, we actively engage with various industry stakeholders, conducting paid interviews and surveys. Our meticulous analysis extends to every market participant in major countries, allowing us to thoroughly examine their portfolios, calculate market shares, and segment revenues.
Our data collection primarily focuses on individual countries within our research scope, enabling us to estimate regional market sizes. Typically, we employ a bottom-up approach, meticulously tracking trends in different countries. We analyze growth drivers, constraints, technological innovations, and opportunities for each country, ultimately arriving at regional figures.Our process begins by examining the growth prospects of each country. Building upon these insights, we project growth and trends for the entire region. Finally, we utilize our proprietary model to refine estimations and forecasts.
Our data validation standards are integral to ensuring the reliability and accuracy of our research findings. Here’s a breakdown of our data validation processes and the stakeholders we engage with during our primary research:
- Supply Side Analysis: We initiate a supply side analysis by directly contacting market participants, through telephonic interviews and questionnaires containing both open-ended and close-ended questions. We gather information on their portfolios, segment revenues, developments, and growth strategies.
- Demand Side Analysis: To gain insights into adoption trends and consumer preferences, we reach out to target customers and users (non-vendors). This information forms a vital part of the qualitative analysis section of our reports, covering market dynamics, adoption trends, consumer behavior, spending patterns, and other related aspects.
- Consultant Insights: We tap into the expertise of our partner consultants from around the world to obtain their unique viewpoints and perspectives. Their insights contribute to a well-rounded understanding of the markets under investigation.
- In-House Validation: To ensure data accuracy and reliability, we conduct cross-validation of data points and information through our in-house team of consultants and utilize advanced data modeling tools for thorough verification.
The forecasts we provide are based on a comprehensive assessment of various factors, including:
- Market Trends and Past Performance (Last Five Years): We accurately analyze market trends and performance data from preceding five years to identify historical patterns and understand the market’s evolution.
- Historical Performance and Growth of Market Participants: We assess the historical performance and growth trajectories of key market participants. This analysis provides insights into the competitive landscape and individual company strategies.
- Market Determinants Impact Analysis (Next Eight Years): We conduct a rigorous analysis of the factors that are projected to influence the market over the next eight years. This includes assessing both internal and external determinants that can shape market dynamics.
- Drivers and Challenges for the Forecast Period:Identify the factors expected to drive market growth during the forecast period, as well as the challenges that the industry may face. This analysis aids in deriving an accurate growth rate projection.
- New Acquisitions, Collaborations, or Partnerships: We keep a close watch on any new acquisitions, collaborations, or partnerships within the industry. These developments can have a significant impact on market dynamics and competitiveness.
- Macro and Micro Factors Analysis:A thorough examination of both macro-level factors (e.g., economic trends, regulatory changes) and micro-level factors (e.g., technological advancements, consumer preferences) that may influence the market during the forecast period.
- End-User Sentiment Analysis: To understand the market from the end-user perspective, we conduct sentiment analysis. This involves assessing the sentiment, preferences, and feedback of the end-users, which can provide valuable insights into market trends.
- Perspective of Primary Participants: Insights gathered directly from primary research participants play a crucial role in shaping our forecasts. Their perspectives and experiences provide valuable qualitative data.
- Year-on-Year Growth Trend: We utilize a year-on-year growth trend based on historical market growth and expected future trends. This helps in formulating our growth projections, aligning them with the market’s historical performance.
Research process adopted by TNR involves multiple stages, including data collection, validation, quality checks, and presentation. It’s crucial that the data and information we provide add value to your existing market understanding and expertise. We have also established partnerships with business consulting, research, and survey organizations across regions and globally to collaborate on regional analysis and data validation, ensuring the highest level of accuracy and reliability in our reports.