Global High Fiber Snacks Market By Nature, By Product, By Distribution Channel By Region & Segmental Market Size & Forecast, 2015 – 2031, Trends & Competitive Landscape

  • Industry: Food & Beverages
  • Report ID: TNR-110-905
  • Number of Pages: 420
  • Table/Charts : Yes
  • October, 2023
  • Base Year : 2024
  • No. of Companies : 11+
  • No. of Countries : 29
  • Views : 10173
  • Covid Impact Covered: Yes
  • War Impact Covered: Yes
  • Formats : PDF, Excel, PPT

Global High Fiber Snacks Market Recorded Revenue Worth US$ 24.62 Billion in 2022, Growing at an Estimated CAGR of 9% During 2023 – 2031

High fiber snacks are food items designed to provide a significant amount of dietary fiber, a crucial component of a balanced diet. These snacks offer a convenient and tasty way to increase fiber intake, which promotes digestive health, aids weight management, and helps maintain steady blood sugar levels. High fiber snacks typically incorporate whole grains, fruits, vegetables, nuts, and seeds, all of which are rich in soluble and insoluble fibers.

Soluble fiber helps lower cholesterol and stabilizes blood sugar, while insoluble fiber supports regular bowel movements. Examples of high fiber snacks include whole grain crackers, trail mix with nuts and dried fruits, fresh fruit with skin, and vegetable sticks with hummus. Incorporating these snacks into one’s diet contributes to overall well-being by improving digestion and supporting various aspects of health.

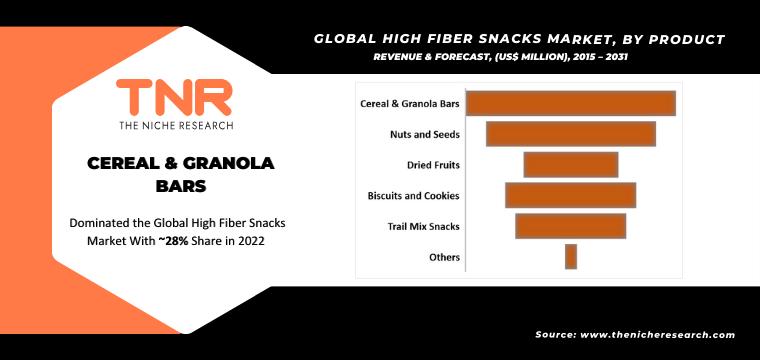
In the global high fiber snacks market, cereal and granola bars are dominating, while nuts and seeds are growing faster. Cereal and granola bars have gained prominence due to their convenience, portability, and perceived health benefits. A study published in the “Journal of Nutrition and Metabolism” highlighted the popularity of these bars as a quick source of dietary fiber. Major brands have invested in expanding their cereal and granola bar offerings, further solidifying their dominance.

COVID-19 Impact Analysis on Global High Fiber Snacks Market

Before the COVID-19 pandemic, the high fiber snacks market was already witnessing a rising trend in health-conscious consumer behavior. The demand for convenient yet nutritious snacks was growing steadily due to increasing awareness of the benefits of high-fiber diets. Cereal and granola bars, nuts and seeds, dried fruits, and other high-fiber options were gaining popularity among consumers seeking balanced eating habits.

The COVID-19 pandemic had a significant impact on the high fiber snacks market. As health and well-being took center stage, the demand for immune-boosting and wholesome snacks surged. Consumers’ focus on maintaining healthy diets and strengthening their immune systems led to increased interest in high-fiber snacks rich in nutrients. Cereal and granola bars, known for their convenience and satiety, saw sustained demand as people sought shelf-stable options.

Global High Fiber Snacks Market Revenue & Forecast, (US$ Million), 2015 – 2031

A significant driver of the high fiber snacks market is the increasing awareness of gut health. According to a study published in the “Frontiers in Nutrition” journal, there is a growing recognition of the role of dietary fiber in promoting a healthy gut microbiome. Consumers are seeking high-fiber snacks like nuts and seeds, which support digestive regularity and overall gut well-being. This trend is further fueled by health experts’ emphasis on the gut-brain connection and its impact on overall wellness, driving the demand for snacks that contribute to a balanced digestive system.

The limited shelf life and perishability of some high-fiber snacks can serve as a restraint in the market. Fresh options like fruits and vegetables, despite being rich in fiber, have shorter shelf lives, leading to concerns about spoilage and food waste. Consumers’ preference for longer-lasting snacks could hinder the adoption of these perishable choices. Moreover, certain high-fiber snacks, if not stored properly, can lose their nutritional value over time. These challenges pose a restraint to the market’s growth, as consumers may opt for less nutritious but more shelf-stable alternatives.

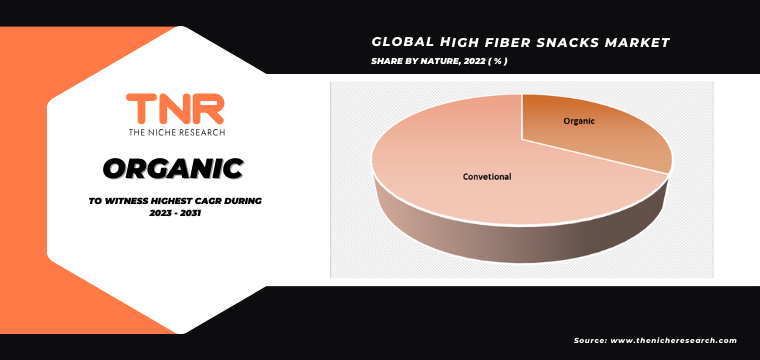
In the global high fiber snacks market, conventional snacks is a major revenue contributor in 2022, whereas organic is expected to gain tremendous prominence during 2023 – 2031. Organic snacks will gain prominence due to increasing consumer preferences for clean and natural food options. A study conducted by the Organic Trade Association reported a steady rise in organic food sales, indicating heightened demand for organic choices.

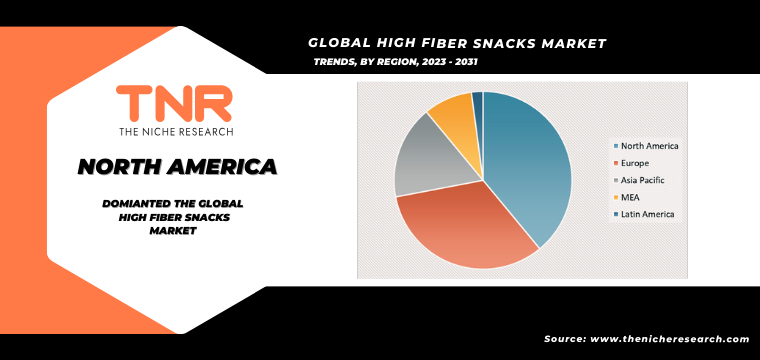
North America dominated the global high fiber snacks market in 2022. This prominence is rooted in a well-established health-conscious culture and a growing preference for dietary choices that prioritize fiber intake. Consumer trends reported by various industry sources reflect North American consumers’ increasing demand for high fiber snacks. The mature market, coupled with an extensive distribution network and a population focused on wellness, solidifies North America’s supremacy in the high fiber snacks sector.

Competitive Landscape

The report provides both, qualitative and quantitative research of global high fiber snacks market, as well as provides comprehensive insights and development methods adopted by the key contenders. The report also offers extensive research on the key players in this market and details on the competitiveness of these players. Key business strategies such as mergers and acquisitions (M&A), affiliations, collaborations, and contracts adopted by these major market participants are also recognized and analyzed in the report. For each company, the report studies their global presence, competitors, service offerings and specification amongst others.

A few of the key players operating in the global high fiber snacks market are

  • Ardent Mills
  • Bearded Brothers
  • BiteBox
  • Energy Bar Foods
  • Flowers Foods
  • General Mills Inc.
  • Grain Millers, Inc.
  • Hodgson Mill
  • Kellogg Co.
  • Mojo Snacks
  • Other Industry Participants


Global High Fiber Snacks Market Scope:


Report Specifications Details
Market Revenue in 2022 US$ 24.62 Billion
Market Size Forecast by 2031 US$ 56.25 Billion
Growth Rate (CAGR) 9%
Historic Data 2015 – 2021
Base Year for Estimation 2022
Forecast Period 2023 – 2031
Report Inclusions Market Size & Estimates, Market Dynamics, Competitive Scenario, Trends, Growth Factors, Market Determinants, Key Investment Segmentation, Product/Service/Solutions Benchmarking
Segments Covered By Nature, By Product, By Distribution Channel
Regions Covered North America, Europe, Asia Pacific, Middle East & Africa, Latin America
Countries Covered U.S., Canada, Mexico, Rest of North America,  France, The UK, Spain, Germany, Italy, Nordic Countries (Denmark, Finland, Iceland, Sweden, Norway), Benelux Union (Belgium, The Netherlands, Luxembourg), Rest of Europe,  China, Japan, India, New Zealand, Australia, South Korea, Southeast Asia (Indonesia, Thailand, Malaysia, Singapore, Rest of Southeast Asia), Rest of Asia Pacific,  Saudi Arabia, UAE, Egypt, Kuwait, South Africa, Rest of Middle East & Africa,  Brazil, Argentina, Rest of Latin America
Key Players Ardent Mills, Bearded Brothers, BiteBox, Energy Bar Foods, Flowers Foods, General Mills Inc., Grain Millers, Inc., Hodgson Mill, Kellogg Co., Mojo Snacks, Other Industry Participant
Customization Scope Customization allows for the inclusion/modification of content pertaining to geographical regions, countries, and specific market segments.
Pricing & Procurement Options Explore purchase options tailored to your specific research requirements
Contact Details Consult With Our Expert

Japan (Toll-Free): – +81 663-386-8111

South Korea (Toll-Free): – +82-808- 703-126

Saudi Arabia (Toll-Free): – +966 800 850 1643

United States: +1 302-232-5106

United Kingdom: +447537105080

E-mail:  askanexpert@thenicheresearch.com


Global High Fiber Snacks Market:

By Nature

  • Organic
  • Conventional

By Product

  • Cereal and Granola Bars
  • Nuts and Seeds
  • Dried Fruits
  • Biscuits and Cookies
  • Trail Mix Snacks
  • Others

By Distribution Channel

  • Supermarkets/Hypermarkets
  • Specialty Stores
  • Convenience Stores
  • Online Retailers
  • Others

By Region

  • North America (U.S., Canada, Mexico, Rest of North America)
  • Europe (France, The UK, Spain, Germany, Italy, Nordic Countries (Denmark, Finland, Iceland, Sweden, Norway), Benelux Union (Belgium, The Netherlands, Luxembourg), Rest of Europe)
  • Asia Pacific (China, Japan, India, New Zealand, Australia, South Korea, Southeast Asia (Indonesia, Thailand, Malaysia, Singapore, Rest of Southeast Asia), Rest of Asia Pacific)
  • Middle East & Africa (Saudi Arabia, UAE, Egypt, Kuwait, South Africa, Rest of Middle East & Africa)
  • Latin America (Brazil, Argentina, Rest of Latin America)

Global High Fiber Snacks Market Snapshot

Table of Contents

.

1.Market Scope
1.1.Market Segmentation
1.2.Years Considered
1.2.1.Historic Years: 2015 – 2021
1.2.2.Base Year: 2022
1.2.3.Forecast Years: 2023 – 2031
2.Key Target Audiences
3.Research Methodology
3.1.Primary Research
3.1.1.Research Questionnaire
3.1.2.Global Percentage Breakdown
3.1.3.Primary Interviews: Key Opinion Leaders (KOLs)
3.2.Secondary Research
3.2.1.Paid Databases
3.2.2.Secondary Sources
3.3.Market Size Estimates
3.3.1.Top-Down Approach
3.3.2.Bottom-Up Approach
3.4.Data Triangulation Methodology
3.5.Research Assumptions
4.Recommendations and Insights from TNR’s Perspective**
5.Holistic Overview of High Fiber Snacks Market
6.Market Synopsis: High Fiber Snacks Market
7.High Fiber Snacks Market Analysis: Qualitative Perspective
7.1.Introduction
7.1.1.Product Definition
7.1.2.Industry Development
7.2.Market Dynamics
7.2.1.Drivers
7.2.2.Restraints
7.2.3.Opportunities
7.2.4.Challenges
7.3.Trends in High Fiber Snacks Market
7.4.Market Determinants Radar Chart
7.5.Macro-Economic and Micro-Economic Indicators: High Fiber Snacks Market
7.6.Porter’s Five Force Analysis
7.7.Impact of Covid-19 on High Fiber Snacks Market
7.8.PESTEL Analysis
8.Global High Fiber Snacks Market Analysis and Forecasts, 2023 – 2031
8.1.Overview
8.1.1.Global High Fiber Snacks Market Revenue (US$ Mn)
8.2.Global High Fiber Snacks Market Revenue (US$ Mn) and Forecasts, By Nature
8.2.1.Organic
8.2.1.1.Definition
8.2.1.2.Market Estimation and Penetration, 2015 – 2022
8.2.1.3.Market Forecast, 2023 – 2031
8.2.1.4.Compound Annual Growth Rate (CAGR)
8.2.1.5.Regional Bifurcation
8.2.1.5.1.North America
8.2.1.5.1.1.Market Estimation, 2015 – 2022
8.2.1.5.1.2.Market Forecast, 2023 – 2031
8.2.1.5.2.Europe
8.2.1.5.2.1.Market Estimation, 2015 – 2022
8.2.1.5.2.2.Market Forecast, 2023 – 2031
8.2.1.5.3.Asia Pacific
8.2.1.5.3.1.Market Estimation, 2015 – 2022
8.2.1.5.3.2.Market Forecast, 2023 – 2031
8.2.1.5.4.Middle East and Africa
8.2.1.5.4.1.Market Estimation, 2015 – 2022
8.2.1.5.4.2.Market Forecast, 2023 – 2031
8.2.1.5.5.Latin America
8.2.1.5.5.1.Market Estimation, 2015 – 2022
8.2.1.5.5.2.Market Forecast, 2023 – 2031
8.2.2.Conventional
8.2.2.1.Definition
8.2.2.2.Market Estimation and Penetration, 2015 – 2022
8.2.2.3.Market Forecast, 2023 – 2031
8.2.2.4.Compound Annual Growth Rate (CAGR)
8.2.2.5.Regional Bifurcation
8.2.2.5.1.North America
8.2.2.5.1.1.Market Estimation, 2015 – 2022
8.2.2.5.1.2.Market Forecast, 2023 – 2031
8.2.2.5.2.Europe
8.2.2.5.2.1.Market Estimation, 2015 – 2022
8.2.2.5.2.2.Market Forecast, 2023 – 2031
8.2.2.5.3.Asia Pacific
8.2.2.5.3.1.Market Estimation, 2015 – 2022
8.2.2.5.3.2.Market Forecast, 2023 – 2031
8.2.2.5.4.Middle East and Africa
8.2.2.5.4.1.Market Estimation, 2015 – 2022
8.2.2.5.4.2.Market Forecast, 2023 – 2031
8.2.2.5.5.Latin America
8.2.2.5.5.1.Market Estimation, 2015 – 2022
8.2.2.5.5.2.Market Forecast, 2023 – 2031
8.3.Key Segment for Channeling Investments
8.3.1.By Nature
9.Global High Fiber Snacks Market Analysis and Forecasts, 2023 – 2031
9.1.Overview
9.2.Global High Fiber Snacks Market Revenue (US$ Mn) and Forecasts, By Product
9.2.1.Cereal and Granola Bars
9.2.1.1.Definition
9.2.1.2.Market Estimation and Penetration, 2015 – 2022
9.2.1.3.Market Forecast, 2023 – 2031
9.2.1.4.Compound Annual Growth Rate (CAGR)
9.2.1.5.Regional Bifurcation
9.2.1.5.1.North America
9.2.1.5.1.1.Market Estimation, 2015 – 2022
9.2.1.5.1.2.Market Forecast, 2023 – 2031
9.2.1.5.2.Europe
9.2.1.5.2.1.Market Estimation, 2015 – 2022
9.2.1.5.2.2.Market Forecast, 2023 – 2031
9.2.1.5.3.Asia Pacific
9.2.1.5.3.1.Market Estimation, 2015 – 2022
9.2.1.5.3.2.Market Forecast, 2023 – 2031
9.2.1.5.4.Middle East and Africa
9.2.1.5.4.1.Market Estimation, 2015 – 2022
9.2.1.5.4.2.Market Forecast, 2023 – 2031
9.2.1.5.5.Latin America
9.2.1.5.5.1.Market Estimation, 2015 – 2022
9.2.1.5.5.2.Market Forecast, 2023 – 2031
9.2.2.Nuts and Seeds
9.2.2.1.Definition
9.2.2.2.Market Estimation and Penetration, 2015 – 2022
9.2.2.3.Market Forecast, 2023 – 2031
9.2.2.4.Compound Annual Growth Rate (CAGR)
9.2.2.5.Regional Bifurcation
9.2.2.5.1.North America
9.2.2.5.1.1.Market Estimation, 2015 – 2022
9.2.2.5.1.2.Market Forecast, 2023 – 2031
9.2.2.5.2.Europe
9.2.2.5.2.1.Market Estimation, 2015 – 2022
9.2.2.5.2.2.Market Forecast, 2023 – 2031
9.2.2.5.3.Asia Pacific
9.2.2.5.3.1.Market Estimation, 2015 – 2022
9.2.2.5.3.2.Market Forecast, 2023 – 2031
9.2.2.5.4.Middle East and Africa
9.2.2.5.4.1.Market Estimation, 2015 – 2022
9.2.2.5.4.2.Market Forecast, 2023 – 2031
9.2.2.5.5.Latin America
9.2.2.5.5.1.Market Estimation, 2015 – 2022
9.2.2.5.5.2.Market Forecast, 2023 – 2031
9.2.3.Dried Fruits
9.2.3.1.Definition
9.2.3.2.Market Estimation and Penetration, 2015 – 2022
9.2.3.3.Market Forecast, 2023 – 2031
9.2.3.4.Compound Annual Growth Rate (CAGR)
9.2.3.5.Regional Bifurcation
9.2.3.5.1.North America
9.2.3.5.1.1.Market Estimation, 2015 – 2022
9.2.3.5.1.2.Market Forecast, 2023 – 2031
9.2.3.5.2.Europe
9.2.3.5.2.1.Market Estimation, 2015 – 2022
9.2.3.5.2.2.Market Forecast, 2023 – 2031
9.2.3.5.3.Asia Pacific
9.2.3.5.3.1.Market Estimation, 2015 – 2022
9.2.3.5.3.2.Market Forecast, 2023 – 2031
9.2.3.5.4.Middle East and Africa
9.2.3.5.4.1.Market Estimation, 2015 – 2022
9.2.3.5.4.2.Market Forecast, 2023 – 2031
9.2.3.5.5.Latin America
9.2.3.5.5.1.Market Estimation, 2015 – 2022
9.2.3.5.5.2.Market Forecast, 2023 – 2031
9.2.4.Biscuits and Cookies
9.2.4.1.Definition
9.2.4.2.Market Estimation and Penetration, 2015 – 2022
9.2.4.3.Market Forecast, 2023 – 2031
9.2.4.4.Compound Annual Growth Rate (CAGR)
9.2.4.5.Regional Bifurcation
9.2.4.5.1.North America
9.2.4.5.1.1.Market Estimation, 2015 – 2022
9.2.4.5.1.2.Market Forecast, 2023 – 2031
9.2.4.5.2.Europe
9.2.4.5.2.1.Market Estimation, 2015 – 2022
9.2.4.5.2.2.Market Forecast, 2023 – 2031
9.2.4.5.3.Asia Pacific
9.2.4.5.3.1.Market Estimation, 2015 – 2022
9.2.4.5.3.2.Market Forecast, 2023 – 2031
9.2.4.5.4.Middle East and Africa
9.2.4.5.4.1.Market Estimation, 2015 – 2022
9.2.4.5.4.2.Market Forecast, 2023 – 2031
9.2.4.5.5.Latin America
9.2.4.5.5.1.Market Estimation, 2015 – 2022
9.2.4.5.5.2.Market Forecast, 2023 – 2031
9.2.5.Trail Mix Snacks
9.2.5.1.Definition
9.2.5.2.Market Estimation and Penetration, 2015 – 2022
9.2.5.3.Market Forecast, 2023 – 2031
9.2.5.4.Compound Annual Growth Rate (CAGR)
9.2.5.5.Regional Bifurcation
9.2.5.5.1.North America
9.2.5.5.1.1.Market Estimation, 2015 – 2022
9.2.5.5.1.2.Market Forecast, 2023 – 2031
9.2.5.5.2.Europe
9.2.5.5.2.1.Market Estimation, 2015 – 2022
9.2.5.5.2.2.Market Forecast, 2023 – 2031
9.2.5.5.3.Asia Pacific
9.2.5.5.3.1.Market Estimation, 2015 – 2022
9.2.5.5.3.2.Market Forecast, 2023 – 2031
9.2.5.5.4.Middle East and Africa
9.2.5.5.4.1.Market Estimation, 2015 – 2022
9.2.5.5.4.2.Market Forecast, 2023 – 2031
9.2.5.5.5.Latin America
9.2.5.5.5.1.Market Estimation, 2015 – 2022
9.2.5.5.5.2.Market Forecast, 2023 – 2031
9.2.6.Others
9.2.6.1.Definition
9.2.6.2.Market Estimation and Penetration, 2015 – 2022
9.2.6.3.Market Forecast, 2023 – 2031
9.2.6.4.Compound Annual Growth Rate (CAGR)
9.2.6.5.Regional Bifurcation
9.2.6.5.1.North America
9.2.6.5.1.1.Market Estimation, 2015 – 2022
9.2.6.5.1.2.Market Forecast, 2023 – 2031
9.2.6.5.2.Europe
9.2.6.5.2.1.Market Estimation, 2015 – 2022
9.2.6.5.2.2.Market Forecast, 2023 – 2031
9.2.6.5.3.Asia Pacific
9.2.6.5.3.1.Market Estimation, 2015 – 2022
9.2.6.5.3.2.Market Forecast, 2023 – 2031
9.2.6.5.4.Middle East and Africa
9.2.6.5.4.1.Market Estimation, 2015 – 2022
9.2.6.5.4.2.Market Forecast, 2023 – 2031
9.2.6.5.5.Latin America
9.2.6.5.5.1.Market Estimation, 2015 – 2022
9.2.6.5.5.2.Market Forecast, 2023 – 2031
9.3.Key Segment for Channeling Investments
9.3.1.By Product
10.Global High Fiber Snacks Market Analysis and Forecasts, 2023 – 2031
10.1.Overview
10.2.Global High Fiber Snacks Market Revenue (US$ Mn) and Forecasts, By Distribution Channel
10.2.1.Supermarkets/Hypermarkets
10.2.1.1.Definition
10.2.1.2.Market Estimation and Penetration, 2015 – 2022
10.2.1.3.Market Forecast, 2023 – 2031
10.2.1.4.Compound Annual Growth Rate (CAGR)
10.2.1.5.Regional Bifurcation
10.2.1.5.1.North America
10.2.1.5.1.1.Market Estimation, 2015 – 2022
10.2.1.5.1.2.Market Forecast, 2023 – 2031
10.2.1.5.2.Europe
10.2.1.5.2.1.Market Estimation, 2015 – 2022
10.2.1.5.2.2.Market Forecast, 2023 – 2031
10.2.1.5.3.Asia Pacific
10.2.1.5.3.1.Market Estimation, 2015 – 2022
10.2.1.5.3.2.Market Forecast, 2023 – 2031
10.2.1.5.4.Middle East and Africa
10.2.1.5.4.1.Market Estimation, 2015 – 2022
10.2.1.5.4.2.Market Forecast, 2023 – 2031
10.2.1.5.5.Latin America
10.2.1.5.5.1.Market Estimation, 2015 – 2022
10.2.1.5.5.2.Market Forecast, 2023 – 2031
10.2.2.Specialty Stores
10.2.2.1.Definition
10.2.2.2.Market Estimation and Penetration, 2015 – 2022
10.2.2.3.Market Forecast, 2023 – 2031
10.2.2.4.Compound Annual Growth Rate (CAGR)
10.2.2.5.Regional Bifurcation
10.2.2.5.1.North America
10.2.2.5.1.1.Market Estimation, 2015 – 2022
10.2.2.5.1.2.Market Forecast, 2023 – 2031
10.2.2.5.2.Europe
10.2.2.5.2.1.Market Estimation, 2015 – 2022
10.2.2.5.2.2.Market Forecast, 2023 – 2031
10.2.2.5.3.Asia Pacific
10.2.2.5.3.1.Market Estimation, 2015 – 2022
10.2.2.5.3.2.Market Forecast, 2023 – 2031
10.2.2.5.4.Middle East and Africa
10.2.2.5.4.1.Market Estimation, 2015 – 2022
10.2.2.5.4.2.Market Forecast, 2023 – 2031
10.2.2.5.5.Latin America
10.2.2.5.5.1.Market Estimation, 2015 – 2022
10.2.2.5.5.2.Market Forecast, 2023 – 2031
10.2.3.Convenience Stores
10.2.3.1.Definition
10.2.3.2.Market Estimation and Penetration, 2015 – 2022
10.2.3.3.Market Forecast, 2023 – 2031
10.2.3.4.Compound Annual Growth Rate (CAGR)
10.2.3.5.Regional Bifurcation
10.2.3.5.1.North America
10.2.3.5.1.1.Market Estimation, 2015 – 2022
10.2.3.5.1.2.Market Forecast, 2023 – 2031
10.2.3.5.2.Europe
10.2.3.5.2.1.Market Estimation, 2015 – 2022
10.2.3.5.2.2.Market Forecast, 2023 – 2031
10.2.3.5.3.Asia Pacific
10.2.3.5.3.1.Market Estimation, 2015 – 2022
10.2.3.5.3.2.Market Forecast, 2023 – 2031
10.2.3.5.4.Middle East and Africa
10.2.3.5.4.1.Market Estimation, 2015 – 2022
10.2.3.5.4.2.Market Forecast, 2023 – 2031
10.2.3.5.5.Latin America
10.2.3.5.5.1.Market Estimation, 2015 – 2022
10.2.3.5.5.2.Market Forecast, 2023 – 2031
10.2.4.Online Retailers
10.2.4.1.Definition
10.2.4.2.Market Estimation and Penetration, 2015 – 2022
10.2.4.3.Market Forecast, 2023 – 2031
10.2.4.4.Compound Annual Growth Rate (CAGR)
10.2.4.5.Regional Bifurcation
10.2.4.5.1.North America
10.2.4.5.1.1.Market Estimation, 2015 – 2022
10.2.4.5.1.2.Market Forecast, 2023 – 2031
10.2.4.5.2.Europe
10.2.4.5.2.1.Market Estimation, 2015 – 2022
10.2.4.5.2.2.Market Forecast, 2023 – 2031
10.2.4.5.3.Asia Pacific
10.2.4.5.3.1.Market Estimation, 2015 – 2022
10.2.4.5.3.2.Market Forecast, 2023 – 2031
10.2.4.5.4.Middle East and Africa
10.2.4.5.4.1.Market Estimation, 2015 – 2022
10.2.4.5.4.2.Market Forecast, 2023 – 2031
10.2.4.5.5.Latin America
10.2.4.5.5.1.Market Estimation, 2015 – 2022
10.2.4.5.5.2.Market Forecast, 2023 – 2031
10.2.5.Others
10.2.5.1.Definition
10.2.5.2.Market Estimation and Penetration, 2015 – 2022
10.2.5.3.Market Forecast, 2023 – 2031
10.2.5.4.Compound Annual Growth Rate (CAGR)
10.2.5.5.Regional Bifurcation
10.2.5.5.1.North America
10.2.5.5.1.1.Market Estimation, 2015 – 2022
10.2.5.5.1.2.Market Forecast, 2023 – 2031
10.2.5.5.2.Europe
10.2.5.5.2.1.Market Estimation, 2015 – 2022
10.2.5.5.2.2.Market Forecast, 2023 – 2031
10.2.5.5.3.Asia Pacific
10.2.5.5.3.1.Market Estimation, 2015 – 2022
10.2.5.5.3.2.Market Forecast, 2023 – 2031
10.2.5.5.4.Middle East and Africa
10.2.5.5.4.1.Market Estimation, 2015 – 2022
10.2.5.5.4.2.Market Forecast, 2023 – 2031
10.2.5.5.5.Latin America
10.2.5.5.5.1.Market Estimation, 2015 – 2022
10.2.5.5.5.2.Market Forecast, 2023 – 2031
10.3.Key Segment for Channeling Investments
10.3.1.By Distribution Channel
11.North America High Fiber Snacks Market Analysis and Forecasts, 2023 – 2031
11.1.Overview
11.1.1.North America High Fiber Snacks Market Revenue (US$ Mn)
11.2.North America High Fiber Snacks Market Revenue (US$ Mn) and Forecasts, By Nature
11.2.1.Organic
11.2.2.Conventional
11.3.North America High Fiber Snacks Market Revenue (US$ Mn) and Forecasts, By Product
11.3.1.Cereal and Granola Bars
11.3.2.Nuts and Seeds
11.3.3.Dried Fruits
11.3.4.Biscuits and Cookies
11.3.5.Trail Mix Snacks
11.3.6.Others
11.4.North America High Fiber Snacks Market Revenue (US$ Mn) and Forecasts, By Distribution Channel
11.4.1.Supermarkets/Hypermarkets
11.4.2.Specialty Stores
11.4.3.Convenience Stores
11.4.4.Online Retailers
11.4.5.Others
11.5.North America High Fiber Snacks Market Revenue (US$ Mn) and Forecasts, By Country
11.5.1.U.S
11.5.1.1.U.S High Fiber Snacks Market Revenue (US$ Mn) and Forecasts, By Nature
11.5.1.1.1.Organic
11.5.1.1.2.Conventional
11.5.1.2.U.S High Fiber Snacks Market Revenue (US$ Mn) and Forecasts, By Product
11.5.1.2.1.Cereal and Granola Bars
11.5.1.2.2.Nuts and Seeds
11.5.1.2.3.Dried Fruits
11.5.1.2.4.Biscuits and Cookies
11.5.1.2.5.Trail Mix Snacks
11.5.1.2.6.Others
11.5.1.3.U.S High Fiber Snacks Market Revenue (US$ Mn) and Forecasts, By Distribution Channel
11.5.1.3.1.Supermarkets/Hypermarkets
11.5.1.3.2.Specialty Stores
11.5.1.3.3.Convenience Stores
11.5.1.3.4.Online Retailers
11.5.1.3.5.Others
11.5.2.Canada
11.5.2.1.Canada High Fiber Snacks Market Revenue (US$ Mn) and Forecasts, By Nature
11.5.2.1.1.Organic
11.5.2.1.2.Conventional
11.5.2.2.Canada High Fiber Snacks Market Revenue (US$ Mn) and Forecasts, By Product
11.5.2.2.1.Cereal and Granola Bars
11.5.2.2.2.Nuts and Seeds
11.5.2.2.3.Dried Fruits
11.5.2.2.4.Biscuits and Cookies
11.5.2.2.5.Trail Mix Snacks
11.5.2.2.6.Others
11.5.2.3.Canada High Fiber Snacks Market Revenue (US$ Mn) and Forecasts, By Distribution Channel
11.5.2.3.1.Supermarkets/Hypermarkets
11.5.2.3.2.Specialty Stores
11.5.2.3.3.Convenience Stores
11.5.2.3.4.Online Retailers
11.5.2.3.5.Others
11.5.3.Mexico
11.5.3.1.Mexico High Fiber Snacks Market Revenue (US$ Mn) and Forecasts, By Nature
11.5.3.1.1.Organic
11.5.3.1.2.Conventional
11.5.3.2.Mexico High Fiber Snacks Market Revenue (US$ Mn) and Forecasts, By Product
11.5.3.2.1.Cereal and Granola Bars
11.5.3.2.2.Nuts and Seeds
11.5.3.2.3.Dried Fruits
11.5.3.2.4.Biscuits and Cookies
11.5.3.2.5.Trail Mix Snacks
11.5.3.2.6.Others
11.5.3.3.Mexico High Fiber Snacks Market Revenue (US$ Mn) and Forecasts, By Distribution Channel
11.5.3.3.1.Supermarkets/Hypermarkets
11.5.3.3.2.Specialty Stores
11.5.3.3.3.Convenience Stores
11.5.3.3.4.Online Retailers
11.5.3.3.5.Others
11.5.4.Rest of North America
11.5.4.1.Rest of North America High Fiber Snacks Market Revenue (US$ Mn) and Forecasts, By Nature
11.5.4.1.1.Organic
11.5.4.1.2.Conventional
11.5.4.2.Rest of North America High Fiber Snacks Market Revenue (US$ Mn) and Forecasts, By Product
11.5.4.2.1.Cereal and Granola Bars
11.5.4.2.2.Nuts and Seeds
11.5.4.2.3.Dried Fruits
11.5.4.2.4.Biscuits and Cookies
11.5.4.2.5.Trail Mix Snacks
11.5.4.2.6.Others
11.5.4.3.Rest of North America High Fiber Snacks Market Revenue (US$ Mn) and Forecasts, By Distribution Channel
11.5.4.3.1.Supermarkets/Hypermarkets
11.5.4.3.2.Specialty Stores
11.5.4.3.3.Convenience Stores
11.5.4.3.4.Online Retailers
11.5.4.3.5.Others
11.6.Key Segment for Channeling Investments
11.6.1.By Country
11.6.2.By Nature
11.6.3.By Product
11.6.4.By Distribution Channel
12.Europe High Fiber Snacks Market Analysis and Forecasts, 2023 – 2031
12.1.Overview
12.1.1.Europe High Fiber Snacks Market Revenue (US$ Mn)
12.2.Europe High Fiber Snacks Market Revenue (US$ Mn) and Forecasts, By Nature
12.2.1.Organic
12.2.2.Conventional
12.3.Europe High Fiber Snacks Market Revenue (US$ Mn) and Forecasts, By Product
12.3.1.Cereal and Granola Bars
12.3.2.Nuts and Seeds
12.3.3.Dried Fruits
12.3.4.Biscuits and Cookies
12.3.5.Trail Mix Snacks
12.3.6.Others
12.4.Europe High Fiber Snacks Market Revenue (US$ Mn) and Forecasts, By Distribution Channel
12.4.1.Supermarkets/Hypermarkets
12.4.2.Specialty Stores
12.4.3.Convenience Stores
12.4.4.Online Retailers
12.4.5.Others
12.5.Europe High Fiber Snacks Market Revenue (US$ Mn) and Forecasts, By Country
12.5.1.France
12.5.1.1.France High Fiber Snacks Market Revenue (US$ Mn) and Forecasts, By Nature
12.5.1.1.1.Organic
12.5.1.1.2.Conventional
12.5.1.2.France High Fiber Snacks Market Revenue (US$ Mn) and Forecasts, By Product
12.5.1.2.1.Cereal and Granola Bars
12.5.1.2.2.Nuts and Seeds
12.5.1.2.3.Dried Fruits
12.5.1.2.4.Biscuits and Cookies
12.5.1.2.5.Trail Mix Snacks
12.5.1.2.6.Others
12.5.1.3.France High Fiber Snacks Market Revenue (US$ Mn) and Forecasts, By Distribution Channel
12.5.1.3.1.Supermarkets/Hypermarkets
12.5.1.3.2.Specialty Stores
12.5.1.3.3.Convenience Stores
12.5.1.3.4.Online Retailers
12.5.1.3.5.Others
12.5.2.The UK
12.5.2.1.The UK High Fiber Snacks Market Revenue (US$ Mn) and Forecasts, By Nature
12.5.2.1.1.Organic
12.5.2.1.2.Conventional
12.5.2.2.The UK High Fiber Snacks Market Revenue (US$ Mn) and Forecasts, By Product
12.5.2.2.1.Cereal and Granola Bars
12.5.2.2.2.Nuts and Seeds
12.5.2.2.3.Dried Fruits
12.5.2.2.4.Biscuits and Cookies
12.5.2.2.5.Trail Mix Snacks
12.5.2.2.6.Others
12.5.2.3.The UK High Fiber Snacks Market Revenue (US$ Mn) and Forecasts, By Distribution Channel
12.5.2.3.1.Supermarkets/Hypermarkets
12.5.2.3.2.Specialty Stores
12.5.2.3.3.Convenience Stores
12.5.2.3.4.Online Retailers
12.5.2.3.5.Others
12.5.3.Spain
12.5.3.1.Spain High Fiber Snacks Market Revenue (US$ Mn) and Forecasts, By Nature
12.5.3.1.1.Organic
12.5.3.1.2.Conventional
12.5.3.2.Spain High Fiber Snacks Market Revenue (US$ Mn) and Forecasts, By Product
12.5.3.2.1.Cereal and Granola Bars
12.5.3.2.2.Nuts and Seeds
12.5.3.2.3.Dried Fruits
12.5.3.2.4.Biscuits and Cookies
12.5.3.2.5.Trail Mix Snacks
12.5.3.2.6.Others
12.5.3.3.Spain High Fiber Snacks Market Revenue (US$ Mn) and Forecasts, By Distribution Channel
12.5.3.3.1.Supermarkets/Hypermarkets
12.5.3.3.2.Specialty Stores
12.5.3.3.3.Convenience Stores
12.5.3.3.4.Online Retailers
12.5.3.3.5.Others
12.5.4.Germany
12.5.4.1.Germany High Fiber Snacks Market Revenue (US$ Mn) and Forecasts, By Nature
12.5.4.1.1.Organic
12.5.4.1.2.Conventional
12.5.4.2.Germany High Fiber Snacks Market Revenue (US$ Mn) and Forecasts, By Product
12.5.4.2.1.Cereal and Granola Bars
12.5.4.2.2.Nuts and Seeds
12.5.4.2.3.Dried Fruits
12.5.4.2.4.Biscuits and Cookies
12.5.4.2.5.Trail Mix Snacks
12.5.4.2.6.Others
12.5.4.3.Germany High Fiber Snacks Market Revenue (US$ Mn) and Forecasts, By Distribution Channel
12.5.4.3.1.Supermarkets/Hypermarkets
12.5.4.3.2.Specialty Stores
12.5.4.3.3.Convenience Stores
12.5.4.3.4.Online Retailers
12.5.4.3.5.Others
12.5.5.Italy
12.5.5.1.Italy High Fiber Snacks Market Revenue (US$ Mn) and Forecasts, By Nature
12.5.5.1.1.Organic
12.5.5.1.2.Conventional
12.5.5.2.Italy High Fiber Snacks Market Revenue (US$ Mn) and Forecasts, By Product
12.5.5.2.1.Cereal and Granola Bars
12.5.5.2.2.Nuts and Seeds
12.5.5.2.3.Dried Fruits
12.5.5.2.4.Biscuits and Cookies
12.5.5.2.5.Trail Mix Snacks
12.5.5.2.6.Others
12.5.5.3.Italy High Fiber Snacks Market Revenue (US$ Mn) and Forecasts, By Distribution Channel
12.5.5.3.1.Supermarkets/Hypermarkets
12.5.5.3.2.Specialty Stores
12.5.5.3.3.Convenience Stores
12.5.5.3.4.Online Retailers
12.5.5.3.5.Others
12.5.6.Nordic Countries
12.5.6.1.Nordic Countries High Fiber Snacks Market Revenue (US$ Mn) and Forecasts, By Nature
12.5.6.1.1.Organic
12.5.6.1.2.Conventional
12.5.6.2.Nordic Countries High Fiber Snacks Market Revenue (US$ Mn) and Forecasts, By Product
12.5.6.2.1.Cereal and Granola Bars
12.5.6.2.2.Nuts and Seeds
12.5.6.2.3.Dried Fruits
12.5.6.2.4.Biscuits and Cookies
12.5.6.2.5.Trail Mix Snacks
12.5.6.2.6.Others
12.5.6.3.Nordic Countries High Fiber Snacks Market Revenue (US$ Mn) and Forecasts, By Distribution Channel
12.5.6.3.1.Supermarkets/Hypermarkets
12.5.6.3.2.Specialty Stores
12.5.6.3.3.Convenience Stores
12.5.6.3.4.Online Retailers
12.5.6.3.5.Others
12.5.6.4.Nordic Countries High Fiber Snacks Market Revenue (US$ Mn) and Forecasts, By Country
12.5.6.4.1.Denmark
12.5.6.4.2.Finland
12.5.6.4.3.Iceland
12.5.6.4.4.Sweden
12.5.6.4.5.Norway
12.5.7.Benelux Union
12.5.7.1.Benelux Union High Fiber Snacks Market Revenue (US$ Mn) and Forecasts, By Nature
12.5.7.1.1.Organic
12.5.7.1.2.Conventional
12.5.7.2.Benelux Union High Fiber Snacks Market Revenue (US$ Mn) and Forecasts, By Product
12.5.7.2.1.Cereal and Granola Bars
12.5.7.2.2.Nuts and Seeds
12.5.7.2.3.Dried Fruits
12.5.7.2.4.Biscuits and Cookies
12.5.7.2.5.Trail Mix Snacks
12.5.7.2.6.Others
12.5.7.3.Benelux Union High Fiber Snacks Market Revenue (US$ Mn) and Forecasts, By Distribution Channel
12.5.7.3.1.Supermarkets/Hypermarkets
12.5.7.3.2.Specialty Stores
12.5.7.3.3.Convenience Stores
12.5.7.3.4.Online Retailers
12.5.7.3.5.Others
12.5.7.4.Benelux Union High Fiber Snacks Market Revenue (US$ Mn) and Forecasts, By Country
12.5.7.4.1.Belgium
12.5.7.4.2.The Netherlands
12.5.7.4.3.Luxembourg
12.5.8.Rest of Europe
12.5.8.1.Rest of Europe High Fiber Snacks Market Revenue (US$ Mn) and Forecasts, By Nature
12.5.8.1.1.Organic
12.5.8.1.2.Conventional
12.5.8.2.Rest of Europe High Fiber Snacks Market Revenue (US$ Mn) and Forecasts, By Product
12.5.8.2.1.Cereal and Granola Bars
12.5.8.2.2.Nuts and Seeds
12.5.8.2.3.Dried Fruits
12.5.8.2.4.Biscuits and Cookies
12.5.8.2.5.Trail Mix Snacks
12.5.8.2.6.Others
12.5.8.3.Rest of Europe High Fiber Snacks Market Revenue (US$ Mn) and Forecasts, By Distribution Channel
12.5.8.3.1.Supermarkets/Hypermarkets
12.5.8.3.2.Specialty Stores
12.5.8.3.3.Convenience Stores
12.5.8.3.4.Online Retailers
12.5.8.3.5.Others
12.6.Key Segment for Channeling Investments
12.6.1.By Country
12.6.2.By Nature
12.6.3.By Product
12.6.4.By Distribution Channel
13.Asia Pacific High Fiber Snacks Market Analysis and Forecasts, 2023 – 2031
13.1.Overview
13.1.1.Asia Pacific High Fiber Snacks Market Revenue (US$ Mn)
13.2.Asia Pacific High Fiber Snacks Market Revenue (US$ Mn) and Forecasts, By Nature
13.2.1.Organic
13.2.2.Conventional
13.3.Asia Pacific High Fiber Snacks Market Revenue (US$ Mn) and Forecasts, By Product
13.3.1.Cereal and Granola Bars
13.3.2.Nuts and Seeds
13.3.3.Dried Fruits
13.3.4.Biscuits and Cookies
13.3.5.Trail Mix Snacks
13.3.6.Others
13.4.Asia Pacific High Fiber Snacks Market Revenue (US$ Mn) and Forecasts, By Distribution Channel
13.4.1.Supermarkets/Hypermarkets
13.4.2.Specialty Stores
13.4.3.Convenience Stores
13.4.4.Online Retailers
13.4.5.Others
13.5.Asia Pacific High Fiber Snacks Market Revenue (US$ Mn) and Forecasts, By Country
13.5.1.China
13.5.1.1.China High Fiber Snacks Market Revenue (US$ Mn) and Forecasts, By Nature
13.5.1.1.1.Organic
13.5.1.1.2.Conventional
13.5.1.2.China High Fiber Snacks Market Revenue (US$ Mn) and Forecasts, By Product
13.5.1.2.1.Cereal and Granola Bars
13.5.1.2.2.Nuts and Seeds
13.5.1.2.3.Dried Fruits
13.5.1.2.4.Biscuits and Cookies
13.5.1.2.5.Trail Mix Snacks
13.5.1.2.6.Others
13.5.1.3.China High Fiber Snacks Market Revenue (US$ Mn) and Forecasts, By Distribution Channel
13.5.1.3.1.Supermarkets/Hypermarkets
13.5.1.3.2.Specialty Stores
13.5.1.3.3.Convenience Stores
13.5.1.3.4.Online Retailers
13.5.1.3.5.Others
13.5.2.Japan
13.5.2.1.Japan High Fiber Snacks Market Revenue (US$ Mn) and Forecasts, By Nature
13.5.2.1.1.Organic
13.5.2.1.2.Conventional
13.5.2.2.Japan High Fiber Snacks Market Revenue (US$ Mn) and Forecasts, By Product
13.5.2.2.1.Cereal and Granola Bars
13.5.2.2.2.Nuts and Seeds
13.5.2.2.3.Dried Fruits
13.5.2.2.4.Biscuits and Cookies
13.5.2.2.5.Trail Mix Snacks
13.5.2.2.6.Others
13.5.2.3.Japan High Fiber Snacks Market Revenue (US$ Mn) and Forecasts, By Distribution Channel
13.5.2.3.1.Supermarkets/Hypermarkets
13.5.2.3.2.Specialty Stores
13.5.2.3.3.Convenience Stores
13.5.2.3.4.Online Retailers
13.5.2.3.5.Others
13.5.3.India
13.5.3.1.India High Fiber Snacks Market Revenue (US$ Mn) and Forecasts, By Nature
13.5.3.1.1.Organic
13.5.3.1.2.Conventional
13.5.3.2.India High Fiber Snacks Market Revenue (US$ Mn) and Forecasts, By Product
13.5.3.2.1.Cereal and Granola Bars
13.5.3.2.2.Nuts and Seeds
13.5.3.2.3.Dried Fruits
13.5.3.2.4.Biscuits and Cookies
13.5.3.2.5.Trail Mix Snacks
13.5.3.2.6.Others
13.5.3.3.India High Fiber Snacks Market Revenue (US$ Mn) and Forecasts, By Distribution Channel
13.5.3.3.1.Supermarkets/Hypermarkets
13.5.3.3.2.Specialty Stores
13.5.3.3.3.Convenience Stores
13.5.3.3.4.Online Retailers
13.5.3.3.5.Others
13.5.4.New Zealand
13.5.4.1.New Zealand High Fiber Snacks Market Revenue (US$ Mn) and Forecasts, By Nature
13.5.4.1.1.Organic
13.5.4.1.2.Conventional
13.5.4.2.New Zealand High Fiber Snacks Market Revenue (US$ Mn) and Forecasts, By Product
13.5.4.2.1.Cereal and Granola Bars
13.5.4.2.2.Nuts and Seeds
13.5.4.2.3.Dried Fruits
13.5.4.2.4.Biscuits and Cookies
13.5.4.2.5.Trail Mix Snacks
13.5.4.2.6.Others
13.5.4.3.New Zealand High Fiber Snacks Market Revenue (US$ Mn) and Forecasts, By Distribution Channel
13.5.4.3.1.Supermarkets/Hypermarkets
13.5.4.3.2.Specialty Stores
13.5.4.3.3.Convenience Stores
13.5.4.3.4.Online Retailers
13.5.4.3.5.Others
13.5.5.Australia
13.5.5.1.Australia High Fiber Snacks Market Revenue (US$ Mn) and Forecasts, By Nature
13.5.5.1.1.Organic
13.5.5.1.2.Conventional
13.5.5.2.Australia High Fiber Snacks Market Revenue (US$ Mn) and Forecasts, By Product
13.5.5.2.1.Cereal and Granola Bars
13.5.5.2.2.Nuts and Seeds
13.5.5.2.3.Dried Fruits
13.5.5.2.4.Biscuits and Cookies
13.5.5.2.5.Trail Mix Snacks
13.5.5.2.6.Others
13.5.5.3.Australia High Fiber Snacks Market Revenue (US$ Mn) and Forecasts, By Distribution Channel
13.5.5.3.1.Supermarkets/Hypermarkets
13.5.5.3.2.Specialty Stores
13.5.5.3.3.Convenience Stores
13.5.5.3.4.Online Retailers
13.5.5.3.5.Others
13.5.6.South Korea
13.5.6.1.South Korea High Fiber Snacks Market Revenue (US$ Mn) and Forecasts, By Nature
13.5.6.1.1.Organic
13.5.6.1.2.Conventional
13.5.6.2.South Korea High Fiber Snacks Market Revenue (US$ Mn) and Forecasts, By Product
13.5.6.2.1.Cereal and Granola Bars
13.5.6.2.2.Nuts and Seeds
13.5.6.2.3.Dried Fruits
13.5.6.2.4.Biscuits and Cookies
13.5.6.2.5.Trail Mix Snacks
13.5.6.2.6.Others
13.5.6.3.South Korea High Fiber Snacks Market Revenue (US$ Mn) and Forecasts, By Distribution Channel
13.5.6.3.1.Supermarkets/Hypermarkets
13.5.6.3.2.Specialty Stores
13.5.6.3.3.Convenience Stores
13.5.6.3.4.Online Retailers
13.5.6.3.5.Others
13.5.7.Southeast Asia
13.5.7.1.Southeast Asia High Fiber Snacks Market Revenue (US$ Mn) and Forecasts, By Nature
13.5.7.1.1.Organic
13.5.7.1.2.Conventional
13.5.7.2.Southeast Asia High Fiber Snacks Market Revenue (US$ Mn) and Forecasts, By Product
13.5.7.2.1.Cereal and Granola Bars
13.5.7.2.2.Nuts and Seeds
13.5.7.2.3.Dried Fruits
13.5.7.2.4.Biscuits and Cookies
13.5.7.2.5.Trail Mix Snacks
13.5.7.2.6.Others
13.5.7.3.Southeast Asia High Fiber Snacks Market Revenue (US$ Mn) and Forecasts, By Distribution Channel
13.5.7.3.1.Supermarkets/Hypermarkets
13.5.7.3.2.Specialty Stores
13.5.7.3.3.Convenience Stores
13.5.7.3.4.Online Retailers
13.5.7.3.5.Others
13.5.7.4.Southeast Asia High Fiber Snacks Market Revenue (US$ Mn) and Forecasts, By Country
13.5.7.4.1.Indonesia
13.5.7.4.2.Thailand
13.5.7.4.3.Malaysia
13.5.7.4.4.Singapore
13.5.7.4.5.Rest of Southeast Asia
13.5.8.Rest of Asia Pacific
13.5.8.1.Rest of Asia Pacific High Fiber Snacks Market Revenue (US$ Mn) and Forecasts, By Nature
13.5.8.1.1.Organic
13.5.8.1.2.Conventional
13.5.8.2.Rest of Asia Pacific High Fiber Snacks Market Revenue (US$ Mn) and Forecasts, By Product
13.5.8.2.1.Cereal and Granola Bars
13.5.8.2.2.Nuts and Seeds
13.5.8.2.3.Dried Fruits
13.5.8.2.4.Biscuits and Cookies
13.5.8.2.5.Trail Mix Snacks
13.5.8.2.6.Others
13.5.8.3.Rest of Asia Pacific High Fiber Snacks Market Revenue (US$ Mn) and Forecasts, By Distribution Channel
13.5.8.3.1.Supermarkets/Hypermarkets
13.5.8.3.2.Specialty Stores
13.5.8.3.3.Convenience Stores
13.5.8.3.4.Online Retailers
13.5.8.3.5.Others
13.6.Key Segment for Channeling Investments
13.6.1.By Country
13.6.2.By Nature
13.6.3.By Product
13.6.4.By Distribution Channel
14.Middle East and Africa High Fiber Snacks Market Analysis and Forecasts, 2023 – 2031
14.1.Overview
14.1.1.Middle East and Africa High Fiber Snacks Market Revenue (US$ Mn)
14.2.Middle East and Africa High Fiber Snacks Market Revenue (US$ Mn) and Forecasts, By Nature
14.2.1.Organic
14.2.2.Conventional
14.3.Middle East and Africa High Fiber Snacks Market Revenue (US$ Mn) and Forecasts, By Product
14.3.1.Cereal and Granola Bars
14.3.2.Nuts and Seeds
14.3.3.Dried Fruits
14.3.4.Biscuits and Cookies
14.3.5.Trail Mix Snacks
14.3.6.Others
14.4.Middle East and Africa High Fiber Snacks Market Revenue (US$ Mn) and Forecasts, By Distribution Channel
14.4.1.Supermarkets/Hypermarkets
14.4.2.Specialty Stores
14.4.3.Convenience Stores
14.4.4.Online Retailers
14.4.5.Others
14.5.Middle East and Africa High Fiber Snacks Market Revenue (US$ Mn) and Forecasts, By Country
14.5.1.Saudi Arabia
14.5.1.1.Saudi Arabia High Fiber Snacks Market Revenue (US$ Mn) and Forecasts, By Nature
14.5.1.1.1.Organic
14.5.1.1.2.Conventional
14.5.1.2.Saudi Arabia High Fiber Snacks Market Revenue (US$ Mn) and Forecasts, By Product
14.5.1.2.1.Cereal and Granola Bars
14.5.1.2.2.Nuts and Seeds
14.5.1.2.3.Dried Fruits
14.5.1.2.4.Biscuits and Cookies
14.5.1.2.5.Trail Mix Snacks
14.5.1.2.6.Others
14.5.1.3.Saudi Arabia High Fiber Snacks Market Revenue (US$ Mn) and Forecasts, By Distribution Channel
14.5.1.3.1.Supermarkets/Hypermarkets
14.5.1.3.2.Specialty Stores
14.5.1.3.3.Convenience Stores
14.5.1.3.4.Online Retailers
14.5.1.3.5.Others
14.5.2.UAE
14.5.2.1.UAE High Fiber Snacks Market Revenue (US$ Mn) and Forecasts, By Nature
14.5.2.1.1.Organic
14.5.2.1.2.Conventional
14.5.2.2.UAE High Fiber Snacks Market Revenue (US$ Mn) and Forecasts, By Product
14.5.2.2.1.Cereal and Granola Bars
14.5.2.2.2.Nuts and Seeds
14.5.2.2.3.Dried Fruits
14.5.2.2.4.Biscuits and Cookies
14.5.2.2.5.Trail Mix Snacks
14.5.2.2.6.Others
14.5.2.3.UAE High Fiber Snacks Market Revenue (US$ Mn) and Forecasts, By Distribution Channel
14.5.2.3.1.Supermarkets/Hypermarkets
14.5.2.3.2.Specialty Stores
14.5.2.3.3.Convenience Stores
14.5.2.3.4.Online Retailers
14.5.2.3.5.Others
14.5.3.Egypt
14.5.3.1.Egypt High Fiber Snacks Market Revenue (US$ Mn) and Forecasts, By Nature
14.5.3.1.1.Organic
14.5.3.1.2.Conventional
14.5.3.2.Egypt High Fiber Snacks Market Revenue (US$ Mn) and Forecasts, By Product
14.5.3.2.1.Cereal and Granola Bars
14.5.3.2.2.Nuts and Seeds
14.5.3.2.3.Dried Fruits
14.5.3.2.4.Biscuits and Cookies
14.5.3.2.5.Trail Mix Snacks
14.5.3.2.6.Others
14.5.3.3.Egypt High Fiber Snacks Market Revenue (US$ Mn) and Forecasts, By Distribution Channel
14.5.3.3.1.Supermarkets/Hypermarkets
14.5.3.3.2.Specialty Stores
14.5.3.3.3.Convenience Stores
14.5.3.3.4.Online Retailers
14.5.3.3.5.Others
14.5.4.Kuwait
14.5.4.1.Kuwait High Fiber Snacks Market Revenue (US$ Mn) and Forecasts, By Nature
14.5.4.1.1.Organic
14.5.4.1.2.Conventional
14.5.4.2.Kuwait High Fiber Snacks Market Revenue (US$ Mn) and Forecasts, By Product
14.5.4.2.1.Cereal and Granola Bars
14.5.4.2.2.Nuts and Seeds
14.5.4.2.3.Dried Fruits
14.5.4.2.4.Biscuits and Cookies
14.5.4.2.5.Trail Mix Snacks
14.5.4.2.6.Others
14.5.4.3.Kuwait High Fiber Snacks Market Revenue (US$ Mn) and Forecasts, By Distribution Channel
14.5.4.3.1.Supermarkets/Hypermarkets
14.5.4.3.2.Specialty Stores
14.5.4.3.3.Convenience Stores
14.5.4.3.4.Online Retailers
14.5.4.3.5.Others
14.5.5.South Africa
14.5.5.1.South Africa High Fiber Snacks Market Revenue (US$ Mn) and Forecasts, By Nature
14.5.5.1.1.Organic
14.5.5.1.2.Conventional
14.5.5.2.South Africa High Fiber Snacks Market Revenue (US$ Mn) and Forecasts, By Product
14.5.5.2.1.Cereal and Granola Bars
14.5.5.2.2.Nuts and Seeds
14.5.5.2.3.Dried Fruits
14.5.5.2.4.Biscuits and Cookies
14.5.5.2.5.Trail Mix Snacks
14.5.5.2.6.Others
14.5.5.3.South Africa High Fiber Snacks Market Revenue (US$ Mn) and Forecasts, By Distribution Channel
14.5.5.3.1.Supermarkets/Hypermarkets
14.5.5.3.2.Specialty Stores
14.5.5.3.3.Convenience Stores
14.5.5.3.4.Online Retailers
14.5.5.3.5.Others
14.5.6.Rest of Middle East & Africa
14.5.6.1.Rest of Middle East & Africa High Fiber Snacks Market Revenue (US$ Mn) and Forecasts, By Nature
14.5.6.1.1.Organic
14.5.6.1.2.Conventional
14.5.6.2.Rest of Middle East & Africa High Fiber Snacks Market Revenue (US$ Mn) and Forecasts, By Product
14.5.6.2.1.Cereal and Granola Bars
14.5.6.2.2.Nuts and Seeds
14.5.6.2.3.Dried Fruits
14.5.6.2.4.Biscuits and Cookies
14.5.6.2.5.Trail Mix Snacks
14.5.6.2.6.Others
14.5.6.3.Rest of Middle East & Africa High Fiber Snacks Market Revenue (US$ Mn) and Forecasts, By Distribution Channel
14.5.6.3.1.Supermarkets/Hypermarkets
14.5.6.3.2.Specialty Stores
14.5.6.3.3.Convenience Stores
14.5.6.3.4.Online Retailers
14.5.6.3.5.Others
14.6.Key Segment for Channeling Investments
14.6.1.By Country
14.6.2.By Nature
14.6.3.By Product
14.6.4.By Distribution Channel
15.Latin America High Fiber Snacks Market Analysis and Forecasts, 2023 – 2031
15.1.Overview
15.1.1.Latin America High Fiber Snacks Market Revenue (US$ Mn)
15.2.Latin America High Fiber Snacks Market Revenue (US$ Mn) and Forecasts, By Nature
15.2.1.Organic
15.2.2.Conventional
15.3.Latin America High Fiber Snacks Market Revenue (US$ Mn) and Forecasts, By Product
15.3.1.Cereal and Granola Bars
15.3.2.Nuts and Seeds
15.3.3.Dried Fruits
15.3.4.Biscuits and Cookies
15.3.5.Trail Mix Snacks
15.3.6.Others
15.4.Latin America High Fiber Snacks Market Revenue (US$ Mn) and Forecasts, By Distribution Channel
15.4.1.Supermarkets/Hypermarkets
15.4.2.Specialty Stores
15.4.3.Convenience Stores
15.4.4.Online Retailers
15.4.5.Others
15.5.Latin America High Fiber Snacks Market Revenue (US$ Mn) and Forecasts, By Country
15.5.1.Brazil
15.5.1.1.Brazil High Fiber Snacks Market Revenue (US$ Mn) and Forecasts, By Nature
15.5.1.1.1.Organic
15.5.1.1.2.Conventional
15.5.1.2.Brazil High Fiber Snacks Market Revenue (US$ Mn) and Forecasts, By Product
15.5.1.2.1.Cereal and Granola Bars
15.5.1.2.2.Nuts and Seeds
15.5.1.2.3.Dried Fruits
15.5.1.2.4.Biscuits and Cookies
15.5.1.2.5.Trail Mix Snacks
15.5.1.2.6.Others
15.5.1.3.Brazil High Fiber Snacks Market Revenue (US$ Mn) and Forecasts, By Distribution Channel
15.5.1.3.1.Supermarkets/Hypermarkets
15.5.1.3.2.Specialty Stores
15.5.1.3.3.Convenience Stores
15.5.1.3.4.Online Retailers
15.5.1.3.5.Others
15.5.2.Argentina
15.5.2.1.Argentina High Fiber Snacks Market Revenue (US$ Mn) and Forecasts, By Nature
15.5.2.1.1.Organic
15.5.2.1.2.Conventional
15.5.2.2.Argentina High Fiber Snacks Market Revenue (US$ Mn) and Forecasts, By Product
15.5.2.2.1.Cereal and Granola Bars
15.5.2.2.2.Nuts and Seeds
15.5.2.2.3.Dried Fruits
15.5.2.2.4.Biscuits and Cookies
15.5.2.2.5.Trail Mix Snacks
15.5.2.2.6.Others
15.5.2.3.Argentina High Fiber Snacks Market Revenue (US$ Mn) and Forecasts, By Distribution Channel
15.5.2.3.1.Supermarkets/Hypermarkets
15.5.2.3.2.Specialty Stores
15.5.2.3.3.Convenience Stores
15.5.2.3.4.Online Retailers
15.5.2.3.5.Others
15.5.3.Rest of Latin America
15.5.3.1.Rest of Latin America High Fiber Snacks Market Revenue (US$ Mn) and Forecasts, By Nature
15.5.3.1.1.Organic
15.5.3.1.2.Conventional
15.5.3.2.Rest of Latin America High Fiber Snacks Market Revenue (US$ Mn) and Forecasts, By Product
15.5.3.2.1.Cereal and Granola Bars
15.5.3.2.2.Nuts and Seeds
15.5.3.2.3.Dried Fruits
15.5.3.2.4.Biscuits and Cookies
15.5.3.2.5.Trail Mix Snacks
15.5.3.2.6.Others
15.5.3.3.Rest of Latin America High Fiber Snacks Market Revenue (US$ Mn) and Forecasts, By Distribution Channel
15.5.3.3.1.Supermarkets/Hypermarkets
15.5.3.3.2.Specialty Stores
15.5.3.3.3.Convenience Stores
15.5.3.3.4.Online Retailers
15.5.3.3.5.Others
15.6.Key Segment for Channeling Investments
15.6.1.By Country
15.6.2.By Nature
15.6.3.By Product
15.6.4.By Distribution Channel
16.Competitive Benchmarking
16.1.Brand Benchmarking
16.2.Market Share Analysis, 2022
16.3.Global Presence and Growth Strategies
16.3.1.Mergers and Acquisitions
16.3.2.Product Launches
16.3.3.Investments Trends
16.3.4.R&D Initiatives
17.Player Profiles
17.1.Ardent Mills
17.1.1.Company Details
17.1.2.Company Overview
17.1.3.Product Offerings
17.1.4.Key Developments
17.1.5.Financial Analysis
17.1.6.SWOT Analysis
17.1.7.Business Strategies
17.2.Bearded Brothers
17.2.1.Company Details
17.2.2.Company Overview
17.2.3.Product Offerings
17.2.4.Key Developments
17.2.5.Financial Analysis
17.2.6.SWOT Analysis
17.2.7.Business Strategies
17.3.BiteBox
17.3.1.Company Details
17.3.2.Company Overview
17.3.3.Product Offerings
17.3.4.Key Developments
17.3.5.Financial Analysis
17.3.6.SWOT Analysis
17.3.7.Business Strategies
17.4.Energy Bar Foods
17.4.1.Company Details
17.4.2.Company Overview
17.4.3.Product Offerings
17.4.4.Key Developments
17.4.5.Financial Analysis
17.4.6.SWOT Analysis
17.4.7.Business Strategies
17.5.Flowers Foods
17.5.1.Company Details
17.5.2.Company Overview
17.5.3.Product Offerings
17.5.4.Key Developments
17.5.5.Financial Analysis
17.5.6.SWOT Analysis
17.5.7.Business Strategies
17.6.General Mills Inc.
17.6.1.Company Details
17.6.2.Company Overview
17.6.3.Product Offerings
17.6.4.Key Developments
17.6.5.Financial Analysis
17.6.6.SWOT Analysis
17.6.7.Business Strategies
17.7.Grain Millers, Inc.
17.7.1.Company Details
17.7.2.Company Overview
17.7.3.Product Offerings
17.7.4.Key Developments
17.7.5.Financial Analysis
17.7.6.SWOT Analysis
17.7.7.Business Strategies
17.8.Hodgson Mill
17.8.1.Company Details
17.8.2.Company Overview
17.8.3.Product Offerings
17.8.4.Key Developments
17.8.5.Financial Analysis
17.8.6.SWOT Analysis
17.8.7.Business Strategies
17.9.Kellogg Co.
17.9.1.Company Details
17.9.2.Company Overview
17.9.3.Product Offerings
17.9.4.Key Developments
17.9.5.Financial Analysis
17.9.6.SWOT Analysis
17.9.7.Business Strategies
17.10.Mojo Snacks
17.10.1.Company Details
17.10.2.Company Overview
17.10.3.Product Offerings
17.10.4.Key Developments
17.10.5.Financial Analysis
17.10.6.SWOT Analysis
17.10.7.Business Strategies
17.11.Other Market Participants
18.Key Findings

.

**Exclusive for Multi-User and Enterprise User.

.

Global High Fiber Snacks Market

By Nature

 Organic
 Conventional

By Product

 Cereal and Granola Bars
 Nuts and Seeds
 Dried Fruits
 Biscuits and Cookies
 Trail Mix Snacks
 Others

By Distribution Channel

 Supermarkets/Hypermarkets
 Specialty Stores
 Convenience Stores
 Online Retailers
 Others

By Region

 North America (U.S., Canada, Mexico, Rest of North America)
 Europe (France, The UK, Spain, Germany, Italy, Nordic Countries (Denmark, Finland, Iceland, Sweden, Norway), Benelux Union (Belgium, The Netherlands, Luxembourg), Rest of Europe)
 Asia Pacific (China, Japan, India, New Zealand, Australia, South Korea, Southeast Asia (Indonesia, Thailand, Malaysia, Singapore, Rest of Southeast Asia), Rest of Asia Pacific)
 Middle East & Africa (Saudi Arabia, UAE, Egypt, Kuwait, South Africa, Rest of Middle East & Africa)
 Latin America (Brazil, Argentina, Rest of Latin America)

**Note: The report covers cross-segmentation analysis by region further into countries

.

The Niche Research approach encompasses both primary and secondary research methods to provide comprehensive insights. While primary research is the cornerstone of our studies, we also incorporate secondary research sources such as company annual reports, premium industry databases, press releases, industry journals, and white papers.

Within our primary research, we actively engage with various industry stakeholders, conducting paid interviews and surveys. Our meticulous analysis extends to every market participant in major countries, allowing us to thoroughly examine their portfolios, calculate market shares, and segment revenues.

Our data collection primarily focuses on individual countries within our research scope, enabling us to estimate regional market sizes. Typically, we employ a bottom-up approach, meticulously tracking trends in different countries. We analyze growth drivers, constraints, technological innovations, and opportunities for each country, ultimately arriving at regional figures.Our process begins by examining the growth prospects of each country. Building upon these insights, we project growth and trends for the entire region. Finally, we utilize our proprietary model to refine estimations and forecasts.

Our data validation standards are integral to ensuring the reliability and accuracy of our research findings. Here’s a breakdown of our data validation processes and the stakeholders we engage with during our primary research:

  • Supply Side Analysis: We initiate a supply side analysis by directly contacting market participants, through telephonic interviews and questionnaires containing both open-ended and close-ended questions. We gather information on their portfolios, segment revenues, developments, and growth strategies.
  • Demand Side Analysis: To gain insights into adoption trends and consumer preferences, we reach out to target customers and users (non-vendors). This information forms a vital part of the qualitative analysis section of our reports, covering market dynamics, adoption trends, consumer behavior, spending patterns, and other related aspects.
  • Consultant Insights: We tap into the expertise of our partner consultants from around the world to obtain their unique viewpoints and perspectives. Their insights contribute to a well-rounded understanding of the markets under investigation.
  • In-House Validation: To ensure data accuracy and reliability, we conduct cross-validation of data points and information through our in-house team of consultants and utilize advanced data modeling tools for thorough verification.

The forecasts we provide are based on a comprehensive assessment of various factors, including:

  • Market Trends and Past Performance (Last Five Years): We accurately analyze market trends and performance data from preceding five years to identify historical patterns and understand the market’s evolution.
  • Historical Performance and Growth of Market Participants: We assess the historical performance and growth trajectories of key market participants. This analysis provides insights into the competitive landscape and individual company strategies.
  • Market Determinants Impact Analysis (Next Eight Years): We conduct a rigorous analysis of the factors that are projected to influence the market over the next eight years. This includes assessing both internal and external determinants that can shape market dynamics.
  • Drivers and Challenges for the Forecast Period:Identify the factors expected to drive market growth during the forecast period, as well as the challenges that the industry may face. This analysis aids in deriving an accurate growth rate projection.
  • New Acquisitions, Collaborations, or Partnerships: We keep a close watch on any new acquisitions, collaborations, or partnerships within the industry. These developments can have a significant impact on market dynamics and competitiveness.
  • Macro and Micro Factors Analysis:A thorough examination of both macro-level factors (e.g., economic trends, regulatory changes) and micro-level factors (e.g., technological advancements, consumer preferences) that may influence the market during the forecast period.
  • End-User Sentiment Analysis: To understand the market from the end-user perspective, we conduct sentiment analysis. This involves assessing the sentiment, preferences, and feedback of the end-users, which can provide valuable insights into market trends.
  • Perspective of Primary Participants: Insights gathered directly from primary research participants play a crucial role in shaping our forecasts. Their perspectives and experiences provide valuable qualitative data.
  • Year-on-Year Growth Trend: We utilize a year-on-year growth trend based on historical market growth and expected future trends. This helps in formulating our growth projections, aligning them with the market’s historical performance.

Research process adopted by TNR involves multiple stages, including data collection, validation, quality checks, and presentation. It’s crucial that the data and information we provide add value to your existing market understanding and expertise. We have also established partnerships with business consulting, research, and survey organizations across regions and globally to collaborate on regional analysis and data validation, ensuring the highest level of accuracy and reliability in our reports.


Procure Comprehensive Study of

Global High Fiber Snacks Market

Online Only

  • Online Access
  • Read Only File
  • Validity 3 Months
  • Print, Copy, Paste & Download
  • PPT, Excel
  • Cost-Free Report in the Next Update
$3300
Buy Now

Single User

  • Access to One User on One System
  • Read Only File
  • Validity 6 Months
  • Limited Print,Copy, Paste
  • PPT, Excel
  • Cost-Free Report in the Next Update
$4200
Buy Now

Multi User

  • Access to Fiver Users
  • PDF File
  • Validity 1 Year
  • Upto FivePrints
  • Cost-Free Report in the Next Update
  • PPT, Excel
$6000
Buy Now

Enterprise User

  • Access to Unlimited Users
  • PDF, PPT, Excel
  • Unlimited Validity, Prints&Downloads
  • 1 Hour Cost-Free & Dedicated Analyst Support
  • 10% Cost-Free Customization
  • Cost-Free Report Update Twice in a Year
  • Recommendations for Business Strategies
  • Authorization to Quote TNR, The Niche Research
$7300
Buy Now

Library Access

  • Online Access to Content Publications
  • Access Player Profiles Online
  • Get Immediate Access to Newly Added Content
  • Acquire 12 PDF Downloads
  • Acquire 5 Excel Data Sets
  • Gain Access to 290+ PDFs of Company Profiles
  • Round-the-clock Email and Phone Assistance
  • Dashboard Usage and Trends
  • Renewal & Upgrade Assistance
  • Assessing Customization Options and Alerts for New Reports
$10788
Buy Now
*Taxes/Fees, if applicable will be added during checkout. All prices in USD

Why TNR The Niche Research?

  • Unwavering Commitment to Excellence

  • Veteran Team of Researchers

  • Accurate and Timely Insights

  • Ethical Practices and Customized Service

  • Uninterrupted Availability Around the Clock

Scroll to Top