Global Agricultural Pheromones Market, By Type, By Function, By Crop Type, By Mode of Action, By Region & Segmental Insights Trends and Forecast, 2024 – 2034

  • Industry: Agriculture
  • Report ID: TNR-110-1222
  • Number of Pages: 420
  • Table/Charts : Yes
  • July, 2024
  • Base Year : 2024
  • No. of Companies : 10+
  • No. of Countries : 29
  • Views : 10094
  • Covid Impact Covered: Yes
  • War Impact Covered: Yes
  • Formats : PDF, Excel, PPT

Agricultural pheromones are chemical substances used in farming to communicate between insects and other organisms. They play a significant role in pest management by manipulating the behaviour of pests and beneficial insects. The agricultural pheromones market is witnessing robust growth, driven by increasing demand for sustainable and environmentally friendly pest management solutions. Key growth drivers include rising awareness about the adverse effects of chemical pesticides on health and the environment, and stringent regulations promoting the adoption of biopesticides.

Technological advancements in pheromone synthesis and application methods are further propelling market expansion. Current trends indicate a surge in the adoption of integrated pest management (IPM) practices, with pheromone-based products gaining traction in both developed and developing regions. Additionally, the market is benefiting from innovations in pheromone dispensers and delivery systems, enhancing efficacy and cost-effectiveness. Strategic collaborations and investments in research and development are expected to further bolster market growth. In Terms of Revenue, the Global Agricultural Pheromones Market was Worth US$ 4.3 Bn in 2023, Anticipated to Witness CAGR of 18.3% During 2024 – 2034.

Trends in the Global Agricultural Pheromones Market

  • Technological Advancements and Innovation: Improved synthesis techniques for pheromones have enhanced the purity and potency of these compounds, making them more effective in pest management. Innovations in pheromone delivery systems, such as controlled-release dispensers and microencapsulation, are increasing the efficiency and longevity of pheromone applications. For instance, in May 2022, BASF acquired Horta S.r.l., an Italian firm known for its expertise in digital farming solutions. Horta S.r.l. has developed advanced agronomic Decision Support Systems (DSS) tailored for various crops, including grapes, tomatoes, cereals, and olives. These advancements reduce the frequency of applications needed, thereby lowering costs for farmers. The development of pheromone-based products targeting a broader range of pests is expanding the market’s reach. With ongoing research and collaboration between agricultural scientists and technology companies, the market is poised for continued innovation, driving more sustainable and efficient farming practices globally.
  • Integration with Sustainable Farming Practices: Farmers are increasingly adopting integrated pest management (IPM) strategies that utilize pheromones to reduce reliance on chemical pesticides. This integration helps in maintaining ecological balance, protecting beneficial insects, and preventing pest resistance. Additionally, consumer demand for organic and sustainably produced food is encouraging farmers to adopt pheromone-based pest control methods. Governments and agricultural organizations are also promoting pheromone use through subsidies and educational programs, further driving market growth. This trend aligns with broader environmental sustainability goals, supporting long-term agricultural productivity and ecosystem health.

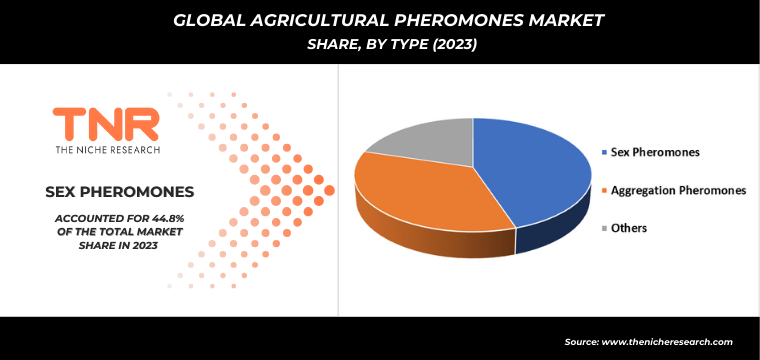
Sex pheromones have captured a substantial share of the global agricultural pheromones market, driven by their efficacy in pest management and their role in integrated pest management (IPM) strategies. These pheromones are highly effective in disrupting the mating cycles of pests, thereby reducing their populations without the need for harmful chemical pesticides. The growing awareness of the environmental and health impacts of chemical pesticides has further accelerated the adoption of sex pheromones. Additionally, technological advancements in pheromone synthesis and application methods have enhanced their accessibility and cost-effectiveness for farmers. The specificity of sex pheromones in targeting particular pests also ensures minimal impact on beneficial insects, aligning with sustainable farming practices.

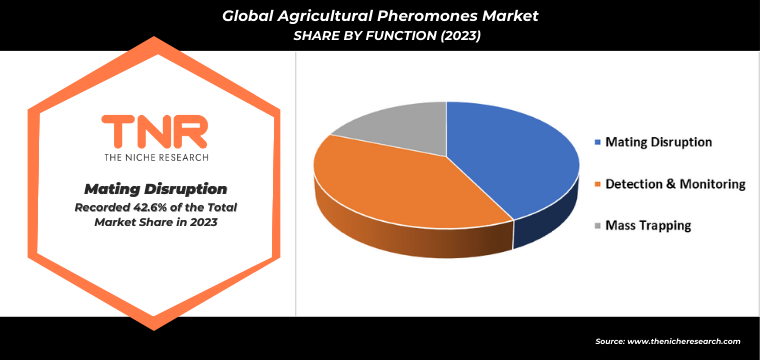
In 2023, detection & monitoring segment by function category has emerged as the second-largest leading segment in the global agricultural pheromones market. This growth is attributed to the increasing need for precise pest management strategies and early detection of pest infestations. Detection and monitoring pheromones are essential tools for farmers, enabling timely interventions and reducing crop damage. The segment’s expansion is further supported by advancements in pheromone trap technologies and integration with digital farming systems, enhancing the accuracy and efficiency of pest monitoring. This focus on proactive pest management aligns with the industry’s shift towards sustainable and data-driven agricultural practices.

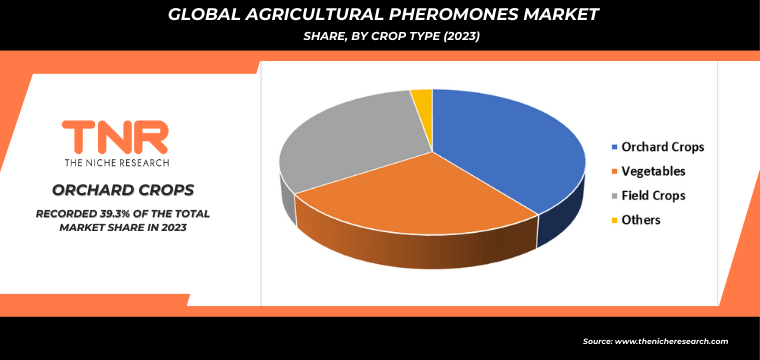
By crop type, orchard crops segment dominated the global Agricultural pheromones market and is expanding with a CAGR of 8.9% over the forecast timeline. This robust growth is driven by the high susceptibility of orchard crops, such as apples, pears, and citrus fruits, to pest infestations and the need for effective pest management solutions. The adoption of pheromone-based pest control in orchards enhances yield quality and quantity by reducing reliance on chemical pesticides. Additionally, the increasing consumer demand for organic and residue-free fruits is propelling the use of pheromones. Technological advancements in pheromone application methods and rising awareness among orchard growers are further fueling market expansion in this segment.

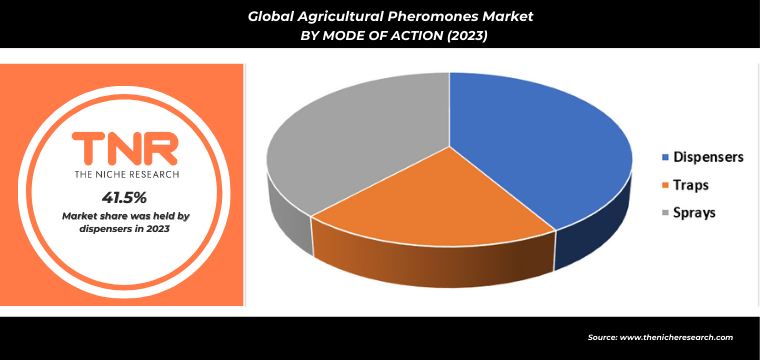
Traps segment by mode of action is set to be fastest growing segment in the global agricultural pheromones market with a revenue share of 20.5% in 2023. This growth is driven by the increasing demand for efficient and targeted pest control solutions. Pheromone traps are highly effective in monitoring and reducing pest populations by attracting and capturing pests, thereby minimizing crop damage and reducing the need for chemical pesticides. Innovations in trap designs and pheromone formulations, along with the growing emphasis on sustainable agriculture, are further accelerating the adoption of these traps. This trend reflects the shift towards integrated pest management practices.

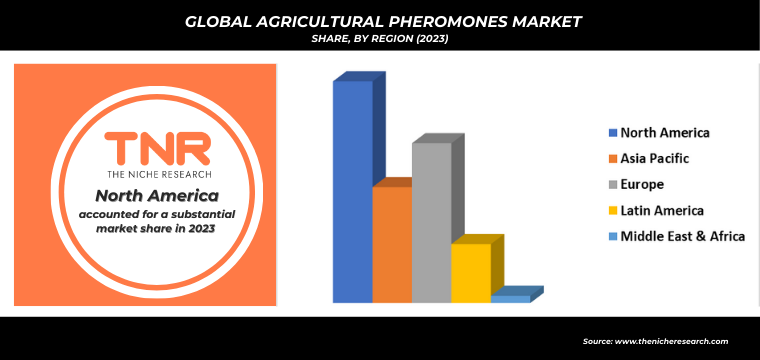
In 2023, Asia Pacific solidified its position as the third leading region in the agricultural pheromones market, driven by rapid agricultural development and increasing awareness of sustainable pest management practices. The region’s diverse agricultural landscape, including major crops like rice, fruits, and vegetables, fuels the demand for effective pest control solutions. Government initiatives promoting integrated pest management (IPM) and reducing chemical pesticide use further support market growth. Additionally, rising investments in agricultural technology and digital farming solutions are enhancing the adoption of pheromone-based products. The growing focus on improving crop yields and minimizing environmental impact aligns with the increasing use of pheromones in the region’s agriculture sector.

Competitive Landscape

Some of the players operating in the agricultural pheromones market are

  • Biobest Group
  • Isagro S.p.A.
  • ISCA Global
  • Koppert Biological Systems
  • Pacific Biocontrol Corporation
  • Provivi, Inc.
  • Russell IPM
  • SEDQ Healthy Crops SL
  • Shin-Etsu Chemical Company
  • Suterra LLC
  • Other Industry Participants

Global Agricultural Pheromones Market Scope

Report Specifications Details
Market Revenue in 2023 US$ 4.3 Bn
Market Size Forecast by 2034 US$ 27.3 Bn
Growth Rate (CAGR) 18.3%
Historic Data 2016 – 2022
Base Year for Estimation 2023
Forecast Period 2024 – 2034
Report Inclusions Market Size & Estimates, Market Dynamics, Competitive Scenario, Trends, Growth Factors, Market Determinants, Key Investment Segmentation, Product/Service/Solutions Benchmarking
Segments Covered By Type, By Function, By Crop Type, By Mode of Action, By Region
Regions Covered North America, Europe, Asia Pacific, Middle East & Africa, Latin America
Countries Covered U.S., Canada, Mexico, Rest of North America,  France, The UK, Spain, Germany, Italy, Nordic Countries (Denmark, Finland, Iceland, Sweden, Norway), Benelux Union (Belgium, The Netherlands, Luxembourg), Rest of Europe,  China, Japan, India, New Zealand, Australia, South Korea, Southeast Asia (Indonesia, Thailand, Malaysia, Singapore, Rest of Southeast Asia), Rest of Asia Pacific,  Saudi Arabia, UAE, Egypt, Kuwait, South Africa, Rest of Middle East & Africa,  Brazil, Argentina, Rest of Latin America
Key Players Biobest Group, Isagro S.p.A., ISCA Global, Koppert Biological Systems, Pacific Biocontrol Corporation, Provivi, Inc., Russell IPM, SEDQ Healthy Crops SL, Shin-Etsu Chemical Company, Suterra LLC
Customization Scope Customization allows for the inclusion/modification of content pertaining to geographical regions, countries, and specific market segments.
Pricing & Procurement Options Explore purchase options tailored to your specific research requirements
Contact Details Consult With Our Expert

Japan (Toll-Free):  +81 663-386-8111

South Korea (Toll-Free):  +82-808- 703-126

Saudi Arabia (Toll-Free):  +966 800-850-1643

United Kingdom: +44 753-710-5080

United States: +1 302-232-5106

E-mail:  askanexpert@thenicheresearch.com


Global Agricultural Pheromones Market

By Type

  • Sex Pheromones
  • Aggregation Pheromones
  • Others

By Function

  • Mating Disruption
  • Detection & Monitoring
  • Mass Trapping

By Crop Type

  • Orchard Crops
  • Vegetables
  • Field Crops
  • Others

By Mode of Action

  • Dispensers
  • Traps
  • Sprays

By Region

  • North America (U.S., Canada, Mexico, Rest of North America)
  • Europe (France, The UK, Spain, Germany, Italy, Nordic Countries (Denmark, Finland, Iceland, Sweden, Norway), Benelux Union (Belgium, The Netherlands, Luxembourg), Rest of Europe)
  • Asia Pacific (China, Japan, India, New Zealand, Australia, South Korea, Southeast Asia (Indonesia, Thailand, Malaysia, Singapore, Rest of Southeast Asia), Rest of Asia Pacific)
  • Middle East & Africa (Saudi Arabia, UAE, Egypt, Kuwait, South Africa, Rest of Middle East & Africa)
  • Latin America (Brazil, Argentina, Rest of Latin America)

Report Layout:

Table of Contents

.

1.Market Scope
1.1.Market Segmentation
1.2.Years Considered
1.2.1.Historic Years: 2016 – 2022
1.2.2.Base Year: 2023
1.2.3.Forecast Years: 2024 – 2034
2.Key Target Audiences
3.Research Methodology
3.1.Primary Research
3.1.1.Research Questionnaire
3.1.2.Global Percentage Breakdown
3.1.3.Primary Interviews: Key Opinion Leaders (KOLs)
3.2.Secondary Research
3.2.1.Paid Databases
3.2.2.Secondary Sources
3.3.Market Size Estimates
3.3.1.Top-Down Approach
3.3.2.Bottom-Up Approach
3.4.Data Triangulation Methodology
3.5.Research Assumptions
4.Recommendations and Insights from TNR’s Perspective**
5.Holistic Overview of Agricultural Pheromones Market
6.Market Synopsis: Agricultural Pheromones Market
7.Agricultural Pheromones Market Analysis: Qualitative Perspective
7.1.Introduction
7.1.1.Product Definition
7.1.2.Industry Development
7.2.Market Dynamics
7.2.1.Drivers
7.2.2.Restraints
7.2.3.Opportunities
7.2.4.Challenges
7.3.Trends in Agricultural Pheromones Market
7.4.Market Determinants Radar Chart
7.5.Macro-Economic and Micro-Economic Indicators: Agricultural Pheromones Market
7.6.Industry Gross Margin Overview
7.7.Porter’s Five Force Analysis
7.8.Impact of Covid-19 on Agricultural Pheromones Market
7.9.PESTEL Analysis
7.10.Value Chain Analysis
7.11.Pricing Analysis, By Region (2023)
7.11.1.North America
7.11.2.Europe
7.11.3.Asia Pacific
7.11.4.Middle East and Africa
7.11.5.Latin America
8.Global Agricultural Pheromones Market Analysis and Forecasts, 2024 – 2034
8.1.Overview
8.1.1.Global Agricultural Pheromones Market Revenue (US$ Mn)
8.2.Global Agricultural Pheromones Market Revenue (US$ Mn) and Forecasts, By Type
8.2.1.Sex Pheromones
8.2.1.1.Definition
8.2.1.2.Market Estimation and Penetration, 2016 – 2023
8.2.1.3.Market Forecast, 2024 – 2034
8.2.1.4.Compound Annual Growth Rate (CAGR)
8.2.1.5.Regional Bifurcation
8.2.1.5.1.North America
8.2.1.5.1.1.Market Estimation, 2016 – 2023
8.2.1.5.1.2.Market Forecast, 2024 – 2034
8.2.1.5.2.Europe
8.2.1.5.2.1.Market Estimation, 2016 – 2023
8.2.1.5.2.2.Market Forecast, 2024 – 2034
8.2.1.5.3.Asia Pacific
8.2.1.5.3.1.Market Estimation, 2016 – 2023
8.2.1.5.3.2.Market Forecast, 2024 – 2034
8.2.1.5.4.Middle East and Africa
8.2.1.5.4.1.Market Estimation, 2016 – 2023
8.2.1.5.4.2.Market Forecast, 2024 – 2034
8.2.1.5.5.Latin America
8.2.1.5.5.1.Market Estimation, 2016 – 2023
8.2.1.5.5.2.Market Forecast, 2024 – 2034
8.2.2.Aggregation Pheromones
8.2.2.1.Definition
8.2.2.2.Market Estimation and Penetration, 2016 – 2023
8.2.2.3.Market Forecast, 2024 – 2034
8.2.2.4.Compound Annual Growth Rate (CAGR)
8.2.2.5.Regional Bifurcation
8.2.2.5.1.North America
8.2.2.5.1.1.Market Estimation, 2016 – 2023
8.2.2.5.1.2.Market Forecast, 2024 – 2034
8.2.2.5.2.Europe
8.2.2.5.2.1.Market Estimation, 2016 – 2023
8.2.2.5.2.2.Market Forecast, 2024 – 2034
8.2.2.5.3.Asia Pacific
8.2.2.5.3.1.Market Estimation, 2016 – 2023
8.2.2.5.3.2.Market Forecast, 2024 – 2034
8.2.2.5.4.Middle East and Africa
8.2.2.5.4.1.Market Estimation, 2016 – 2023
8.2.2.5.4.2.Market Forecast, 2024 – 2034
8.2.2.5.5.Latin America
8.2.2.5.5.1.Market Estimation, 2016 – 2023
8.2.2.5.5.2.Market Forecast, 2024 – 2034
8.2.3.Others
8.2.3.1.Definition
8.2.3.2.Market Estimation and Penetration, 2016 – 2023
8.2.3.3.Market Forecast, 2024 – 2034
8.2.3.4.Compound Annual Growth Rate (CAGR)
8.2.3.5.Regional Bifurcation
8.2.3.5.1.North America
8.2.3.5.1.1.Market Estimation, 2016 – 2023
8.2.3.5.1.2.Market Forecast, 2024 – 2034
8.2.3.5.2.Europe
8.2.3.5.2.1.Market Estimation, 2016 – 2023
8.2.3.5.2.2.Market Forecast, 2024 – 2034
8.2.3.5.3.Asia Pacific
8.2.3.5.3.1.Market Estimation, 2016 – 2023
8.2.3.5.3.2.Market Forecast, 2024 – 2034
8.2.3.5.4.Middle East and Africa
8.2.3.5.4.1.Market Estimation, 2016 – 2023
8.2.3.5.4.2.Market Forecast, 2024 – 2034
8.2.3.5.5.Latin America
8.2.3.5.5.1.Market Estimation, 2016 – 2023
8.2.3.5.5.2.Market Forecast, 2024 – 2034
8.3.Key Segment for Channeling Investments
8.3.1.By Type
9.Global Agricultural Pheromones Market Analysis and Forecasts, 2024 – 2034
9.1.Overview
9.2.Global Agricultural Pheromones Market Revenue (US$ Mn) and Forecasts, By Function
9.2.1.Mating Disruption
9.2.1.1.Definition
9.2.1.2.Market Estimation and Penetration, 2016 – 2023
9.2.1.3.Market Forecast, 2024 – 2034
9.2.1.4.Compound Annual Growth Rate (CAGR)
9.2.1.5.Regional Bifurcation
9.2.1.5.1.North America
9.2.1.5.1.1.Market Estimation, 2016 – 2023
9.2.1.5.1.2.Market Forecast, 2024 – 2034
9.2.1.5.2.Europe
9.2.1.5.2.1.Market Estimation, 2016 – 2023
9.2.1.5.2.2.Market Forecast, 2024 – 2034
9.2.1.5.3.Asia Pacific
9.2.1.5.3.1.Market Estimation, 2016 – 2023
9.2.1.5.3.2.Market Forecast, 2024 – 2034
9.2.1.5.4.Middle East and Africa
9.2.1.5.4.1.Market Estimation, 2016 – 2023
9.2.1.5.4.2.Market Forecast, 2024 – 2034
9.2.1.5.5.Latin America
9.2.1.5.5.1.Market Estimation, 2016 – 2023
9.2.1.5.5.2.Market Forecast, 2024 – 2034
9.2.2.Detection and Monitoring
9.2.2.1.Definition
9.2.2.2.Market Estimation and Penetration, 2016 – 2023
9.2.2.3.Market Forecast, 2024 – 2034
9.2.2.4.Compound Annual Growth Rate (CAGR)
9.2.2.5.Regional Bifurcation
9.2.2.5.1.North America
9.2.2.5.1.1.Market Estimation, 2016 – 2023
9.2.2.5.1.2.Market Forecast, 2024 – 2034
9.2.2.5.2.Europe
9.2.2.5.2.1.Market Estimation, 2016 – 2023
9.2.2.5.2.2.Market Forecast, 2024 – 2034
9.2.2.5.3.Asia Pacific
9.2.2.5.3.1.Market Estimation, 2016 – 2023
9.2.2.5.3.2.Market Forecast, 2024 – 2034
9.2.2.5.4.Middle East and Africa
9.2.2.5.4.1.Market Estimation, 2016 – 2023
9.2.2.5.4.2.Market Forecast, 2024 – 2034
9.2.2.5.5.Latin America
9.2.2.5.5.1.Market Estimation, 2016 – 2023
9.2.2.5.5.2.Market Forecast, 2024 – 2034
9.2.3.Mass Trapping
9.2.3.1.Definition
9.2.3.2.Market Estimation and Penetration, 2016 – 2023
9.2.3.3.Market Forecast, 2024 – 2034
9.2.3.4.Compound Annual Growth Rate (CAGR)
9.2.3.5.Regional Bifurcation
9.2.3.5.1.North America
9.2.3.5.1.1.Market Estimation, 2016 – 2023
9.2.3.5.1.2.Market Forecast, 2024 – 2034
9.2.3.5.2.Europe
9.2.3.5.2.1.Market Estimation, 2016 – 2023
9.2.3.5.2.2.Market Forecast, 2024 – 2034
9.2.3.5.3.Asia Pacific
9.2.3.5.3.1.Market Estimation, 2016 – 2023
9.2.3.5.3.2.Market Forecast, 2024 – 2034
9.2.3.5.4.Middle East and Africa
9.2.3.5.4.1.Market Estimation, 2016 – 2023
9.2.3.5.4.2.Market Forecast, 2024 – 2034
9.2.3.5.5.Latin America
9.2.3.5.5.1.Market Estimation, 2016 – 2023
9.2.3.5.5.2.Market Forecast, 2024 – 2034
9.3.Key Segment for Channeling Investments
9.3.1.By Function
10.Global Agricultural Pheromones Market Analysis and Forecasts, 2024 – 2034
10.1.Overview
10.2.Global Agricultural Pheromones Market Revenue (US$ Mn) and Forecasts, By Crop Type
10.2.1.Orchard Crops
10.2.1.1.Definition
10.2.1.2.Market Estimation and Penetration, 2016 – 2023
10.2.1.3.Market Forecast, 2024 – 2034
10.2.1.4.Compound Annual Growth Rate (CAGR)
10.2.1.5.Regional Bifurcation
10.2.1.5.1.North America
10.2.1.5.1.1.Market Estimation, 2016 – 2023
10.2.1.5.1.2.Market Forecast, 2024 – 2034
10.2.1.5.2.Europe
10.2.1.5.2.1.Market Estimation, 2016 – 2023
10.2.1.5.2.2.Market Forecast, 2024 – 2034
10.2.1.5.3.Asia Pacific
10.2.1.5.3.1.Market Estimation, 2016 – 2023
10.2.1.5.3.2.Market Forecast, 2024 – 2034
10.2.1.5.4.Middle East and Africa
10.2.1.5.4.1.Market Estimation, 2016 – 2023
10.2.1.5.4.2.Market Forecast, 2024 – 2034
10.2.1.5.5.Latin America
10.2.1.5.5.1.Market Estimation, 2016 – 2023
10.2.1.5.5.2.Market Forecast, 2024 – 2034
10.2.2.Vegetables
10.2.2.1.Definition
10.2.2.2.Market Estimation and Penetration, 2016 – 2023
10.2.2.3.Market Forecast, 2024 – 2034
10.2.2.4.Compound Annual Growth Rate (CAGR)
10.2.2.5.Regional Bifurcation
10.2.2.5.1.North America
10.2.2.5.1.1.Market Estimation, 2016 – 2023
10.2.2.5.1.2.Market Forecast, 2024 – 2034
10.2.2.5.2.Europe
10.2.2.5.2.1.Market Estimation, 2016 – 2023
10.2.2.5.2.2.Market Forecast, 2024 – 2034
10.2.2.5.3.Asia Pacific
10.2.2.5.3.1.Market Estimation, 2016 – 2023
10.2.2.5.3.2.Market Forecast, 2024 – 2034
10.2.2.5.4.Middle East and Africa
10.2.2.5.4.1.Market Estimation, 2016 – 2023
10.2.2.5.4.2.Market Forecast, 2024 – 2034
10.2.2.5.5.Latin America
10.2.2.5.5.1.Market Estimation, 2016 – 2023
10.2.2.5.5.2.Market Forecast, 2024 – 2034
10.2.3.Field Crops
10.2.3.1.Definition
10.2.3.2.Market Estimation and Penetration, 2016 – 2023
10.2.3.3.Market Forecast, 2024 – 2034
10.2.3.4.Compound Annual Growth Rate (CAGR)
10.2.3.5.Regional Bifurcation
10.2.3.5.1.North America
10.2.3.5.1.1.Market Estimation, 2016 – 2023
10.2.3.5.1.2.Market Forecast, 2024 – 2034
10.2.3.5.2.Europe
10.2.3.5.2.1.Market Estimation, 2016 – 2023
10.2.3.5.2.2.Market Forecast, 2024 – 2034
10.2.3.5.3.Asia Pacific
10.2.3.5.3.1.Market Estimation, 2016 – 2023
10.2.3.5.3.2.Market Forecast, 2024 – 2034
10.2.3.5.4.Middle East and Africa
10.2.3.5.4.1.Market Estimation, 2016 – 2023
10.2.3.5.4.2.Market Forecast, 2024 – 2034
10.2.3.5.5.Latin America
10.2.3.5.5.1.Market Estimation, 2016 – 2023
10.2.3.5.5.2.Market Forecast, 2024 – 2034
10.2.4.Others
10.2.4.1.Definition
10.2.4.2.Market Estimation and Penetration, 2016 – 2023
10.2.4.3.Market Forecast, 2024 – 2034
10.2.4.4.Compound Annual Growth Rate (CAGR)
10.2.4.5.Regional Bifurcation
10.2.4.5.1.North America
10.2.4.5.1.1.Market Estimation, 2016 – 2023
10.2.4.5.1.2.Market Forecast, 2024 – 2034
10.2.4.5.2.Europe
10.2.4.5.2.1.Market Estimation, 2016 – 2023
10.2.4.5.2.2.Market Forecast, 2024 – 2034
10.2.4.5.3.Asia Pacific
10.2.4.5.3.1.Market Estimation, 2016 – 2023
10.2.4.5.3.2.Market Forecast, 2024 – 2034
10.2.4.5.4.Middle East and Africa
10.2.4.5.4.1.Market Estimation, 2016 – 2023
10.2.4.5.4.2.Market Forecast, 2024 – 2034
10.2.4.5.5.Latin America
10.2.4.5.5.1.Market Estimation, 2016 – 2023
10.2.4.5.5.2.Market Forecast, 2024 – 2034
10.3.Key Segment for Channeling Investments
10.3.1.By Crop Type
11.Global Agricultural Pheromones Market Analysis and Forecasts, 2024 – 2034
11.1.Overview
11.2.Global Agricultural Pheromones Market Revenue (US$ Mn) and Forecasts, By Mode of Action
11.2.1.Dispensers
11.2.1.1.Definition
11.2.1.2.Market Estimation and Penetration, 2016 – 2023
11.2.1.3.Market Forecast, 2024 – 2034
11.2.1.4.Compound Annual Growth Rate (CAGR)
11.2.1.5.Regional Bifurcation
11.2.1.5.1.North America
11.2.1.5.1.1.Market Estimation, 2016 – 2023
11.2.1.5.1.2.Market Forecast, 2024 – 2034
11.2.1.5.2.Europe
11.2.1.5.2.1.Market Estimation, 2016 – 2023
11.2.1.5.2.2.Market Forecast, 2024 – 2034
11.2.1.5.3.Asia Pacific
11.2.1.5.3.1.Market Estimation, 2016 – 2023
11.2.1.5.3.2.Market Forecast, 2024 – 2034
11.2.1.5.4.Middle East and Africa
11.2.1.5.4.1.Market Estimation, 2016 – 2023
11.2.1.5.4.2.Market Forecast, 2024 – 2034
11.2.1.5.5.Latin America
11.2.1.5.5.1.Market Estimation, 2016 – 2023
11.2.1.5.5.2.Market Forecast, 2024 – 2034
11.2.2.Traps
11.2.2.1.Definition
11.2.2.2.Market Estimation and Penetration, 2016 – 2023
11.2.2.3.Market Forecast, 2024 – 2034
11.2.2.4.Compound Annual Growth Rate (CAGR)
11.2.2.5.Regional Bifurcation
11.2.2.5.1.North America
11.2.2.5.1.1.Market Estimation, 2016 – 2023
11.2.2.5.1.2.Market Forecast, 2024 – 2034
11.2.2.5.2.Europe
11.2.2.5.2.1.Market Estimation, 2016 – 2023
11.2.2.5.2.2.Market Forecast, 2024 – 2034
11.2.2.5.3.Asia Pacific
11.2.2.5.3.1.Market Estimation, 2016 – 2023
11.2.2.5.3.2.Market Forecast, 2024 – 2034
11.2.2.5.4.Middle East and Africa
11.2.2.5.4.1.Market Estimation, 2016 – 2023
11.2.2.5.4.2.Market Forecast, 2024 – 2034
11.2.2.5.5.Latin America
11.2.2.5.5.1.Market Estimation, 2016 – 2023
11.2.2.5.5.2.Market Forecast, 2024 – 2034
11.2.3.Sprays
11.2.3.1.Definition
11.2.3.2.Market Estimation and Penetration, 2016 – 2023
11.2.3.3.Market Forecast, 2024 – 2034
11.2.3.4.Compound Annual Growth Rate (CAGR)
11.2.3.5.Regional Bifurcation
11.2.3.5.1.North America
11.2.3.5.1.1.Market Estimation, 2016 – 2023
11.2.3.5.1.2.Market Forecast, 2024 – 2034
11.2.3.5.2.Europe
11.2.3.5.2.1.Market Estimation, 2016 – 2023
11.2.3.5.2.2.Market Forecast, 2024 – 2034
11.2.3.5.3.Asia Pacific
11.2.3.5.3.1.Market Estimation, 2016 – 2023
11.2.3.5.3.2.Market Forecast, 2024 – 2034
11.2.3.5.4.Middle East and Africa
11.2.3.5.4.1.Market Estimation, 2016 – 2023
11.2.3.5.4.2.Market Forecast, 2024 – 2034
11.2.3.5.5.Latin America
11.2.3.5.5.1.Market Estimation, 2016 – 2023
11.2.3.5.5.2.Market Forecast, 2024 – 2034
11.3.Key Segment for Channeling Investments
11.3.1.By Mode of Action
12.North America Agricultural Pheromones Market Analysis and Forecasts, 2024 – 2034
12.1.Overview
12.1.1.North America Agricultural Pheromones Market Revenue (US$ Mn)
12.2.North America Agricultural Pheromones Market Revenue (US$ Mn) and Forecasts, By Type
12.2.1.Sex Pheromones
12.2.2.Aggregation Pheromones
12.2.3.Others
12.3.North America Agricultural Pheromones Market Revenue (US$ Mn) and Forecasts, By Function
12.3.1.Mating Disruption
12.3.2.Detection and Monitoring
12.3.3.Mass Trapping
12.4.North America Agricultural Pheromones Market Revenue (US$ Mn) and Forecasts, By Crop Type
12.4.1.Orchard Crops
12.4.2.Vegetables
12.4.3.Field Crops
12.4.4.Others
12.5.North America Agricultural Pheromones Market Revenue (US$ Mn) and Forecasts, By Mode of Action
12.5.1.Dispensers
12.5.2.Traps
12.5.3.Sprays
12.6.North America Agricultural Pheromones Market Revenue (US$ Mn) and Forecasts, By Country
12.6.1.U.S
12.6.1.1.U.S Agricultural Pheromones Market Revenue (US$ Mn) and Forecasts, By Type
12.6.1.1.1.Sex Pheromones
12.6.1.1.2.Aggregation Pheromones
12.6.1.1.3.Others
12.6.1.2.U.S Agricultural Pheromones Market Revenue (US$ Mn) and Forecasts, By Function
12.6.1.2.1.Mating Disruption
12.6.1.2.2.Detection and Monitoring
12.6.1.2.3.Mass Trapping
12.6.1.3.U.S Agricultural Pheromones Market Revenue (US$ Mn) and Forecasts, By Crop Type
12.6.1.3.1.Orchard Crops
12.6.1.3.2.Vegetables
12.6.1.3.3.Field Crops
12.6.1.3.4.Others
12.6.1.4.U.S Agricultural Pheromones Market Revenue (US$ Mn) and Forecasts, By Mode of Action
12.6.1.4.1.Dispensers
12.6.1.4.2.Traps
12.6.1.4.3.Sprays
12.6.2.Canada
12.6.2.1.Canada Agricultural Pheromones Market Revenue (US$ Mn) and Forecasts, By Type
12.6.2.1.1.Sex Pheromones
12.6.2.1.2.Aggregation Pheromones
12.6.2.1.3.Others
12.6.2.2.Canada Agricultural Pheromones Market Revenue (US$ Mn) and Forecasts, By Function
12.6.2.2.1.Mating Disruption
12.6.2.2.2.Detection and Monitoring
12.6.2.2.3.Mass Trapping
12.6.2.3.Canada Agricultural Pheromones Market Revenue (US$ Mn) and Forecasts, By Crop Type
12.6.2.3.1.Orchard Crops
12.6.2.3.2.Vegetables
12.6.2.3.3.Field Crops
12.6.2.3.4.Others
12.6.2.4.Canada Agricultural Pheromones Market Revenue (US$ Mn) and Forecasts, By Mode of Action
12.6.2.4.1.Dispensers
12.6.2.4.2.Traps
12.6.2.4.3.Sprays
12.6.3.Mexico
12.6.3.1.Mexico Agricultural Pheromones Market Revenue (US$ Mn) and Forecasts, By Type
12.6.3.1.1.Sex Pheromones
12.6.3.1.2.Aggregation Pheromones
12.6.3.1.3.Others
12.6.3.2.Mexico Agricultural Pheromones Market Revenue (US$ Mn) and Forecasts, By Function
12.6.3.2.1.Mating Disruption
12.6.3.2.2.Detection and Monitoring
12.6.3.2.3.Mass Trapping
12.6.3.3.Mexico Agricultural Pheromones Market Revenue (US$ Mn) and Forecasts, By Crop Type
12.6.3.3.1.Orchard Crops
12.6.3.3.2.Vegetables
12.6.3.3.3.Field Crops
12.6.3.3.4.Others
12.6.3.4.Mexico Agricultural Pheromones Market Revenue (US$ Mn) and Forecasts, By Mode of Action
12.6.3.4.1.Dispensers
12.6.3.4.2.Traps
12.6.3.4.3.Sprays
12.6.4.Rest of North America
12.6.4.1.Rest of North America Agricultural Pheromones Market Revenue (US$ Mn) and Forecasts, By Type
12.6.4.1.1.Sex Pheromones
12.6.4.1.2.Aggregation Pheromones
12.6.4.1.3.Others
12.6.4.2.Rest of North America Agricultural Pheromones Market Revenue (US$ Mn) and Forecasts, By Function
12.6.4.2.1.Mating Disruption
12.6.4.2.2.Detection and Monitoring
12.6.4.2.3.Mass Trapping
12.6.4.3.Rest of North America Agricultural Pheromones Market Revenue (US$ Mn) and Forecasts, By Crop Type
12.6.4.3.1.Orchard Crops
12.6.4.3.2.Vegetables
12.6.4.3.3.Field Crops
12.6.4.3.4.Others
12.6.4.4.Rest of North America Agricultural Pheromones Market Revenue (US$ Mn) and Forecasts, By Mode of Action
12.6.4.4.1.Dispensers
12.6.4.4.2.Traps
12.6.4.4.3.Sprays
12.7.Key Segment for Channeling Investments
12.7.1.By Country
12.7.2.By Type
12.7.3.By Function
12.7.4.By Crop Type
12.7.5.By Mode of Action
13.Europe Agricultural Pheromones Market Analysis and Forecasts, 2024 – 2034
13.1.Overview
13.1.1.Europe Agricultural Pheromones Market Revenue (US$ Mn)
13.2.Europe Agricultural Pheromones Market Revenue (US$ Mn) and Forecasts, By Type
13.2.1.Sex Pheromones
13.2.2.Aggregation Pheromones
13.2.3.Others
13.3.Europe Agricultural Pheromones Market Revenue (US$ Mn) and Forecasts, By Function
13.3.1.Mating Disruption
13.3.2.Detection and Monitoring
13.3.3.Mass Trapping
13.4.Europe Agricultural Pheromones Market Revenue (US$ Mn) and Forecasts, By Crop Type
13.4.1.Orchard Crops
13.4.2.Vegetables
13.4.3.Field Crops
13.4.4.Others
13.5.Europe Agricultural Pheromones Market Revenue (US$ Mn) and Forecasts, By Mode of Action
13.5.1.Dispensers
13.5.2.Traps
13.5.3.Sprays
13.6.Europe Agricultural Pheromones Market Revenue (US$ Mn) and Forecasts, By Country
13.6.1.France
13.6.1.1.France Agricultural Pheromones Market Revenue (US$ Mn) and Forecasts, By Type
13.6.1.1.1.Sex Pheromones
13.6.1.1.2.Aggregation Pheromones
13.6.1.1.3.Others
13.6.1.2.France Agricultural Pheromones Market Revenue (US$ Mn) and Forecasts, By Function
13.6.1.2.1.Mating Disruption
13.6.1.2.2.Detection and Monitoring
13.6.1.2.3.Mass Trapping
13.6.1.3.France Agricultural Pheromones Market Revenue (US$ Mn) and Forecasts, By Crop Type
13.6.1.3.1.Orchard Crops
13.6.1.3.2.Vegetables
13.6.1.3.3.Field Crops
13.6.1.3.4.Others
13.6.1.4.France Agricultural Pheromones Market Revenue (US$ Mn) and Forecasts, By Mode of Action
13.6.1.4.1.Dispensers
13.6.1.4.2.Traps
13.6.1.4.3.Sprays
13.6.2.The UK
13.6.2.1.The UK Agricultural Pheromones Market Revenue (US$ Mn) and Forecasts, By Type
13.6.2.1.1.Sex Pheromones
13.6.2.1.2.Aggregation Pheromones
13.6.2.1.3.Others
13.6.2.2.The UK Agricultural Pheromones Market Revenue (US$ Mn) and Forecasts, By Function
13.6.2.2.1.Mating Disruption
13.6.2.2.2.Detection and Monitoring
13.6.2.2.3.Mass Trapping
13.6.2.3.The UK Agricultural Pheromones Market Revenue (US$ Mn) and Forecasts, By Crop Type
13.6.2.3.1.Orchard Crops
13.6.2.3.2.Vegetables
13.6.2.3.3.Field Crops
13.6.2.3.4.Others
13.6.2.4.The UK Agricultural Pheromones Market Revenue (US$ Mn) and Forecasts, By Mode of Action
13.6.2.4.1.Dispensers
13.6.2.4.2.Traps
13.6.2.4.3.Sprays
13.6.3.Spain
13.6.3.1.Spain Agricultural Pheromones Market Revenue (US$ Mn) and Forecasts, By Type
13.6.3.1.1.Sex Pheromones
13.6.3.1.2.Aggregation Pheromones
13.6.3.1.3.Others
13.6.3.2.Spain Agricultural Pheromones Market Revenue (US$ Mn) and Forecasts, By Function
13.6.3.2.1.Mating Disruption
13.6.3.2.2.Detection and Monitoring
13.6.3.2.3.Mass Trapping
13.6.3.3.Spain Agricultural Pheromones Market Revenue (US$ Mn) and Forecasts, By Crop Type
13.6.3.3.1.Orchard Crops
13.6.3.3.2.Vegetables
13.6.3.3.3.Field Crops
13.6.3.3.4.Others
13.6.3.4.Spain Agricultural Pheromones Market Revenue (US$ Mn) and Forecasts, By Mode of Action
13.6.3.4.1.Dispensers
13.6.3.4.2.Traps
13.6.3.4.3.Sprays
13.6.4.Germany
13.6.4.1.Germany Agricultural Pheromones Market Revenue (US$ Mn) and Forecasts, By Type
13.6.4.1.1.Sex Pheromones
13.6.4.1.2.Aggregation Pheromones
13.6.4.1.3.Others
13.6.4.2.Germany Agricultural Pheromones Market Revenue (US$ Mn) and Forecasts, By Function
13.6.4.2.1.Mating Disruption
13.6.4.2.2.Detection and Monitoring
13.6.4.2.3.Mass Trapping
13.6.4.3.Germany Agricultural Pheromones Market Revenue (US$ Mn) and Forecasts, By Crop Type
13.6.4.3.1.Orchard Crops
13.6.4.3.2.Vegetables
13.6.4.3.3.Field Crops
13.6.4.3.4.Others
13.6.4.4.Germany Agricultural Pheromones Market Revenue (US$ Mn) and Forecasts, By Mode of Action
13.6.4.4.1.Dispensers
13.6.4.4.2.Traps
13.6.4.4.3.Sprays
13.6.5.Italy
13.6.5.1.Italy Agricultural Pheromones Market Revenue (US$ Mn) and Forecasts, By Type
13.6.5.1.1.Sex Pheromones
13.6.5.1.2.Aggregation Pheromones
13.6.5.1.3.Others
13.6.5.2.Italy Agricultural Pheromones Market Revenue (US$ Mn) and Forecasts, By Function
13.6.5.2.1.Mating Disruption
13.6.5.2.2.Detection and Monitoring
13.6.5.2.3.Mass Trapping
13.6.5.3.Italy Agricultural Pheromones Market Revenue (US$ Mn) and Forecasts, By Crop Type
13.6.5.3.1.Orchard Crops
13.6.5.3.2.Vegetables
13.6.5.3.3.Field Crops
13.6.5.3.4.Others
13.6.5.4.Italy Agricultural Pheromones Market Revenue (US$ Mn) and Forecasts, By Mode of Action
13.6.5.4.1.Dispensers
13.6.5.4.2.Traps
13.6.5.4.3.Sprays
13.6.6.Nordic Countries
13.6.6.1.Nordic Countries Agricultural Pheromones Market Revenue (US$ Mn) and Forecasts, By Type
13.6.6.1.1.Sex Pheromones
13.6.6.1.2.Aggregation Pheromones
13.6.6.1.3.Others
13.6.6.2.Nordic Countries Agricultural Pheromones Market Revenue (US$ Mn) and Forecasts, By Function
13.6.6.2.1.Mating Disruption
13.6.6.2.2.Detection and Monitoring
13.6.6.2.3.Mass Trapping
13.6.6.3.Nordic Countries Agricultural Pheromones Market Revenue (US$ Mn) and Forecasts, By Crop Type
13.6.6.3.1.Orchard Crops
13.6.6.3.2.Vegetables
13.6.6.3.3.Field Crops
13.6.6.3.4.Others
13.6.6.4.Nordic Countries Agricultural Pheromones Market Revenue (US$ Mn) and Forecasts, By Mode of Action
13.6.6.4.1.Dispensers
13.6.6.4.2.Traps
13.6.6.4.3.Sprays
13.6.6.5.Nordic Countries Agricultural Pheromones Market Revenue (US$ Mn) and Forecasts, By Country
13.6.6.5.1.Denmark
13.6.6.5.2.Finland
13.6.6.5.3.Iceland
13.6.6.5.4.Sweden
13.6.6.5.5.Norway
13.6.7.Benelux Union
13.6.7.1.Benelux Union Agricultural Pheromones Market Revenue (US$ Mn) and Forecasts, By Type
13.6.7.1.1.Sex Pheromones
13.6.7.1.2.Aggregation Pheromones
13.6.7.1.3.Others
13.6.7.2.Benelux Union Agricultural Pheromones Market Revenue (US$ Mn) and Forecasts, By Function
13.6.7.2.1.Mating Disruption
13.6.7.2.2.Detection and Monitoring
13.6.7.2.3.Mass Trapping
13.6.7.3.Benelux Union Agricultural Pheromones Market Revenue (US$ Mn) and Forecasts, By Crop Type
13.6.7.3.1.Orchard Crops
13.6.7.3.2.Vegetables
13.6.7.3.3.Field Crops
13.6.7.3.4.Others
13.6.7.4.Benelux Union Agricultural Pheromones Market Revenue (US$ Mn) and Forecasts, By Mode of Action
13.6.7.4.1.Dispensers
13.6.7.4.2.Traps
13.6.7.4.3.Sprays
13.6.7.5.Benelux Union Agricultural Pheromones Market Revenue (US$ Mn) and Forecasts, By Country
13.6.7.5.1.Belgium
13.6.7.5.2.The Netherlands
13.6.7.5.3.Luxembourg
13.6.8.Rest of Europe
13.6.8.1.Rest of Europe Agricultural Pheromones Market Revenue (US$ Mn) and Forecasts, By Type
13.6.8.1.1.Sex Pheromones
13.6.8.1.2.Aggregation Pheromones
13.6.8.1.3.Others
13.6.8.2.Rest of Europe Agricultural Pheromones Market Revenue (US$ Mn) and Forecasts, By Function
13.6.8.2.1.Mating Disruption
13.6.8.2.2.Detection and Monitoring
13.6.8.2.3.Mass Trapping
13.6.8.3.Rest of Europe Agricultural Pheromones Market Revenue (US$ Mn) and Forecasts, By Crop Type
13.6.8.3.1.Orchard Crops
13.6.8.3.2.Vegetables
13.6.8.3.3.Field Crops
13.6.8.3.4.Others
13.6.8.4.Rest of Europe Agricultural Pheromones Market Revenue (US$ Mn) and Forecasts, By Mode of Action
13.6.8.4.1.Dispensers
13.6.8.4.2.Traps
13.6.8.4.3.Sprays
13.7.Key Segment for Channeling Investments
13.7.1.By Country
13.7.2.By Type
13.7.3.By Function
13.7.4.By Crop Type
13.7.5.By Mode of Action
14.Asia Pacific Agricultural Pheromones Market Analysis and Forecasts, 2024 – 2034
14.1.Overview
14.1.1.Asia Pacific Agricultural Pheromones Market Revenue (US$ Mn)
14.2.Asia Pacific Agricultural Pheromones Market Revenue (US$ Mn) and Forecasts, By Type
14.2.1.Sex Pheromones
14.2.2.Aggregation Pheromones
14.2.3.Others
14.3.Asia Pacific Agricultural Pheromones Market Revenue (US$ Mn) and Forecasts, By Function
14.3.1.Mating Disruption
14.3.2.Detection and Monitoring
14.3.3.Mass Trapping
14.4.Asia Pacific Agricultural Pheromones Market Revenue (US$ Mn) and Forecasts, By Crop Type
14.4.1.Orchard Crops
14.4.2.Vegetables
14.4.3.Field Crops
14.4.4.Others
14.5.Asia Pacific Agricultural Pheromones Market Revenue (US$ Mn) and Forecasts, By Mode of Action
14.5.1.Dispensers
14.5.2.Traps
14.5.3.Sprays
14.6.Asia Pacific Agricultural Pheromones Market Revenue (US$ Mn) and Forecasts, By Country
14.6.1.China
14.6.1.1.China Agricultural Pheromones Market Revenue (US$ Mn) and Forecasts, By Type
14.6.1.1.1.Sex Pheromones
14.6.1.1.2.Aggregation Pheromones
14.6.1.1.3.Others
14.6.1.2.China Agricultural Pheromones Market Revenue (US$ Mn) and Forecasts, By Function
14.6.1.2.1.Mating Disruption
14.6.1.2.2.Detection and Monitoring
14.6.1.2.3.Mass Trapping
14.6.1.3.China Agricultural Pheromones Market Revenue (US$ Mn) and Forecasts, By Crop Type
14.6.1.3.1.Orchard Crops
14.6.1.3.2.Vegetables
14.6.1.3.3.Field Crops
14.6.1.3.4.Others
14.6.1.4.China Agricultural Pheromones Market Revenue (US$ Mn) and Forecasts, By Mode of Action
14.6.1.4.1.Dispensers
14.6.1.4.2.Traps
14.6.1.4.3.Sprays
14.6.2.Japan
14.6.2.1.Japan Agricultural Pheromones Market Revenue (US$ Mn) and Forecasts, By Type
14.6.2.1.1.Sex Pheromones
14.6.2.1.2.Aggregation Pheromones
14.6.2.1.3.Others
14.6.2.2.Japan Agricultural Pheromones Market Revenue (US$ Mn) and Forecasts, By Function
14.6.2.2.1.Mating Disruption
14.6.2.2.2.Detection and Monitoring
14.6.2.2.3.Mass Trapping
14.6.2.3.Japan Agricultural Pheromones Market Revenue (US$ Mn) and Forecasts, By Crop Type
14.6.2.3.1.Orchard Crops
14.6.2.3.2.Vegetables
14.6.2.3.3.Field Crops
14.6.2.3.4.Others
14.6.2.4.Japan Agricultural Pheromones Market Revenue (US$ Mn) and Forecasts, By Mode of Action
14.6.2.4.1.Dispensers
14.6.2.4.2.Traps
14.6.2.4.3.Sprays
14.6.3.India
14.6.3.1.India Agricultural Pheromones Market Revenue (US$ Mn) and Forecasts, By Type
14.6.3.1.1.Sex Pheromones
14.6.3.1.2.Aggregation Pheromones
14.6.3.1.3.Others
14.6.3.2.India Agricultural Pheromones Market Revenue (US$ Mn) and Forecasts, By Function
14.6.3.2.1.Mating Disruption
14.6.3.2.2.Detection and Monitoring
14.6.3.2.3.Mass Trapping
14.6.3.3.India Agricultural Pheromones Market Revenue (US$ Mn) and Forecasts, By Crop Type
14.6.3.3.1.Orchard Crops
14.6.3.3.2.Vegetables
14.6.3.3.3.Field Crops
14.6.3.3.4.Others
14.6.3.4.India Agricultural Pheromones Market Revenue (US$ Mn) and Forecasts, By Mode of Action
14.6.3.4.1.Dispensers
14.6.3.4.2.Traps
14.6.3.4.3.Sprays
14.6.4.New Zealand
14.6.4.1.New Zealand Agricultural Pheromones Market Revenue (US$ Mn) and Forecasts, By Type
14.6.4.1.1.Sex Pheromones
14.6.4.1.2.Aggregation Pheromones
14.6.4.1.3.Others
14.6.4.2.New Zealand Agricultural Pheromones Market Revenue (US$ Mn) and Forecasts, By Function
14.6.4.2.1.Mating Disruption
14.6.4.2.2.Detection and Monitoring
14.6.4.2.3.Mass Trapping
14.6.4.3.New Zealand Agricultural Pheromones Market Revenue (US$ Mn) and Forecasts, By Crop Type
14.6.4.3.1.Orchard Crops
14.6.4.3.2.Vegetables
14.6.4.3.3.Field Crops
14.6.4.3.4.Others
14.6.4.4.New Zealand Agricultural Pheromones Market Revenue (US$ Mn) and Forecasts, By Mode of Action
14.6.4.4.1.Dispensers
14.6.4.4.2.Traps
14.6.4.4.3.Sprays
14.6.5.Australia
14.6.5.1.Australia Agricultural Pheromones Market Revenue (US$ Mn) and Forecasts, By Type
14.6.5.1.1.Sex Pheromones
14.6.5.1.2.Aggregation Pheromones
14.6.5.1.3.Others
14.6.5.2.Australia Agricultural Pheromones Market Revenue (US$ Mn) and Forecasts, By Function
14.6.5.2.1.Mating Disruption
14.6.5.2.2.Detection and Monitoring
14.6.5.2.3.Mass Trapping
14.6.5.3.Australia Agricultural Pheromones Market Revenue (US$ Mn) and Forecasts, By Crop Type
14.6.5.3.1.Orchard Crops
14.6.5.3.2.Vegetables
14.6.5.3.3.Field Crops
14.6.5.3.4.Others
14.6.5.4.Australia Agricultural Pheromones Market Revenue (US$ Mn) and Forecasts, By Mode of Action
14.6.5.4.1.Dispensers
14.6.5.4.2.Traps
14.6.5.4.3.Sprays
14.6.6.South Korea
14.6.6.1.South Korea Agricultural Pheromones Market Revenue (US$ Mn) and Forecasts, By Type
14.6.6.1.1.Sex Pheromones
14.6.6.1.2.Aggregation Pheromones
14.6.6.1.3.Others
14.6.6.2.South Korea Agricultural Pheromones Market Revenue (US$ Mn) and Forecasts, By Function
14.6.6.2.1.Mating Disruption
14.6.6.2.2.Detection and Monitoring
14.6.6.2.3.Mass Trapping
14.6.6.3.South Korea Agricultural Pheromones Market Revenue (US$ Mn) and Forecasts, By Crop Type
14.6.6.3.1.Orchard Crops
14.6.6.3.2.Vegetables
14.6.6.3.3.Field Crops
14.6.6.3.4.Others
14.6.6.4.South Korea Agricultural Pheromones Market Revenue (US$ Mn) and Forecasts, By Mode of Action
14.6.6.4.1.Dispensers
14.6.6.4.2.Traps
14.6.6.4.3.Sprays
14.6.7.Southeast Asia
14.6.7.1.Southeast Asia Agricultural Pheromones Market Revenue (US$ Mn) and Forecasts, By Type
14.6.7.1.1.Sex Pheromones
14.6.7.1.2.Aggregation Pheromones
14.6.7.1.3.Others
14.6.7.2.Southeast Asia Agricultural Pheromones Market Revenue (US$ Mn) and Forecasts, By Function
14.6.7.2.1.Mating Disruption
14.6.7.2.2.Detection and Monitoring
14.6.7.2.3.Mass Trapping
14.6.7.3.Southeast Asia Agricultural Pheromones Market Revenue (US$ Mn) and Forecasts, By Crop Type
14.6.7.3.1.Orchard Crops
14.6.7.3.2.Vegetables
14.6.7.3.3.Field Crops
14.6.7.3.4.Others
14.6.7.4.Southeast Asia Agricultural Pheromones Market Revenue (US$ Mn) and Forecasts, By Mode of Action
14.6.7.4.1.Dispensers
14.6.7.4.2.Traps
14.6.7.4.3.Sprays
14.6.7.5.Southeast Asia Agricultural Pheromones Market Revenue (US$ Mn) and Forecasts, By Country
14.6.7.5.1.Indonesia
14.6.7.5.2.Thailand
14.6.7.5.3.Malaysia
14.6.7.5.4.Singapore
14.6.7.5.5.Rest of Southeast Asia
14.6.8.Rest of Asia Pacific
14.6.8.1.Rest of Asia Pacific Agricultural Pheromones Market Revenue (US$ Mn) and Forecasts, By Type
14.6.8.1.1.Sex Pheromones
14.6.8.1.2.Aggregation Pheromones
14.6.8.1.3.Others
14.6.8.2.Rest of Asia Pacific Agricultural Pheromones Market Revenue (US$ Mn) and Forecasts, By Function
14.6.8.2.1.Mating Disruption
14.6.8.2.2.Detection and Monitoring
14.6.8.2.3.Mass Trapping
14.6.8.3.Rest of Asia Pacific Agricultural Pheromones Market Revenue (US$ Mn) and Forecasts, By Crop Type
14.6.8.3.1.Orchard Crops
14.6.8.3.2.Vegetables
14.6.8.3.3.Field Crops
14.6.8.3.4.Others
14.6.8.4.Rest of Asia Pacific Agricultural Pheromones Market Revenue (US$ Mn) and Forecasts, By Mode of Action
14.6.8.4.1.Dispensers
14.6.8.4.2.Traps
14.6.8.4.3.Sprays
14.7.Key Segment for Channeling Investments
14.7.1.By Country
14.7.2.By Type
14.7.3.By Function
14.7.4.By Crop Type
14.7.5.By Mode of Action
15.Middle East and Africa Agricultural Pheromones Market Analysis and Forecasts, 2024 – 2034
15.1.Overview
15.1.1.Middle East and Africa Agricultural Pheromones Market Revenue (US$ Mn)
15.2.Middle East and Africa Agricultural Pheromones Market Revenue (US$ Mn) and Forecasts, By Type
15.2.1.Sex Pheromones
15.2.2.Aggregation Pheromones
15.2.3.Others
15.3.Middle East and Africa Agricultural Pheromones Market Revenue (US$ Mn) and Forecasts, By Function
15.3.1.Mating Disruption
15.3.2.Detection and Monitoring
15.3.3.Mass Trapping
15.4.Middle East and Africa Agricultural Pheromones Market Revenue (US$ Mn) and Forecasts, By Crop Type
15.4.1.Orchard Crops
15.4.2.Vegetables
15.4.3.Field Crops
15.4.4.Others
15.5.Middle East and Africa Agricultural Pheromones Market Revenue (US$ Mn) and Forecasts, By Mode of Action
15.5.1.Dispensers
15.5.2.Traps
15.5.3.Sprays
15.6.Middle East and Africa Agricultural Pheromones Market Revenue (US$ Mn) and Forecasts, By Country
15.6.1.Saudi Arabia
15.6.1.1.Saudi Arabia Agricultural Pheromones Market Revenue (US$ Mn) and Forecasts, By Type
15.6.1.1.1.Sex Pheromones
15.6.1.1.2.Aggregation Pheromones
15.6.1.1.3.Others
15.6.1.2.Saudi Arabia Agricultural Pheromones Market Revenue (US$ Mn) and Forecasts, By Function
15.6.1.2.1.Mating Disruption
15.6.1.2.2.Detection and Monitoring
15.6.1.2.3.Mass Trapping
15.6.1.3.Saudi Arabia Agricultural Pheromones Market Revenue (US$ Mn) and Forecasts, By Crop Type
15.6.1.3.1.Orchard Crops
15.6.1.3.2.Vegetables
15.6.1.3.3.Field Crops
15.6.1.3.4.Others
15.6.1.4.Saudi Arabia Agricultural Pheromones Market Revenue (US$ Mn) and Forecasts, By Mode of Action
15.6.1.4.1.Dispensers
15.6.1.4.2.Traps
15.6.1.4.3.Sprays
15.6.2.UAE
15.6.2.1.UAE Agricultural Pheromones Market Revenue (US$ Mn) and Forecasts, By Type
15.6.2.1.1.Sex Pheromones
15.6.2.1.2.Aggregation Pheromones
15.6.2.1.3.Others
15.6.2.2.UAE Agricultural Pheromones Market Revenue (US$ Mn) and Forecasts, By Function
15.6.2.2.1.Mating Disruption
15.6.2.2.2.Detection and Monitoring
15.6.2.2.3.Mass Trapping
15.6.2.3.UAE Agricultural Pheromones Market Revenue (US$ Mn) and Forecasts, By Crop Type
15.6.2.3.1.Orchard Crops
15.6.2.3.2.Vegetables
15.6.2.3.3.Field Crops
15.6.2.3.4.Others
15.6.2.4.UAE Agricultural Pheromones Market Revenue (US$ Mn) and Forecasts, By Mode of Action
15.6.2.4.1.Dispensers
15.6.2.4.2.Traps
15.6.2.4.3.Sprays
15.6.3.Egypt
15.6.3.1.Egypt Agricultural Pheromones Market Revenue (US$ Mn) and Forecasts, By Type
15.6.3.1.1.Sex Pheromones
15.6.3.1.2.Aggregation Pheromones
15.6.3.1.3.Others
15.6.3.2.Egypt Agricultural Pheromones Market Revenue (US$ Mn) and Forecasts, By Function
15.6.3.2.1.Mating Disruption
15.6.3.2.2.Detection and Monitoring
15.6.3.2.3.Mass Trapping
15.6.3.3.Egypt Agricultural Pheromones Market Revenue (US$ Mn) and Forecasts, By Crop Type
15.6.3.3.1.Orchard Crops
15.6.3.3.2.Vegetables
15.6.3.3.3.Field Crops
15.6.3.3.4.Others
15.6.3.4.Egypt Agricultural Pheromones Market Revenue (US$ Mn) and Forecasts, By Mode of Action
15.6.3.4.1.Dispensers
15.6.3.4.2.Traps
15.6.3.4.3.Sprays
15.6.4.Kuwait
15.6.4.1.Kuwait Agricultural Pheromones Market Revenue (US$ Mn) and Forecasts, By Type
15.6.4.1.1.Sex Pheromones
15.6.4.1.2.Aggregation Pheromones
15.6.4.1.3.Others
15.6.4.2.Kuwait Agricultural Pheromones Market Revenue (US$ Mn) and Forecasts, By Function
15.6.4.2.1.Mating Disruption
15.6.4.2.2.Detection and Monitoring
15.6.4.2.3.Mass Trapping
15.6.4.3.Kuwait Agricultural Pheromones Market Revenue (US$ Mn) and Forecasts, By Crop Type
15.6.4.3.1.Orchard Crops
15.6.4.3.2.Vegetables
15.6.4.3.3.Field Crops
15.6.4.3.4.Others
15.6.4.4.Kuwait Agricultural Pheromones Market Revenue (US$ Mn) and Forecasts, By Mode of Action
15.6.4.4.1.Dispensers
15.6.4.4.2.Traps
15.6.4.4.3.Sprays
15.6.5.South Africa
15.6.5.1.South Africa Agricultural Pheromones Market Revenue (US$ Mn) and Forecasts, By Type
15.6.5.1.1.Sex Pheromones
15.6.5.1.2.Aggregation Pheromones
15.6.5.1.3.Others
15.6.5.2.South Africa Agricultural Pheromones Market Revenue (US$ Mn) and Forecasts, By Function
15.6.5.2.1.Mating Disruption
15.6.5.2.2.Detection and Monitoring
15.6.5.2.3.Mass Trapping
15.6.5.3.South Africa Agricultural Pheromones Market Revenue (US$ Mn) and Forecasts, By Crop Type
15.6.5.3.1.Orchard Crops
15.6.5.3.2.Vegetables
15.6.5.3.3.Field Crops
15.6.5.3.4.Others
15.6.5.4.South Africa Agricultural Pheromones Market Revenue (US$ Mn) and Forecasts, By Mode of Action
15.6.5.4.1.Dispensers
15.6.5.4.2.Traps
15.6.5.4.3.Sprays
15.6.6.Rest of Middle East & Africa
15.6.6.1.Rest of Middle East & Africa Agricultural Pheromones Market Revenue (US$ Mn) and Forecasts, By Type
15.6.6.1.1.Sex Pheromones
15.6.6.1.2.Aggregation Pheromones
15.6.6.1.3.Others
15.6.6.2.Rest of Middle East & Africa Agricultural Pheromones Market Revenue (US$ Mn) and Forecasts, By Function
15.6.6.2.1.Mating Disruption
15.6.6.2.2.Detection and Monitoring
15.6.6.2.3.Mass Trapping
15.6.6.3.Rest of Middle East & Africa Agricultural Pheromones Market Revenue (US$ Mn) and Forecasts, By Crop Type
15.6.6.3.1.Orchard Crops
15.6.6.3.2.Vegetables
15.6.6.3.3.Field Crops
15.6.6.3.4.Others
15.6.6.4.Rest of Middle East & Africa Agricultural Pheromones Market Revenue (US$ Mn) and Forecasts, By Mode of Action
15.6.6.4.1.Dispensers
15.6.6.4.2.Traps
15.6.6.4.3.Sprays
15.7.Key Segment for Channeling Investments
15.7.1.By Country
15.7.2.By Type
15.7.3.By Function
15.7.4.By Crop Type
15.7.5.By Mode of Action
16.Latin America Agricultural Pheromones Market Analysis and Forecasts, 2024 – 2034
16.1.Overview
16.1.1.Latin America Agricultural Pheromones Market Revenue (US$ Mn)
16.2.Latin America Agricultural Pheromones Market Revenue (US$ Mn) and Forecasts, By Type
16.2.1.Sex Pheromones
16.2.2.Aggregation Pheromones
16.2.3.Others
16.3.Latin America Agricultural Pheromones Market Revenue (US$ Mn) and Forecasts, By Function
16.3.1.Mating Disruption
16.3.2.Detection and Monitoring
16.3.3.Mass Trapping
16.4.Latin America Agricultural Pheromones Market Revenue (US$ Mn) and Forecasts, By Crop Type
16.4.1.Orchard Crops
16.4.2.Vegetables
16.4.3.Field Crops
16.4.4.Others
16.5.Latin America Agricultural Pheromones Market Revenue (US$ Mn) and Forecasts, By Mode of Action
16.5.1.Dispensers
16.5.2.Traps
16.5.3.Sprays
16.6.Latin America Agricultural Pheromones Market Revenue (US$ Mn) and Forecasts, By Country
16.6.1.Brazil
16.6.1.1.Brazil Agricultural Pheromones Market Revenue (US$ Mn) and Forecasts, By Type
16.6.1.1.1.Sex Pheromones
16.6.1.1.2.Aggregation Pheromones
16.6.1.1.3.Others
16.6.1.2.Brazil Agricultural Pheromones Market Revenue (US$ Mn) and Forecasts, By Function
16.6.1.2.1.Mating Disruption
16.6.1.2.2.Detection and Monitoring
16.6.1.2.3.Mass Trapping
16.6.1.3.Brazil Agricultural Pheromones Market Revenue (US$ Mn) and Forecasts, By Crop Type
16.6.1.3.1.Orchard Crops
16.6.1.3.2.Vegetables
16.6.1.3.3.Field Crops
16.6.1.3.4.Others
16.6.1.4.Brazil Agricultural Pheromones Market Revenue (US$ Mn) and Forecasts, By Mode of Action
16.6.1.4.1.Dispensers
16.6.1.4.2.Traps
16.6.1.4.3.Sprays
16.6.2.Argentina
16.6.2.1.Argentina Agricultural Pheromones Market Revenue (US$ Mn) and Forecasts, By Type
16.6.2.1.1.Sex Pheromones
16.6.2.1.2.Aggregation Pheromones
16.6.2.1.3.Others
16.6.2.2.Argentina Agricultural Pheromones Market Revenue (US$ Mn) and Forecasts, By Function
16.6.2.2.1.Mating Disruption
16.6.2.2.2.Detection and Monitoring
16.6.2.2.3.Mass Trapping
16.6.2.3.Argentina Agricultural Pheromones Market Revenue (US$ Mn) and Forecasts, By Crop Type
16.6.2.3.1.Orchard Crops
16.6.2.3.2.Vegetables
16.6.2.3.3.Field Crops
16.6.2.3.4.Others
16.6.2.4.Argentina Agricultural Pheromones Market Revenue (US$ Mn) and Forecasts, By Mode of Action
16.6.2.4.1.Dispensers
16.6.2.4.2.Traps
16.6.2.4.3.Sprays
16.6.3.Rest of Latin America
16.6.3.1.Rest of Latin America Agricultural Pheromones Market Revenue (US$ Mn) and Forecasts, By Type
16.6.3.1.1.Sex Pheromones
16.6.3.1.2.Aggregation Pheromones
16.6.3.1.3.Others
16.6.3.2.Rest of Latin America Agricultural Pheromones Market Revenue (US$ Mn) and Forecasts, By Function
16.6.3.2.1.Mating Disruption
16.6.3.2.2.Detection and Monitoring
16.6.3.2.3.Mass Trapping
16.6.3.3.Rest of Latin America Agricultural Pheromones Market Revenue (US$ Mn) and Forecasts, By Crop Type
16.6.3.3.1.Orchard Crops
16.6.3.3.2.Vegetables
16.6.3.3.3.Field Crops
16.6.3.3.4.Others
16.6.3.4.Rest of Latin America Agricultural Pheromones Market Revenue (US$ Mn) and Forecasts, By Mode of Action
16.6.3.4.1.Dispensers
16.6.3.4.2.Traps
16.6.3.4.3.Sprays
16.7.Key Segment for Channeling Investments
16.7.1.By Country
16.7.2.By Type
16.7.3.By Function
16.7.4.By Crop Type
16.7.5.By Mode of Action
17.Competitive Benchmarking
17.1.Brand Benchmarking
17.2.Market Share Analysis, 2023
17.3.Global Presence and Growth Strategies
17.3.1.Mergers and Acquisitions
17.3.2.Product Launches
17.3.3.Investments Trends
17.3.4.R&D Initiatives
18.Player Profiles
18.1.Biobest Group
18.1.1.Company Details
18.1.2.Company Overview
18.1.3.Product Offerings
18.1.4.Key Developments
18.1.5.Financial Analysis
18.1.6.SWOT Analysis
18.1.7.Business Strategies
18.2.Isagro S.p.A.
18.2.1.Company Details
18.2.2.Company Overview
18.2.3.Product Offerings
18.2.4.Key Developments
18.2.5.Financial Analysis
18.2.6.SWOT Analysis
18.2.7.Business Strategies
18.3.ISCA Global
18.3.1.Company Details
18.3.2.Company Overview
18.3.3.Product Offerings
18.3.4.Key Developments
18.3.5.Financial Analysis
18.3.6.SWOT Analysis
18.3.7.Business Strategies
18.4.Koppert Biological Systems
18.4.1.Company Details
18.4.2.Company Overview
18.4.3.Product Offerings
18.4.4.Key Developments
18.4.5.Financial Analysis
18.4.6.SWOT Analysis
18.4.7.Business Strategies
18.5.Pacific Biocontrol Corporation
18.5.1.Company Details
18.5.2.Company Overview
18.5.3.Product Offerings
18.5.4.Key Developments
18.5.5.Financial Analysis
18.5.6.SWOT Analysis
18.5.7.Business Strategies
18.6.Provivi, Inc.
18.6.1.Company Details
18.6.2.Company Overview
18.6.3.Product Offerings
18.6.4.Key Developments
18.6.5.Financial Analysis
18.6.6.SWOT Analysis
18.6.7.Business Strategies
18.7.Russell IPM
18.7.1.Company Details
18.7.2.Company Overview
18.7.3.Product Offerings
18.7.4.Key Developments
18.7.5.Financial Analysis
18.7.6.SWOT Analysis
18.7.7.Business Strategies
18.8.SEDQ Healthy Crops SL
18.8.1.Company Details
18.8.2.Company Overview
18.8.3.Product Offerings
18.8.4.Key Developments
18.8.5.Financial Analysis
18.8.6.SWOT Analysis
18.8.7.Business Strategies
18.9.Shin-Etsu Chemical Company
18.9.1.Company Details
18.9.2.Company Overview
18.9.3.Product Offerings
18.9.4.Key Developments
18.9.5.Financial Analysis
18.9.6.SWOT Analysis
18.9.7.Business Strategies
18.10.Suterra LLC
18.10.1.Company Details
18.10.2.Company Overview
18.10.3.Product Offerings
18.10.4.Key Developments
18.10.5.Financial Analysis
18.10.6.SWOT Analysis
18.10.7.Business Strategies
18.11.Other Industry Participants
19.Key Findings

.

Note: This ToC is tentative and can be changed according to the research study conducted during the course of report completion.

**Exclusive for Multi-User and Enterprise User.

Global Agricultural Pheromones Market

By Type

  • Sex Pheromones
  • Aggregation Pheromones
  • Others

By Function

  • Mating Disruption
  • Detection & Monitoring
  • Mass Trapping

By Crop Type

  • Orchard Crops
  • Vegetables
  • Field Crops
  • Others

By Mode of Action

  • Dispensers
  • Traps
  • Sprays

By Region

  • North America (U.S., Canada, Mexico, Rest of North America)
  • Europe (France, The UK, Spain, Germany, Italy, Nordic Countries (Denmark, Finland, Iceland, Sweden, Norway), Benelux Union (Belgium, The Netherlands, Luxembourg), Rest of Europe)
  • Asia Pacific (China, Japan, India, New Zealand, Australia, South Korea, Southeast Asia (Indonesia, Thailand, Malaysia, Singapore, Rest of Southeast Asia), Rest of Asia Pacific)
  • Middle East & Africa (Saudi Arabia, UAE, Egypt, Kuwait, South Africa, Rest of Middle East & Africa)
  • Latin America (Brazil, Argentina, Rest of Latin America)


The Niche Research approach encompasses both primary and secondary research methods to provide comprehensive insights. While primary research is the cornerstone of our studies, we also incorporate secondary research sources such as company annual reports, premium industry databases, press releases, industry journals, and white papers.

Within our primary research, we actively engage with various industry stakeholders, conducting paid interviews and surveys. Our meticulous analysis extends to every market participant in major countries, allowing us to thoroughly examine their portfolios, calculate market shares, and segment revenues.

Our data collection primarily focuses on individual countries within our research scope, enabling us to estimate regional market sizes. Typically, we employ a bottom-up approach, meticulously tracking trends in different countries. We analyze growth drivers, constraints, technological innovations, and opportunities for each country, ultimately arriving at regional figures.Our process begins by examining the growth prospects of each country. Building upon these insights, we project growth and trends for the entire region. Finally, we utilize our proprietary model to refine estimations and forecasts.

Our data validation standards are integral to ensuring the reliability and accuracy of our research findings. Here’s a breakdown of our data validation processes and the stakeholders we engage with during our primary research:

  • Supply Side Analysis: We initiate a supply side analysis by directly contacting market participants, through telephonic interviews and questionnaires containing both open-ended and close-ended questions. We gather information on their portfolios, segment revenues, developments, and growth strategies.
  • Demand Side Analysis: To gain insights into adoption trends and consumer preferences, we reach out to target customers and users (non-vendors). This information forms a vital part of the qualitative analysis section of our reports, covering market dynamics, adoption trends, consumer behavior, spending patterns, and other related aspects.
  • Consultant Insights: We tap into the expertise of our partner consultants from around the world to obtain their unique viewpoints and perspectives. Their insights contribute to a well-rounded understanding of the markets under investigation.
  • In-House Validation: To ensure data accuracy and reliability, we conduct cross-validation of data points and information through our in-house team of consultants and utilize advanced data modeling tools for thorough verification.

The forecasts we provide are based on a comprehensive assessment of various factors, including:

  • Market Trends and Past Performance (Last Five Years): We accurately analyze market trends and performance data from preceding five years to identify historical patterns and understand the market’s evolution.
  • Historical Performance and Growth of Market Participants: We assess the historical performance and growth trajectories of key market participants. This analysis provides insights into the competitive landscape and individual company strategies.
  • Market Determinants Impact Analysis (Next Eight Years): We conduct a rigorous analysis of the factors that are projected to influence the market over the next eight years. This includes assessing both internal and external determinants that can shape market dynamics.
  • Drivers and Challenges for the Forecast Period:Identify the factors expected to drive market growth during the forecast period, as well as the challenges that the industry may face. This analysis aids in deriving an accurate growth rate projection.
  • New Acquisitions, Collaborations, or Partnerships: We keep a close watch on any new acquisitions, collaborations, or partnerships within the industry. These developments can have a significant impact on market dynamics and competitiveness.
  • Macro and Micro Factors Analysis:A thorough examination of both macro-level factors (e.g., economic trends, regulatory changes) and micro-level factors (e.g., technological advancements, consumer preferences) that may influence the market during the forecast period.
  • End-User Sentiment Analysis: To understand the market from the end-user perspective, we conduct sentiment analysis. This involves assessing the sentiment, preferences, and feedback of the end-users, which can provide valuable insights into market trends.
  • Perspective of Primary Participants: Insights gathered directly from primary research participants play a crucial role in shaping our forecasts. Their perspectives and experiences provide valuable qualitative data.
  • Year-on-Year Growth Trend: We utilize a year-on-year growth trend based on historical market growth and expected future trends. This helps in formulating our growth projections, aligning them with the market’s historical performance.

Research process adopted by TNR involves multiple stages, including data collection, validation, quality checks, and presentation. It’s crucial that the data and information we provide add value to your existing market understanding and expertise. We have also established partnerships with business consulting, research, and survey organizations across regions and globally to collaborate on regional analysis and data validation, ensuring the highest level of accuracy and reliability in our reports.


Procure Comprehensive Study of

Global Agricultural Pheromones Market

Online Only

  • Online Access
  • Read Only File
  • Validity 3 Months
  • Print, Copy, Paste & Download
  • PPT, Excel
  • Cost-Free Report in the Next Update
$3300
Buy Now

Single User

  • Access to One User on One System
  • Read Only File
  • Validity 6 Months
  • Limited Print,Copy, Paste
  • PPT, Excel
  • Cost-Free Report in the Next Update
$4200
Buy Now

Multi User

  • Access to Fiver Users
  • PDF File
  • Validity 1 Year
  • Upto FivePrints
  • Cost-Free Report in the Next Update
  • PPT, Excel
$6000
Buy Now

Enterprise User

  • Access to Unlimited Users
  • PDF, PPT, Excel
  • Unlimited Validity, Prints&Downloads
  • 1 Hour Cost-Free & Dedicated Analyst Support
  • 10% Cost-Free Customization
  • Cost-Free Report Update Twice in a Year
  • Recommendations for Business Strategies
  • Authorization to Quote TNR, The Niche Research
$7300
Buy Now

Library Access

  • Online Access to Content Publications
  • Access Player Profiles Online
  • Get Immediate Access to Newly Added Content
  • Acquire 12 PDF Downloads
  • Acquire 5 Excel Data Sets
  • Gain Access to 290+ PDFs of Company Profiles
  • Round-the-clock Email and Phone Assistance
  • Dashboard Usage and Trends
  • Renewal & Upgrade Assistance
  • Assessing Customization Options and Alerts for New Reports
$10788
Buy Now
*Taxes/Fees, if applicable will be added during checkout. All prices in USD

Why TNR The Niche Research?

  • Unwavering Commitment to Excellence

  • Veteran Team of Researchers

  • Accurate and Timely Insights

  • Ethical Practices and Customized Service

  • Uninterrupted Availability Around the Clock

Scroll to Top