Global E-Prescription Solutions Market, By Offering, By Deployment Model, By Delivery Mode, By End User, By Region & Segmental Insights Trends and Forecast, 2024 – 2034

  • Industry: Healthcare
  • Report ID: TNR-110-1224
  • Number of Pages: 420
  • Table/Charts : Yes
  • July, 2024
  • Base Year : 2024
  • No. of Companies : 10+
  • No. of Countries : 29
  • Views : 10077
  • Covid Impact Covered: Yes
  • War Impact Covered: Yes
  • Formats : PDF, Excel, PPT

E-Prescription Solutions refer to digital systems used by healthcare providers to write, send, and manage prescriptions electronically. These solutions replace traditional paper prescriptions, aiming to streamline the process of prescribing medication and reduce errors.  The e-prescription solutions market is experiencing robust growth, driven by the increasing demand for streamlined healthcare processes and enhanced patient safety. Key trends shaping the market include the rising adoption of electronic health records (EHR) and the growing emphasis on reducing medication errors through advanced digital solutions.

The proliferation of cloud-based technologies and the integration of artificial intelligence (AI) are further fuelling market expansion by improving prescription accuracy and operational efficiency. Government initiatives and incentives supporting digital health transformation are accelerating market growth. Increased consumer preference for convenient, paperless transactions and the need for better regulatory compliance are also significant growth drivers. Collectively, these factors are poised to drive sustained development and innovation within the e-prescription solutions sector. In Terms of Revenue, the Global E-Prescription Solutions Market was Worth US$ 3.7 Bn in 2023, Anticipated to Witness CAGR of 23.4% During 2024 – 2034.

Trends in the Global E-Prescription Solutions Market

  • Integration of Artificial Intelligence (AI) and Machine Learning: AI algorithms are enhancing prescription accuracy by analyzing patient data and predicting potential drug interactions, allergies, and adherence issues. Machine learning models continuously improve the system’s efficiency by learning from historical prescription data, thus reducing errors and optimizing medication management. This advanced integration not only increases the reliability of e-prescription systems but also supports healthcare providers in making more informed decisions, ultimately improving patient outcomes and streamlining the prescription process.
  • Growing Adoption of Cloud-Based Solutions: Cloud-based platforms offer healthcare providers real-time access to patient records, prescription histories, and medication management tools from any location, facilitating better coordination among healthcare teams. Additionally, these solutions enhance data security and compliance with regulatory standards through advanced encryption and backup protocols. The scalability of cloud infrastructure allows for cost-effective expansion and integration with other digital health tools, making it an attractive option for healthcare organizations seeking to improve efficiency and patient care.

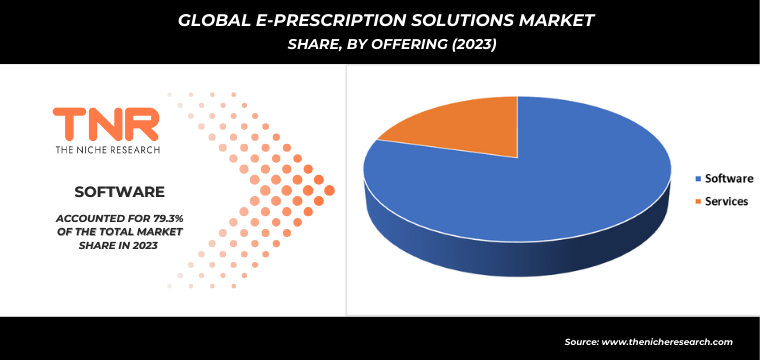
Software by offering category has emerged as a dominant segment in the global e-prescription solutions market due to its pivotal role in enhancing the efficiency and accuracy of prescription processes. E-prescription software provides a comprehensive suite of features including electronic transmission of prescriptions, patient medication history access, and integration with electronic health records (EHR). These capabilities streamline workflows, reduce errors associated with manual prescription methods, and improve medication management. The software’s scalability and adaptability to various healthcare settings—ranging from small clinics to large hospitals—further contribute to its dominance. Additionally, advancements in software technology, such as the incorporation of AI and machine learning, are driving innovation and increasing the software’s effectiveness in managing complex prescribing tasks.

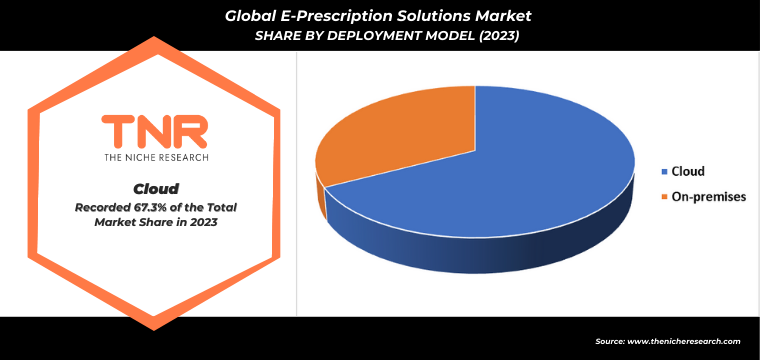
In 2023, on-premises segment solidified its position as the second-largest deployment model category within the global e-prescription solutions market. This model remains popular due to its control and security advantages, allowing healthcare organizations to manage and store data within their own infrastructure. On-premises solutions offer customized features tailored to specific organizational needs and comply with stringent regulatory requirements. Despite the growing trend towards cloud-based models, the on-premises deployment provides a reliable option for institutions prioritizing data sovereignty and integration with existing legacy systems, thereby maintaining its significant market share.

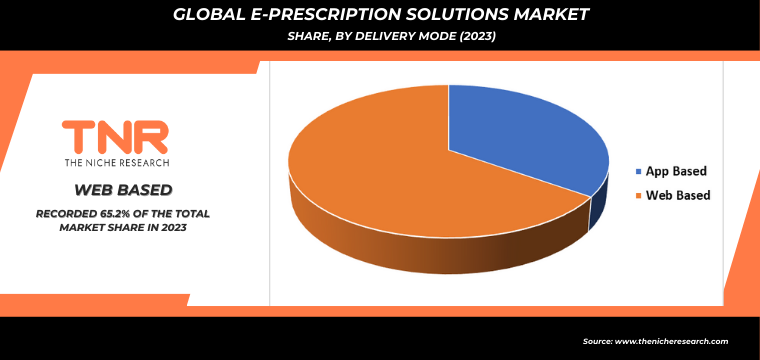
Web based segment, categorized by delivery mode, has exerted significant dominance over the global e-prescription solutions market. This dominance stems from the segment’s ability to offer flexible, scalable, and cost-effective solutions accessible via the internet. Web-based e-prescription systems enable healthcare providers to access real-time patient data and manage prescriptions from any location with an internet connection, facilitating improved coordination and efficiency. Additionally, these systems often feature automatic updates and integration with other digital health tools, reducing maintenance costs and enhancing functionality. The convenience of remote access, coupled with the ease of integration and lower upfront costs compared to on-premises solutions, has made web-based deployment the preferred choice for many healthcare organizations, further cementing its leading position in the market.

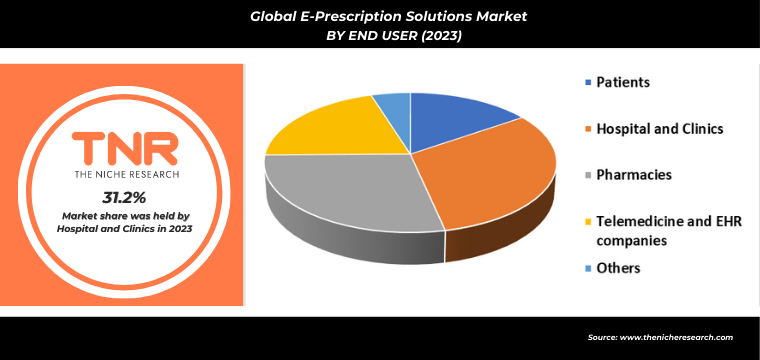
By end user, pharmacies segment is anticipated to grow fastest over the forecast timeline in global e-prescription solutions market. This growth is driven by the increasing adoption of digital solutions for streamlining prescription processing, reducing errors, and enhancing patient service. Pharmacies are leveraging e-prescription systems to efficiently manage and process a high volume of prescriptions, integrate with insurance and billing systems, and access real-time medication histories. The shift towards electronic methods improves operational efficiency and accuracy, making it an attractive option for pharmacies looking to modernize their operations and meet rising patient expectations.

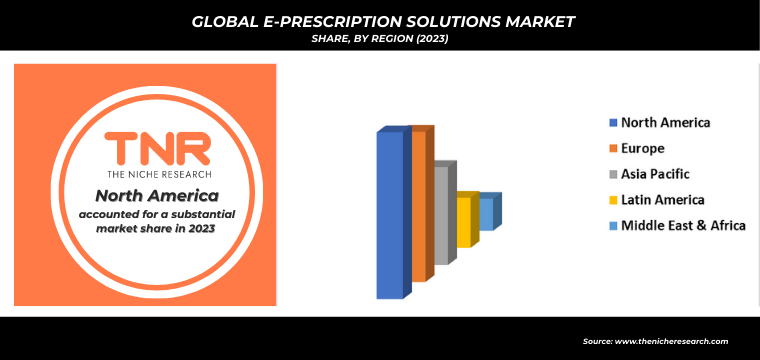
In 2023, North America solidified its dominance in the global e-prescription solutions market, contributing a revenue share of 33.6%. This dominance is attributed to several factors, including advanced healthcare infrastructure, high adoption rates of digital health technologies, and supportive government initiatives aimed at enhancing healthcare efficiency and reducing errors. The region’s strong emphasis on regulatory compliance and data security further drives the adoption of e-prescription solutions. The presence of leading technology providers and a robust healthcare system that supports the integration of electronic health records (EHR) contribute to North America’s leading position. This trend underscores North America’s role as a key player in shaping the future of e-prescription technology.

Competitive Landscape

Some of the players operating in the e-prescription solutions market are

  • Allscripts Healthcare, LLC
  • Athenahealth
  • Cerner Corporation (Oracle)
  • Change Healthcare
  • DrFirst
  • Epic Systems Corporation
  • McKesson Corporation
  • Networking Technology, Inc. (RXNT)
  • NXGN Management, LLC
  • Practice Fusion, Inc.
  • Surescripts
  • Other Industry Participants

Global E-Prescription Solutions Market Scope

Report Specifications Details
Market Revenue in 2023 US$ 3.7 Bn
Market Size Forecast by 2034 US$ 37.2 Bn
Growth Rate (CAGR) 23.4%
Historic Data 2016 – 2022
Base Year for Estimation 2023
Forecast Period 2024 – 2034
Report Inclusions Market Size & Estimates, Market Dynamics, Competitive Scenario, Trends, Growth Factors, Market Determinants, Key Investment Segmentation, Product/Service/Solutions Benchmarking
Segments Covered By Offering, By Deployment Model, By Delivery Mode, By End User, By Region
Regions Covered North America, Europe, Asia Pacific, Middle East & Africa, Latin America
Countries Covered U.S., Canada, Mexico, Rest of North America,  France, The UK, Spain, Germany, Italy, Nordic Countries (Denmark, Finland, Iceland, Sweden, Norway), Benelux Union (Belgium, The Netherlands, Luxembourg), Rest of Europe,  China, Japan, India, New Zealand, Australia, South Korea, Southeast Asia (Indonesia, Thailand, Malaysia, Singapore, Rest of Southeast Asia), Rest of Asia Pacific,  Saudi Arabia, UAE, Egypt, Kuwait, South Africa, Rest of Middle East & Africa,  Brazil, Argentina, Rest of Latin America
Key Players Allscripts Healthcare, LLC, Athenahealth, Cerner Corporation (Oracle), Change Healthcare, DrFirst, Epic Systems Corporation, McKesson Corporation, Networking Technology, Inc. (RXNT), NXGN Management, LLC, Practice Fusion, Inc., Surescripts
Customization Scope Customization allows for the inclusion/modification of content pertaining to geographical regions, countries, and specific market segments.
Pricing & Procurement Options Explore purchase options tailored to your specific research requirements
Contact Details Consult With Our Expert

Japan (Toll-Free):  +81 663-386-8111

South Korea (Toll-Free):  +82-808- 703-126

Saudi Arabia (Toll-Free):  +966 800-850-1643

United Kingdom: +44 753-710-5080

United States: +1 302-232-5106

E-mail:  askanexpert@thenicheresearch.com


Global E-Prescription Solutions Market

By Offering

  • Software
    • Integrated Solutions
    • Standalone Solutions
  • Services

By Deployment Model

  • Cloud
  • On-premises

By Delivery Mode

  • App Based
  • Web Based

By End User

  • Patients
  • Hospital and Clinics
  • Pharmacies
  • Telemedicine and EHR companies
  • Others

By Region

  • North America (U.S., Canada, Mexico, Rest of North America)
  • Europe (France, The UK, Spain, Germany, Italy, Nordic Countries (Denmark, Finland, Iceland, Sweden, Norway), Benelux Union (Belgium, The Netherlands, Luxembourg), Rest of Europe)
  • Asia Pacific (China, Japan, India, New Zealand, Australia, South Korea, Southeast Asia (Indonesia, Thailand, Malaysia, Singapore, Rest of Southeast Asia), Rest of Asia Pacific)
  • Middle East & Africa (Saudi Arabia, UAE, Egypt, Kuwait, South Africa, Rest of Middle East & Africa)
  • Latin America (Brazil, Argentina, Rest of Latin America)

Report Layout:

Table of Contents

.

1.Market Scope
1.1.Market Segmentation
1.2.Years Considered
1.2.1.Historic Years: 2016 – 2022
1.2.2.Base Year: 2023
1.2.3.Forecast Years: 2024 – 2034
2.Key Target Audiences
3.Research Methodology
3.1.Primary Research
3.1.1.Research Questionnaire
3.1.2.Global Percentage Breakdown
3.1.3.Primary Interviews: Key Opinion Leaders (KOLs)
3.2.Secondary Research
3.2.1.Paid Databases
3.2.2.Secondary Sources
3.3.Market Size Estimates
3.3.1.Top-Down Approach
3.3.2.Bottom-Up Approach
3.4.Data Triangulation Methodology
3.5.Research Assumptions
4.Recommendations and Insights from TNR’s Perspective**
5.Holistic Overview of E-prescription solutions Market
6.Market Synopsis: E-prescription solutions Market
7.E-prescription solutions Market Analysis: Qualitative Perspective
7.1.Introduction
7.1.1.Product Definition
7.1.2.Industry Development
7.2.Market Dynamics
7.2.1.Drivers
7.2.2.Restraints
7.2.3.Opportunities
7.2.4.Challenges
7.3.Trends in E-prescription solutions Market
7.4.Market Determinants Radar Chart
7.5.Macro-Economic and Micro-Economic Indicators: E-prescription solutions Market
7.6.Industry Gross Margin Overview
7.7.Porter’s Five Force Analysis
7.8.Impact of Covid-19 on E-prescription solutions Market
7.9.PESTEL Analysis
7.10.Value Chain Analysis
7.11.Pricing Analysis, By Region (2023)
7.11.1.North America
7.11.2.Europe
7.11.3.Asia Pacific
7.11.4.Middle East and Africa
7.11.5.Latin America
8.Global E-prescription solutions Market Analysis and Forecasts, 2024 – 2034
8.1.Overview
8.1.1.Global E-prescription solutions Market Revenue (US$ Mn)
8.2.Global E-prescription solutions Market Revenue (US$ Mn) and Forecasts, By Offering
8.2.1.Software (Definition, Market Estimation and Penetration, 2016 – 2023, Market Estimation (2016 – 2023), Market Forecast (2024 – 2034), Compound Annual Growth Rate (CAGR), Regional Bifurcation (North America, Europe, Asia Pacific, Middle East and Africa, Latin America) and Information on Integrated Solutions, Standalone Solutions)
8.2.1.1.Integrated Solutions
8.2.1.2.Standalone Solutions
8.2.2.Services
8.2.2.1.Definition
8.2.2.2.Market Estimation and Penetration, 2016 – 2023
8.2.2.3.Market Forecast, 2024 – 2034
8.2.2.4.Compound Annual Growth Rate (CAGR)
8.2.2.5.Regional Bifurcation
8.2.2.5.1.North America
8.2.2.5.1.1.Market Estimation, 2016 – 2023
8.2.2.5.1.2.Market Forecast, 2024 – 2034
8.2.2.5.2.Europe
8.2.2.5.2.1.Market Estimation, 2016 – 2023
8.2.2.5.2.2.Market Forecast, 2024 – 2034
8.2.2.5.3.Asia Pacific
8.2.2.5.3.1.Market Estimation, 2016 – 2023
8.2.2.5.3.2.Market Forecast, 2024 – 2034
8.2.2.5.4.Middle East and Africa
8.2.2.5.4.1.Market Estimation, 2016 – 2023
8.2.2.5.4.2.Market Forecast, 2024 – 2034
8.2.2.5.5.Latin America
8.2.2.5.5.1.Market Estimation, 2016 – 2023
8.2.2.5.5.2.Market Forecast, 2024 – 2034
8.3.Key Segment for Channeling Investments
8.3.1.By Offering
9.Global E-prescription solutions Market Analysis and Forecasts, 2024 – 2034
9.1.Overview
9.2.Global E-prescription solutions Market Revenue (US$ Mn) and Forecasts, By Deployment Model
9.2.1.Cloud
9.2.1.1.Definition
9.2.1.2.Market Estimation and Penetration, 2016 – 2023
9.2.1.3.Market Forecast, 2024 – 2034
9.2.1.4.Compound Annual Growth Rate (CAGR)
9.2.1.5.Regional Bifurcation
9.2.1.5.1.North America
9.2.1.5.1.1.Market Estimation, 2016 – 2023
9.2.1.5.1.2.Market Forecast, 2024 – 2034
9.2.1.5.2.Europe
9.2.1.5.2.1.Market Estimation, 2016 – 2023
9.2.1.5.2.2.Market Forecast, 2024 – 2034
9.2.1.5.3.Asia Pacific
9.2.1.5.3.1.Market Estimation, 2016 – 2023
9.2.1.5.3.2.Market Forecast, 2024 – 2034
9.2.1.5.4.Middle East and Africa
9.2.1.5.4.1.Market Estimation, 2016 – 2023
9.2.1.5.4.2.Market Forecast, 2024 – 2034
9.2.1.5.5.Latin America
9.2.1.5.5.1.Market Estimation, 2016 – 2023
9.2.1.5.5.2.Market Forecast, 2024 – 2034
9.2.2.On-premises
9.2.2.1.Definition
9.2.2.2.Market Estimation and Penetration, 2016 – 2023
9.2.2.3.Market Forecast, 2024 – 2034
9.2.2.4.Compound Annual Growth Rate (CAGR)
9.2.2.5.Regional Bifurcation
9.2.2.5.1.North America
9.2.2.5.1.1.Market Estimation, 2016 – 2023
9.2.2.5.1.2.Market Forecast, 2024 – 2034
9.2.2.5.2.Europe
9.2.2.5.2.1.Market Estimation, 2016 – 2023
9.2.2.5.2.2.Market Forecast, 2024 – 2034
9.2.2.5.3.Asia Pacific
9.2.2.5.3.1.Market Estimation, 2016 – 2023
9.2.2.5.3.2.Market Forecast, 2024 – 2034
9.2.2.5.4.Middle East and Africa
9.2.2.5.4.1.Market Estimation, 2016 – 2023
9.2.2.5.4.2.Market Forecast, 2024 – 2034
9.2.2.5.5.Latin America
9.2.2.5.5.1.Market Estimation, 2016 – 2023
9.2.2.5.5.2.Market Forecast, 2024 – 2034
9.3.Key Segment for Channeling Investments
9.3.1.By Deployment Model
10.Global E-prescription solutions Market Analysis and Forecasts, 2024 – 2034
10.1.Overview
10.2.Global E-prescription solutions Market Revenue (US$ Mn) and Forecasts, By Delivery Mode
10.2.1.App Based
10.2.1.1.Definition
10.2.1.2.Market Estimation and Penetration, 2016 – 2023
10.2.1.3.Market Forecast, 2024 – 2034
10.2.1.4.Compound Annual Growth Rate (CAGR)
10.2.1.5.Regional Bifurcation
10.2.1.5.1.North America
10.2.1.5.1.1.Market Estimation, 2016 – 2023
10.2.1.5.1.2.Market Forecast, 2024 – 2034
10.2.1.5.2.Europe
10.2.1.5.2.1.Market Estimation, 2016 – 2023
10.2.1.5.2.2.Market Forecast, 2024 – 2034
10.2.1.5.3.Asia Pacific
10.2.1.5.3.1.Market Estimation, 2016 – 2023
10.2.1.5.3.2.Market Forecast, 2024 – 2034
10.2.1.5.4.Middle East and Africa
10.2.1.5.4.1.Market Estimation, 2016 – 2023
10.2.1.5.4.2.Market Forecast, 2024 – 2034
10.2.1.5.5.Latin America
10.2.1.5.5.1.Market Estimation, 2016 – 2023
10.2.1.5.5.2.Market Forecast, 2024 – 2034
10.2.2.Web Based
10.2.2.1.Definition
10.2.2.2.Market Estimation and Penetration, 2016 – 2023
10.2.2.3.Market Forecast, 2024 – 2034
10.2.2.4.Compound Annual Growth Rate (CAGR)
10.2.2.5.Regional Bifurcation
10.2.2.5.1.North America
10.2.2.5.1.1.Market Estimation, 2016 – 2023
10.2.2.5.1.2.Market Forecast, 2024 – 2034
10.2.2.5.2.Europe
10.2.2.5.2.1.Market Estimation, 2016 – 2023
10.2.2.5.2.2.Market Forecast, 2024 – 2034
10.2.2.5.3.Asia Pacific
10.2.2.5.3.1.Market Estimation, 2016 – 2023
10.2.2.5.3.2.Market Forecast, 2024 – 2034
10.2.2.5.4.Middle East and Africa
10.2.2.5.4.1.Market Estimation, 2016 – 2023
10.2.2.5.4.2.Market Forecast, 2024 – 2034
10.2.2.5.5.Latin America
10.2.2.5.5.1.Market Estimation, 2016 – 2023
10.2.2.5.5.2.Market Forecast, 2024 – 2034
10.3.Key Segment for Channeling Investments
10.3.1.By Delivery Mode
11.Global E-prescription solutions Market Analysis and Forecasts, 2024 – 2034
11.1.Overview
11.2.Global E-prescription solutions Market Revenue (US$ Mn) and Forecasts, By End User
11.2.1.Patients
11.2.1.1.Definition
11.2.1.2.Market Estimation and Penetration, 2016 – 2023
11.2.1.3.Market Forecast, 2024 – 2034
11.2.1.4.Compound Annual Growth Rate (CAGR)
11.2.1.5.Regional Bifurcation
11.2.1.5.1.North America
11.2.1.5.1.1.Market Estimation, 2016 – 2023
11.2.1.5.1.2.Market Forecast, 2024 – 2034
11.2.1.5.2.Europe
11.2.1.5.2.1.Market Estimation, 2016 – 2023
11.2.1.5.2.2.Market Forecast, 2024 – 2034
11.2.1.5.3.Asia Pacific
11.2.1.5.3.1.Market Estimation, 2016 – 2023
11.2.1.5.3.2.Market Forecast, 2024 – 2034
11.2.1.5.4.Middle East and Africa
11.2.1.5.4.1.Market Estimation, 2016 – 2023
11.2.1.5.4.2.Market Forecast, 2024 – 2034
11.2.1.5.5.Latin America
11.2.1.5.5.1.Market Estimation, 2016 – 2023
11.2.1.5.5.2.Market Forecast, 2024 – 2034
11.2.2.Hospital and Clinics
11.2.2.1.Definition
11.2.2.2.Market Estimation and Penetration, 2016 – 2023
11.2.2.3.Market Forecast, 2024 – 2034
11.2.2.4.Compound Annual Growth Rate (CAGR)
11.2.2.5.Regional Bifurcation
11.2.2.5.1.North America
11.2.2.5.1.1.Market Estimation, 2016 – 2023
11.2.2.5.1.2.Market Forecast, 2024 – 2034
11.2.2.5.2.Europe
11.2.2.5.2.1.Market Estimation, 2016 – 2023
11.2.2.5.2.2.Market Forecast, 2024 – 2034
11.2.2.5.3.Asia Pacific
11.2.2.5.3.1.Market Estimation, 2016 – 2023
11.2.2.5.3.2.Market Forecast, 2024 – 2034
11.2.2.5.4.Middle East and Africa
11.2.2.5.4.1.Market Estimation, 2016 – 2023
11.2.2.5.4.2.Market Forecast, 2024 – 2034
11.2.2.5.5.Latin America
11.2.2.5.5.1.Market Estimation, 2016 – 2023
11.2.2.5.5.2.Market Forecast, 2024 – 2034
11.2.3.Pharmacies
11.2.3.1.Definition
11.2.3.2.Market Estimation and Penetration, 2016 – 2023
11.2.3.3.Market Forecast, 2024 – 2034
11.2.3.4.Compound Annual Growth Rate (CAGR)
11.2.3.5.Regional Bifurcation
11.2.3.5.1.North America
11.2.3.5.1.1.Market Estimation, 2016 – 2023
11.2.3.5.1.2.Market Forecast, 2024 – 2034
11.2.3.5.2.Europe
11.2.3.5.2.1.Market Estimation, 2016 – 2023
11.2.3.5.2.2.Market Forecast, 2024 – 2034
11.2.3.5.3.Asia Pacific
11.2.3.5.3.1.Market Estimation, 2016 – 2023
11.2.3.5.3.2.Market Forecast, 2024 – 2034
11.2.3.5.4.Middle East and Africa
11.2.3.5.4.1.Market Estimation, 2016 – 2023
11.2.3.5.4.2.Market Forecast, 2024 – 2034
11.2.3.5.5.Latin America
11.2.3.5.5.1.Market Estimation, 2016 – 2023
11.2.3.5.5.2.Market Forecast, 2024 – 2034
11.2.4.Telemedicine and EHR companies
11.2.4.1.Definition
11.2.4.2.Market Estimation and Penetration, 2016 – 2023
11.2.4.3.Market Forecast, 2024 – 2034
11.2.4.4.Compound Annual Growth Rate (CAGR)
11.2.4.5.Regional Bifurcation
11.2.4.5.1.North America
11.2.4.5.1.1.Market Estimation, 2016 – 2023
11.2.4.5.1.2.Market Forecast, 2024 – 2034
11.2.4.5.2.Europe
11.2.4.5.2.1.Market Estimation, 2016 – 2023
11.2.4.5.2.2.Market Forecast, 2024 – 2034
11.2.4.5.3.Asia Pacific
11.2.4.5.3.1.Market Estimation, 2016 – 2023
11.2.4.5.3.2.Market Forecast, 2024 – 2034
11.2.4.5.4.Middle East and Africa
11.2.4.5.4.1.Market Estimation, 2016 – 2023
11.2.4.5.4.2.Market Forecast, 2024 – 2034
11.2.4.5.5.Latin America
11.2.4.5.5.1.Market Estimation, 2016 – 2023
11.2.4.5.5.2.Market Forecast, 2024 – 2034
11.2.5.Others
11.2.5.1.Definition
11.2.5.2.Market Estimation and Penetration, 2016 – 2023
11.2.5.3.Market Forecast, 2024 – 2034
11.2.5.4.Compound Annual Growth Rate (CAGR)
11.2.5.5.Regional Bifurcation
11.2.5.5.1.North America
11.2.5.5.1.1.Market Estimation, 2016 – 2023
11.2.5.5.1.2.Market Forecast, 2024 – 2034
11.2.5.5.2.Europe
11.2.5.5.2.1.Market Estimation, 2016 – 2023
11.2.5.5.2.2.Market Forecast, 2024 – 2034
11.2.5.5.3.Asia Pacific
11.2.5.5.3.1.Market Estimation, 2016 – 2023
11.2.5.5.3.2.Market Forecast, 2024 – 2034
11.2.5.5.4.Middle East and Africa
11.2.5.5.4.1.Market Estimation, 2016 – 2023
11.2.5.5.4.2.Market Forecast, 2024 – 2034
11.2.5.5.5.Latin America
11.2.5.5.5.1.Market Estimation, 2016 – 2023
11.2.5.5.5.2.Market Forecast, 2024 – 2034
11.3.Key Segment for Channeling Investments
11.3.1.By End User
12.North America E-prescription solutions Market Analysis and Forecasts, 2024 – 2034
12.1.Overview
12.1.1.North America E-prescription solutions Market Revenue (US$ Mn)
12.2.North America E-prescription solutions Market Revenue (US$ Mn) and Forecasts, By Offering
12.2.1.Software
12.2.1.1.Integrated Solutions
12.2.1.2.Standalone Solutions
12.2.2.Services
12.3.North America E-prescription solutions Market Revenue (US$ Mn) and Forecasts, By Deployment Model
12.3.1.Cloud
12.3.2.On-premises
12.4.North America E-prescription solutions Market Revenue (US$ Mn) and Forecasts, By Delivery Mode
12.4.1.App Based
12.4.2.Web Based
12.5.North America E-prescription solutions Market Revenue (US$ Mn) and Forecasts, By End User
12.5.1.Patients
12.5.2.Hospital and Clinics
12.5.3.Pharmacies
12.5.4.Telemedicine and EHR companies
12.5.5.Others
12.6.North America E-prescription solutions Market Revenue (US$ Mn) and Forecasts, By Country
12.6.1.U.S
12.6.1.1.U.S E-prescription solutions Market Revenue (US$ Mn) and Forecasts, By Offering
12.6.1.1.1.Software
12.6.1.1.1.1.Integrated Solutions
12.6.1.1.1.2.Standalone Solutions
12.6.1.1.2.Services
12.6.1.2.U.S E-prescription solutions Market Revenue (US$ Mn) and Forecasts, By Deployment Model
12.6.1.2.1.Cloud
12.6.1.2.2.On-premises
12.6.1.3.U.S E-prescription solutions Market Revenue (US$ Mn) and Forecasts, By Delivery Mode
12.6.1.3.1.App Based
12.6.1.3.2.Web Based
12.6.1.4.U.S E-prescription solutions Market Revenue (US$ Mn) and Forecasts, By End User
12.6.1.4.1.Patients
12.6.1.4.2.Hospital and Clinics
12.6.1.4.3.Pharmacies
12.6.1.4.4.Telemedicine and EHR companies
12.6.1.4.5.Others
12.6.2.Canada
12.6.2.1.Canada E-prescription solutions Market Revenue (US$ Mn) and Forecasts, By Offering
12.6.2.1.1.Software
12.6.2.1.1.1.Integrated Solutions
12.6.2.1.1.2.Standalone Solutions
12.6.2.1.2.Services
12.6.2.2.Canada E-prescription solutions Market Revenue (US$ Mn) and Forecasts, By Deployment Model
12.6.2.2.1.Cloud
12.6.2.2.2.On-premises
12.6.2.3.Canada E-prescription solutions Market Revenue (US$ Mn) and Forecasts, By Delivery Mode
12.6.2.3.1.App Based
12.6.2.3.2.Web Based
12.6.2.4.Canada E-prescription solutions Market Revenue (US$ Mn) and Forecasts, By End User
12.6.2.4.1.Patients
12.6.2.4.2.Hospital and Clinics
12.6.2.4.3.Pharmacies
12.6.2.4.4.Telemedicine and EHR companies
12.6.2.4.5.Others
12.6.3.Mexico
12.6.3.1.Mexico E-prescription solutions Market Revenue (US$ Mn) and Forecasts, By Offering
12.6.3.1.1.Software
12.6.3.1.1.1.Integrated Solutions
12.6.3.1.1.2.Standalone Solutions
12.6.3.1.2.Services
12.6.3.2.Mexico E-prescription solutions Market Revenue (US$ Mn) and Forecasts, By Deployment Model
12.6.3.2.1.Cloud
12.6.3.2.2.On-premises
12.6.3.3.Mexico E-prescription solutions Market Revenue (US$ Mn) and Forecasts, By Delivery Mode
12.6.3.3.1.App Based
12.6.3.3.2.Web Based
12.6.3.4.Mexico E-prescription solutions Market Revenue (US$ Mn) and Forecasts, By End User
12.6.3.4.1.Patients
12.6.3.4.2.Hospital and Clinics
12.6.3.4.3.Pharmacies
12.6.3.4.4.Telemedicine and EHR companies
12.6.3.4.5.Others
12.6.4.Rest of North America
12.6.4.1.Rest of North America E-prescription solutions Market Revenue (US$ Mn) and Forecasts, By Offering
12.6.4.1.1.Software
12.6.4.1.1.1.Integrated Solutions
12.6.4.1.1.2.Standalone Solutions
12.6.4.1.2.Services
12.6.4.2.Rest of North America E-prescription solutions Market Revenue (US$ Mn) and Forecasts, By Deployment Model
12.6.4.2.1.Cloud
12.6.4.2.2.On-premises
12.6.4.3.Rest of North America E-prescription solutions Market Revenue (US$ Mn) and Forecasts, By Delivery Mode
12.6.4.3.1.App Based
12.6.4.3.2.Web Based
12.6.4.4.Rest of North America E-prescription solutions Market Revenue (US$ Mn) and Forecasts, By End User
12.6.4.4.1.Patients
12.6.4.4.2.Hospital and Clinics
12.6.4.4.3.Pharmacies
12.6.4.4.4.Telemedicine and EHR companies
12.6.4.4.5.Others
12.7.Key Segment for Channeling Investments
12.7.1.By Country
12.7.2.By Offering
12.7.3.By Deployment Model
12.7.4.By Delivery Mode
12.7.5.By End User
13.Europe E-prescription solutions Market Analysis and Forecasts, 2024 – 2034
13.1.Overview
13.1.1.Europe E-prescription solutions Market Revenue (US$ Mn)
13.2.Europe E-prescription solutions Market Revenue (US$ Mn) and Forecasts, By Offering
13.2.1.Software
13.2.1.1.Integrated Solutions
13.2.1.2.Standalone Solutions
13.2.2.Services
13.3.Europe E-prescription solutions Market Revenue (US$ Mn) and Forecasts, By Deployment Model
13.3.1.Cloud
13.3.2.On-premises
13.4.Europe E-prescription solutions Market Revenue (US$ Mn) and Forecasts, By Delivery Mode
13.4.1.App Based
13.4.2.Web Based
13.5.Europe E-prescription solutions Market Revenue (US$ Mn) and Forecasts, By End User
13.5.1.Patients
13.5.2.Hospital and Clinics
13.5.3.Pharmacies
13.5.4.Telemedicine and EHR companies
13.5.5.Others
13.6.Europe E-prescription solutions Market Revenue (US$ Mn) and Forecasts, By Country
13.6.1.France
13.6.1.1.France E-prescription solutions Market Revenue (US$ Mn) and Forecasts, By Offering
13.6.1.1.1.Software
13.6.1.1.1.1.Integrated Solutions
13.6.1.1.1.2.Standalone Solutions
13.6.1.1.2.Services
13.6.1.2.France E-prescription solutions Market Revenue (US$ Mn) and Forecasts, By Deployment Model
13.6.1.2.1.Cloud
13.6.1.2.2.On-premises
13.6.1.3.France E-prescription solutions Market Revenue (US$ Mn) and Forecasts, By Delivery Mode
13.6.1.3.1.App Based
13.6.1.3.2.Web Based
13.6.1.4.France E-prescription solutions Market Revenue (US$ Mn) and Forecasts, By End User
13.6.1.4.1.Patients
13.6.1.4.2.Hospital and Clinics
13.6.1.4.3.Pharmacies
13.6.1.4.4.Telemedicine and EHR companies
13.6.1.4.5.Others
13.6.2.The UK
13.6.2.1.The UK E-prescription solutions Market Revenue (US$ Mn) and Forecasts, By Offering
13.6.2.1.1.Software
13.6.2.1.1.1.Integrated Solutions
13.6.2.1.1.2.Standalone Solutions
13.6.2.1.2.Services
13.6.2.2.The UK E-prescription solutions Market Revenue (US$ Mn) and Forecasts, By Deployment Model
13.6.2.2.1.Cloud
13.6.2.2.2.On-premises
13.6.2.3.The UK E-prescription solutions Market Revenue (US$ Mn) and Forecasts, By Delivery Mode
13.6.2.3.1.App Based
13.6.2.3.2.Web Based
13.6.2.4.The UK E-prescription solutions Market Revenue (US$ Mn) and Forecasts, By End User
13.6.2.4.1.Patients
13.6.2.4.2.Hospital and Clinics
13.6.2.4.3.Pharmacies
13.6.2.4.4.Telemedicine and EHR companies
13.6.2.4.5.Others
13.6.3.Spain
13.6.3.1.Spain E-prescription solutions Market Revenue (US$ Mn) and Forecasts, By Offering
13.6.3.1.1.Software
13.6.3.1.1.1.Integrated Solutions
13.6.3.1.1.2.Standalone Solutions
13.6.3.1.2.Services
13.6.3.2.Spain E-prescription solutions Market Revenue (US$ Mn) and Forecasts, By Deployment Model
13.6.3.2.1.Cloud
13.6.3.2.2.On-premises
13.6.3.3.Spain E-prescription solutions Market Revenue (US$ Mn) and Forecasts, By Delivery Mode
13.6.3.3.1.App Based
13.6.3.3.2.Web Based
13.6.3.4.Spain E-prescription solutions Market Revenue (US$ Mn) and Forecasts, By End User
13.6.3.4.1.Patients
13.6.3.4.2.Hospital and Clinics
13.6.3.4.3.Pharmacies
13.6.3.4.4.Telemedicine and EHR companies
13.6.3.4.5.Others
13.6.4.Germany
13.6.4.1.Germany E-prescription solutions Market Revenue (US$ Mn) and Forecasts, By Offering
13.6.4.1.1.Software
13.6.4.1.1.1.Integrated Solutions
13.6.4.1.1.2.Standalone Solutions
13.6.4.1.2.Services
13.6.4.2.Germany E-prescription solutions Market Revenue (US$ Mn) and Forecasts, By Deployment Model
13.6.4.2.1.Cloud
13.6.4.2.2.On-premises
13.6.4.3.Germany E-prescription solutions Market Revenue (US$ Mn) and Forecasts, By Delivery Mode
13.6.4.3.1.App Based
13.6.4.3.2.Web Based
13.6.4.4.Germany E-prescription solutions Market Revenue (US$ Mn) and Forecasts, By End User
13.6.4.4.1.Patients
13.6.4.4.2.Hospital and Clinics
13.6.4.4.3.Pharmacies
13.6.4.4.4.Telemedicine and EHR companies
13.6.4.4.5.Others
13.6.5.Italy
13.6.5.1.Italy E-prescription solutions Market Revenue (US$ Mn) and Forecasts, By Offering
13.6.5.1.1.Software
13.6.5.1.1.1.Integrated Solutions
13.6.5.1.1.2.Standalone Solutions
13.6.5.1.2.Services
13.6.5.2.Italy E-prescription solutions Market Revenue (US$ Mn) and Forecasts, By Deployment Model
13.6.5.2.1.Cloud
13.6.5.2.2.On-premises
13.6.5.3.Italy E-prescription solutions Market Revenue (US$ Mn) and Forecasts, By Delivery Mode
13.6.5.3.1.App Based
13.6.5.3.2.Web Based
13.6.5.4.Italy E-prescription solutions Market Revenue (US$ Mn) and Forecasts, By End User
13.6.5.4.1.Patients
13.6.5.4.2.Hospital and Clinics
13.6.5.4.3.Pharmacies
13.6.5.4.4.Telemedicine and EHR companies
13.6.5.4.5.Others
13.6.6.Nordic Countries
13.6.6.1.Nordic Countries E-prescription solutions Market Revenue (US$ Mn) and Forecasts, By Offering
13.6.6.1.1.Software
13.6.6.1.1.1.Integrated Solutions
13.6.6.1.1.2.Standalone Solutions
13.6.6.1.2.Services
13.6.6.2.Nordic Countries E-prescription solutions Market Revenue (US$ Mn) and Forecasts, By Deployment Model
13.6.6.2.1.Cloud
13.6.6.2.2.On-premises
13.6.6.3.Nordic Countries E-prescription solutions Market Revenue (US$ Mn) and Forecasts, By Delivery Mode
13.6.6.3.1.App Based
13.6.6.3.2.Web Based
13.6.6.4.Nordic Countries E-prescription solutions Market Revenue (US$ Mn) and Forecasts, By End User
13.6.6.4.1.Patients
13.6.6.4.2.Hospital and Clinics
13.6.6.4.3.Pharmacies
13.6.6.4.4.Telemedicine and EHR companies
13.6.6.4.5.Others
13.6.6.5.Nordic Countries E-prescription solutions Market Revenue (US$ Mn) and Forecasts, By Country
13.6.6.5.1.Denmark
13.6.6.5.2.Finland
13.6.6.5.3.Iceland
13.6.6.5.4.Sweden
13.6.6.5.5.Norway
13.6.7.Benelux Union
13.6.7.1.Benelux Union E-prescription solutions Market Revenue (US$ Mn) and Forecasts, By Offering
13.6.7.1.1.Software
13.6.7.1.1.1.Integrated Solutions
13.6.7.1.1.2.Standalone Solutions
13.6.7.1.2.Services
13.6.7.2.Benelux Union E-prescription solutions Market Revenue (US$ Mn) and Forecasts, By Deployment Model
13.6.7.2.1.Cloud
13.6.7.2.2.On-premises
13.6.7.3.Benelux Union E-prescription solutions Market Revenue (US$ Mn) and Forecasts, By Delivery Mode
13.6.7.3.1.App Based
13.6.7.3.2.Web Based
13.6.7.4.Benelux Union E-prescription solutions Market Revenue (US$ Mn) and Forecasts, By End User
13.6.7.4.1.Patients
13.6.7.4.2.Hospital and Clinics
13.6.7.4.3.Pharmacies
13.6.7.4.4.Telemedicine and EHR companies
13.6.7.4.5.Others
13.6.7.5.Benelux Union E-prescription solutions Market Revenue (US$ Mn) and Forecasts, By Country
13.6.7.5.1.Belgium
13.6.7.5.2.The Netherlands
13.6.7.5.3.Luxembourg
13.6.8.Rest of Europe
13.6.8.1.Rest of Europe E-prescription solutions Market Revenue (US$ Mn) and Forecasts, By Offering
13.6.8.1.1.Software
13.6.8.1.1.1.Integrated Solutions
13.6.8.1.1.2.Standalone Solutions
13.6.8.1.2.Services
13.6.8.2.Rest of Europe E-prescription solutions Market Revenue (US$ Mn) and Forecasts, By Deployment Model
13.6.8.2.1.Cloud
13.6.8.2.2.On-premises
13.6.8.3.Rest of Europe E-prescription solutions Market Revenue (US$ Mn) and Forecasts, By Delivery Mode
13.6.8.3.1.App Based
13.6.8.3.2.Web Based
13.6.8.4.Rest of Europe E-prescription solutions Market Revenue (US$ Mn) and Forecasts, By End User
13.6.8.4.1.Patients
13.6.8.4.2.Hospital and Clinics
13.6.8.4.3.Pharmacies
13.6.8.4.4.Telemedicine and EHR companies
13.6.8.4.5.Others
13.7.Key Segment for Channeling Investments
13.7.1.By Country
13.7.2.By Offering
13.7.3.By Deployment Model
13.7.4.By Delivery Mode
13.7.5.By End User
14.Asia Pacific E-prescription solutions Market Analysis and Forecasts, 2024 – 2034
14.1.Overview
14.1.1.Asia Pacific E-prescription solutions Market Revenue (US$ Mn)
14.2.Asia Pacific E-prescription solutions Market Revenue (US$ Mn) and Forecasts, By Offering
14.2.1.Software
14.2.1.1.Integrated Solutions
14.2.1.2.Standalone Solutions
14.2.2.Services
14.3.Asia Pacific E-prescription solutions Market Revenue (US$ Mn) and Forecasts, By Deployment Model
14.3.1.Cloud
14.3.2.On-premises
14.4.Asia Pacific E-prescription solutions Market Revenue (US$ Mn) and Forecasts, By Delivery Mode
14.4.1.App Based
14.4.2.Web Based
14.5.Asia Pacific E-prescription solutions Market Revenue (US$ Mn) and Forecasts, By End User
14.5.1.Patients
14.5.2.Hospital and Clinics
14.5.3.Pharmacies
14.5.4.Telemedicine and EHR companies
14.5.5.Others
14.6.Asia Pacific E-prescription solutions Market Revenue (US$ Mn) and Forecasts, By Country
14.6.1.China
14.6.1.1.China E-prescription solutions Market Revenue (US$ Mn) and Forecasts, By Offering
14.6.1.1.1.Software
14.6.1.1.1.1.Integrated Solutions
14.6.1.1.1.2.Standalone Solutions
14.6.1.1.2.Services
14.6.1.2.China E-prescription solutions Market Revenue (US$ Mn) and Forecasts, By Deployment Model
14.6.1.2.1.Cloud
14.6.1.2.2.On-premises
14.6.1.3.China E-prescription solutions Market Revenue (US$ Mn) and Forecasts, By Delivery Mode
14.6.1.3.1.App Based
14.6.1.3.2.Web Based
14.6.1.4.China E-prescription solutions Market Revenue (US$ Mn) and Forecasts, By End User
14.6.1.4.1.Patients
14.6.1.4.2.Hospital and Clinics
14.6.1.4.3.Pharmacies
14.6.1.4.4.Telemedicine and EHR companies
14.6.1.4.5.Others
14.6.2.Japan
14.6.2.1.Japan E-prescription solutions Market Revenue (US$ Mn) and Forecasts, By Offering
14.6.2.1.1.Software
14.6.2.1.1.1.Integrated Solutions
14.6.2.1.1.2.Standalone Solutions
14.6.2.1.2.Services
14.6.2.2.Japan E-prescription solutions Market Revenue (US$ Mn) and Forecasts, By Deployment Model
14.6.2.2.1.Cloud
14.6.2.2.2.On-premises
14.6.2.3.Japan E-prescription solutions Market Revenue (US$ Mn) and Forecasts, By Delivery Mode
14.6.2.3.1.App Based
14.6.2.3.2.Web Based
14.6.2.4.Japan E-prescription solutions Market Revenue (US$ Mn) and Forecasts, By End User
14.6.2.4.1.Patients
14.6.2.4.2.Hospital and Clinics
14.6.2.4.3.Pharmacies
14.6.2.4.4.Telemedicine and EHR companies
14.6.2.4.5.Others
14.6.3.India
14.6.3.1.India E-prescription solutions Market Revenue (US$ Mn) and Forecasts, By Offering
14.6.3.1.1.Software
14.6.3.1.1.1.Integrated Solutions
14.6.3.1.1.2.Standalone Solutions
14.6.3.1.2.Services
14.6.3.2.India E-prescription solutions Market Revenue (US$ Mn) and Forecasts, By Deployment Model
14.6.3.2.1.Cloud
14.6.3.2.2.On-premises
14.6.3.3.India E-prescription solutions Market Revenue (US$ Mn) and Forecasts, By Delivery Mode
14.6.3.3.1.App Based
14.6.3.3.2.Web Based
14.6.3.4.India E-prescription solutions Market Revenue (US$ Mn) and Forecasts, By End User
14.6.3.4.1.Patients
14.6.3.4.2.Hospital and Clinics
14.6.3.4.3.Pharmacies
14.6.3.4.4.Telemedicine and EHR companies
14.6.3.4.5.Others
14.6.4.New Zealand
14.6.4.1.New Zealand E-prescription solutions Market Revenue (US$ Mn) and Forecasts, By Offering
14.6.4.1.1.Software
14.6.4.1.1.1.Integrated Solutions
14.6.4.1.1.2.Standalone Solutions
14.6.4.1.2.Services
14.6.4.2.New Zealand E-prescription solutions Market Revenue (US$ Mn) and Forecasts, By Deployment Model
14.6.4.2.1.Cloud
14.6.4.2.2.On-premises
14.6.4.3.New Zealand E-prescription solutions Market Revenue (US$ Mn) and Forecasts, By Delivery Mode
14.6.4.3.1.App Based
14.6.4.3.2.Web Based
14.6.4.4.New Zealand E-prescription solutions Market Revenue (US$ Mn) and Forecasts, By End User
14.6.4.4.1.Patients
14.6.4.4.2.Hospital and Clinics
14.6.4.4.3.Pharmacies
14.6.4.4.4.Telemedicine and EHR companies
14.6.4.4.5.Others
14.6.5.Australia
14.6.5.1.Australia E-prescription solutions Market Revenue (US$ Mn) and Forecasts, By Offering
14.6.5.1.1.Software
14.6.5.1.1.1.Integrated Solutions
14.6.5.1.1.2.Standalone Solutions
14.6.5.1.2.Services
14.6.5.2.Australia E-prescription solutions Market Revenue (US$ Mn) and Forecasts, By Deployment Model
14.6.5.2.1.Cloud
14.6.5.2.2.On-premises
14.6.5.3.Australia E-prescription solutions Market Revenue (US$ Mn) and Forecasts, By Delivery Mode
14.6.5.3.1.App Based
14.6.5.3.2.Web Based
14.6.5.4.Australia E-prescription solutions Market Revenue (US$ Mn) and Forecasts, By End User
14.6.5.4.1.Patients
14.6.5.4.2.Hospital and Clinics
14.6.5.4.3.Pharmacies
14.6.5.4.4.Telemedicine and EHR companies
14.6.5.4.5.Others
14.6.6.South Korea
14.6.6.1.South Korea E-prescription solutions Market Revenue (US$ Mn) and Forecasts, By Offering
14.6.6.1.1.Software
14.6.6.1.1.1.Integrated Solutions
14.6.6.1.1.2.Standalone Solutions
14.6.6.1.2.Services
14.6.6.2.South Korea E-prescription solutions Market Revenue (US$ Mn) and Forecasts, By Deployment Model
14.6.6.2.1.Cloud
14.6.6.2.2.On-premises
14.6.6.3.South Korea E-prescription solutions Market Revenue (US$ Mn) and Forecasts, By Delivery Mode
14.6.6.3.1.App Based
14.6.6.3.2.Web Based
14.6.6.4.South Korea E-prescription solutions Market Revenue (US$ Mn) and Forecasts, By End User
14.6.6.4.1.Patients
14.6.6.4.2.Hospital and Clinics
14.6.6.4.3.Pharmacies
14.6.6.4.4.Telemedicine and EHR companies
14.6.6.4.5.Others
14.6.7.Southeast Asia
14.6.7.1.Southeast Asia E-prescription solutions Market Revenue (US$ Mn) and Forecasts, By Offering
14.6.7.1.1.Software
14.6.7.1.1.1.Integrated Solutions
14.6.7.1.1.2.Standalone Solutions
14.6.7.1.2.Services
14.6.7.2.Southeast Asia E-prescription solutions Market Revenue (US$ Mn) and Forecasts, By Deployment Model
14.6.7.2.1.Cloud
14.6.7.2.2.On-premises
14.6.7.3.Southeast Asia E-prescription solutions Market Revenue (US$ Mn) and Forecasts, By Delivery Mode
14.6.7.3.1.App Based
14.6.7.3.2.Web Based
14.6.7.4.Southeast Asia E-prescription solutions Market Revenue (US$ Mn) and Forecasts, By End User
14.6.7.4.1.Patients
14.6.7.4.2.Hospital and Clinics
14.6.7.4.3.Pharmacies
14.6.7.4.4.Telemedicine and EHR companies
14.6.7.4.5.Others
14.6.7.5.Southeast Asia E-prescription solutions Market Revenue (US$ Mn) and Forecasts, By Country
14.6.7.5.1.Indonesia
14.6.7.5.2.Thailand
14.6.7.5.3.Malaysia
14.6.7.5.4.Singapore
14.6.7.5.5.Rest of Southeast Asia
14.6.8.Rest of Asia Pacific
14.6.8.1.Rest of Asia Pacific E-prescription solutions Market Revenue (US$ Mn) and Forecasts, By Offering
14.6.8.1.1.Software
14.6.8.1.1.1.Integrated Solutions
14.6.8.1.1.2.Standalone Solutions
14.6.8.1.2.Services
14.6.8.2.Rest of Asia Pacific E-prescription solutions Market Revenue (US$ Mn) and Forecasts, By Deployment Model
14.6.8.2.1.Cloud
14.6.8.2.2.On-premises
14.6.8.3.Rest of Asia Pacific E-prescription solutions Market Revenue (US$ Mn) and Forecasts, By Delivery Mode
14.6.8.3.1.App Based
14.6.8.3.2.Web Based
14.6.8.4.Rest of Asia Pacific E-prescription solutions Market Revenue (US$ Mn) and Forecasts, By End User
14.6.8.4.1.Patients
14.6.8.4.2.Hospital and Clinics
14.6.8.4.3.Pharmacies
14.6.8.4.4.Telemedicine and EHR companies
14.6.8.4.5.Others
14.7.Key Segment for Channeling Investments
14.7.1.By Country
14.7.2.By Offering
14.7.3.By Deployment Model
14.7.4.By Delivery Mode
14.7.5.By End User
15.Middle East and Africa E-prescription solutions Market Analysis and Forecasts, 2024 – 2034
15.1.Overview
15.1.1.Middle East and Africa E-prescription solutions Market Revenue (US$ Mn)
15.2.Middle East and Africa E-prescription solutions Market Revenue (US$ Mn) and Forecasts, By Offering
15.2.1.Software
15.2.1.1.Integrated Solutions
15.2.1.2.Standalone Solutions
15.2.2.Services
15.3.Middle East and Africa E-prescription solutions Market Revenue (US$ Mn) and Forecasts, By Deployment Model
15.3.1.Cloud
15.3.2.On-premises
15.4.Middle East and Africa E-prescription solutions Market Revenue (US$ Mn) and Forecasts, By Delivery Mode
15.4.1.App Based
15.4.2.Web Based
15.5.Middle East and Africa E-prescription solutions Market Revenue (US$ Mn) and Forecasts, By End User
15.5.1.Patients
15.5.2.Hospital and Clinics
15.5.3.Pharmacies
15.5.4.Telemedicine and EHR companies
15.5.5.Others
15.6.Middle East and Africa E-prescription solutions Market Revenue (US$ Mn) and Forecasts, By Country
15.6.1.Saudi Arabia
15.6.1.1.Saudi Arabia E-prescription solutions Market Revenue (US$ Mn) and Forecasts, By Offering
15.6.1.1.1.Software
15.6.1.1.1.1.Integrated Solutions
15.6.1.1.1.2.Standalone Solutions
15.6.1.1.2.Services
15.6.1.2.Saudi Arabia E-prescription solutions Market Revenue (US$ Mn) and Forecasts, By Deployment Model
15.6.1.2.1.Cloud
15.6.1.2.2.On-premises
15.6.1.3.Saudi Arabia E-prescription solutions Market Revenue (US$ Mn) and Forecasts, By Delivery Mode
15.6.1.3.1.App Based
15.6.1.3.2.Web Based
15.6.1.4.Saudi Arabia E-prescription solutions Market Revenue (US$ Mn) and Forecasts, By End User
15.6.1.4.1.Patients
15.6.1.4.2.Hospital and Clinics
15.6.1.4.3.Pharmacies
15.6.1.4.4.Telemedicine and EHR companies
15.6.1.4.5.Others
15.6.2.UAE
15.6.2.1.UAE E-prescription solutions Market Revenue (US$ Mn) and Forecasts, By Offering
15.6.2.1.1.Software
15.6.2.1.1.1.Integrated Solutions
15.6.2.1.1.2.Standalone Solutions
15.6.2.1.2.Services
15.6.2.2.UAE E-prescription solutions Market Revenue (US$ Mn) and Forecasts, By Deployment Model
15.6.2.2.1.Cloud
15.6.2.2.2.On-premises
15.6.2.3.UAE E-prescription solutions Market Revenue (US$ Mn) and Forecasts, By Delivery Mode
15.6.2.3.1.App Based
15.6.2.3.2.Web Based
15.6.2.4.UAE E-prescription solutions Market Revenue (US$ Mn) and Forecasts, By End User
15.6.2.4.1.Patients
15.6.2.4.2.Hospital and Clinics
15.6.2.4.3.Pharmacies
15.6.2.4.4.Telemedicine and EHR companies
15.6.2.4.5.Others
15.6.3.Egypt
15.6.3.1.Egypt E-prescription solutions Market Revenue (US$ Mn) and Forecasts, By Offering
15.6.3.1.1.Software
15.6.3.1.1.1.Integrated Solutions
15.6.3.1.1.2.Standalone Solutions
15.6.3.1.2.Services
15.6.3.2.Egypt E-prescription solutions Market Revenue (US$ Mn) and Forecasts, By Deployment Model
15.6.3.2.1.Cloud
15.6.3.2.2.On-premises
15.6.3.3.Egypt E-prescription solutions Market Revenue (US$ Mn) and Forecasts, By Delivery Mode
15.6.3.3.1.App Based
15.6.3.3.2.Web Based
15.6.3.4.Egypt E-prescription solutions Market Revenue (US$ Mn) and Forecasts, By End User
15.6.3.4.1.Patients
15.6.3.4.2.Hospital and Clinics
15.6.3.4.3.Pharmacies
15.6.3.4.4.Telemedicine and EHR companies
15.6.3.4.5.Others
15.6.4.Kuwait
15.6.4.1.Kuwait E-prescription solutions Market Revenue (US$ Mn) and Forecasts, By Offering
15.6.4.1.1.Software
15.6.4.1.1.1.Integrated Solutions
15.6.4.1.1.2.Standalone Solutions
15.6.4.1.2.Services
15.6.4.2.Kuwait E-prescription solutions Market Revenue (US$ Mn) and Forecasts, By Deployment Model
15.6.4.2.1.Cloud
15.6.4.2.2.On-premises
15.6.4.3.Kuwait E-prescription solutions Market Revenue (US$ Mn) and Forecasts, By Delivery Mode
15.6.4.3.1.App Based
15.6.4.3.2.Web Based
15.6.4.4.Kuwait E-prescription solutions Market Revenue (US$ Mn) and Forecasts, By End User
15.6.4.4.1.Patients
15.6.4.4.2.Hospital and Clinics
15.6.4.4.3.Pharmacies
15.6.4.4.4.Telemedicine and EHR companies
15.6.4.4.5.Others
15.6.5.South Africa
15.6.5.1.South Africa E-prescription solutions Market Revenue (US$ Mn) and Forecasts, By Offering
15.6.5.1.1.Software
15.6.5.1.1.1.Integrated Solutions
15.6.5.1.1.2.Standalone Solutions
15.6.5.1.2.Services
15.6.5.2.South Africa E-prescription solutions Market Revenue (US$ Mn) and Forecasts, By Deployment Model
15.6.5.2.1.Cloud
15.6.5.2.2.On-premises
15.6.5.3.South Africa E-prescription solutions Market Revenue (US$ Mn) and Forecasts, By Delivery Mode
15.6.5.3.1.App Based
15.6.5.3.2.Web Based
15.6.5.4.South Africa E-prescription solutions Market Revenue (US$ Mn) and Forecasts, By End User
15.6.5.4.1.Patients
15.6.5.4.2.Hospital and Clinics
15.6.5.4.3.Pharmacies
15.6.5.4.4.Telemedicine and EHR companies
15.6.5.4.5.Others
15.6.6.Rest of Middle East & Africa
15.6.6.1.Rest of Middle East & Africa E-prescription solutions Market Revenue (US$ Mn) and Forecasts, By Offering
15.6.6.1.1.Software
15.6.6.1.1.1.Integrated Solutions
15.6.6.1.1.2.Standalone Solutions
15.6.6.1.2.Services
15.6.6.2.Rest of Middle East & Africa E-prescription solutions Market Revenue (US$ Mn) and Forecasts, By Deployment Model
15.6.6.2.1.Cloud
15.6.6.2.2.On-premises
15.6.6.3.Rest of Middle East & Africa E-prescription solutions Market Revenue (US$ Mn) and Forecasts, By Delivery Mode
15.6.6.3.1.App Based
15.6.6.3.2.Web Based
15.6.6.4.Rest of Middle East & Africa E-prescription solutions Market Revenue (US$ Mn) and Forecasts, By End User
15.6.6.4.1.Patients
15.6.6.4.2.Hospital and Clinics
15.6.6.4.3.Pharmacies
15.6.6.4.4.Telemedicine and EHR companies
15.6.6.4.5.Others
15.7.Key Segment for Channeling Investments
15.7.1.By Country
15.7.2.By Offering
15.7.3.By Deployment Model
15.7.4.By Delivery Mode
15.7.5.By End User
16.Latin America E-prescription solutions Market Analysis and Forecasts, 2024 – 2034
16.1.Overview
16.1.1.Latin America E-prescription solutions Market Revenue (US$ Mn)
16.2.Latin America E-prescription solutions Market Revenue (US$ Mn) and Forecasts, By Offering
16.2.1.Software
16.2.1.1.Integrated Solutions
16.2.1.2.Standalone Solutions
16.2.2.Services
16.3.Latin America E-prescription solutions Market Revenue (US$ Mn) and Forecasts, By Deployment Model
16.3.1.Cloud
16.3.2.On-premises
16.4.Latin America E-prescription solutions Market Revenue (US$ Mn) and Forecasts, By Delivery Mode
16.4.1.App Based
16.4.2.Web Based
16.5.Latin America E-prescription solutions Market Revenue (US$ Mn) and Forecasts, By End User
16.5.1.Patients
16.5.2.Hospital and Clinics
16.5.3.Pharmacies
16.5.4.Telemedicine and EHR companies
16.5.5.Others
16.6.Latin America E-prescription solutions Market Revenue (US$ Mn) and Forecasts, By Country
16.6.1.Brazil
16.6.1.1.Brazil E-prescription solutions Market Revenue (US$ Mn) and Forecasts, By Offering
16.6.1.1.1.Software
16.6.1.1.1.1.Integrated Solutions
16.6.1.1.1.2.Standalone Solutions
16.6.1.1.2.Services
16.6.1.2.Brazil E-prescription solutions Market Revenue (US$ Mn) and Forecasts, By Deployment Model
16.6.1.2.1.Cloud
16.6.1.2.2.On-premises
16.6.1.3.Brazil E-prescription solutions Market Revenue (US$ Mn) and Forecasts, By Delivery Mode
16.6.1.3.1.App Based
16.6.1.3.2.Web Based
16.6.1.4.Brazil E-prescription solutions Market Revenue (US$ Mn) and Forecasts, By End User
16.6.1.4.1.Patients
16.6.1.4.2.Hospital and Clinics
16.6.1.4.3.Pharmacies
16.6.1.4.4.Telemedicine and EHR companies
16.6.1.4.5.Others
16.6.2.Argentina
16.6.2.1.Argentina E-prescription solutions Market Revenue (US$ Mn) and Forecasts, By Offering
16.6.2.1.1.Software
16.6.2.1.1.1.Integrated Solutions
16.6.2.1.1.2.Standalone Solutions
16.6.2.1.2.Services
16.6.2.2.Argentina E-prescription solutions Market Revenue (US$ Mn) and Forecasts, By Deployment Model
16.6.2.2.1.Cloud
16.6.2.2.2.On-premises
16.6.2.3.Argentina E-prescription solutions Market Revenue (US$ Mn) and Forecasts, By Delivery Mode
16.6.2.3.1.App Based
16.6.2.3.2.Web Based
16.6.2.4.Argentina E-prescription solutions Market Revenue (US$ Mn) and Forecasts, By End User
16.6.2.4.1.Patients
16.6.2.4.2.Hospital and Clinics
16.6.2.4.3.Pharmacies
16.6.2.4.4.Telemedicine and EHR companies
16.6.2.4.5.Others
16.6.3.Rest of Latin America
16.6.3.1.Rest of Latin America E-prescription solutions Market Revenue (US$ Mn) and Forecasts, By Offering
16.6.3.1.1.Software
16.6.3.1.1.1.Integrated Solutions
16.6.3.1.1.2.Standalone Solutions
16.6.3.1.2.Services
16.6.3.2.Rest of Latin America E-prescription solutions Market Revenue (US$ Mn) and Forecasts, By Deployment Model
16.6.3.2.1.Cloud
16.6.3.2.2.On-premises
16.6.3.3.Rest of Latin America E-prescription solutions Market Revenue (US$ Mn) and Forecasts, By Delivery Mode
16.6.3.3.1.App Based
16.6.3.3.2.Web Based
16.6.3.4.Rest of Latin America E-prescription solutions Market Revenue (US$ Mn) and Forecasts, By End User
16.6.3.4.1.Patients
16.6.3.4.2.Hospital and Clinics
16.6.3.4.3.Pharmacies
16.6.3.4.4.Telemedicine and EHR companies
16.6.3.4.5.Others
16.7.Key Segment for Channeling Investments
16.7.1.By Country
16.7.2.By Offering
16.7.3.By Deployment Model
16.7.4.By Delivery Mode
16.7.5.By End User
17.Competitive Benchmarking
17.1.Brand Benchmarking
17.2.Market Share Analysis, 2023
17.3.Global Presence and Growth Strategies
17.3.1.Mergers and Acquisitions
17.3.2.Product Launches
17.3.3.Investments Trends
17.3.4.R&D Initiatives
18.Player Profiles
18.1.Allscripts Healthcare, LLC
18.1.1.Company Details
18.1.2.Company Overview
18.1.3.Product Offerings
18.1.4.Key Developments
18.1.5.Financial Analysis
18.1.6.SWOT Analysis
18.1.7.Business Strategies
18.2.Athenahealth
18.2.1.Company Details
18.2.2.Company Overview
18.2.3.Product Offerings
18.2.4.Key Developments
18.2.5.Financial Analysis
18.2.6.SWOT Analysis
18.2.7.Business Strategies
18.3.Cerner Corporation (Oracle)
18.3.1.Company Details
18.3.2.Company Overview
18.3.3.Product Offerings
18.3.4.Key Developments
18.3.5.Financial Analysis
18.3.6.SWOT Analysis
18.3.7.Business Strategies
18.4.Change Healthcare
18.4.1.Company Details
18.4.2.Company Overview
18.4.3.Product Offerings
18.4.4.Key Developments
18.4.5.Financial Analysis
18.4.6.SWOT Analysis
18.4.7.Business Strategies
18.5.DrFirst
18.5.1.Company Details
18.5.2.Company Overview
18.5.3.Product Offerings
18.5.4.Key Developments
18.5.5.Financial Analysis
18.5.6.SWOT Analysis
18.5.7.Business Strategies
18.6.Epic Systems Corporation
18.6.1.Company Details
18.6.2.Company Overview
18.6.3.Product Offerings
18.6.4.Key Developments
18.6.5.Financial Analysis
18.6.6.SWOT Analysis
18.6.7.Business Strategies
18.7.McKesson Corporation
18.7.1.Company Details
18.7.2.Company Overview
18.7.3.Product Offerings
18.7.4.Key Developments
18.7.5.Financial Analysis
18.7.6.SWOT Analysis
18.7.7.Business Strategies
18.8.Networking Technology, Inc. (RXNT)
18.8.1.Company Details
18.8.2.Company Overview
18.8.3.Product Offerings
18.8.4.Key Developments
18.8.5.Financial Analysis
18.8.6.SWOT Analysis
18.8.7.Business Strategies
18.9.NXGN Management, LLC
18.9.1.Company Details
18.9.2.Company Overview
18.9.3.Product Offerings
18.9.4.Key Developments
18.9.5.Financial Analysis
18.9.6.SWOT Analysis
18.9.7.Business Strategies
18.10.Practice Fusion, Inc.
18.10.1.Company Details
18.10.2.Company Overview
18.10.3.Product Offerings
18.10.4.Key Developments
18.10.5.Financial Analysis
18.10.6.SWOT Analysis
18.10.7.Business Strategies
18.11.Surescripts
18.11.1.Company Details
18.11.2.Company Overview
18.11.3.Product Offerings
18.11.4.Key Developments
18.11.5.Financial Analysis
18.11.6.SWOT Analysis
18.11.7.Business Strategies
18.12.Other Industry Participants
19.Key Findings

.

Note: This ToC is tentative and can be changed according to the research study conducted during the course of report completion.

**Exclusive for Multi-User and Enterprise User.

.

Global E-Prescription Solutions Market

By Offering

  • Software
    • Integrated Solutions
    • Standalone Solutions
  • Services

By Deployment Model

  • Cloud
  • On-premises

By Delivery Mode

  • App Based
  • Web Based

By End User

  • Patients
  • Hospital and Clinics
  • Pharmacies
  • Telemedicine and EHR companies
  • Others

By Region

  • North America (U.S., Canada, Mexico, Rest of North America)
  • Europe (France, The UK, Spain, Germany, Italy, Nordic Countries (Denmark, Finland, Iceland, Sweden, Norway), Benelux Union (Belgium, The Netherlands, Luxembourg), Rest of Europe)
  • Asia Pacific (China, Japan, India, New Zealand, Australia, South Korea, Southeast Asia (Indonesia, Thailand, Malaysia, Singapore, Rest of Southeast Asia), Rest of Asia Pacific)
  • Middle East & Africa (Saudi Arabia, UAE, Egypt, Kuwait, South Africa, Rest of Middle East & Africa)
  • Latin America (Brazil, Argentina, Rest of Latin America)

.

The Niche Research approach encompasses both primary and secondary research methods to provide comprehensive insights. While primary research is the cornerstone of our studies, we also incorporate secondary research sources such as company annual reports, premium industry databases, press releases, industry journals, and white papers.

Within our primary research, we actively engage with various industry stakeholders, conducting paid interviews and surveys. Our meticulous analysis extends to every market participant in major countries, allowing us to thoroughly examine their portfolios, calculate market shares, and segment revenues.

Our data collection primarily focuses on individual countries within our research scope, enabling us to estimate regional market sizes. Typically, we employ a bottom-up approach, meticulously tracking trends in different countries. We analyze growth drivers, constraints, technological innovations, and opportunities for each country, ultimately arriving at regional figures.Our process begins by examining the growth prospects of each country. Building upon these insights, we project growth and trends for the entire region. Finally, we utilize our proprietary model to refine estimations and forecasts.

Our data validation standards are integral to ensuring the reliability and accuracy of our research findings. Here’s a breakdown of our data validation processes and the stakeholders we engage with during our primary research:

  • Supply Side Analysis: We initiate a supply side analysis by directly contacting market participants, through telephonic interviews and questionnaires containing both open-ended and close-ended questions. We gather information on their portfolios, segment revenues, developments, and growth strategies.
  • Demand Side Analysis: To gain insights into adoption trends and consumer preferences, we reach out to target customers and users (non-vendors). This information forms a vital part of the qualitative analysis section of our reports, covering market dynamics, adoption trends, consumer behavior, spending patterns, and other related aspects.
  • Consultant Insights: We tap into the expertise of our partner consultants from around the world to obtain their unique viewpoints and perspectives. Their insights contribute to a well-rounded understanding of the markets under investigation.
  • In-House Validation: To ensure data accuracy and reliability, we conduct cross-validation of data points and information through our in-house team of consultants and utilize advanced data modeling tools for thorough verification.

The forecasts we provide are based on a comprehensive assessment of various factors, including:

  • Market Trends and Past Performance (Last Five Years): We accurately analyze market trends and performance data from preceding five years to identify historical patterns and understand the market’s evolution.
  • Historical Performance and Growth of Market Participants: We assess the historical performance and growth trajectories of key market participants. This analysis provides insights into the competitive landscape and individual company strategies.
  • Market Determinants Impact Analysis (Next Eight Years): We conduct a rigorous analysis of the factors that are projected to influence the market over the next eight years. This includes assessing both internal and external determinants that can shape market dynamics.
  • Drivers and Challenges for the Forecast Period:Identify the factors expected to drive market growth during the forecast period, as well as the challenges that the industry may face. This analysis aids in deriving an accurate growth rate projection.
  • New Acquisitions, Collaborations, or Partnerships: We keep a close watch on any new acquisitions, collaborations, or partnerships within the industry. These developments can have a significant impact on market dynamics and competitiveness.
  • Macro and Micro Factors Analysis:A thorough examination of both macro-level factors (e.g., economic trends, regulatory changes) and micro-level factors (e.g., technological advancements, consumer preferences) that may influence the market during the forecast period.
  • End-User Sentiment Analysis: To understand the market from the end-user perspective, we conduct sentiment analysis. This involves assessing the sentiment, preferences, and feedback of the end-users, which can provide valuable insights into market trends.
  • Perspective of Primary Participants: Insights gathered directly from primary research participants play a crucial role in shaping our forecasts. Their perspectives and experiences provide valuable qualitative data.
  • Year-on-Year Growth Trend: We utilize a year-on-year growth trend based on historical market growth and expected future trends. This helps in formulating our growth projections, aligning them with the market’s historical performance.

Research process adopted by TNR involves multiple stages, including data collection, validation, quality checks, and presentation. It’s crucial that the data and information we provide add value to your existing market understanding and expertise. We have also established partnerships with business consulting, research, and survey organizations across regions and globally to collaborate on regional analysis and data validation, ensuring the highest level of accuracy and reliability in our reports.


Procure Comprehensive Study of

Global E-Prescription Solutions Market

Online Only

  • Online Access
  • Read Only File
  • Validity 3 Months
  • Print, Copy, Paste & Download
  • PPT, Excel
  • Cost-Free Report in the Next Update
$3300
Buy Now

Single User

  • Access to One User on One System
  • Read Only File
  • Validity 6 Months
  • Limited Print,Copy, Paste
  • PPT, Excel
  • Cost-Free Report in the Next Update
$4200
Buy Now

Multi User

  • Access to Fiver Users
  • PDF File
  • Validity 1 Year
  • Upto FivePrints
  • Cost-Free Report in the Next Update
  • PPT, Excel
$6000
Buy Now

Enterprise User

  • Access to Unlimited Users
  • PDF, PPT, Excel
  • Unlimited Validity, Prints&Downloads
  • 1 Hour Cost-Free & Dedicated Analyst Support
  • 10% Cost-Free Customization
  • Cost-Free Report Update Twice in a Year
  • Recommendations for Business Strategies
  • Authorization to Quote TNR, The Niche Research
$7300
Buy Now

Library Access

  • Online Access to Content Publications
  • Access Player Profiles Online
  • Get Immediate Access to Newly Added Content
  • Acquire 12 PDF Downloads
  • Acquire 5 Excel Data Sets
  • Gain Access to 290+ PDFs of Company Profiles
  • Round-the-clock Email and Phone Assistance
  • Dashboard Usage and Trends
  • Renewal & Upgrade Assistance
  • Assessing Customization Options and Alerts for New Reports
$10788
Buy Now
*Taxes/Fees, if applicable will be added during checkout. All prices in USD

Why TNR The Niche Research?

  • Unwavering Commitment to Excellence

  • Veteran Team of Researchers

  • Accurate and Timely Insights

  • Ethical Practices and Customized Service

  • Uninterrupted Availability Around the Clock

Scroll to Top