Global Microdisplay Market By Technology, By Application, By Region & Segmental Insights Trends and Forecast, 2024 – 2034
- Industry: Technology
- Report ID: TNR-110-1259
- Number of Pages: 420
- Table/Charts : Yes
- August, 2024
- Base Year : 2024
- No. of Companies : 10+
- No. of Countries : 29
- Views : 10053
- Covid Impact Covered: Yes
- War Impact Covered: Yes
- Formats : PDF, Excel, PPT
The global microdisplay market is poised for significant growth, driven by advancements in augmented reality (AR) and virtual reality (VR) technologies, increasing demand for compact and high-resolution displays in consumer electronics, and the rising adoption of heads-up displays (HUDs) in automotive applications. Key trends include the shift towards OLED and MicroLED technologies for enhanced display performance and energy efficiency.
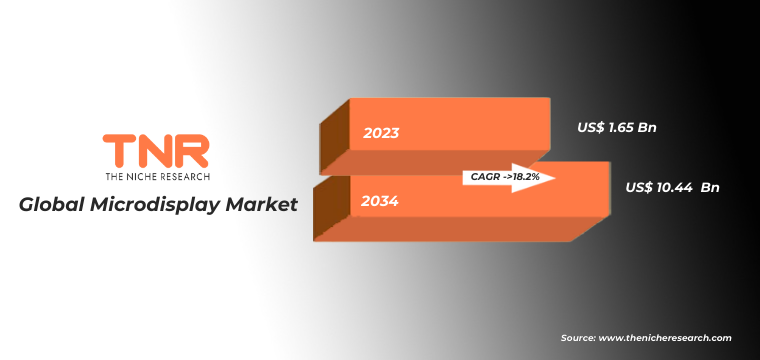
Opportunities are abundant in sectors like healthcare, where microdisplays are utilized in surgical and diagnostic equipment, and in the military, where they enhance situational awareness. Emerging markets in Asia-Pacific and Latin America offer potential for expansion, as demand for innovative display technologies continues to rise across various industries. In terms of revenue, the global microdisplay market was worth US$ 1.65 Bn in 2023, anticipated to witness a CAGR of 18.2% during 2024 – 2034.
Global Microdisplay Market Segmental Analysis:
Microdisplay Market By Technology
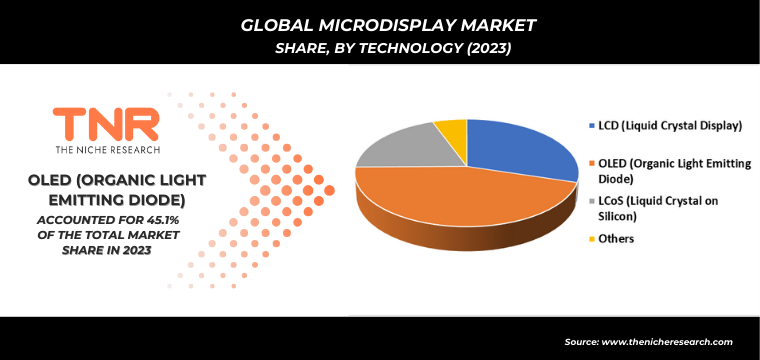
LCD (liquid crystal display) segment has rapidly emerged as the fastest-growing segment in the global microdisplay market, driven by its cost-effectiveness, widespread availability, and adaptability across various applications. LCD technology offers high resolution and brightness at a lower production cost compared to OLED and MicroLED, making it a preferred choice for consumer electronics, automotive displays, and industrial applications. Its versatility in supporting diverse display sizes and resolutions has fueled demand in sectors like wearable devices, head-mounted displays (HMDs), and heads-up displays (HUDs). The continuous improvements in LCD technology, including enhanced energy efficiency and color accuracy, further contribute to its accelerated growth in the microdisplay market.
Microdisplay Market By Application
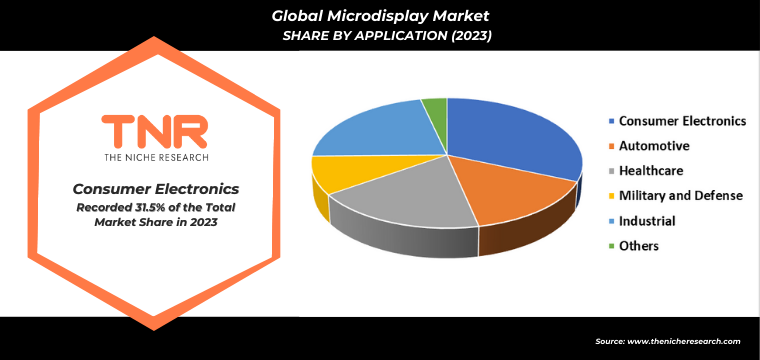
In 2023, the consumer electronics segment dominated the global microdisplay market, capturing a substantial revenue share of 31.5%. This dominance is attributed to the rising demand for high-resolution, compact displays in devices such as smartphones, wearables, and augmented reality (AR) glasses. The integration of microdisplays in head-mounted displays (HMDs) for gaming and entertainment further fueled market growth. Consumers’ increasing preference for immersive experiences and smart, connected devices has driven the adoption of advanced microdisplay technologies like OLED and LCD. The segment’s growth is also supported by ongoing innovations in display quality, energy efficiency, and miniaturization.
Microdisplay Market By Region
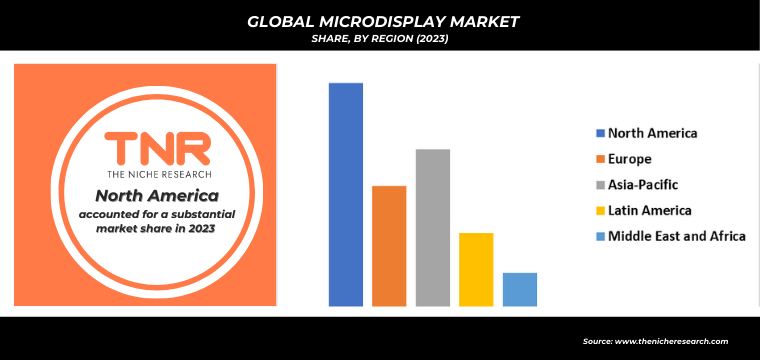
Europe is projected to be the fastest-growing region in the microdisplay market during the forecast period, driven by robust demand across key industries such as automotive, healthcare, and consumer electronics. The region’s strong automotive sector is increasingly adopting microdisplays for advanced heads-up displays (HUDs) and in-car infotainment systems, enhancing driving safety and user experience. Additionally, Europe’s healthcare industry is leveraging microdisplay technology for precision medical imaging and surgical applications. The region’s focus on innovation, supported by government initiatives and investments in research and development, further accelerates market growth. Expanding adoption of augmented reality (AR) and virtual reality (VR) technologies also contributes to Europe’s rapid market expansion.
Global Microdisplay Market Dynamics
Global Microdisplay Market Growth Driver:
The global microdisplay market is driven by the rapid growth of AR and VR applications, particularly in consumer electronics and gaming. The increasing adoption of microdisplays in automotive heads-up displays (HUDs) enhances driving safety and is a significant growth driver. Additionally, advancements in OLED and MicroLED technologies, which offer superior resolution, brightness, and energy efficiency, are fueling demand across various sectors. The healthcare industry’s growing use of microdisplays in medical devices, such as endoscopes and surgical displays, further supports market growth. Rising consumer demand for compact, lightweight, and high-resolution displays in wearable devices is another key driver.
Global Microdisplay Market Restraint:
A significant restraint in the global Microdisplay Market is the complex regulatory landscape. Obtaining licenses and adhering to international space laws can be time-consuming and costly, potentially delaying satellite launches. Additionally, coordination with multiple agencies and compliance with stringent regulations regarding frequency allocation and orbital debris management add further challenges, limiting the speed at which new satellites can be deployed.
Global Microdisplay Market Opportunity:
The microdisplay market presents significant opportunities, particularly in emerging markets such as Asia-Pacific and Latin America, where the adoption of advanced technologies is rapidly increasing. The ongoing development of microLED technology, which offers higher brightness and lower power consumption, opens new avenues for growth in industries like healthcare, automotive, and military. Additionally, the rise of wearable devices and smart glasses for both consumer and enterprise applications provides a fertile ground for market expansion. Partnerships between microdisplay manufacturers and technology firms to develop innovative applications in AR, VR, and HUDs could further unlock market potential.
Global Microdisplay Market Threat:
The global microdisplay market faces threats from intense competition, particularly from established display technologies such as LCDs, which dominate the market due to their lower cost and widespread availability. Economic downturns or fluctuations could also impact consumer spending on high-end electronics, thereby affecting demand for microdisplays. Additionally, the rapid pace of technological advancements could lead to obsolescence risks, where current microdisplay technologies may be quickly surpassed by newer, more efficient alternatives. Regulatory challenges, particularly in regions with stringent environmental and safety standards, could pose compliance risks and increase operational costs for manufacturers.
Competitive Landscape
The global microdisplay market is highly competitive, with key players focusing on innovation, mergers, and partnerships. Companies like Sony, LG Display, and eMagin dominate, continually advancing display technologies to gain market share and meet diverse industry demands.
Some of the players operating in the microdisplay market are
- eMagin Corporation
- Himax Technologies
- Kopin Corporation
- LG Display Co. Ltd
- Micron Technology Inc.
- Seiko Epson Corporation
- Sony Corporation
- Syndiant Inc.
- Universal Display Corporation
- Yunnan OLiGHTEK
- Other Industry Participants
Global Microdisplay Market Scope:
| Report Specifications | Details |
| Market Revenue in 2023 | US$ 1.65 Bn |
| Market Size Forecast by 2034 | US$ 10.44 Bn |
| Growth Rate (CAGR) | 18.2% |
| Historic Data | 2016 – 2022 |
| Base Year for Estimation | 2023 |
| Forecast Period | 2024 – 2034 |
| Report Inclusions | Market Size & Estimates, Market Dynamics, Competitive Scenario, Trends, Growth Factors, Market Determinants, Key Investment Segmentation, Product/Service/Solutions Benchmarking |
| Segments Covered | By Technology, By Application, By Region |
| Regions Covered | North America, Europe, Asia Pacific, Middle East & Africa, Latin America |
| Countries Covered | U.S., Canada, Mexico, Rest of North America, France, The UK, Spain, Germany, Italy, Nordic Countries (Denmark, Finland, Iceland, Sweden, Norway), Benelux Union (Belgium, The Netherlands, Luxembourg), Rest of Europe, China, Japan, India, New Zealand, Australia, South Korea, Southeast Asia (Indonesia, Thailand, Malaysia, Singapore, Rest of Southeast Asia), Rest of Asia Pacific, Saudi Arabia, UAE, Egypt, Kuwait, South Africa, Rest of Middle East & Africa, Brazil, Argentina, Rest of Latin America |
| Key Players | eMagin Corporation, Himax Technologies, Kopin Corporation, LG Display Co. Ltd, Micron Technology Inc., Seiko Epson Corporation, Sony Corporation, Syndiant Inc., Universal Display Corporation, Yunnan OLiGHTEK |
| Customization Scope | Customization allows for the inclusion/modification of content pertaining to geographical regions, countries, and specific market segments. |
| Pricing & Procurement Options | Explore purchase options tailored to your specific research requirements |
| Contact Details | Consult With Our Expert
Japan (Toll-Free): +81 663-386-8111 South Korea (Toll-Free): +82-808- 703-126 Saudi Arabia (Toll-Free): +966 800-850-1643 United Kingdom: +44 753-710-5080 United States: +1 302-232-5106 E-mail: askanexpert@thenicheresearch.com
|
Key Developments:
- In 2023, eMagin Corporation introduced a 0.53-inch OLED microdisplay featuring a 1920 x 1080 pixel resolution, tailored for augmented reality glasses.
- In 2022, Sony launched a 0.77-inch OLED microdisplay with a 2048 x 2048 pixel resolution, designed for AR and VR headsets.
- In 2021, Kopin Corporation revealed a superbright HDR 1-inch diagonal OLED microdisplay with a resolution of 1280 x 1024 pixels.
Global Microdisplay Market
By Technology
- LCD (Liquid Crystal Display)
- OLED (Organic Light Emitting Diode)
- LCoS (Liquid Crystal on Silicon)
- Others
By Application
- Consumer Electronics
- Automotive
- Healthcare
- Military and Defense
- Industrial
- Others
By Region
- North America (U.S., Canada, Mexico, Rest of North America)
- Europe (France, The UK, Spain, Germany, Italy, Nordic Countries (Denmark, Finland, Iceland, Sweden, Norway), Benelux Union (Belgium, The Netherlands, Luxembourg), Rest of Europe)
- Asia Pacific (China, Japan, India, New Zealand, Australia, South Korea, Southeast Asia (Indonesia, Thailand, Malaysia, Singapore, Rest of Southeast Asia), Rest of Asia Pacific)
- Middle East & Africa (Saudi Arabia, UAE, Egypt, Kuwait, South Africa, Rest of Middle East & Africa)
- Latin America (Brazil, Argentina, Rest of Latin America)
Report Layout:
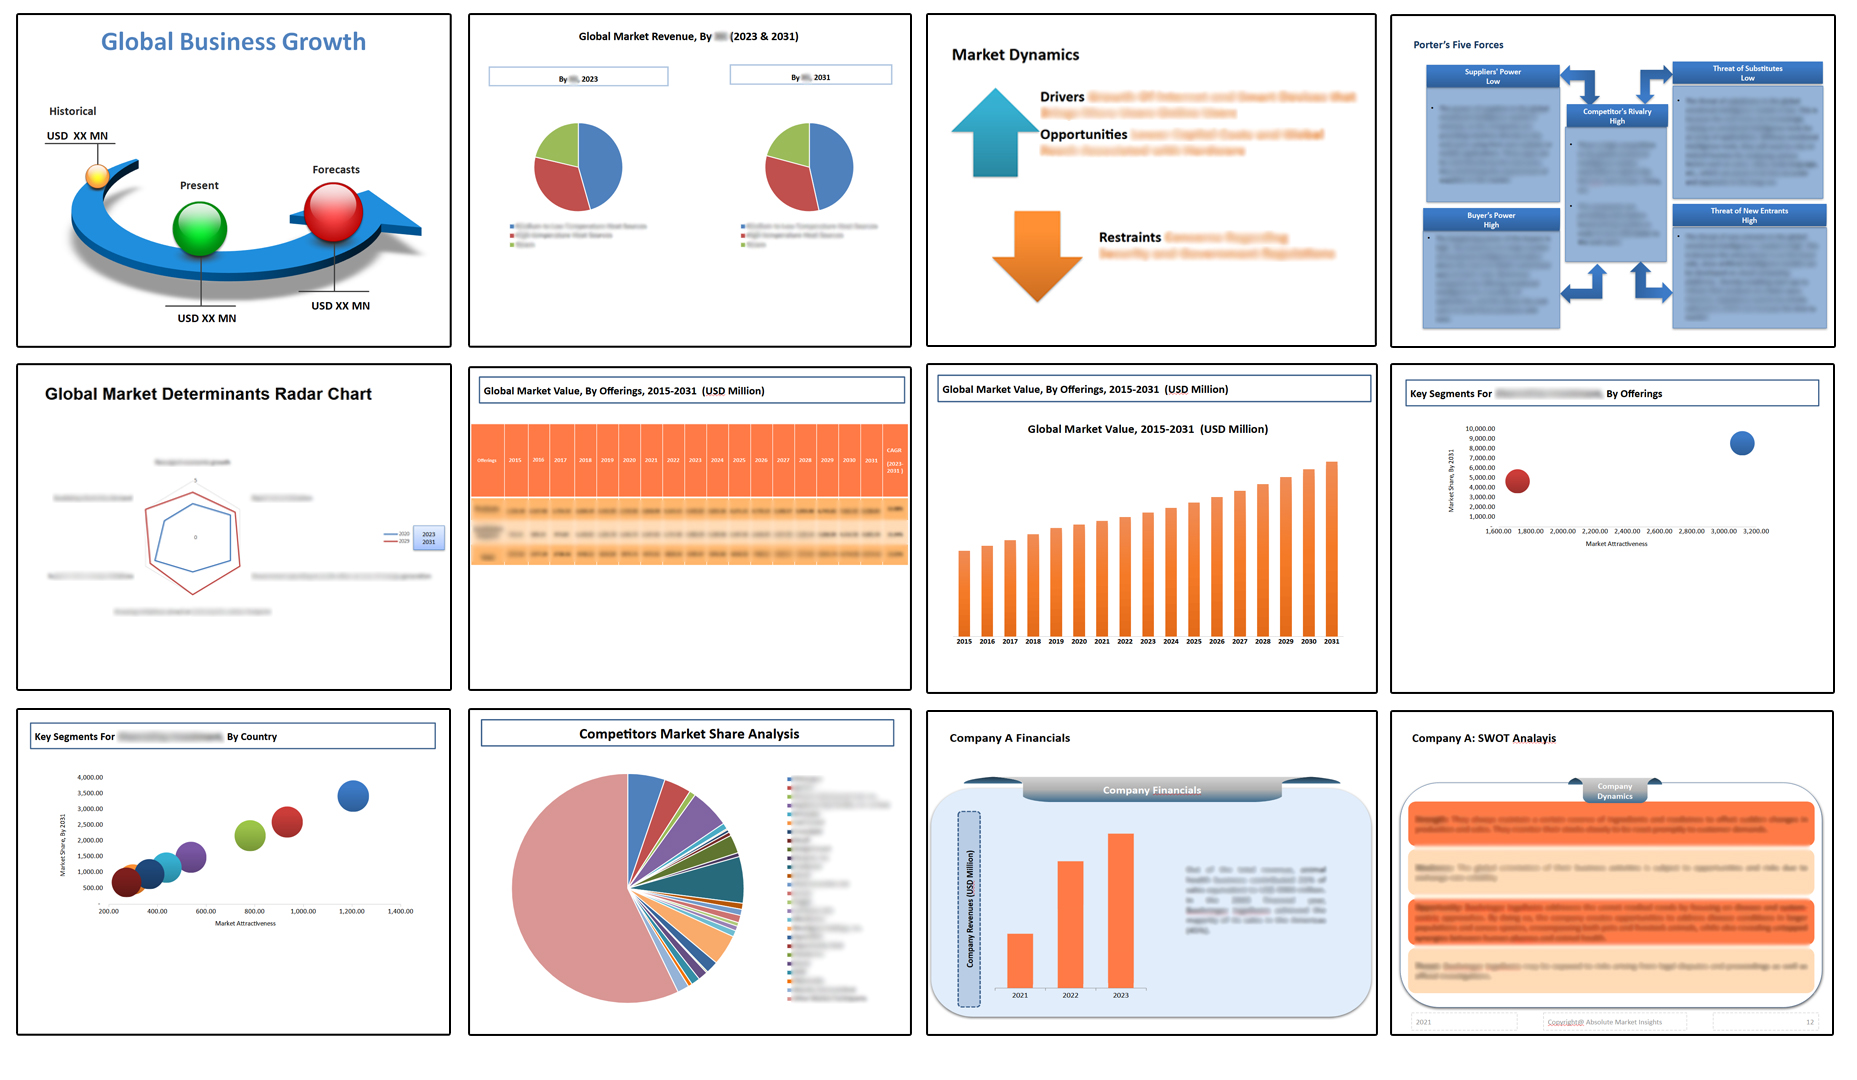
Table of Contents
Note: This ToC is tentative and can be changed according to the research study conducted during the course of report completion.
**Exclusive for Multi-User and Enterprise User.
Global Microdisplay Market
By Technology
- LCD (Liquid Crystal Display)
- OLED (Organic Light Emitting Diode)
- LCoS (Liquid Crystal on Silicon)
- Others
By Application
- Consumer Electronics
- Automotive
- Healthcare
- Military and Defense
- Industrial
- Others
By Region
- North America (U.S., Canada, Mexico, Rest of North America)
- Europe (France, The UK, Spain, Germany, Italy, Nordic Countries (Denmark, Finland, Iceland, Sweden, Norway), Benelux Union (Belgium, The Netherlands, Luxembourg), Rest of Europe)
- Asia Pacific (China, Japan, India, New Zealand, Australia, South Korea, Southeast Asia (Indonesia, Thailand, Malaysia, Singapore, Rest of Southeast Asia), Rest of Asia Pacific)
- Middle East & Africa (Saudi Arabia, UAE, Egypt, Kuwait, South Africa, Rest of Middle East & Africa)
- Latin America (Brazil, Argentina, Rest of Latin America)
The Niche Research approach encompasses both primary and secondary research methods to provide comprehensive insights. While primary research is the cornerstone of our studies, we also incorporate secondary research sources such as company annual reports, premium industry databases, press releases, industry journals, and white papers.
Within our primary research, we actively engage with various industry stakeholders, conducting paid interviews and surveys. Our meticulous analysis extends to every market participant in major countries, allowing us to thoroughly examine their portfolios, calculate market shares, and segment revenues.
Our data collection primarily focuses on individual countries within our research scope, enabling us to estimate regional market sizes. Typically, we employ a bottom-up approach, meticulously tracking trends in different countries. We analyze growth drivers, constraints, technological innovations, and opportunities for each country, ultimately arriving at regional figures.Our process begins by examining the growth prospects of each country. Building upon these insights, we project growth and trends for the entire region. Finally, we utilize our proprietary model to refine estimations and forecasts.
Our data validation standards are integral to ensuring the reliability and accuracy of our research findings. Here’s a breakdown of our data validation processes and the stakeholders we engage with during our primary research:
- Supply Side Analysis: We initiate a supply side analysis by directly contacting market participants, through telephonic interviews and questionnaires containing both open-ended and close-ended questions. We gather information on their portfolios, segment revenues, developments, and growth strategies.
- Demand Side Analysis: To gain insights into adoption trends and consumer preferences, we reach out to target customers and users (non-vendors). This information forms a vital part of the qualitative analysis section of our reports, covering market dynamics, adoption trends, consumer behavior, spending patterns, and other related aspects.
- Consultant Insights: We tap into the expertise of our partner consultants from around the world to obtain their unique viewpoints and perspectives. Their insights contribute to a well-rounded understanding of the markets under investigation.
- In-House Validation: To ensure data accuracy and reliability, we conduct cross-validation of data points and information through our in-house team of consultants and utilize advanced data modeling tools for thorough verification.
The forecasts we provide are based on a comprehensive assessment of various factors, including:
- Market Trends and Past Performance (Last Five Years): We accurately analyze market trends and performance data from preceding five years to identify historical patterns and understand the market’s evolution.
- Historical Performance and Growth of Market Participants: We assess the historical performance and growth trajectories of key market participants. This analysis provides insights into the competitive landscape and individual company strategies.
- Market Determinants Impact Analysis (Next Eight Years): We conduct a rigorous analysis of the factors that are projected to influence the market over the next eight years. This includes assessing both internal and external determinants that can shape market dynamics.
- Drivers and Challenges for the Forecast Period:Identify the factors expected to drive market growth during the forecast period, as well as the challenges that the industry may face. This analysis aids in deriving an accurate growth rate projection.
- New Acquisitions, Collaborations, or Partnerships: We keep a close watch on any new acquisitions, collaborations, or partnerships within the industry. These developments can have a significant impact on market dynamics and competitiveness.
- Macro and Micro Factors Analysis:A thorough examination of both macro-level factors (e.g., economic trends, regulatory changes) and micro-level factors (e.g., technological advancements, consumer preferences) that may influence the market during the forecast period.
- End-User Sentiment Analysis: To understand the market from the end-user perspective, we conduct sentiment analysis. This involves assessing the sentiment, preferences, and feedback of the end-users, which can provide valuable insights into market trends.
- Perspective of Primary Participants: Insights gathered directly from primary research participants play a crucial role in shaping our forecasts. Their perspectives and experiences provide valuable qualitative data.
- Year-on-Year Growth Trend: We utilize a year-on-year growth trend based on historical market growth and expected future trends. This helps in formulating our growth projections, aligning them with the market’s historical performance.
Research process adopted by TNR involves multiple stages, including data collection, validation, quality checks, and presentation. It’s crucial that the data and information we provide add value to your existing market understanding and expertise. We have also established partnerships with business consulting, research, and survey organizations across regions and globally to collaborate on regional analysis and data validation, ensuring the highest level of accuracy and reliability in our reports.