Global Active Optical Cable and Extender Market Insights, Growth, Share, Size: By Protocol, By Form Factor, By Distribution Channel, By End User Industry, By Region & Segmental Forecast, 2023-2031, Comparative Analysis and Trends

  • Industry: Semiconductors & Electronics
  • Report ID: TNR-110-949
  • Number of Pages: 420
  • Table/Charts : Yes
  • November, 2023
  • Base Year : 2024
  • No. of Companies : 10+
  • No. of Countries : 29
  • Views : 10136
  • Covid Impact Covered: Yes
  • War Impact Covered: Yes
  • Formats : PDF, Excel, PPT

Global Active Optical Cable and Extender Market Valued USD 3.43 Bn in 2022, with an Estimated CAGR of 17.8% by 2031

Active optical cable and extenders are used for multi-lane data communication and interconnect applications.

As people expect more information to be available at their fingertips, communications systems will need to be quicker, and active optical cable is one of the best solutions to this challenge. Compared with common cable for data transmission, active optical cable and extenders provide more advantages, such as lighter weight, high performance, low power consumption, low interconnection loss, EMI immunity and flexibility. With its benefits, active optical cable and extenders is widely used in many fields as well as promoting the traditional data center to step into optical interconnection leading to the overall growth of the global active optical cable and extender market during the forecast period.

Global Active Optical Cable and Extender Market Revenue & Forecast, (US$ Million), 2015 – 2031
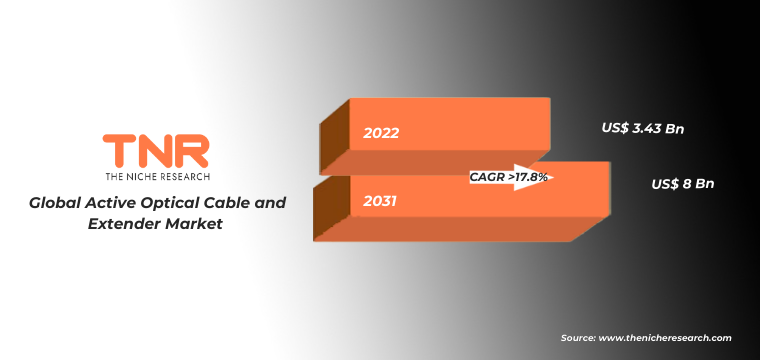
Global Active Optical Cable and Extender Market Future

The rollout of 5G networks and the growth of edge computing will create opportunities for AOCs and extenders to facilitate fast and reliable connections between data centers, edge devices, and remote sites. Additionally the adoption of cloud services and remote work trends will necessitate robust and reliable connections, encouraging the use of AOCs and extenders to support remote access, virtual collaboration, and secure data transmission.

Moreover with the on-going plans for building smart city infrastructures, active optical cable and extenders will highly contribute in the seamless transmission of data for applications like surveillance, traffic management, and public services. Thus with the ongoing advancements in fiber optics technology will likely enhance the capabilities of active optical cables and extenders leading to the upsurge in  the global active optical cables and extender market.

Report Coverage and Deliverables

In the active optical cable and extender market, various form factors are used depending on the specific application, interface, and industry requirements. In 2022, QSFP had the highest share in the form factor segment as it is widely used in data centers and high-performance computing environments. QSFP active optical cables provide high-speed connections for Ethernet, InfiniBand, and other data center protocols. Various advantages such as high scalability, power efficiency reduced latency and longer transmission of data have led QSFP form factor as the go-to choice for high-speed data transmission in data centers and environments where efficient connectivity, reliability, and performance are crucial.

Active optical cable and extenders play a significant role in the entertainment industry, supporting the transmission of high-quality audio, video, and control signals over longer distances. In the last few years live events and concerts have gained a huge momentum wherein the active optical cable and extenders allow audio and video signals to be transmitted from remote cameras, stage equipment, and audio systems to control rooms and displays. Furthermore due to the rising demand for visually stunning and immersive experiences for audiences while ensuring that the technical aspects of audio and video transmission are seamlessly managed, the global active optical cable and extender market is experiencing huge growth.

North America held the highest share in the active optical cable and extender market in 2022. North America, particularly the United States, is a hub for technology innovation. Due the concentration of corporate offices, multinational enterprises, and technology-intensive industries in North America which require robust connectivity solutions has led to the constant rise in demand for advanced active optical cables and extenders. Moreover the manufacturing and industrial sectors. In United States and Canada are highly utilizing active optical cables and extenders for efficient communication between machines, sensors, and control centers in automated processes.

Competitive Landscape

The report offers extensive research on the key players in the global active optical cable and extender market and details on the competitiveness of these players. The competitive landscape is characterized by partnerships, joint ventures, mergers and acquisitions, and collaborations aimed at accelerating the development and deployment of active optical cable and extender technologies.

List of key players in the global active optical cable and extender market

  • Amphenol Communications Solutions
  • APAC Opto Electronics Inc.
  • ATEN INTERNATIONAL Co., Ltd
  • Beetek
  • BizLink Group
  • Black Box
  • Broadcom
  • Coherent Corp.
  • Corning Incorporated
  • LIGHTWARE VISUAL ENGINEERING
  • Molex
  • Nice North America LLC
  • NVIDIA Corporation
  • Philex Electronic Ltd.
  • TE Connectivity Ltd.
  • Vitex
  • Other Industry Participants

Global Active Optical Cable and Extender Market Report Coverage

Report Specifications Details
Market Revenue in 2022 US$ 3.43 Billion
Market Size Forecast by 2031 US$ 8 Billion
Growth Rate (CAGR) 17.8%
Historic Data 2015 – 2021
Base Year for Estimation 2022
Forecast Period 2023 – 2031
Report Inclusions Market Size & Estimates, Market Dynamics, Competitive Scenario, Trends, Growth Factors, Market Determinants, Key Investment Segmentation, Product/Service/Solutions Benchmarking
Segments Covered By Protocol, By Form Factor, By Distribution Channel, By End User Industry
Regions Covered North America, Europe, Asia Pacific, Middle East & Africa, Latin America
Countries Covered U.S., Canada, Mexico, Rest of North America,  France, The UK, Spain, Germany, Italy, Nordic Countries (Denmark, Finland, Iceland, Sweden, Norway), Benelux Union (Belgium, The Netherlands, Luxembourg), Rest of Europe,  China, Japan, India, New Zealand, Australia, South Korea, Southeast Asia (Indonesia, Thailand, Malaysia, Singapore, Rest of Southeast Asia), Rest of Asia Pacific,  Saudi Arabia, UAE, Egypt, Kuwait, South Africa, Rest of Middle East & Africa,  Brazil, Argentina, Rest of Latin America
Key Players Amphenol Communications Solutions, APAC Opto Electronics Inc., ATEN INTERNATIONAL Co., Ltd, Beetek, BizLink Group, Black Box, Broadcom, Coherent Corp., Corning Incorporated, LIGHTWARE VISUAL ENGINEERING, Molex, Nice North America LLC, NVIDIA Corporation, Philex Electronic Ltd., TE Connectivity Ltd., Vitex, Other Industry Participants
Customization Scope Customization allows for the inclusion/modification of content pertaining to geographical regions, countries, and specific market segments.
Pricing & Procurement Options Explore purchase options tailored to your specific research requirements
Contact Details Consult With Our Expert

Japan (Toll-Free): +81 663-386-8111

South Korea (Toll-Free): +82-808-703-126

Saudi Arabia (Toll-Free): +966 800-850-1643

United Kingdom: +44 753-710-5080

United States: +1 302-232-5106

E-mail:  askanexpert@thenicheresearch.com


Global Active Optical Cable and Extender MarketBy Protocol

  • InfiniBand
  • Ethernet
  • HDMI
  • USB
  • Thunderbolt
  • Fiberchannel
  • Serial Attached SCSI (SAS)
  • Display Port
  •  PCI Express (PCIe)
  • Others

By Form Factor

  • QSFP
  • SFP
  • QSFP DD
  • SFP DD
  • QSFP+
  • CFP
  • SPF+
  • Others

By Distribution channel

  • Online
  • Offline

By End User Industry

  • IT & Telecommunication
  • Aerospace
  • Defense
  • Automotive
  • Consumer Electronics
  • Banking, Finance Services and Insurance
  • Media & Entertainment
  • Retail
  • Healthcare
  • Industrial
  • Others

By Region

  • North America (U.S., Canada, Mexico, Rest of North America)
  • Europe (France, The UK, Spain, Germany, Italy, Nordic Countries (Denmark, Finland, Iceland, Sweden, Norway), Benelux Union (Belgium, The Netherlands, Luxembourg), Rest of Europe)
  • Asia Pacific (China, Japan, India, New Zealand, Australia, South Korea, Southeast Asia (Indonesia, Thailand, Malaysia, Singapore, Rest of Southeast Asia), Rest of Asia Pacific)
  • Middle East & Africa (Saudi Arabia, UAE, Egypt, Kuwait, South Africa, Rest of Middle East & Africa)
  • Latin America (Brazil, Argentina, Rest of Latin America)

.

Table of Contents

.

1.Market Scope
1.1.Market Segmentation
1.2.Years Considered
1.2.1.Historic Years: 2015 – 2021
1.2.2.Base Year: 2022
1.2.3.Forecast Years: 2023 – 2031
2.Key Target Audiences
3.Research Methodology
3.1.Primary Research
3.1.1.Research Questionnaire
3.1.2.Global Percentage Breakdown
3.1.3.Primary Interviews: Key Opinion Leaders (KOLs)
3.2.Secondary Research
3.2.1.Paid Databases
3.2.2.Secondary Sources
3.3.Market Size Estimates
3.3.1.Top-Down Approach
3.3.2.Bottom-Up Approach
3.4.Data Triangulation Methodology
3.5.Research Assumptions
4.Recommendations and Insights from TNR’s Perspective**
5.Holistic Overview of Active Optical Cable and Extender Market
6.Market Synopsis: Active Optical Cable and Extender Market
7.Active Optical Cable and Extender Market Analysis: Qualitative Perspective
7.1.Introduction
7.1.1.Product Definition
7.1.2.Industry Development
7.2.Market Dynamics
7.2.1.Drivers
7.2.2.Restraints
7.2.3.Opportunities
7.3.Trends in Active Optical Cable and Extender Market
7.4.Market Determinants Radar Chart
7.5.Macro-Economic and Micro-Economic Indicators: Active Optical Cable and Extender Market
7.6.Porter’s Five Force Analysis
8.Global Active Optical Cable and Extender Market Analysis and Forecasts, 2023 – 2031
8.1.Overview
8.1.1.Global Active Optical Cable and Extender Market Revenue (US$ Mn)
8.2.Global Active Optical Cable and Extender Market Revenue (US$ Mn) and Forecasts, By Protocol
8.2.1.InfiniBand
8.2.1.1.Definition
8.2.1.2.Market Estimation and Penetration, 2015 – 2022
8.2.1.3.Market Forecast, 2023 – 2031
8.2.1.4.Compound Annual Growth Rate (CAGR)
8.2.1.5.Regional Bifurcation
8.2.1.5.1.North America
8.2.1.5.1.1.Market Estimation, 2015 – 2022
8.2.1.5.1.2.Market Forecast, 2023 – 2031
8.2.1.5.2.Europe
8.2.1.5.2.1.Market Estimation, 2015 – 2022
8.2.1.5.2.2.Market Forecast, 2023 – 2031
8.2.1.5.3.Asia Pacific
8.2.1.5.3.1.Market Estimation, 2015 – 2022
8.2.1.5.3.2.Market Forecast, 2023 – 2031
8.2.1.5.4.Middle East and Africa
8.2.1.5.4.1.Market Estimation, 2015 – 2022
8.2.1.5.4.2.Market Forecast, 2023 – 2031
8.2.1.5.5.Latin America
8.2.1.5.5.1.Market Estimation, 2015 – 2022
8.2.1.5.5.2.Market Forecast, 2023 – 2031
8.2.2.Ethernet
8.2.2.1.Definition
8.2.2.2.Market Estimation and Penetration, 2015 – 2022
8.2.2.3.Market Forecast, 2023 – 2031
8.2.2.4.Compound Annual Growth Rate (CAGR)
8.2.2.5.Regional Bifurcation
8.2.2.5.1.North America
8.2.2.5.1.1.Market Estimation, 2015 – 2022
8.2.2.5.1.2.Market Forecast, 2023 – 2031
8.2.2.5.2.Europe
8.2.2.5.2.1.Market Estimation, 2015 – 2022
8.2.2.5.2.2.Market Forecast, 2023 – 2031
8.2.2.5.3.Asia Pacific
8.2.2.5.3.1.Market Estimation, 2015 – 2022
8.2.2.5.3.2.Market Forecast, 2023 – 2031
8.2.2.5.4.Middle East and Africa
8.2.2.5.4.1.Market Estimation, 2015 – 2022
8.2.2.5.4.2.Market Forecast, 2023 – 2031
8.2.2.5.5.Latin America
8.2.2.5.5.1.Market Estimation, 2015 – 2022
8.2.2.5.5.2.Market Forecast, 2023 – 2031
8.2.3.HDMI
8.2.3.1.Definition
8.2.3.2.Market Estimation and Penetration, 2015 – 2022
8.2.3.3.Market Forecast, 2023 – 2031
8.2.3.4.Compound Annual Growth Rate (CAGR)
8.2.3.5.Regional Bifurcation
8.2.3.5.1.North America
8.2.3.5.1.1.Market Estimation, 2015 – 2022
8.2.3.5.1.2.Market Forecast, 2023 – 2031
8.2.3.5.2.Europe
8.2.3.5.2.1.Market Estimation, 2015 – 2022
8.2.3.5.2.2.Market Forecast, 2023 – 2031
8.2.3.5.3.Asia Pacific
8.2.3.5.3.1.Market Estimation, 2015 – 2022
8.2.3.5.3.2.Market Forecast, 2023 – 2031
8.2.3.5.4.Middle East and Africa
8.2.3.5.4.1.Market Estimation, 2015 – 2022
8.2.3.5.4.2.Market Forecast, 2023 – 2031
8.2.3.5.5.Latin America
8.2.3.5.5.1.Market Estimation, 2015 – 2022
8.2.3.5.5.2.Market Forecast, 2023 – 2031
8.2.4.USB
8.2.4.1.Definition
8.2.4.2.Market Estimation and Penetration, 2015 – 2022
8.2.4.3.Market Forecast, 2023 – 2031
8.2.4.4.Compound Annual Growth Rate (CAGR)
8.2.4.5.Regional Bifurcation
8.2.4.5.1.North America
8.2.4.5.1.1.Market Estimation, 2015 – 2022
8.2.4.5.1.2.Market Forecast, 2023 – 2031
8.2.4.5.2.Europe
8.2.4.5.2.1.Market Estimation, 2015 – 2022
8.2.4.5.2.2.Market Forecast, 2023 – 2031
8.2.4.5.3.Asia Pacific
8.2.4.5.3.1.Market Estimation, 2015 – 2022
8.2.4.5.3.2.Market Forecast, 2023 – 2031
8.2.4.5.4.Middle East and Africa
8.2.4.5.4.1.Market Estimation, 2015 – 2022
8.2.4.5.4.2.Market Forecast, 2023 – 2031
8.2.4.5.5.Latin America
8.2.4.5.5.1.Market Estimation, 2015 – 2022
8.2.4.5.5.2.Market Forecast, 2023 – 2031
8.2.5.Thunderbolt
8.2.5.1.Definition
8.2.5.2.Market Estimation and Penetration, 2015 – 2022
8.2.5.3.Market Forecast, 2023 – 2031
8.2.5.4.Compound Annual Growth Rate (CAGR)
8.2.5.5.Regional Bifurcation
8.2.5.5.1.North America
8.2.5.5.1.1.Market Estimation, 2015 – 2022
8.2.5.5.1.2.Market Forecast, 2023 – 2031
8.2.5.5.2.Europe
8.2.5.5.2.1.Market Estimation, 2015 – 2022
8.2.5.5.2.2.Market Forecast, 2023 – 2031
8.2.5.5.3.Asia Pacific
8.2.5.5.3.1.Market Estimation, 2015 – 2022
8.2.5.5.3.2.Market Forecast, 2023 – 2031
8.2.5.5.4.Middle East and Africa
8.2.5.5.4.1.Market Estimation, 2015 – 2022
8.2.5.5.4.2.Market Forecast, 2023 – 2031
8.2.5.5.5.Latin America
8.2.5.5.5.1.Market Estimation, 2015 – 2022
8.2.5.5.5.2.Market Forecast, 2023 – 2031
8.2.6.Fiberchannel
8.2.6.1.Definition
8.2.6.2.Market Estimation and Penetration, 2015 – 2022
8.2.6.3.Market Forecast, 2023 – 2031
8.2.6.4.Compound Annual Growth Rate (CAGR)
8.2.6.5.Regional Bifurcation
8.2.6.5.1.North America
8.2.6.5.1.1.Market Estimation, 2015 – 2022
8.2.6.5.1.2.Market Forecast, 2023 – 2031
8.2.6.5.2.Europe
8.2.6.5.2.1.Market Estimation, 2015 – 2022
8.2.6.5.2.2.Market Forecast, 2023 – 2031
8.2.6.5.3.Asia Pacific
8.2.6.5.3.1.Market Estimation, 2015 – 2022
8.2.6.5.3.2.Market Forecast, 2023 – 2031
8.2.6.5.4.Middle East and Africa
8.2.6.5.4.1.Market Estimation, 2015 – 2022
8.2.6.5.4.2.Market Forecast, 2023 – 2031
8.2.6.5.5.Latin America
8.2.6.5.5.1.Market Estimation, 2015 – 2022
8.2.6.5.5.2.Market Forecast, 2023 – 2031
8.2.7.Serial Attached SCSI (SAS)
8.2.7.1.Definition
8.2.7.2.Market Estimation and Penetration, 2015 – 2022
8.2.7.3.Market Forecast, 2023 – 2031
8.2.7.4.Compound Annual Growth Rate (CAGR)
8.2.7.5.Regional Bifurcation
8.2.7.5.1.North America
8.2.7.5.1.1.Market Estimation, 2015 – 2022
8.2.7.5.1.2.Market Forecast, 2023 – 2031
8.2.7.5.2.Europe
8.2.7.5.2.1.Market Estimation, 2015 – 2022
8.2.7.5.2.2.Market Forecast, 2023 – 2031
8.2.7.5.3.Asia Pacific
8.2.7.5.3.1.Market Estimation, 2015 – 2022
8.2.7.5.3.2.Market Forecast, 2023 – 2031
8.2.7.5.4.Middle East and Africa
8.2.7.5.4.1.Market Estimation, 2015 – 2022
8.2.7.5.4.2.Market Forecast, 2023 – 2031
8.2.7.5.5.Latin America
8.2.7.5.5.1.Market Estimation, 2015 – 2022
8.2.7.5.5.2.Market Forecast, 2023 – 2031
8.2.8.Display Port
8.2.8.1.Definition
8.2.8.2.Market Estimation and Penetration, 2015 – 2022
8.2.8.3.Market Forecast, 2023 – 2031
8.2.8.4.Compound Annual Growth Rate (CAGR)
8.2.8.5.Regional Bifurcation
8.2.8.5.1.North America
8.2.8.5.1.1.Market Estimation, 2015 – 2022
8.2.8.5.1.2.Market Forecast, 2023 – 2031
8.2.8.5.2.Europe
8.2.8.5.2.1.Market Estimation, 2015 – 2022
8.2.8.5.2.2.Market Forecast, 2023 – 2031
8.2.8.5.3.Asia Pacific
8.2.8.5.3.1.Market Estimation, 2015 – 2022
8.2.8.5.3.2.Market Forecast, 2023 – 2031
8.2.8.5.4.Middle East and Africa
8.2.8.5.4.1.Market Estimation, 2015 – 2022
8.2.8.5.4.2.Market Forecast, 2023 – 2031
8.2.8.5.5.Latin America
8.2.8.5.5.1.Market Estimation, 2015 – 2022
8.2.8.5.5.2.Market Forecast, 2023 – 2031
8.2.9.PCI Express (PCIe)
8.2.9.1.Definition
8.2.9.2.Market Estimation and Penetration, 2015 – 2022
8.2.9.3.Market Forecast, 2023 – 2031
8.2.9.4.Compound Annual Growth Rate (CAGR)
8.2.9.5.Regional Bifurcation
8.2.9.5.1.North America
8.2.9.5.1.1.Market Estimation, 2015 – 2022
8.2.9.5.1.2.Market Forecast, 2023 – 2031
8.2.9.5.2.Europe
8.2.9.5.2.1.Market Estimation, 2015 – 2022
8.2.9.5.2.2.Market Forecast, 2023 – 2031
8.2.9.5.3.Asia Pacific
8.2.9.5.3.1.Market Estimation, 2015 – 2022
8.2.9.5.3.2.Market Forecast, 2023 – 2031
8.2.9.5.4.Middle East and Africa
8.2.9.5.4.1.Market Estimation, 2015 – 2022
8.2.9.5.4.2.Market Forecast, 2023 – 2031
8.2.9.5.5.Latin America
8.2.9.5.5.1.Market Estimation, 2015 – 2022
8.2.9.5.5.2.Market Forecast, 2023 – 2031
8.2.10.Others
8.2.10.1.Definition
8.2.10.2.Market Estimation and Penetration, 2015 – 2022
8.2.10.3.Market Forecast, 2023 – 2031
8.2.10.4.Compound Annual Growth Rate (CAGR)
8.2.10.5.Regional Bifurcation
8.2.10.5.1.North America
8.2.10.5.1.1.Market Estimation, 2015 – 2022
8.2.10.5.1.2.Market Forecast, 2023 – 2031
8.2.10.5.2.Europe
8.2.10.5.2.1.Market Estimation, 2015 – 2022
8.2.10.5.2.2.Market Forecast, 2023 – 2031
8.2.10.5.3.Asia Pacific
8.2.10.5.3.1.Market Estimation, 2015 – 2022
8.2.10.5.3.2.Market Forecast, 2023 – 2031
8.2.10.5.4.Middle East and Africa
8.2.10.5.4.1.Market Estimation, 2015 – 2022
8.2.10.5.4.2.Market Forecast, 2023 – 2031
8.2.10.5.5.Latin America
8.2.10.5.5.1.Market Estimation, 2015 – 2022
8.2.10.5.5.2.Market Forecast, 2023 – 2031
8.3.Key Segment for Channeling Investments
8.3.1.By Protocol
9.Global Active Optical Cable and Extender Market Analysis and Forecasts, 2023 – 2031
9.1.Overview
9.2.Global Active Optical Cable and Extender Market Revenue (US$ Mn) and Forecasts, By Form Factor
9.2.1.QSFP
9.2.1.1.Definition
9.2.1.2.Market Estimation and Penetration, 2015 – 2022
9.2.1.3.Market Forecast, 2023 – 2031
9.2.1.4.Compound Annual Growth Rate (CAGR)
9.2.1.5.Regional Bifurcation
9.2.1.5.1.North America
9.2.1.5.1.1.Market Estimation, 2015 – 2022
9.2.1.5.1.2.Market Forecast, 2023 – 2031
9.2.1.5.2.Europe
9.2.1.5.2.1.Market Estimation, 2015 – 2022
9.2.1.5.2.2.Market Forecast, 2023 – 2031
9.2.1.5.3.Asia Pacific
9.2.1.5.3.1.Market Estimation, 2015 – 2022
9.2.1.5.3.2.Market Forecast, 2023 – 2031
9.2.1.5.4.Middle East and Africa
9.2.1.5.4.1.Market Estimation, 2015 – 2022
9.2.1.5.4.2.Market Forecast, 2023 – 2031
9.2.1.5.5.Latin America
9.2.1.5.5.1.Market Estimation, 2015 – 2022
9.2.1.5.5.2.Market Forecast, 2023 – 2031
9.2.2.SFP
9.2.2.1.Definition
9.2.2.2.Market Estimation and Penetration, 2015 – 2022
9.2.2.3.Market Forecast, 2023 – 2031
9.2.2.4.Compound Annual Growth Rate (CAGR)
9.2.2.5.Regional Bifurcation
9.2.2.5.1.North America
9.2.2.5.1.1.Market Estimation, 2015 – 2022
9.2.2.5.1.2.Market Forecast, 2023 – 2031
9.2.2.5.2.Europe
9.2.2.5.2.1.Market Estimation, 2015 – 2022
9.2.2.5.2.2.Market Forecast, 2023 – 2031
9.2.2.5.3.Asia Pacific
9.2.2.5.3.1.Market Estimation, 2015 – 2022
9.2.2.5.3.2.Market Forecast, 2023 – 2031
9.2.2.5.4.Middle East and Africa
9.2.2.5.4.1.Market Estimation, 2015 – 2022
9.2.2.5.4.2.Market Forecast, 2023 – 2031
9.2.2.5.5.Latin America
9.2.2.5.5.1.Market Estimation, 2015 – 2022
9.2.2.5.5.2.Market Forecast, 2023 – 2031
9.2.3.QSFP DD
9.2.3.1.Definition
9.2.3.2.Market Estimation and Penetration, 2015 – 2022
9.2.3.3.Market Forecast, 2023 – 2031
9.2.3.4.Compound Annual Growth Rate (CAGR)
9.2.3.5.Regional Bifurcation
9.2.3.5.1.North America
9.2.3.5.1.1.Market Estimation, 2015 – 2022
9.2.3.5.1.2.Market Forecast, 2023 – 2031
9.2.3.5.2.Europe
9.2.3.5.2.1.Market Estimation, 2015 – 2022
9.2.3.5.2.2.Market Forecast, 2023 – 2031
9.2.3.5.3.Asia Pacific
9.2.3.5.3.1.Market Estimation, 2015 – 2022
9.2.3.5.3.2.Market Forecast, 2023 – 2031
9.2.3.5.4.Middle East and Africa
9.2.3.5.4.1.Market Estimation, 2015 – 2022
9.2.3.5.4.2.Market Forecast, 2023 – 2031
9.2.3.5.5.Latin America
9.2.3.5.5.1.Market Estimation, 2015 – 2022
9.2.3.5.5.2.Market Forecast, 2023 – 2031
9.2.4.SFP DD
9.2.4.1.Definition
9.2.4.2.Market Estimation and Penetration, 2015 – 2022
9.2.4.3.Market Forecast, 2023 – 2031
9.2.4.4.Compound Annual Growth Rate (CAGR)
9.2.4.5.Regional Bifurcation
9.2.4.5.1.North America
9.2.4.5.1.1.Market Estimation, 2015 – 2022
9.2.4.5.1.2.Market Forecast, 2023 – 2031
9.2.4.5.2.Europe
9.2.4.5.2.1.Market Estimation, 2015 – 2022
9.2.4.5.2.2.Market Forecast, 2023 – 2031
9.2.4.5.3.Asia Pacific
9.2.4.5.3.1.Market Estimation, 2015 – 2022
9.2.4.5.3.2.Market Forecast, 2023 – 2031
9.2.4.5.4.Middle East and Africa
9.2.4.5.4.1.Market Estimation, 2015 – 2022
9.2.4.5.4.2.Market Forecast, 2023 – 2031
9.2.4.5.5.Latin America
9.2.4.5.5.1.Market Estimation, 2015 – 2022
9.2.4.5.5.2.Market Forecast, 2023 – 2031
9.2.5.QSFP+
9.2.5.1.Definition
9.2.5.2.Market Estimation and Penetration, 2015 – 2022
9.2.5.3.Market Forecast, 2023 – 2031
9.2.5.4.Compound Annual Growth Rate (CAGR)
9.2.5.5.Regional Bifurcation
9.2.5.5.1.North America
9.2.5.5.1.1.Market Estimation, 2015 – 2022
9.2.5.5.1.2.Market Forecast, 2023 – 2031
9.2.5.5.2.Europe
9.2.5.5.2.1.Market Estimation, 2015 – 2022
9.2.5.5.2.2.Market Forecast, 2023 – 2031
9.2.5.5.3.Asia Pacific
9.2.5.5.3.1.Market Estimation, 2015 – 2022
9.2.5.5.3.2.Market Forecast, 2023 – 2031
9.2.5.5.4.Middle East and Africa
9.2.5.5.4.1.Market Estimation, 2015 – 2022
9.2.5.5.4.2.Market Forecast, 2023 – 2031
9.2.5.5.5.Latin America
9.2.5.5.5.1.Market Estimation, 2015 – 2022
9.2.5.5.5.2.Market Forecast, 2023 – 2031
9.2.6.CFP
9.2.6.1.Definition
9.2.6.2.Market Estimation and Penetration, 2015 – 2022
9.2.6.3.Market Forecast, 2023 – 2031
9.2.6.4.Compound Annual Growth Rate (CAGR)
9.2.6.5.Regional Bifurcation
9.2.6.5.1.North America
9.2.6.5.1.1.Market Estimation, 2015 – 2022
9.2.6.5.1.2.Market Forecast, 2023 – 2031
9.2.6.5.2.Europe
9.2.6.5.2.1.Market Estimation, 2015 – 2022
9.2.6.5.2.2.Market Forecast, 2023 – 2031
9.2.6.5.3.Asia Pacific
9.2.6.5.3.1.Market Estimation, 2015 – 2022
9.2.6.5.3.2.Market Forecast, 2023 – 2031
9.2.6.5.4.Middle East and Africa
9.2.6.5.4.1.Market Estimation, 2015 – 2022
9.2.6.5.4.2.Market Forecast, 2023 – 2031
9.2.6.5.5.Latin America
9.2.6.5.5.1.Market Estimation, 2015 – 2022
9.2.6.5.5.2.Market Forecast, 2023 – 2031
9.2.7.SPF+
9.2.7.1.Definition
9.2.7.2.Market Estimation and Penetration, 2015 – 2022
9.2.7.3.Market Forecast, 2023 – 2031
9.2.7.4.Compound Annual Growth Rate (CAGR)
9.2.7.5.Regional Bifurcation
9.2.7.5.1.North America
9.2.7.5.1.1.Market Estimation, 2015 – 2022
9.2.7.5.1.2.Market Forecast, 2023 – 2031
9.2.7.5.2.Europe
9.2.7.5.2.1.Market Estimation, 2015 – 2022
9.2.7.5.2.2.Market Forecast, 2023 – 2031
9.2.7.5.3.Asia Pacific
9.2.7.5.3.1.Market Estimation, 2015 – 2022
9.2.7.5.3.2.Market Forecast, 2023 – 2031
9.2.7.5.4.Middle East and Africa
9.2.7.5.4.1.Market Estimation, 2015 – 2022
9.2.7.5.4.2.Market Forecast, 2023 – 2031
9.2.7.5.5.Latin America
9.2.7.5.5.1.Market Estimation, 2015 – 2022
9.2.7.5.5.2.Market Forecast, 2023 – 2031
9.2.8.Others
9.2.8.1.Definition
9.2.8.2.Market Estimation and Penetration, 2015 – 2022
9.2.8.3.Market Forecast, 2023 – 2031
9.2.8.4.Compound Annual Growth Rate (CAGR)
9.2.8.5.Regional Bifurcation
9.2.8.5.1.North America
9.2.8.5.1.1.Market Estimation, 2015 – 2022
9.2.8.5.1.2.Market Forecast, 2023 – 2031
9.2.8.5.2.Europe
9.2.8.5.2.1.Market Estimation, 2015 – 2022
9.2.8.5.2.2.Market Forecast, 2023 – 2031
9.2.8.5.3.Asia Pacific
9.2.8.5.3.1.Market Estimation, 2015 – 2022
9.2.8.5.3.2.Market Forecast, 2023 – 2031
9.2.8.5.4.Middle East and Africa
9.2.8.5.4.1.Market Estimation, 2015 – 2022
9.2.8.5.4.2.Market Forecast, 2023 – 2031
9.2.8.5.5.Latin America
9.2.8.5.5.1.Market Estimation, 2015 – 2022
9.2.8.5.5.2.Market Forecast, 2023 – 2031
9.3.Key Segment for Channeling Investments
9.3.1.By Form Factor
10.Global Active Optical Cable and Extender Market Analysis and Forecasts, 2023 – 2031
10.1.Overview
10.2.Global Active Optical Cable and Extender Market Revenue (US$ Mn) and Forecasts, By Distribution channel
10.2.1.Online
10.2.1.1.Definition
10.2.1.2.Market Estimation and Penetration, 2015 – 2022
10.2.1.3.Market Forecast, 2023 – 2031
10.2.1.4.Compound Annual Growth Rate (CAGR)
10.2.1.5.Regional Bifurcation
10.2.1.5.1.North America
10.2.1.5.1.1.Market Estimation, 2015 – 2022
10.2.1.5.1.2.Market Forecast, 2023 – 2031
10.2.1.5.2.Europe
10.2.1.5.2.1.Market Estimation, 2015 – 2022
10.2.1.5.2.2.Market Forecast, 2023 – 2031
10.2.1.5.3.Asia Pacific
10.2.1.5.3.1.Market Estimation, 2015 – 2022
10.2.1.5.3.2.Market Forecast, 2023 – 2031
10.2.1.5.4.Middle East and Africa
10.2.1.5.4.1.Market Estimation, 2015 – 2022
10.2.1.5.4.2.Market Forecast, 2023 – 2031
10.2.1.5.5.Latin America
10.2.1.5.5.1.Market Estimation, 2015 – 2022
10.2.1.5.5.2.Market Forecast, 2023 – 2031
10.2.2.Offline
10.2.2.1.Definition
10.2.2.2.Market Estimation and Penetration, 2015 – 2022
10.2.2.3.Market Forecast, 2023 – 2031
10.2.2.4.Compound Annual Growth Rate (CAGR)
10.2.2.5.Regional Bifurcation
10.2.2.5.1.North America
10.2.2.5.1.1.Market Estimation, 2015 – 2022
10.2.2.5.1.2.Market Forecast, 2023 – 2031
10.2.2.5.2.Europe
10.2.2.5.2.1.Market Estimation, 2015 – 2022
10.2.2.5.2.2.Market Forecast, 2023 – 2031
10.2.2.5.3.Asia Pacific
10.2.2.5.3.1.Market Estimation, 2015 – 2022
10.2.2.5.3.2.Market Forecast, 2023 – 2031
10.2.2.5.4.Middle East and Africa
10.2.2.5.4.1.Market Estimation, 2015 – 2022
10.2.2.5.4.2.Market Forecast, 2023 – 2031
10.2.2.5.5.Latin America
10.2.2.5.5.1.Market Estimation, 2015 – 2022
10.2.2.5.5.2.Market Forecast, 2023 – 2031
10.3.Key Segment for Channeling Investments
10.3.1.By Distribution channel
11.Global Active Optical Cable and Extender Market Analysis and Forecasts, 2023 – 2031
11.1.Overview
11.2.Global Active Optical Cable and Extender Market Revenue (US$ Mn) and Forecasts, By End User Industry
11.2.1.IT and Telecommunication
11.2.1.1.Definition
11.2.1.2.Market Estimation and Penetration, 2015 – 2022
11.2.1.3.Market Forecast, 2023 – 2031
11.2.1.4.Compound Annual Growth Rate (CAGR)
11.2.1.5.Regional Bifurcation
11.2.1.5.1.North America
11.2.1.5.1.1.Market Estimation, 2015 – 2022
11.2.1.5.1.2.Market Forecast, 2023 – 2031
11.2.1.5.2.Europe
11.2.1.5.2.1.Market Estimation, 2015 – 2022
11.2.1.5.2.2.Market Forecast, 2023 – 2031
11.2.1.5.3.Asia Pacific
11.2.1.5.3.1.Market Estimation, 2015 – 2022
11.2.1.5.3.2.Market Forecast, 2023 – 2031
11.2.1.5.4.Middle East and Africa
11.2.1.5.4.1.Market Estimation, 2015 – 2022
11.2.1.5.4.2.Market Forecast, 2023 – 2031
11.2.1.5.5.Latin America
11.2.1.5.5.1.Market Estimation, 2015 – 2022
11.2.1.5.5.2.Market Forecast, 2023 – 2031
11.2.2.Aerospace
11.2.2.1.Definition
11.2.2.2.Market Estimation and Penetration, 2015 – 2022
11.2.2.3.Market Forecast, 2023 – 2031
11.2.2.4.Compound Annual Growth Rate (CAGR)
11.2.2.5.Regional Bifurcation
11.2.2.5.1.North America
11.2.2.5.1.1.Market Estimation, 2015 – 2022
11.2.2.5.1.2.Market Forecast, 2023 – 2031
11.2.2.5.2.Europe
11.2.2.5.2.1.Market Estimation, 2015 – 2022
11.2.2.5.2.2.Market Forecast, 2023 – 2031
11.2.2.5.3.Asia Pacific
11.2.2.5.3.1.Market Estimation, 2015 – 2022
11.2.2.5.3.2.Market Forecast, 2023 – 2031
11.2.2.5.4.Middle East and Africa
11.2.2.5.4.1.Market Estimation, 2015 – 2022
11.2.2.5.4.2.Market Forecast, 2023 – 2031
11.2.2.5.5.Latin America
11.2.2.5.5.1.Market Estimation, 2015 – 2022
11.2.2.5.5.2.Market Forecast, 2023 – 2031
11.2.3.Defense
11.2.3.1.Definition
11.2.3.2.Market Estimation and Penetration, 2015 – 2022
11.2.3.3.Market Forecast, 2023 – 2031
11.2.3.4.Compound Annual Growth Rate (CAGR)
11.2.3.5.Regional Bifurcation
11.2.3.5.1.North America
11.2.3.5.1.1.Market Estimation, 2015 – 2022
11.2.3.5.1.2.Market Forecast, 2023 – 2031
11.2.3.5.2.Europe
11.2.3.5.2.1.Market Estimation, 2015 – 2022
11.2.3.5.2.2.Market Forecast, 2023 – 2031
11.2.3.5.3.Asia Pacific
11.2.3.5.3.1.Market Estimation, 2015 – 2022
11.2.3.5.3.2.Market Forecast, 2023 – 2031
11.2.3.5.4.Middle East and Africa
11.2.3.5.4.1.Market Estimation, 2015 – 2022
11.2.3.5.4.2.Market Forecast, 2023 – 2031
11.2.3.5.5.Latin America
11.2.3.5.5.1.Market Estimation, 2015 – 2022
11.2.3.5.5.2.Market Forecast, 2023 – 2031
11.2.4.Automotive
11.2.4.1.Definition
11.2.4.2.Market Estimation and Penetration, 2015 – 2022
11.2.4.3.Market Forecast, 2023 – 2031
11.2.4.4.Compound Annual Growth Rate (CAGR)
11.2.4.5.Regional Bifurcation
11.2.4.5.1.North America
11.2.4.5.1.1.Market Estimation, 2015 – 2022
11.2.4.5.1.2.Market Forecast, 2023 – 2031
11.2.4.5.2.Europe
11.2.4.5.2.1.Market Estimation, 2015 – 2022
11.2.4.5.2.2.Market Forecast, 2023 – 2031
11.2.4.5.3.Asia Pacific
11.2.4.5.3.1.Market Estimation, 2015 – 2022
11.2.4.5.3.2.Market Forecast, 2023 – 2031
11.2.4.5.4.Middle East and Africa
11.2.4.5.4.1.Market Estimation, 2015 – 2022
11.2.4.5.4.2.Market Forecast, 2023 – 2031
11.2.4.5.5.Latin America
11.2.4.5.5.1.Market Estimation, 2015 – 2022
11.2.4.5.5.2.Market Forecast, 2023 – 2031
11.2.5.Consumer Electronics
11.2.5.1.Definition
11.2.5.2.Market Estimation and Penetration, 2015 – 2022
11.2.5.3.Market Forecast, 2023 – 2031
11.2.5.4.Compound Annual Growth Rate (CAGR)
11.2.5.5.Regional Bifurcation
11.2.5.5.1.North America
11.2.5.5.1.1.Market Estimation, 2015 – 2022
11.2.5.5.1.2.Market Forecast, 2023 – 2031
11.2.5.5.2.Europe
11.2.5.5.2.1.Market Estimation, 2015 – 2022
11.2.5.5.2.2.Market Forecast, 2023 – 2031
11.2.5.5.3.Asia Pacific
11.2.5.5.3.1.Market Estimation, 2015 – 2022
11.2.5.5.3.2.Market Forecast, 2023 – 2031
11.2.5.5.4.Middle East and Africa
11.2.5.5.4.1.Market Estimation, 2015 – 2022
11.2.5.5.4.2.Market Forecast, 2023 – 2031
11.2.5.5.5.Latin America
11.2.5.5.5.1.Market Estimation, 2015 – 2022
11.2.5.5.5.2.Market Forecast, 2023 – 2031
11.2.6.Banking, Finance Services and Insurance (BFSI)
11.2.6.1.Definition
11.2.6.2.Market Estimation and Penetration, 2015 – 2022
11.2.6.3.Market Forecast, 2023 – 2031
11.2.6.4.Compound Annual Growth Rate (CAGR)
11.2.6.5.Regional Bifurcation
11.2.6.5.1.North America
11.2.6.5.1.1.Market Estimation, 2015 – 2022
11.2.6.5.1.2.Market Forecast, 2023 – 2031
11.2.6.5.2.Europe
11.2.6.5.2.1.Market Estimation, 2015 – 2022
11.2.6.5.2.2.Market Forecast, 2023 – 2031
11.2.6.5.3.Asia Pacific
11.2.6.5.3.1.Market Estimation, 2015 – 2022
11.2.6.5.3.2.Market Forecast, 2023 – 2031
11.2.6.5.4.Middle East and Africa
11.2.6.5.4.1.Market Estimation, 2015 – 2022
11.2.6.5.4.2.Market Forecast, 2023 – 2031
11.2.6.5.5.Latin America
11.2.6.5.5.1.Market Estimation, 2015 – 2022
11.2.6.5.5.2.Market Forecast, 2023 – 2031
11.2.7.Media and Entertainment
11.2.7.1.Definition
11.2.7.2.Market Estimation and Penetration, 2015 – 2022
11.2.7.3.Market Forecast, 2023 – 2031
11.2.7.4.Compound Annual Growth Rate (CAGR)
11.2.7.5.Regional Bifurcation
11.2.7.5.1.North America
11.2.7.5.1.1.Market Estimation, 2015 – 2022
11.2.7.5.1.2.Market Forecast, 2023 – 2031
11.2.7.5.2.Europe
11.2.7.5.2.1.Market Estimation, 2015 – 2022
11.2.7.5.2.2.Market Forecast, 2023 – 2031
11.2.7.5.3.Asia Pacific
11.2.7.5.3.1.Market Estimation, 2015 – 2022
11.2.7.5.3.2.Market Forecast, 2023 – 2031
11.2.7.5.4.Middle East and Africa
11.2.7.5.4.1.Market Estimation, 2015 – 2022
11.2.7.5.4.2.Market Forecast, 2023 – 2031
11.2.7.5.5.Latin America
11.2.7.5.5.1.Market Estimation, 2015 – 2022
11.2.7.5.5.2.Market Forecast, 2023 – 2031
11.2.8.Retail
11.2.8.1.Definition
11.2.8.2.Market Estimation and Penetration, 2015 – 2022
11.2.8.3.Market Forecast, 2023 – 2031
11.2.8.4.Compound Annual Growth Rate (CAGR)
11.2.8.5.Regional Bifurcation
11.2.8.5.1.North America
11.2.8.5.1.1.Market Estimation, 2015 – 2022
11.2.8.5.1.2.Market Forecast, 2023 – 2031
11.2.8.5.2.Europe
11.2.8.5.2.1.Market Estimation, 2015 – 2022
11.2.8.5.2.2.Market Forecast, 2023 – 2031
11.2.8.5.3.Asia Pacific
11.2.8.5.3.1.Market Estimation, 2015 – 2022
11.2.8.5.3.2.Market Forecast, 2023 – 2031
11.2.8.5.4.Middle East and Africa
11.2.8.5.4.1.Market Estimation, 2015 – 2022
11.2.8.5.4.2.Market Forecast, 2023 – 2031
11.2.8.5.5.Latin America
11.2.8.5.5.1.Market Estimation, 2015 – 2022
11.2.8.5.5.2.Market Forecast, 2023 – 2031
11.2.9.Healthcare
11.2.9.1.Definition
11.2.9.2.Market Estimation and Penetration, 2015 – 2022
11.2.9.3.Market Forecast, 2023 – 2031
11.2.9.4.Compound Annual Growth Rate (CAGR)
11.2.9.5.Regional Bifurcation
11.2.9.5.1.North America
11.2.9.5.1.1.Market Estimation, 2015 – 2022
11.2.9.5.1.2.Market Forecast, 2023 – 2031
11.2.9.5.2.Europe
11.2.9.5.2.1.Market Estimation, 2015 – 2022
11.2.9.5.2.2.Market Forecast, 2023 – 2031
11.2.9.5.3.Asia Pacific
11.2.9.5.3.1.Market Estimation, 2015 – 2022
11.2.9.5.3.2.Market Forecast, 2023 – 2031
11.2.9.5.4.Middle East and Africa
11.2.9.5.4.1.Market Estimation, 2015 – 2022
11.2.9.5.4.2.Market Forecast, 2023 – 2031
11.2.9.5.5.Latin America
11.2.9.5.5.1.Market Estimation, 2015 – 2022
11.2.9.5.5.2.Market Forecast, 2023 – 2031
11.2.10.Industrial
11.2.10.1.Definition
11.2.10.2.Market Estimation and Penetration, 2015 – 2022
11.2.10.3.Market Forecast, 2023 – 2031
11.2.10.4.Compound Annual Growth Rate (CAGR)
11.2.10.5.Regional Bifurcation
11.2.10.5.1.North America
11.2.10.5.1.1.Market Estimation, 2015 – 2022
11.2.10.5.1.2.Market Forecast, 2023 – 2031
11.2.10.5.2.Europe
11.2.10.5.2.1.Market Estimation, 2015 – 2022
11.2.10.5.2.2.Market Forecast, 2023 – 2031
11.2.10.5.3.Asia Pacific
11.2.10.5.3.1.Market Estimation, 2015 – 2022
11.2.10.5.3.2.Market Forecast, 2023 – 2031
11.2.10.5.4.Middle East and Africa
11.2.10.5.4.1.Market Estimation, 2015 – 2022
11.2.10.5.4.2.Market Forecast, 2023 – 2031
11.2.10.5.5.Latin America
11.2.10.5.5.1.Market Estimation, 2015 – 2022
11.2.10.5.5.2.Market Forecast, 2023 – 2031
11.2.11.Others
11.2.11.1.Definition
11.2.11.2.Market Estimation and Penetration, 2015 – 2022
11.2.11.3.Market Forecast, 2023 – 2031
11.2.11.4.Compound Annual Growth Rate (CAGR)
11.2.11.5.Regional Bifurcation
11.2.11.5.1.North America
11.2.11.5.1.1.Market Estimation, 2015 – 2022
11.2.11.5.1.2.Market Forecast, 2023 – 2031
11.2.11.5.2.Europe
11.2.11.5.2.1.Market Estimation, 2015 – 2022
11.2.11.5.2.2.Market Forecast, 2023 – 2031
11.2.11.5.3.Asia Pacific
11.2.11.5.3.1.Market Estimation, 2015 – 2022
11.2.11.5.3.2.Market Forecast, 2023 – 2031
11.2.11.5.4.Middle East and Africa
11.2.11.5.4.1.Market Estimation, 2015 – 2022
11.2.11.5.4.2.Market Forecast, 2023 – 2031
11.2.11.5.5.Latin America
11.2.11.5.5.1.Market Estimation, 2015 – 2022
11.2.11.5.5.2.Market Forecast, 2023 – 2031
11.3.Key Segment for Channeling Investments
11.3.1.By End User Industry
12.North America Active Optical Cable and Extender Market Analysis and Forecasts, 2023 – 2031
12.1.Overview
12.1.1.North America Active Optical Cable and Extender Market Revenue (US$ Mn)
12.2.North America Active Optical Cable and Extender Market Revenue (US$ Mn) and Forecasts, By Protocol
12.2.1.InfiniBand
12.2.2.Ethernet
12.2.3.HDMI
12.2.4.USB
12.2.5.Thunderbolt
12.2.6.Fiberchannel
12.2.7.Serial Attached SCSI (SAS)
12.2.8.Display Port
12.2.9.PCI Express (PCIe)
12.2.10.Others
12.3.North America Active Optical Cable and Extender Market Revenue (US$ Mn) and Forecasts, By Form Factor
12.3.1.QSFP
12.3.2.SFP
12.3.3.QSFP DD
12.3.4.SFP DD
12.3.5.QSFP+
12.3.6.CFP
12.3.7.SPF+
12.3.8.Others
12.4.North America Active Optical Cable and Extender Market Revenue (US$ Mn) and Forecasts, By Distribution channel
12.4.1.Online
12.4.2.Offline
12.5.North America Active Optical Cable and Extender Market Revenue (US$ Mn) and Forecasts, By End User Industry
12.5.1.IT and Telecommunication
12.5.2.Aerospace
12.5.3.Defense
12.5.4.Automotive
12.5.5.Consumer Electronics
12.5.6.Banking, Finance Services and Insurance (BFSI)
12.5.7.Media and Entertainment
12.5.8.Retail
12.5.9.Healthcare
12.5.10.Industrial
12.5.11.Others
12.6.North America Active Optical Cable and Extender Market Revenue (US$ Mn) and Forecasts, By Country
12.6.1.U.S
12.6.1.1.U.S Active Optical Cable and Extender Market Revenue (US$ Mn) and Forecasts, By Protocol
12.6.1.1.1.InfiniBand
12.6.1.1.2.Ethernet
12.6.1.1.3.HDMI
12.6.1.1.4.USB
12.6.1.1.5.Thunderbolt
12.6.1.1.6.Fiberchannel
12.6.1.1.7.Serial Attached SCSI (SAS)
12.6.1.1.8.Display Port
12.6.1.1.9.PCI Express (PCIe)
12.6.1.1.10.Others
12.6.1.2.U.S Active Optical Cable and Extender Market Revenue (US$ Mn) and Forecasts, By Form Factor
12.6.1.2.1.QSFP
12.6.1.2.2.SFP
12.6.1.2.3.QSFP DD
12.6.1.2.4.SFP DD
12.6.1.2.5.QSFP+
12.6.1.2.6.CFP
12.6.1.2.7.SPF+
12.6.1.2.8.Others
12.6.1.3.U.S Active Optical Cable and Extender Market Revenue (US$ Mn) and Forecasts, By Distribution channel
12.6.1.3.1.Online
12.6.1.3.2.Offline
12.6.1.4.U.S Active Optical Cable and Extender Market Revenue (US$ Mn) and Forecasts, By End User Industry
12.6.1.4.1.IT and Telecommunication
12.6.1.4.2.Aerospace
12.6.1.4.3.Defense
12.6.1.4.4.Automotive
12.6.1.4.5.Consumer Electronics
12.6.1.4.6.Banking, Finance Services and Insurance (BFSI)
12.6.1.4.7.Media and Entertainment
12.6.1.4.8.Retail
12.6.1.4.9.Healthcare
12.6.1.4.10.Industrial
12.6.1.4.11.Others
12.6.2.Canada
12.6.2.1.Canada Active Optical Cable and Extender Market Revenue (US$ Mn) and Forecasts, By Protocol
12.6.2.1.1.InfiniBand
12.6.2.1.2.Ethernet
12.6.2.1.3.HDMI
12.6.2.1.4.USB
12.6.2.1.5.Thunderbolt
12.6.2.1.6.Fiberchannel
12.6.2.1.7.Serial Attached SCSI (SAS)
12.6.2.1.8.Display Port
12.6.2.1.9.PCI Express (PCIe)
12.6.2.1.10.Others
12.6.2.2.Canada Active Optical Cable and Extender Market Revenue (US$ Mn) and Forecasts, By Form Factor
12.6.2.2.1.QSFP
12.6.2.2.2.SFP
12.6.2.2.3.QSFP DD
12.6.2.2.4.SFP DD
12.6.2.2.5.QSFP+
12.6.2.2.6.CFP
12.6.2.2.7.SPF+
12.6.2.2.8.Others
12.6.2.3.Canada Active Optical Cable and Extender Market Revenue (US$ Mn) and Forecasts, By Distribution channel
12.6.2.3.1.Online
12.6.2.3.2.Offline
12.6.2.4.Canada Active Optical Cable and Extender Market Revenue (US$ Mn) and Forecasts, By End User Industry
12.6.2.4.1.IT and Telecommunication
12.6.2.4.2.Aerospace
12.6.2.4.3.Defense
12.6.2.4.4.Automotive
12.6.2.4.5.Consumer Electronics
12.6.2.4.6.Banking, Finance Services and Insurance (BFSI)
12.6.2.4.7.Media and Entertainment
12.6.2.4.8.Retail
12.6.2.4.9.Healthcare
12.6.2.4.10.Industrial
12.6.2.4.11.Others
12.6.3.Mexico
12.6.3.1.Mexico Active Optical Cable and Extender Market Revenue (US$ Mn) and Forecasts, By Protocol
12.6.3.1.1.InfiniBand
12.6.3.1.2.Ethernet
12.6.3.1.3.HDMI
12.6.3.1.4.USB
12.6.3.1.5.Thunderbolt
12.6.3.1.6.Fiberchannel
12.6.3.1.7.Serial Attached SCSI (SAS)
12.6.3.1.8.Display Port
12.6.3.1.9.PCI Express (PCIe)
12.6.3.1.10.Others
12.6.3.2.Mexico Active Optical Cable and Extender Market Revenue (US$ Mn) and Forecasts, By Form Factor
12.6.3.2.1.QSFP
12.6.3.2.2.SFP
12.6.3.2.3.QSFP DD
12.6.3.2.4.SFP DD
12.6.3.2.5.QSFP+
12.6.3.2.6.CFP
12.6.3.2.7.SPF+
12.6.3.2.8.Others
12.6.3.3.Mexico Active Optical Cable and Extender Market Revenue (US$ Mn) and Forecasts, By Distribution channel
12.6.3.3.1.Online
12.6.3.3.2.Offline
12.6.3.4.Mexico Active Optical Cable and Extender Market Revenue (US$ Mn) and Forecasts, By End User Industry
12.6.3.4.1.IT and Telecommunication
12.6.3.4.2.Aerospace
12.6.3.4.3.Defense
12.6.3.4.4.Automotive
12.6.3.4.5.Consumer Electronics
12.6.3.4.6.Banking, Finance Services and Insurance (BFSI)
12.6.3.4.7.Media and Entertainment
12.6.3.4.8.Retail
12.6.3.4.9.Healthcare
12.6.3.4.10.Industrial
12.6.3.4.11.Others
12.6.4.Rest of North America
12.6.4.1.Rest of North America Active Optical Cable and Extender Market Revenue (US$ Mn) and Forecasts, By Protocol
12.6.4.1.1.InfiniBand
12.6.4.1.2.Ethernet
12.6.4.1.3.HDMI
12.6.4.1.4.USB
12.6.4.1.5.Thunderbolt
12.6.4.1.6.Fiberchannel
12.6.4.1.7.Serial Attached SCSI (SAS)
12.6.4.1.8.Display Port
12.6.4.1.9.PCI Express (PCIe)
12.6.4.1.10.Others
12.6.4.2.Rest of North America Active Optical Cable and Extender Market Revenue (US$ Mn) and Forecasts, By Form Factor
12.6.4.2.1.QSFP
12.6.4.2.2.SFP
12.6.4.2.3.QSFP DD
12.6.4.2.4.SFP DD
12.6.4.2.5.QSFP+
12.6.4.2.6.CFP
12.6.4.2.7.SPF+
12.6.4.2.8.Others
12.6.4.3.Rest of North America Active Optical Cable and Extender Market Revenue (US$ Mn) and Forecasts, By Distribution channel
12.6.4.3.1.Online
12.6.4.3.2.Offline
12.6.4.4.Rest of North America Active Optical Cable and Extender Market Revenue (US$ Mn) and Forecasts, By End User Industry
12.6.4.4.1.IT and Telecommunication
12.6.4.4.2.Aerospace
12.6.4.4.3.Defense
12.6.4.4.4.Automotive
12.6.4.4.5.Consumer Electronics
12.6.4.4.6.Banking, Finance Services and Insurance (BFSI)
12.6.4.4.7.Media and Entertainment
12.6.4.4.8.Retail
12.6.4.4.9.Healthcare
12.6.4.4.10.Industrial
12.6.4.4.11.Others
12.7.Key Segment for Channeling Investments
12.7.1.By Country
12.7.2.By Protocol
12.7.3.By Form Factor
12.7.4.By Distribution channel
12.7.5.By End User Industry
13.Europe Active Optical Cable and Extender Market Analysis and Forecasts, 2023 – 2031
13.1.Overview
13.1.1.Europe Active Optical Cable and Extender Market Revenue (US$ Mn)
13.2.Europe Active Optical Cable and Extender Market Revenue (US$ Mn) and Forecasts, By Protocol
13.2.1.InfiniBand
13.2.2.Ethernet
13.2.3.HDMI
13.2.4.USB
13.2.5.Thunderbolt
13.2.6.Fiberchannel
13.2.7.Serial Attached SCSI (SAS)
13.2.8.Display Port
13.2.9.PCI Express (PCIe)
13.2.10.Others
13.3.Europe Active Optical Cable and Extender Market Revenue (US$ Mn) and Forecasts, By Form Factor
13.3.1.QSFP
13.3.2.SFP
13.3.3.QSFP DD
13.3.4.SFP DD
13.3.5.QSFP+
13.3.6.CFP
13.3.7.SPF+
13.3.8.Others
13.4.Europe Active Optical Cable and Extender Market Revenue (US$ Mn) and Forecasts, By Distribution channel
13.4.1.Online
13.4.2.Offline
13.5.Europe Active Optical Cable and Extender Market Revenue (US$ Mn) and Forecasts, By End User Industry
13.5.1.IT and Telecommunication
13.5.2.Aerospace
13.5.3.Defense
13.5.4.Automotive
13.5.5.Consumer Electronics
13.5.6.Banking, Finance Services and Insurance (BFSI)
13.5.7.Media and Entertainment
13.5.8.Retail
13.5.9.Healthcare
13.5.10.Industrial
13.5.11.Others
13.6.Europe Active Optical Cable and Extender Market Revenue (US$ Mn) and Forecasts, By Country
13.6.1.France
13.6.1.1.France Active Optical Cable and Extender Market Revenue (US$ Mn) and Forecasts, By Protocol
13.6.1.1.1.InfiniBand
13.6.1.1.2.Ethernet
13.6.1.1.3.HDMI
13.6.1.1.4.USB
13.6.1.1.5.Thunderbolt
13.6.1.1.6.Fiberchannel
13.6.1.1.7.Serial Attached SCSI (SAS)
13.6.1.1.8.Display Port
13.6.1.1.9.PCI Express (PCIe)
13.6.1.1.10.Others
13.6.1.2.France Active Optical Cable and Extender Market Revenue (US$ Mn) and Forecasts, By Form Factor
13.6.1.2.1.QSFP
13.6.1.2.2.SFP
13.6.1.2.3.QSFP DD
13.6.1.2.4.SFP DD
13.6.1.2.5.QSFP+
13.6.1.2.6.CFP
13.6.1.2.7.SPF+
13.6.1.2.8.Others
13.6.1.3.France Active Optical Cable and Extender Market Revenue (US$ Mn) and Forecasts, By Distribution channel
13.6.1.3.1.Online
13.6.1.3.2.Offline
13.6.1.4.France Active Optical Cable and Extender Market Revenue (US$ Mn) and Forecasts, By End User Industry
13.6.1.4.1.IT and Telecommunication
13.6.1.4.2.Aerospace
13.6.1.4.3.Defense
13.6.1.4.4.Automotive
13.6.1.4.5.Consumer Electronics
13.6.1.4.6.Banking, Finance Services and Insurance (BFSI)
13.6.1.4.7.Media and Entertainment
13.6.1.4.8.Retail
13.6.1.4.9.Healthcare
13.6.1.4.10.Industrial
13.6.1.4.11.Others
13.6.2.The UK
13.6.2.1.The UK Active Optical Cable and Extender Market Revenue (US$ Mn) and Forecasts, By Protocol
13.6.2.1.1.InfiniBand
13.6.2.1.2.Ethernet
13.6.2.1.3.HDMI
13.6.2.1.4.USB
13.6.2.1.5.Thunderbolt
13.6.2.1.6.Fiberchannel
13.6.2.1.7.Serial Attached SCSI (SAS)
13.6.2.1.8.Display Port
13.6.2.1.9.PCI Express (PCIe)
13.6.2.1.10.Others
13.6.2.2.The UK Active Optical Cable and Extender Market Revenue (US$ Mn) and Forecasts, By Form Factor
13.6.2.2.1.QSFP
13.6.2.2.2.SFP
13.6.2.2.3.QSFP DD
13.6.2.2.4.SFP DD
13.6.2.2.5.QSFP+
13.6.2.2.6.CFP
13.6.2.2.7.SPF+
13.6.2.2.8.Others
13.6.2.3.The UK Active Optical Cable and Extender Market Revenue (US$ Mn) and Forecasts, By Distribution channel
13.6.2.3.1.Online
13.6.2.3.2.Offline
13.6.2.4.The UK Active Optical Cable and Extender Market Revenue (US$ Mn) and Forecasts, By End User Industry
13.6.2.4.1.IT and Telecommunication
13.6.2.4.2.Aerospace
13.6.2.4.3.Defense
13.6.2.4.4.Automotive
13.6.2.4.5.Consumer Electronics
13.6.2.4.6.Banking, Finance Services and Insurance (BFSI)
13.6.2.4.7.Media and Entertainment
13.6.2.4.8.Retail
13.6.2.4.9.Healthcare
13.6.2.4.10.Industrial
13.6.2.4.11.Others
13.6.3.Spain
13.6.3.1.Spain Active Optical Cable and Extender Market Revenue (US$ Mn) and Forecasts, By Protocol
13.6.3.1.1.InfiniBand
13.6.3.1.2.Ethernet
13.6.3.1.3.HDMI
13.6.3.1.4.USB
13.6.3.1.5.Thunderbolt
13.6.3.1.6.Fiberchannel
13.6.3.1.7.Serial Attached SCSI (SAS)
13.6.3.1.8.Display Port
13.6.3.1.9.PCI Express (PCIe)
13.6.3.1.10.Others
13.6.3.2.Spain Active Optical Cable and Extender Market Revenue (US$ Mn) and Forecasts, By Form Factor
13.6.3.2.1.QSFP
13.6.3.2.2.SFP
13.6.3.2.3.QSFP DD
13.6.3.2.4.SFP DD
13.6.3.2.5.QSFP+
13.6.3.2.6.CFP
13.6.3.2.7.SPF+
13.6.3.2.8.Others
13.6.3.3.Spain Active Optical Cable and Extender Market Revenue (US$ Mn) and Forecasts, By Distribution channel
13.6.3.3.1.Online
13.6.3.3.2.Offline
13.6.3.4.Spain Active Optical Cable and Extender Market Revenue (US$ Mn) and Forecasts, By End User Industry
13.6.3.4.1.IT and Telecommunication
13.6.3.4.2.Aerospace
13.6.3.4.3.Defense
13.6.3.4.4.Automotive
13.6.3.4.5.Consumer Electronics
13.6.3.4.6.Banking, Finance Services and Insurance (BFSI)
13.6.3.4.7.Media and Entertainment
13.6.3.4.8.Retail
13.6.3.4.9.Healthcare
13.6.3.4.10.Industrial
13.6.3.4.11.Others
13.6.4.Germany
13.6.4.1.Germany Active Optical Cable and Extender Market Revenue (US$ Mn) and Forecasts, By Protocol
13.6.4.1.1.InfiniBand
13.6.4.1.2.Ethernet
13.6.4.1.3.HDMI
13.6.4.1.4.USB
13.6.4.1.5.Thunderbolt
13.6.4.1.6.Fiberchannel
13.6.4.1.7.Serial Attached SCSI (SAS)
13.6.4.1.8.Display Port
13.6.4.1.9.PCI Express (PCIe)
13.6.4.1.10.Others
13.6.4.2.Germany Active Optical Cable and Extender Market Revenue (US$ Mn) and Forecasts, By Form Factor
13.6.4.2.1.QSFP
13.6.4.2.2.SFP
13.6.4.2.3.QSFP DD
13.6.4.2.4.SFP DD
13.6.4.2.5.QSFP+
13.6.4.2.6.CFP
13.6.4.2.7.SPF+
13.6.4.2.8.Others
13.6.4.3.Germany Active Optical Cable and Extender Market Revenue (US$ Mn) and Forecasts, By Distribution channel
13.6.4.3.1.Online
13.6.4.3.2.Offline
13.6.4.4.Germany Active Optical Cable and Extender Market Revenue (US$ Mn) and Forecasts, By End User Industry
13.6.4.4.1.IT and Telecommunication
13.6.4.4.2.Aerospace
13.6.4.4.3.Defense
13.6.4.4.4.Automotive
13.6.4.4.5.Consumer Electronics
13.6.4.4.6.Banking, Finance Services and Insurance (BFSI)
13.6.4.4.7.Media and Entertainment
13.6.4.4.8.Retail
13.6.4.4.9.Healthcare
13.6.4.4.10.Industrial
13.6.4.4.11.Others
13.6.5.Italy
13.6.5.1.Italy Active Optical Cable and Extender Market Revenue (US$ Mn) and Forecasts, By Protocol
13.6.5.1.1.InfiniBand
13.6.5.1.2.Ethernet
13.6.5.1.3.HDMI
13.6.5.1.4.USB
13.6.5.1.5.Thunderbolt
13.6.5.1.6.Fiberchannel
13.6.5.1.7.Serial Attached SCSI (SAS)
13.6.5.1.8.Display Port
13.6.5.1.9.PCI Express (PCIe)
13.6.5.1.10.Others
13.6.5.2.Italy Active Optical Cable and Extender Market Revenue (US$ Mn) and Forecasts, By Form Factor
13.6.5.2.1.QSFP
13.6.5.2.2.SFP
13.6.5.2.3.QSFP DD
13.6.5.2.4.SFP DD
13.6.5.2.5.QSFP+
13.6.5.2.6.CFP
13.6.5.2.7.SPF+
13.6.5.2.8.Others
13.6.5.3.Italy Active Optical Cable and Extender Market Revenue (US$ Mn) and Forecasts, By Distribution channel
13.6.5.3.1.Online
13.6.5.3.2.Offline
13.6.5.4.Italy Active Optical Cable and Extender Market Revenue (US$ Mn) and Forecasts, By End User Industry
13.6.5.4.1.IT and Telecommunication
13.6.5.4.2.Aerospace
13.6.5.4.3.Defense
13.6.5.4.4.Automotive
13.6.5.4.5.Consumer Electronics
13.6.5.4.6.Banking, Finance Services and Insurance (BFSI)
13.6.5.4.7.Media and Entertainment
13.6.5.4.8.Retail
13.6.5.4.9.Healthcare
13.6.5.4.10.Industrial
13.6.5.4.11.Others
13.6.6.Nordic Countries
13.6.6.1.Nordic Countries Active Optical Cable and Extender Market Revenue (US$ Mn) and Forecasts, By Protocol
13.6.6.1.1.InfiniBand
13.6.6.1.2.Ethernet
13.6.6.1.3.HDMI
13.6.6.1.4.USB
13.6.6.1.5.Thunderbolt
13.6.6.1.6.Fiberchannel
13.6.6.1.7.Serial Attached SCSI (SAS)
13.6.6.1.8.Display Port
13.6.6.1.9.PCI Express (PCIe)
13.6.6.1.10.Others
13.6.6.2.Nordic Countries Active Optical Cable and Extender Market Revenue (US$ Mn) and Forecasts, By Form Factor
13.6.6.2.1.QSFP
13.6.6.2.2.SFP
13.6.6.2.3.QSFP DD
13.6.6.2.4.SFP DD
13.6.6.2.5.QSFP+
13.6.6.2.6.CFP
13.6.6.2.7.SPF+
13.6.6.2.8.Others
13.6.6.3.Nordic Countries Active Optical Cable and Extender Market Revenue (US$ Mn) and Forecasts, By Distribution channel
13.6.6.3.1.Online
13.6.6.3.2.Offline
13.6.6.4.Nordic Countries Active Optical Cable and Extender Market Revenue (US$ Mn) and Forecasts, By End User Industry
13.6.6.4.1.IT and Telecommunication
13.6.6.4.2.Aerospace
13.6.6.4.3.Defense
13.6.6.4.4.Automotive
13.6.6.4.5.Consumer Electronics
13.6.6.4.6.Banking, Finance Services and Insurance (BFSI)
13.6.6.4.7.Media and Entertainment
13.6.6.4.8.Retail
13.6.6.4.9.Healthcare
13.6.6.4.10.Industrial
13.6.6.4.11.Others
13.6.6.5.Nordic Countries Active Optical Cable and Extender Market Revenue (US$ Mn) and Forecasts, By Country
13.6.6.5.1.Denmark
13.6.6.5.2.Finland
13.6.6.5.3.Iceland
13.6.6.5.4.Sweden
13.6.6.5.5.Norway
13.6.7.Benelux Union
13.6.7.1.Benelux Union Active Optical Cable and Extender Market Revenue (US$ Mn) and Forecasts, By Protocol
13.6.7.1.1.InfiniBand
13.6.7.1.2.Ethernet
13.6.7.1.3.HDMI
13.6.7.1.4.USB
13.6.7.1.5.Thunderbolt
13.6.7.1.6.Fiberchannel
13.6.7.1.7.Serial Attached SCSI (SAS)
13.6.7.1.8.Display Port
13.6.7.1.9.PCI Express (PCIe)
13.6.7.1.10.Others
13.6.7.2.Benelux Union Active Optical Cable and Extender Market Revenue (US$ Mn) and Forecasts, By Form Factor
13.6.7.2.1.QSFP
13.6.7.2.2.SFP
13.6.7.2.3.QSFP DD
13.6.7.2.4.SFP DD
13.6.7.2.5.QSFP+
13.6.7.2.6.CFP
13.6.7.2.7.SPF+
13.6.7.2.8.Others
13.6.7.3.Benelux Union Active Optical Cable and Extender Market Revenue (US$ Mn) and Forecasts, By Distribution channel
13.6.7.3.1.Online
13.6.7.3.2.Offline
13.6.7.4.Benelux Union Active Optical Cable and Extender Market Revenue (US$ Mn) and Forecasts, By End User Industry
13.6.7.4.1.IT and Telecommunication
13.6.7.4.2.Aerospace
13.6.7.4.3.Defense
13.6.7.4.4.Automotive
13.6.7.4.5.Consumer Electronics
13.6.7.4.6.Banking, Finance Services and Insurance (BFSI)
13.6.7.4.7.Media and Entertainment
13.6.7.4.8.Retail
13.6.7.4.9.Healthcare
13.6.7.4.10.Industrial
13.6.7.4.11.Others
13.6.7.5.Benelux Union Active Optical Cable and Extender Market Revenue (US$ Mn) and Forecasts, By Country
13.6.7.5.1.Belgium
13.6.7.5.2.The Netherlands
13.6.7.5.3.Luxembourg
13.6.8.Rest of Europe
13.6.8.1.Rest of Europe Active Optical Cable and Extender Market Revenue (US$ Mn) and Forecasts, By Protocol
13.6.8.1.1.InfiniBand
13.6.8.1.2.Ethernet
13.6.8.1.3.HDMI
13.6.8.1.4.USB
13.6.8.1.5.Thunderbolt
13.6.8.1.6.Fiberchannel
13.6.8.1.7.Serial Attached SCSI (SAS)
13.6.8.1.8.Display Port
13.6.8.1.9.PCI Express (PCIe)
13.6.8.1.10.Others
13.6.8.2.Rest of Europe Active Optical Cable and Extender Market Revenue (US$ Mn) and Forecasts, By Form Factor
13.6.8.2.1.QSFP
13.6.8.2.2.SFP
13.6.8.2.3.QSFP DD
13.6.8.2.4.SFP DD
13.6.8.2.5.QSFP+
13.6.8.2.6.CFP
13.6.8.2.7.SPF+
13.6.8.2.8.Others
13.6.8.3.Rest of Europe Active Optical Cable and Extender Market Revenue (US$ Mn) and Forecasts, By Distribution channel
13.6.8.3.1.Online
13.6.8.3.2.Offline
13.6.8.4.Rest of Europe Active Optical Cable and Extender Market Revenue (US$ Mn) and Forecasts, By End User Industry
13.6.8.4.1.IT and Telecommunication
13.6.8.4.2.Aerospace
13.6.8.4.3.Defense
13.6.8.4.4.Automotive
13.6.8.4.5.Consumer Electronics
13.6.8.4.6.Banking, Finance Services and Insurance (BFSI)
13.6.8.4.7.Media and Entertainment
13.6.8.4.8.Retail
13.6.8.4.9.Healthcare
13.6.8.4.10.Industrial
13.6.8.4.11.Others
13.7.Key Segment for Channeling Investments
13.7.1.By Country
13.7.2.By Protocol
13.7.3.By Form Factor
13.7.4.By Distribution channel
13.7.5.By End User Industry
14.Asia Pacific Active Optical Cable and Extender Market Analysis and Forecasts, 2023 – 2031
14.1.Overview
14.1.1.Asia Pacific Active Optical Cable and Extender Market Revenue (US$ Mn)
14.2.Asia Pacific Active Optical Cable and Extender Market Revenue (US$ Mn) and Forecasts, By Protocol
14.2.1.InfiniBand
14.2.2.Ethernet
14.2.3.HDMI
14.2.4.USB
14.2.5.Thunderbolt
14.2.6.Fiberchannel
14.2.7.Serial Attached SCSI (SAS)
14.2.8.Display Port
14.2.9.PCI Express (PCIe)
14.2.10.Others
14.3.Asia Pacific Active Optical Cable and Extender Market Revenue (US$ Mn) and Forecasts, By Form Factor
14.3.1.QSFP
14.3.2.SFP
14.3.3.QSFP DD
14.3.4.SFP DD
14.3.5.QSFP+
14.3.6.CFP
14.3.7.SPF+
14.3.8.Others
14.4.Asia Pacific Active Optical Cable and Extender Market Revenue (US$ Mn) and Forecasts, By Distribution channel
14.4.1.Online
14.4.2.Offline
14.5.Asia Pacific Active Optical Cable and Extender Market Revenue (US$ Mn) and Forecasts, By End User Industry
14.5.1.IT and Telecommunication
14.5.2.Aerospace
14.5.3.Defense
14.5.4.Automotive
14.5.5.Consumer Electronics
14.5.6.Banking, Finance Services and Insurance (BFSI)
14.5.7.Media and Entertainment
14.5.8.Retail
14.5.9.Healthcare
14.5.10.Industrial
14.5.11.Others
14.6.Asia Pacific Active Optical Cable and Extender Market Revenue (US$ Mn) and Forecasts, By Country
14.6.1.China
14.6.1.1.China Active Optical Cable and Extender Market Revenue (US$ Mn) and Forecasts, By Protocol
14.6.1.1.1.InfiniBand
14.6.1.1.2.Ethernet
14.6.1.1.3.HDMI
14.6.1.1.4.USB
14.6.1.1.5.Thunderbolt
14.6.1.1.6.Fiberchannel
14.6.1.1.7.Serial Attached SCSI (SAS)
14.6.1.1.8.Display Port
14.6.1.1.9.PCI Express (PCIe)
14.6.1.1.10.Others
14.6.1.2.China Active Optical Cable and Extender Market Revenue (US$ Mn) and Forecasts, By Form Factor
14.6.1.2.1.QSFP
14.6.1.2.2.SFP
14.6.1.2.3.QSFP DD
14.6.1.2.4.SFP DD
14.6.1.2.5.QSFP+
14.6.1.2.6.CFP
14.6.1.2.7.SPF+
14.6.1.2.8.Others
14.6.1.3.China Active Optical Cable and Extender Market Revenue (US$ Mn) and Forecasts, By Distribution channel
14.6.1.3.1.Online
14.6.1.3.2.Offline
14.6.1.4.China Active Optical Cable and Extender Market Revenue (US$ Mn) and Forecasts, By End User Industry
14.6.1.4.1.IT and Telecommunication
14.6.1.4.2.Aerospace
14.6.1.4.3.Defense
14.6.1.4.4.Automotive
14.6.1.4.5.Consumer Electronics
14.6.1.4.6.Banking, Finance Services and Insurance (BFSI)
14.6.1.4.7.Media and Entertainment
14.6.1.4.8.Retail
14.6.1.4.9.Healthcare
14.6.1.4.10.Industrial
14.6.1.4.11.Others
14.6.2.Japan
14.6.2.1.Japan Active Optical Cable and Extender Market Revenue (US$ Mn) and Forecasts, By Protocol
14.6.2.1.1.InfiniBand
14.6.2.1.2.Ethernet
14.6.2.1.3.HDMI
14.6.2.1.4.USB
14.6.2.1.5.Thunderbolt
14.6.2.1.6.Fiberchannel
14.6.2.1.7.Serial Attached SCSI (SAS)
14.6.2.1.8.Display Port
14.6.2.1.9.PCI Express (PCIe)
14.6.2.1.10.Others
14.6.2.2.Japan Active Optical Cable and Extender Market Revenue (US$ Mn) and Forecasts, By Form Factor
14.6.2.2.1.QSFP
14.6.2.2.2.SFP
14.6.2.2.3.QSFP DD
14.6.2.2.4.SFP DD
14.6.2.2.5.QSFP+
14.6.2.2.6.CFP
14.6.2.2.7.SPF+
14.6.2.2.8.Others
14.6.2.3.Japan Active Optical Cable and Extender Market Revenue (US$ Mn) and Forecasts, By Distribution channel
14.6.2.3.1.Online
14.6.2.3.2.Offline
14.6.2.4.Japan Active Optical Cable and Extender Market Revenue (US$ Mn) and Forecasts, By End User Industry
14.6.2.4.1.IT and Telecommunication
14.6.2.4.2.Aerospace
14.6.2.4.3.Defense
14.6.2.4.4.Automotive
14.6.2.4.5.Consumer Electronics
14.6.2.4.6.Banking, Finance Services and Insurance (BFSI)
14.6.2.4.7.Media and Entertainment
14.6.2.4.8.Retail
14.6.2.4.9.Healthcare
14.6.2.4.10.Industrial
14.6.2.4.11.Others
14.6.3.India
14.6.3.1.India Active Optical Cable and Extender Market Revenue (US$ Mn) and Forecasts, By Protocol
14.6.3.1.1.InfiniBand
14.6.3.1.2.Ethernet
14.6.3.1.3.HDMI
14.6.3.1.4.USB
14.6.3.1.5.Thunderbolt
14.6.3.1.6.Fiberchannel
14.6.3.1.7.Serial Attached SCSI (SAS)
14.6.3.1.8.Display Port
14.6.3.1.9.PCI Express (PCIe)
14.6.3.1.10.Others
14.6.3.2.India Active Optical Cable and Extender Market Revenue (US$ Mn) and Forecasts, By Form Factor
14.6.3.2.1.QSFP
14.6.3.2.2.SFP
14.6.3.2.3.QSFP DD
14.6.3.2.4.SFP DD
14.6.3.2.5.QSFP+
14.6.3.2.6.CFP
14.6.3.2.7.SPF+
14.6.3.2.8.Others
14.6.3.3.India Active Optical Cable and Extender Market Revenue (US$ Mn) and Forecasts, By Distribution channel
14.6.3.3.1.Online
14.6.3.3.2.Offline
14.6.3.4.India Active Optical Cable and Extender Market Revenue (US$ Mn) and Forecasts, By End User Industry
14.6.3.4.1.IT and Telecommunication
14.6.3.4.2.Aerospace
14.6.3.4.3.Defense
14.6.3.4.4.Automotive
14.6.3.4.5.Consumer Electronics
14.6.3.4.6.Banking, Finance Services and Insurance (BFSI)
14.6.3.4.7.Media and Entertainment
14.6.3.4.8.Retail
14.6.3.4.9.Healthcare
14.6.3.4.10.Industrial
14.6.3.4.11.Others
14.6.4.New Zealand
14.6.4.1.New Zealand Active Optical Cable and Extender Market Revenue (US$ Mn) and Forecasts, By Protocol
14.6.4.1.1.InfiniBand
14.6.4.1.2.Ethernet
14.6.4.1.3.HDMI
14.6.4.1.4.USB
14.6.4.1.5.Thunderbolt
14.6.4.1.6.Fiberchannel
14.6.4.1.7.Serial Attached SCSI (SAS)
14.6.4.1.8.Display Port
14.6.4.1.9.PCI Express (PCIe)
14.6.4.1.10.Others
14.6.4.2.New Zealand Active Optical Cable and Extender Market Revenue (US$ Mn) and Forecasts, By Form Factor
14.6.4.2.1.QSFP
14.6.4.2.2.SFP
14.6.4.2.3.QSFP DD
14.6.4.2.4.SFP DD
14.6.4.2.5.QSFP+
14.6.4.2.6.CFP
14.6.4.2.7.SPF+
14.6.4.2.8.Others
14.6.4.3.New Zealand Active Optical Cable and Extender Market Revenue (US$ Mn) and Forecasts, By Distribution channel
14.6.4.3.1.Online
14.6.4.3.2.Offline
14.6.4.4.New Zealand Active Optical Cable and Extender Market Revenue (US$ Mn) and Forecasts, By End User Industry
14.6.4.4.1.IT and Telecommunication
14.6.4.4.2.Aerospace
14.6.4.4.3.Defense
14.6.4.4.4.Automotive
14.6.4.4.5.Consumer Electronics
14.6.4.4.6.Banking, Finance Services and Insurance (BFSI)
14.6.4.4.7.Media and Entertainment
14.6.4.4.8.Retail
14.6.4.4.9.Healthcare
14.6.4.4.10.Industrial
14.6.4.4.11.Others
14.6.5.Australia
14.6.5.1.Australia Active Optical Cable and Extender Market Revenue (US$ Mn) and Forecasts, By Protocol
14.6.5.1.1.InfiniBand
14.6.5.1.2.Ethernet
14.6.5.1.3.HDMI
14.6.5.1.4.USB
14.6.5.1.5.Thunderbolt
14.6.5.1.6.Fiberchannel
14.6.5.1.7.Serial Attached SCSI (SAS)
14.6.5.1.8.Display Port
14.6.5.1.9.PCI Express (PCIe)
14.6.5.1.10.Others
14.6.5.2.Australia Active Optical Cable and Extender Market Revenue (US$ Mn) and Forecasts, By Form Factor
14.6.5.2.1.QSFP
14.6.5.2.2.SFP
14.6.5.2.3.QSFP DD
14.6.5.2.4.SFP DD
14.6.5.2.5.QSFP+
14.6.5.2.6.CFP
14.6.5.2.7.SPF+
14.6.5.2.8.Others
14.6.5.3.Australia Active Optical Cable and Extender Market Revenue (US$ Mn) and Forecasts, By Distribution channel
14.6.5.3.1.Online
14.6.5.3.2.Offline
14.6.5.4.Australia Active Optical Cable and Extender Market Revenue (US$ Mn) and Forecasts, By End User Industry
14.6.5.4.1.IT and Telecommunication
14.6.5.4.2.Aerospace
14.6.5.4.3.Defense
14.6.5.4.4.Automotive
14.6.5.4.5.Consumer Electronics
14.6.5.4.6.Banking, Finance Services and Insurance (BFSI)
14.6.5.4.7.Media and Entertainment
14.6.5.4.8.Retail
14.6.5.4.9.Healthcare
14.6.5.4.10.Industrial
14.6.5.4.11.Others
14.6.6.South Korea
14.6.6.1.South Korea Active Optical Cable and Extender Market Revenue (US$ Mn) and Forecasts, By Protocol
14.6.6.1.1.InfiniBand
14.6.6.1.2.Ethernet
14.6.6.1.3.HDMI
14.6.6.1.4.USB
14.6.6.1.5.Thunderbolt
14.6.6.1.6.Fiberchannel
14.6.6.1.7.Serial Attached SCSI (SAS)
14.6.6.1.8.Display Port
14.6.6.1.9.PCI Express (PCIe)
14.6.6.1.10.Others
14.6.6.2.South Korea Active Optical Cable and Extender Market Revenue (US$ Mn) and Forecasts, By Form Factor
14.6.6.2.1.QSFP
14.6.6.2.2.SFP
14.6.6.2.3.QSFP DD
14.6.6.2.4.SFP DD
14.6.6.2.5.QSFP+
14.6.6.2.6.CFP
14.6.6.2.7.SPF+
14.6.6.2.8.Others
14.6.6.3.South Korea Active Optical Cable and Extender Market Revenue (US$ Mn) and Forecasts, By Distribution channel
14.6.6.3.1.Online
14.6.6.3.2.Offline
14.6.6.4.South Korea Active Optical Cable and Extender Market Revenue (US$ Mn) and Forecasts, By End User Industry
14.6.6.4.1.IT and Telecommunication
14.6.6.4.2.Aerospace
14.6.6.4.3.Defense
14.6.6.4.4.Automotive
14.6.6.4.5.Consumer Electronics
14.6.6.4.6.Banking, Finance Services and Insurance (BFSI)
14.6.6.4.7.Media and Entertainment
14.6.6.4.8.Retail
14.6.6.4.9.Healthcare
14.6.6.4.10.Industrial
14.6.6.4.11.Others
14.6.7.Southeast Asia
14.6.7.1.Southeast Asia Active Optical Cable and Extender Market Revenue (US$ Mn) and Forecasts, By Protocol
14.6.7.1.1.InfiniBand
14.6.7.1.2.Ethernet
14.6.7.1.3.HDMI
14.6.7.1.4.USB
14.6.7.1.5.Thunderbolt
14.6.7.1.6.Fiberchannel
14.6.7.1.7.Serial Attached SCSI (SAS)
14.6.7.1.8.Display Port
14.6.7.1.9.PCI Express (PCIe)
14.6.7.1.10.Others
14.6.7.2.Southeast Asia Active Optical Cable and Extender Market Revenue (US$ Mn) and Forecasts, By Form Factor
14.6.7.2.1.QSFP
14.6.7.2.2.SFP
14.6.7.2.3.QSFP DD
14.6.7.2.4.SFP DD
14.6.7.2.5.QSFP+
14.6.7.2.6.CFP
14.6.7.2.7.SPF+
14.6.7.2.8.Others
14.6.7.3.Southeast Asia Active Optical Cable and Extender Market Revenue (US$ Mn) and Forecasts, By Distribution channel
14.6.7.3.1.Online
14.6.7.3.2.Offline
14.6.7.4.Southeast Asia Active Optical Cable and Extender Market Revenue (US$ Mn) and Forecasts, By End User Industry
14.6.7.4.1.IT and Telecommunication
14.6.7.4.2.Aerospace
14.6.7.4.3.Defense
14.6.7.4.4.Automotive
14.6.7.4.5.Consumer Electronics
14.6.7.4.6.Banking, Finance Services and Insurance (BFSI)
14.6.7.4.7.Media and Entertainment
14.6.7.4.8.Retail
14.6.7.4.9.Healthcare
14.6.7.4.10.Industrial
14.6.7.4.11.Others
14.6.7.5.Southeast Asia Active Optical Cable and Extender Market Revenue (US$ Mn) and Forecasts, By Country
14.6.7.5.1.Indonesia
14.6.7.5.2.Thailand
14.6.7.5.3.Malaysia
14.6.7.5.4.Singapore
14.6.7.5.5.Rest of Southeast Asia
14.6.8.Rest of Asia Pacific
14.6.8.1.Rest of Asia Pacific Active Optical Cable and Extender Market Revenue (US$ Mn) and Forecasts, By Protocol
14.6.8.1.1.InfiniBand
14.6.8.1.2.Ethernet
14.6.8.1.3.HDMI
14.6.8.1.4.USB
14.6.8.1.5.Thunderbolt
14.6.8.1.6.Fiberchannel
14.6.8.1.7.Serial Attached SCSI (SAS)
14.6.8.1.8.Display Port
14.6.8.1.9.PCI Express (PCIe)
14.6.8.1.10.Others
14.6.8.2.Rest of Asia Pacific Active Optical Cable and Extender Market Revenue (US$ Mn) and Forecasts, By Form Factor
14.6.8.2.1.QSFP
14.6.8.2.2.SFP
14.6.8.2.3.QSFP DD
14.6.8.2.4.SFP DD
14.6.8.2.5.QSFP+
14.6.8.2.6.CFP
14.6.8.2.7.SPF+
14.6.8.2.8.Others
14.6.8.3.Rest of Asia Pacific Active Optical Cable and Extender Market Revenue (US$ Mn) and Forecasts, By Distribution channel
14.6.8.3.1.Online
14.6.8.3.2.Offline
14.6.8.4.Rest of Asia Pacific Active Optical Cable and Extender Market Revenue (US$ Mn) and Forecasts, By End User Industry
14.6.8.4.1.IT and Telecommunication
14.6.8.4.2.Aerospace
14.6.8.4.3.Defense
14.6.8.4.4.Automotive
14.6.8.4.5.Consumer Electronics
14.6.8.4.6.Banking, Finance Services and Insurance (BFSI)
14.6.8.4.7.Media and Entertainment
14.6.8.4.8.Retail
14.6.8.4.9.Healthcare
14.6.8.4.10.Industrial
14.6.8.4.11.Others
14.7.Key Segment for Channeling Investments
14.7.1.By Country
14.7.2.By Protocol
14.7.3.By Form Factor
14.7.4.By Distribution channel
14.7.5.By End User Industry
15.Middle East and Africa Active Optical Cable and Extender Market Analysis and Forecasts, 2023 – 2031
15.1.Overview
15.1.1.Middle East and Africa Active Optical Cable and Extender Market Revenue (US$ Mn)
15.2.Middle East and Africa Active Optical Cable and Extender Market Revenue (US$ Mn) and Forecasts, By Protocol
15.2.1.InfiniBand
15.2.2.Ethernet
15.2.3.HDMI
15.2.4.USB
15.2.5.Thunderbolt
15.2.6.Fiberchannel
15.2.7.Serial Attached SCSI (SAS)
15.2.8.Display Port
15.2.9.PCI Express (PCIe)
15.2.10.Others
15.3.Middle East and Africa Active Optical Cable and Extender Market Revenue (US$ Mn) and Forecasts, By Form Factor
15.3.1.QSFP
15.3.2.SFP
15.3.3.QSFP DD
15.3.4.SFP DD
15.3.5.QSFP+
15.3.6.CFP
15.3.7.SPF+
15.3.8.Others
15.4.Middle East and Africa Active Optical Cable and Extender Market Revenue (US$ Mn) and Forecasts, By Distribution channel
15.4.1.Online
15.4.2.Offline
15.5.Middle East and Africa Active Optical Cable and Extender Market Revenue (US$ Mn) and Forecasts, By End User Industry
15.5.1.IT and Telecommunication
15.5.2.Aerospace
15.5.3.Defense
15.5.4.Automotive
15.5.5.Consumer Electronics
15.5.6.Banking, Finance Services and Insurance (BFSI)
15.5.7.Media and Entertainment
15.5.8.Retail
15.5.9.Healthcare
15.5.10.Industrial
15.5.11.Others
15.6.Middle East and Africa Active Optical Cable and Extender Market Revenue (US$ Mn) and Forecasts, By Country
15.6.1.Saudi Arabia
15.6.1.1.Saudi Arabia Active Optical Cable and Extender Market Revenue (US$ Mn) and Forecasts, By Protocol
15.6.1.1.1.InfiniBand
15.6.1.1.2.Ethernet
15.6.1.1.3.HDMI
15.6.1.1.4.USB
15.6.1.1.5.Thunderbolt
15.6.1.1.6.Fiberchannel
15.6.1.1.7.Serial Attached SCSI (SAS)
15.6.1.1.8.Display Port
15.6.1.1.9.PCI Express (PCIe)
15.6.1.1.10.Others
15.6.1.2.Saudi Arabia Active Optical Cable and Extender Market Revenue (US$ Mn) and Forecasts, By Form Factor
15.6.1.2.1.QSFP
15.6.1.2.2.SFP
15.6.1.2.3.QSFP DD
15.6.1.2.4.SFP DD
15.6.1.2.5.QSFP+
15.6.1.2.6.CFP
15.6.1.2.7.SPF+
15.6.1.2.8.Others
15.6.1.3.Saudi Arabia Active Optical Cable and Extender Market Revenue (US$ Mn) and Forecasts, By Distribution channel
15.6.1.3.1.Online
15.6.1.3.2.Offline
15.6.1.4.Saudi Arabia Active Optical Cable and Extender Market Revenue (US$ Mn) and Forecasts, By End User Industry
15.6.1.4.1.IT and Telecommunication
15.6.1.4.2.Aerospace
15.6.1.4.3.Defense
15.6.1.4.4.Automotive
15.6.1.4.5.Consumer Electronics
15.6.1.4.6.Banking, Finance Services and Insurance (BFSI)
15.6.1.4.7.Media and Entertainment
15.6.1.4.8.Retail
15.6.1.4.9.Healthcare
15.6.1.4.10.Industrial
15.6.1.4.11.Others
15.6.2.UAE
15.6.2.1.UAE Active Optical Cable and Extender Market Revenue (US$ Mn) and Forecasts, By Protocol
15.6.2.1.1.InfiniBand
15.6.2.1.2.Ethernet
15.6.2.1.3.HDMI
15.6.2.1.4.USB
15.6.2.1.5.Thunderbolt
15.6.2.1.6.Fiberchannel
15.6.2.1.7.Serial Attached SCSI (SAS)
15.6.2.1.8.Display Port
15.6.2.1.9.PCI Express (PCIe)
15.6.2.1.10.Others
15.6.2.2.UAE Active Optical Cable and Extender Market Revenue (US$ Mn) and Forecasts, By Form Factor
15.6.2.2.1.QSFP
15.6.2.2.2.SFP
15.6.2.2.3.QSFP DD
15.6.2.2.4.SFP DD
15.6.2.2.5.QSFP+
15.6.2.2.6.CFP
15.6.2.2.7.SPF+
15.6.2.2.8.Others
15.6.2.3.UAE Active Optical Cable and Extender Market Revenue (US$ Mn) and Forecasts, By Distribution channel
15.6.2.3.1.Online
15.6.2.3.2.Offline
15.6.2.4.UAE Active Optical Cable and Extender Market Revenue (US$ Mn) and Forecasts, By End User Industry
15.6.2.4.1.IT and Telecommunication
15.6.2.4.2.Aerospace
15.6.2.4.3.Defense
15.6.2.4.4.Automotive
15.6.2.4.5.Consumer Electronics
15.6.2.4.6.Banking, Finance Services and Insurance (BFSI)
15.6.2.4.7.Media and Entertainment
15.6.2.4.8.Retail
15.6.2.4.9.Healthcare
15.6.2.4.10.Industrial
15.6.2.4.11.Others
15.6.3.Egypt
15.6.3.1.Egypt Active Optical Cable and Extender Market Revenue (US$ Mn) and Forecasts, By Protocol
15.6.3.1.1.InfiniBand
15.6.3.1.2.Ethernet
15.6.3.1.3.HDMI
15.6.3.1.4.USB
15.6.3.1.5.Thunderbolt
15.6.3.1.6.Fiberchannel
15.6.3.1.7.Serial Attached SCSI (SAS)
15.6.3.1.8.Display Port
15.6.3.1.9.PCI Express (PCIe)
15.6.3.1.10.Others
15.6.3.2.Egypt Active Optical Cable and Extender Market Revenue (US$ Mn) and Forecasts, By Form Factor
15.6.3.2.1.QSFP
15.6.3.2.2.SFP
15.6.3.2.3.QSFP DD
15.6.3.2.4.SFP DD
15.6.3.2.5.QSFP+
15.6.3.2.6.CFP
15.6.3.2.7.SPF+
15.6.3.2.8.Others
15.6.3.3.Egypt Active Optical Cable and Extender Market Revenue (US$ Mn) and Forecasts, By Distribution channel
15.6.3.3.1.Online
15.6.3.3.2.Offline
15.6.3.4.Egypt Active Optical Cable and Extender Market Revenue (US$ Mn) and Forecasts, By End User Industry
15.6.3.4.1.IT and Telecommunication
15.6.3.4.2.Aerospace
15.6.3.4.3.Defense
15.6.3.4.4.Automotive
15.6.3.4.5.Consumer Electronics
15.6.3.4.6.Banking, Finance Services and Insurance (BFSI)
15.6.3.4.7.Media and Entertainment
15.6.3.4.8.Retail
15.6.3.4.9.Healthcare
15.6.3.4.10.Industrial
15.6.3.4.11.Others
15.6.4.Kuwait
15.6.4.1.Kuwait Active Optical Cable and Extender Market Revenue (US$ Mn) and Forecasts, By Protocol
15.6.4.1.1.InfiniBand
15.6.4.1.2.Ethernet
15.6.4.1.3.HDMI
15.6.4.1.4.USB
15.6.4.1.5.Thunderbolt
15.6.4.1.6.Fiberchannel
15.6.4.1.7.Serial Attached SCSI (SAS)
15.6.4.1.8.Display Port
15.6.4.1.9.PCI Express (PCIe)
15.6.4.1.10.Others
15.6.4.2.Kuwait Active Optical Cable and Extender Market Revenue (US$ Mn) and Forecasts, By Form Factor
15.6.4.2.1.QSFP
15.6.4.2.2.SFP
15.6.4.2.3.QSFP DD
15.6.4.2.4.SFP DD
15.6.4.2.5.QSFP+
15.6.4.2.6.CFP
15.6.4.2.7.SPF+
15.6.4.2.8.Others
15.6.4.3.Kuwait Active Optical Cable and Extender Market Revenue (US$ Mn) and Forecasts, By Distribution channel
15.6.4.3.1.Online
15.6.4.3.2.Offline
15.6.4.4.Kuwait Active Optical Cable and Extender Market Revenue (US$ Mn) and Forecasts, By End User Industry
15.6.4.4.1.IT and Telecommunication
15.6.4.4.2.Aerospace
15.6.4.4.3.Defense
15.6.4.4.4.Automotive
15.6.4.4.5.Consumer Electronics
15.6.4.4.6.Banking, Finance Services and Insurance (BFSI)
15.6.4.4.7.Media and Entertainment
15.6.4.4.8.Retail
15.6.4.4.9.Healthcare
15.6.4.4.10.Industrial
15.6.4.4.11.Others
15.6.5.South Africa
15.6.5.1.South Africa Active Optical Cable and Extender Market Revenue (US$ Mn) and Forecasts, By Protocol
15.6.5.1.1.InfiniBand
15.6.5.1.2.Ethernet
15.6.5.1.3.HDMI
15.6.5.1.4.USB
15.6.5.1.5.Thunderbolt
15.6.5.1.6.Fiberchannel
15.6.5.1.7.Serial Attached SCSI (SAS)
15.6.5.1.8.Display Port
15.6.5.1.9.PCI Express (PCIe)
15.6.5.1.10.Others
15.6.5.2.South Africa Active Optical Cable and Extender Market Revenue (US$ Mn) and Forecasts, By Form Factor
15.6.5.2.1.QSFP
15.6.5.2.2.SFP
15.6.5.2.3.QSFP DD
15.6.5.2.4.SFP DD
15.6.5.2.5.QSFP+
15.6.5.2.6.CFP
15.6.5.2.7.SPF+
15.6.5.2.8.Others
15.6.5.3.South Africa Active Optical Cable and Extender Market Revenue (US$ Mn) and Forecasts, By Distribution channel
15.6.5.3.1.Online
15.6.5.3.2.Offline
15.6.5.4.South Africa Active Optical Cable and Extender Market Revenue (US$ Mn) and Forecasts, By End User Industry
15.6.5.4.1.IT and Telecommunication
15.6.5.4.2.Aerospace
15.6.5.4.3.Defense
15.6.5.4.4.Automotive
15.6.5.4.5.Consumer Electronics
15.6.5.4.6.Banking, Finance Services and Insurance (BFSI)
15.6.5.4.7.Media and Entertainment
15.6.5.4.8.Retail
15.6.5.4.9.Healthcare
15.6.5.4.10.Industrial
15.6.5.4.11.Others
15.6.6.Rest of Middle East & Africa
15.6.6.1.Rest of Middle East & Africa Active Optical Cable and Extender Market Revenue (US$ Mn) and Forecasts, By Protocol
15.6.6.1.1.InfiniBand
15.6.6.1.2.Ethernet
15.6.6.1.3.HDMI
15.6.6.1.4.USB
15.6.6.1.5.Thunderbolt
15.6.6.1.6.Fiberchannel
15.6.6.1.7.Serial Attached SCSI (SAS)
15.6.6.1.8.Display Port
15.6.6.1.9.PCI Express (PCIe)
15.6.6.1.10.Others
15.6.6.2.Rest of Middle East & Africa Active Optical Cable and Extender Market Revenue (US$ Mn) and Forecasts, By Form Factor
15.6.6.2.1.QSFP
15.6.6.2.2.SFP
15.6.6.2.3.QSFP DD
15.6.6.2.4.SFP DD
15.6.6.2.5.QSFP+
15.6.6.2.6.CFP
15.6.6.2.7.SPF+
15.6.6.2.8.Others
15.6.6.3.Rest of Middle East & Africa Active Optical Cable and Extender Market Revenue (US$ Mn) and Forecasts, By Distribution channel
15.6.6.3.1.Online
15.6.6.3.2.Offline
15.6.6.4.Rest of Middle East & Africa Active Optical Cable and Extender Market Revenue (US$ Mn) and Forecasts, By End User Industry
15.6.6.4.1.IT and Telecommunication
15.6.6.4.2.Aerospace
15.6.6.4.3.Defense
15.6.6.4.4.Automotive
15.6.6.4.5.Consumer Electronics
15.6.6.4.6.Banking, Finance Services and Insurance (BFSI)
15.6.6.4.7.Media and Entertainment
15.6.6.4.8.Retail
15.6.6.4.9.Healthcare
15.6.6.4.10.Industrial
15.6.6.4.11.Others
15.7.Key Segment for Channeling Investments
15.7.1.By Country
15.7.2.By Protocol
15.7.3.By Form Factor
15.7.4.By Distribution channel
15.7.5.By End User Industry
16.Latin America Active Optical Cable and Extender Market Analysis and Forecasts, 2023 – 2031
16.1.Overview
16.1.1.Latin America Active Optical Cable and Extender Market Revenue (US$ Mn)
16.2.Latin America Active Optical Cable and Extender Market Revenue (US$ Mn) and Forecasts, By Protocol
16.2.1.InfiniBand
16.2.2.Ethernet
16.2.3.HDMI
16.2.4.USB
16.2.5.Thunderbolt
16.2.6.Fiberchannel
16.2.7.Serial Attached SCSI (SAS)
16.2.8.Display Port
16.2.9.PCI Express (PCIe)
16.2.10.Others
16.3.Latin America Active Optical Cable and Extender Market Revenue (US$ Mn) and Forecasts, By Form Factor
16.3.1.QSFP
16.3.2.SFP
16.3.3.QSFP DD
16.3.4.SFP DD
16.3.5.QSFP+
16.3.6.CFP
16.3.7.SPF+
16.3.8.Others
16.4.Latin America Active Optical Cable and Extender Market Revenue (US$ Mn) and Forecasts, By Distribution channel
16.4.1.Online
16.4.2.Offline
16.5.Latin America Active Optical Cable and Extender Market Revenue (US$ Mn) and Forecasts, By End User Industry
16.5.1.IT and Telecommunication
16.5.2.Aerospace
16.5.3.Defense
16.5.4.Automotive
16.5.5.Consumer Electronics
16.5.6.Banking, Finance Services and Insurance (BFSI)
16.5.7.Media and Entertainment
16.5.8.Retail
16.5.9.Healthcare
16.5.10.Industrial
16.5.11.Others
16.6.Latin America Active Optical Cable and Extender Market Revenue (US$ Mn) and Forecasts, By Country
16.6.1.Brazil
16.6.1.1.Brazil Active Optical Cable and Extender Market Revenue (US$ Mn) and Forecasts, By Protocol
16.6.1.1.1.InfiniBand
16.6.1.1.2.Ethernet
16.6.1.1.3.HDMI
16.6.1.1.4.USB
16.6.1.1.5.Thunderbolt
16.6.1.1.6.Fiberchannel
16.6.1.1.7.Serial Attached SCSI (SAS)
16.6.1.1.8.Display Port
16.6.1.1.9.PCI Express (PCIe)
16.6.1.1.10.Others
16.6.1.2.Brazil Active Optical Cable and Extender Market Revenue (US$ Mn) and Forecasts, By Form Factor
16.6.1.2.1.QSFP
16.6.1.2.2.SFP
16.6.1.2.3.QSFP DD
16.6.1.2.4.SFP DD
16.6.1.2.5.QSFP+
16.6.1.2.6.CFP
16.6.1.2.7.SPF+
16.6.1.2.8.Others
16.6.1.3.Brazil Active Optical Cable and Extender Market Revenue (US$ Mn) and Forecasts, By Distribution channel
16.6.1.3.1.Online
16.6.1.3.2.Offline
16.6.1.4.Brazil Active Optical Cable and Extender Market Revenue (US$ Mn) and Forecasts, By End User Industry
16.6.1.4.1.IT and Telecommunication
16.6.1.4.2.Aerospace
16.6.1.4.3.Defense
16.6.1.4.4.Automotive
16.6.1.4.5.Consumer Electronics
16.6.1.4.6.Banking, Finance Services and Insurance (BFSI)
16.6.1.4.7.Media and Entertainment
16.6.1.4.8.Retail
16.6.1.4.9.Healthcare
16.6.1.4.10.Industrial
16.6.1.4.11.Others
16.6.2.Argentina
16.6.2.1.Argentina Active Optical Cable and Extender Market Revenue (US$ Mn) and Forecasts, By Protocol
16.6.2.1.1.InfiniBand
16.6.2.1.2.Ethernet
16.6.2.1.3.HDMI
16.6.2.1.4.USB
16.6.2.1.5.Thunderbolt
16.6.2.1.6.Fiberchannel
16.6.2.1.7.Serial Attached SCSI (SAS)
16.6.2.1.8.Display Port
16.6.2.1.9.PCI Express (PCIe)
16.6.2.1.10.Others
16.6.2.2.Argentina Active Optical Cable and Extender Market Revenue (US$ Mn) and Forecasts, By Form Factor
16.6.2.2.1.QSFP
16.6.2.2.2.SFP
16.6.2.2.3.QSFP DD
16.6.2.2.4.SFP DD
16.6.2.2.5.QSFP+
16.6.2.2.6.CFP
16.6.2.2.7.SPF+
16.6.2.2.8.Others
16.6.2.3.Argentina Active Optical Cable and Extender Market Revenue (US$ Mn) and Forecasts, By Distribution channel
16.6.2.3.1.Online
16.6.2.3.2.Offline
16.6.2.4.Argentina Active Optical Cable and Extender Market Revenue (US$ Mn) and Forecasts, By End User Industry
16.6.2.4.1.IT and Telecommunication
16.6.2.4.2.Aerospace
16.6.2.4.3.Defense
16.6.2.4.4.Automotive
16.6.2.4.5.Consumer Electronics
16.6.2.4.6.Banking, Finance Services and Insurance (BFSI)
16.6.2.4.7.Media and Entertainment
16.6.2.4.8.Retail
16.6.2.4.9.Healthcare
16.6.2.4.10.Industrial
16.6.2.4.11.Others
16.6.3.Rest of Latin America
16.6.3.1.Rest of Latin America Active Optical Cable and Extender Market Revenue (US$ Mn) and Forecasts, By Protocol
16.6.3.1.1.InfiniBand
16.6.3.1.2.Ethernet
16.6.3.1.3.HDMI
16.6.3.1.4.USB
16.6.3.1.5.Thunderbolt
16.6.3.1.6.Fiberchannel
16.6.3.1.7.Serial Attached SCSI (SAS)
16.6.3.1.8.Display Port
16.6.3.1.9.PCI Express (PCIe)
16.6.3.1.10.Others
16.6.3.2.Rest of Latin America Active Optical Cable and Extender Market Revenue (US$ Mn) and Forecasts, By Form Factor
16.6.3.2.1.QSFP
16.6.3.2.2.SFP
16.6.3.2.3.QSFP DD
16.6.3.2.4.SFP DD
16.6.3.2.5.QSFP+
16.6.3.2.6.CFP
16.6.3.2.7.SPF+
16.6.3.2.8.Others
16.6.3.3.Rest of Latin America Active Optical Cable and Extender Market Revenue (US$ Mn) and Forecasts, By Distribution channel
16.6.3.3.1.Online
16.6.3.3.2.Offline
16.6.3.4.Rest of Latin America Active Optical Cable and Extender Market Revenue (US$ Mn) and Forecasts, By End User Industry
16.6.3.4.1.IT and Telecommunication
16.6.3.4.2.Aerospace
16.6.3.4.3.Defense
16.6.3.4.4.Automotive
16.6.3.4.5.Consumer Electronics
16.6.3.4.6.Banking, Finance Services and Insurance (BFSI)
16.6.3.4.7.Media and Entertainment
16.6.3.4.8.Retail
16.6.3.4.9.Healthcare
16.6.3.4.10.Industrial
16.6.3.4.11.Others
16.7.Key Segment for Channeling Investments
16.7.1.By Country
16.7.2.By Protocol
16.7.3.By Form Factor
16.7.4.By Distribution channel
16.7.5.By End User Industry
17.Competitive Benchmarking
17.1.Market Share Analysis, 2022
17.2.Global Presence and Growth Strategies
17.2.1.Mergers and Acquisitions
17.2.2.Product Launches
17.2.3.Investments Trends
17.2.4.R&D Initiatives
18.Player Profiles
18.1.Amphenol Communications Solutions
18.1.1.Company Details
18.1.2.Company Overview
18.1.3.Product Offerings
18.1.4.Key Developments
18.1.5.Financial Analysis
18.1.6.SWOT Analysis
18.1.7.Business Strategies
18.2.APAC Opto Electronics Inc.
18.2.1.Company Details
18.2.2.Company Overview
18.2.3.Product Offerings
18.2.4.Key Developments
18.2.5.Financial Analysis
18.2.6.SWOT Analysis
18.2.7.Business Strategies
18.3.ATEN INTERNATIONAL Co., Ltd
18.3.1.Company Details
18.3.2.Company Overview
18.3.3.Product Offerings
18.3.4.Key Developments
18.3.5.Financial Analysis
18.3.6.SWOT Analysis
18.3.7.Business Strategies
18.4.Beetek
18.4.1.Company Details
18.4.2.Company Overview
18.4.3.Product Offerings
18.4.4.Key Developments
18.4.5.Financial Analysis
18.4.6.SWOT Analysis
18.4.7.Business Strategies
18.5.BizLink Group
18.5.1.Company Details
18.5.2.Company Overview
18.5.3.Product Offerings
18.5.4.Key Developments
18.5.5.Financial Analysis
18.5.6.SWOT Analysis
18.5.7.Business Strategies
18.6.Black Box
18.6.1.Company Details
18.6.2.Company Overview
18.6.3.Product Offerings
18.6.4.Key Developments
18.6.5.Financial Analysis
18.6.6.SWOT Analysis
18.6.7.Business Strategies
18.7.Broadcom
18.7.1.Company Details
18.7.2.Company Overview
18.7.3.Product Offerings
18.7.4.Key Developments
18.7.5.Financial Analysis
18.7.6.SWOT Analysis
18.7.7.Business Strategies
18.8.Coherent Corp.
18.8.1.Company Details
18.8.2.Company Overview
18.8.3.Product Offerings
18.8.4.Key Developments
18.8.5.Financial Analysis
18.8.6.SWOT Analysis
18.8.7.Business Strategies
18.9.Corning Incorporated
18.9.1.Company Details
18.9.2.Company Overview
18.9.3.Product Offerings
18.9.4.Key Developments
18.9.5.Financial Analysis
18.9.6.SWOT Analysis
18.9.7.Business Strategies
18.10.LIGHTWARE VISUAL ENGINEERING
18.10.1.Company Details
18.10.2.Company Overview
18.10.3.Product Offerings
18.10.4.Key Developments
18.10.5.Financial Analysis
18.10.6.SWOT Analysis
18.10.7.Business Strategies
18.11.Molex
18.11.1.Company Details
18.11.2.Company Overview
18.11.3.Product Offerings
18.11.4.Key Developments
18.11.5.Financial Analysis
18.11.6.SWOT Analysis
18.11.7.Business Strategies
18.12.Nice North America LLC
18.12.1.Company Details
18.12.2.Company Overview
18.12.3.Product Offerings
18.12.4.Key Developments
18.12.5.Financial Analysis
18.12.6.SWOT Analysis
18.12.7.Business Strategies
18.13.NVIDIA Corporation
18.13.1.Company Details
18.13.2.Company Overview
18.13.3.Product Offerings
18.13.4.Key Developments
18.13.5.Financial Analysis
18.13.6.SWOT Analysis
18.13.7.Business Strategies
18.14.Philex Electronic Ltd.
18.14.1.Company Details
18.14.2.Company Overview
18.14.3.Product Offerings
18.14.4.Key Developments
18.14.5.Financial Analysis
18.14.6.SWOT Analysis
18.14.7.Business Strategies
18.15.TE Connectivity Ltd.
18.15.1.Company Details
18.15.2.Company Overview
18.15.3.Product Offerings
18.15.4.Key Developments
18.15.5.Financial Analysis
18.15.6.SWOT Analysis
18.15.7.Business Strategies
18.16.Vitex
18.16.1.Company Details
18.16.2.Company Overview
18.16.3.Product Offerings
18.16.4.Key Developments
18.16.5.Financial Analysis
18.16.6.SWOT Analysis
18.16.7.Business Strategies
18.17.Other market participants
19.Key Findings

.

Note: This ToC is tentative and can be changed according to the research study conducted during the course of report completion.

.

**Exclusive for Multi-User and Enterprise User.

.

Global Active Optical Cable and Extender Market Segmentation

Global Active Optical Cable and Extender Market –Protocol Outlook

 InfiniBand
 Ethernet
 HDMI
 USB
 Thunderbolt
 Fiberchannel
 Serial Attached SCSI (SAS)
 Display Port
  PCI Express (PCIe)
 Others

Global Active Optical Cable and Extender Market –Form Factor Outlook

 QSFP
 SFP
 QSFP DD
 SFP DD
 QSFP+
 CFP
 SPF+
 Others

Global Active Optical Cable and Extender Market –Distribution Channel Outlook

 Online
 Offline

Global Active Optical Cable and Extender Market – End User Industry Outlook

 IT & Telecommunication
 Aerospace
 Defense
 Automotive
 Consumer Electronics
 Banking, Finance Services and Insurance
 Media & Entertainment
 Retail
 Healthcare
 Industrial
 Others

Global Active Optical Cable and Extender Market – RegionalOutlook

 North America (U.S., Canada, Mexico, Rest of North America)
 Europe (France, The UK, Spain, Germany, Italy, Nordic Countries (Denmark, Finland, Iceland, Sweden, Norway), Benelux Union (Belgium, The Netherlands, Luxembourg), Rest of Europe)
 Asia Pacific (China, Japan, India, New Zealand, Australia, South Korea, Southeast Asia (Indonesia, Thailand, Malaysia, Singapore, Rest of Southeast Asia), Rest of Asia Pacific)
 Middle East & Africa (Saudi Arabia, UAE, Egypt, Kuwait, South Africa, Rest of Middle East & Africa)
 Latin America (Brazil, Argentina, Rest of Latin America)

**Note: The report covers cross-segmentation analysis by region further into countries

.

The Niche Research approach encompasses both primary and secondary research methods to provide comprehensive insights. While primary research is the cornerstone of our studies, we also incorporate secondary research sources such as company annual reports, premium industry databases, press releases, industry journals, and white papers.

Within our primary research, we actively engage with various industry stakeholders, conducting paid interviews and surveys. Our meticulous analysis extends to every market participant in major countries, allowing us to thoroughly examine their portfolios, calculate market shares, and segment revenues.

Our data collection primarily focuses on individual countries within our research scope, enabling us to estimate regional market sizes. Typically, we employ a bottom-up approach, meticulously tracking trends in different countries. We analyze growth drivers, constraints, technological innovations, and opportunities for each country, ultimately arriving at regional figures.Our process begins by examining the growth prospects of each country. Building upon these insights, we project growth and trends for the entire region. Finally, we utilize our proprietary model to refine estimations and forecasts.

Our data validation standards are integral to ensuring the reliability and accuracy of our research findings. Here’s a breakdown of our data validation processes and the stakeholders we engage with during our primary research:

  • Supply Side Analysis: We initiate a supply side analysis by directly contacting market participants, through telephonic interviews and questionnaires containing both open-ended and close-ended questions. We gather information on their portfolios, segment revenues, developments, and growth strategies.
  • Demand Side Analysis: To gain insights into adoption trends and consumer preferences, we reach out to target customers and users (non-vendors). This information forms a vital part of the qualitative analysis section of our reports, covering market dynamics, adoption trends, consumer behavior, spending patterns, and other related aspects.
  • Consultant Insights: We tap into the expertise of our partner consultants from around the world to obtain their unique viewpoints and perspectives. Their insights contribute to a well-rounded understanding of the markets under investigation.
  • In-House Validation: To ensure data accuracy and reliability, we conduct cross-validation of data points and information through our in-house team of consultants and utilize advanced data modeling tools for thorough verification.

The forecasts we provide are based on a comprehensive assessment of various factors, including:

  • Market Trends and Past Performance (Last Five Years): We accurately analyze market trends and performance data from preceding five years to identify historical patterns and understand the market’s evolution.
  • Historical Performance and Growth of Market Participants: We assess the historical performance and growth trajectories of key market participants. This analysis provides insights into the competitive landscape and individual company strategies.
  • Market Determinants Impact Analysis (Next Eight Years): We conduct a rigorous analysis of the factors that are projected to influence the market over the next eight years. This includes assessing both internal and external determinants that can shape market dynamics.
  • Drivers and Challenges for the Forecast Period:Identify the factors expected to drive market growth during the forecast period, as well as the challenges that the industry may face. This analysis aids in deriving an accurate growth rate projection.
  • New Acquisitions, Collaborations, or Partnerships: We keep a close watch on any new acquisitions, collaborations, or partnerships within the industry. These developments can have a significant impact on market dynamics and competitiveness.
  • Macro and Micro Factors Analysis:A thorough examination of both macro-level factors (e.g., economic trends, regulatory changes) and micro-level factors (e.g., technological advancements, consumer preferences) that may influence the market during the forecast period.
  • End-User Sentiment Analysis: To understand the market from the end-user perspective, we conduct sentiment analysis. This involves assessing the sentiment, preferences, and feedback of the end-users, which can provide valuable insights into market trends.
  • Perspective of Primary Participants: Insights gathered directly from primary research participants play a crucial role in shaping our forecasts. Their perspectives and experiences provide valuable qualitative data.
  • Year-on-Year Growth Trend: We utilize a year-on-year growth trend based on historical market growth and expected future trends. This helps in formulating our growth projections, aligning them with the market’s historical performance.

Research process adopted by TNR involves multiple stages, including data collection, validation, quality checks, and presentation. It’s crucial that the data and information we provide add value to your existing market understanding and expertise. We have also established partnerships with business consulting, research, and survey organizations across regions and globally to collaborate on regional analysis and data validation, ensuring the highest level of accuracy and reliability in our reports.


Procure Comprehensive Study of

Global Active Optical Cable and Extender Market

Online Only

  • Online Access
  • Read Only File
  • Validity 3 Months
  • Print, Copy, Paste & Download
  • PPT, Excel
  • Cost-Free Report in the Next Update
$3300
Buy Now

Single User

  • Access to One User on One System
  • Read Only File
  • Validity 6 Months
  • Limited Print,Copy, Paste
  • PPT, Excel
  • Cost-Free Report in the Next Update
$4200
Buy Now

Multi User

  • Access to Fiver Users
  • PDF File
  • Validity 1 Year
  • Upto FivePrints
  • Cost-Free Report in the Next Update
  • PPT, Excel
$6000
Buy Now

Enterprise User

  • Access to Unlimited Users
  • PDF, PPT, Excel
  • Unlimited Validity, Prints&Downloads
  • 1 Hour Cost-Free & Dedicated Analyst Support
  • 10% Cost-Free Customization
  • Cost-Free Report Update Twice in a Year
  • Recommendations for Business Strategies
  • Authorization to Quote TNR, The Niche Research
$7300
Buy Now

Library Access

  • Online Access to Content Publications
  • Access Player Profiles Online
  • Get Immediate Access to Newly Added Content
  • Acquire 12 PDF Downloads
  • Acquire 5 Excel Data Sets
  • Gain Access to 290+ PDFs of Company Profiles
  • Round-the-clock Email and Phone Assistance
  • Dashboard Usage and Trends
  • Renewal & Upgrade Assistance
  • Assessing Customization Options and Alerts for New Reports
$10788
Buy Now
*Taxes/Fees, if applicable will be added during checkout. All prices in USD

Why TNR The Niche Research?

  • Unwavering Commitment to Excellence

  • Veteran Team of Researchers

  • Accurate and Timely Insights

  • Ethical Practices and Customized Service

  • Uninterrupted Availability Around the Clock

Scroll to Top