Global Animal Model Market By Animal Type, By Technology, By Application, By End User & By Region: Global Insights, Comparative Analysis, Trends and Forecasts, 2023 – 2031

  • Industry: Healthcare
  • Report ID: TNR-110-911
  • Number of Pages: 420
  • Table/Charts : Yes
  • November, 2023
  • Base Year : 2024
  • No. of Companies : 11+
  • No. of Countries : 29
  • Views : 10190
  • Covid Impact Covered: Yes
  • War Impact Covered: Yes
  • Formats : PDF, Excel, PPT

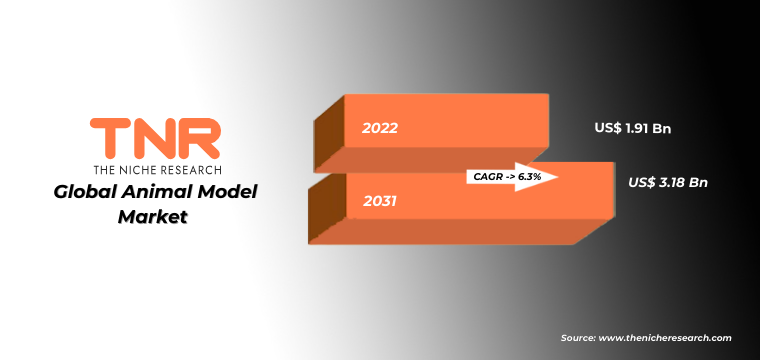
Global Animal Model Market was valued at US$ 1.91 Billion in 2022, growing at an estimated CAGR of 6.3% from 2023-2031.

An animal model is a living organism, typically an animal species like rodents, primates, or pigs, used in scientific research to study and understand biological processes, diseases, and human health. These models help researchers investigate complex biological mechanisms, test new therapies, and predict the potential effects of treatments before moving to human trials. By simulating physiological and genetic aspects of human conditions, animal models provide insights into disease progression, treatment responses, and safety assessments. Despite their utility, ethical concerns arise due to the use of animals in research. As such, scientists strive to develop alternatives like cell cultures and computer simulations. Animal models remain essential tools for advancing medical knowledge and improving human well-being while raising ethical questions that underline the need for responsible research practices. Among the animal types, mice and rats are typically the dominating and most commonly used species in scientific research due to their genetic similarity to humans and ease of handling. They constitute a substantial majority of animals used in research, with mice being particularly favored due to their short generation time and well-established genetic manipulation techniques.

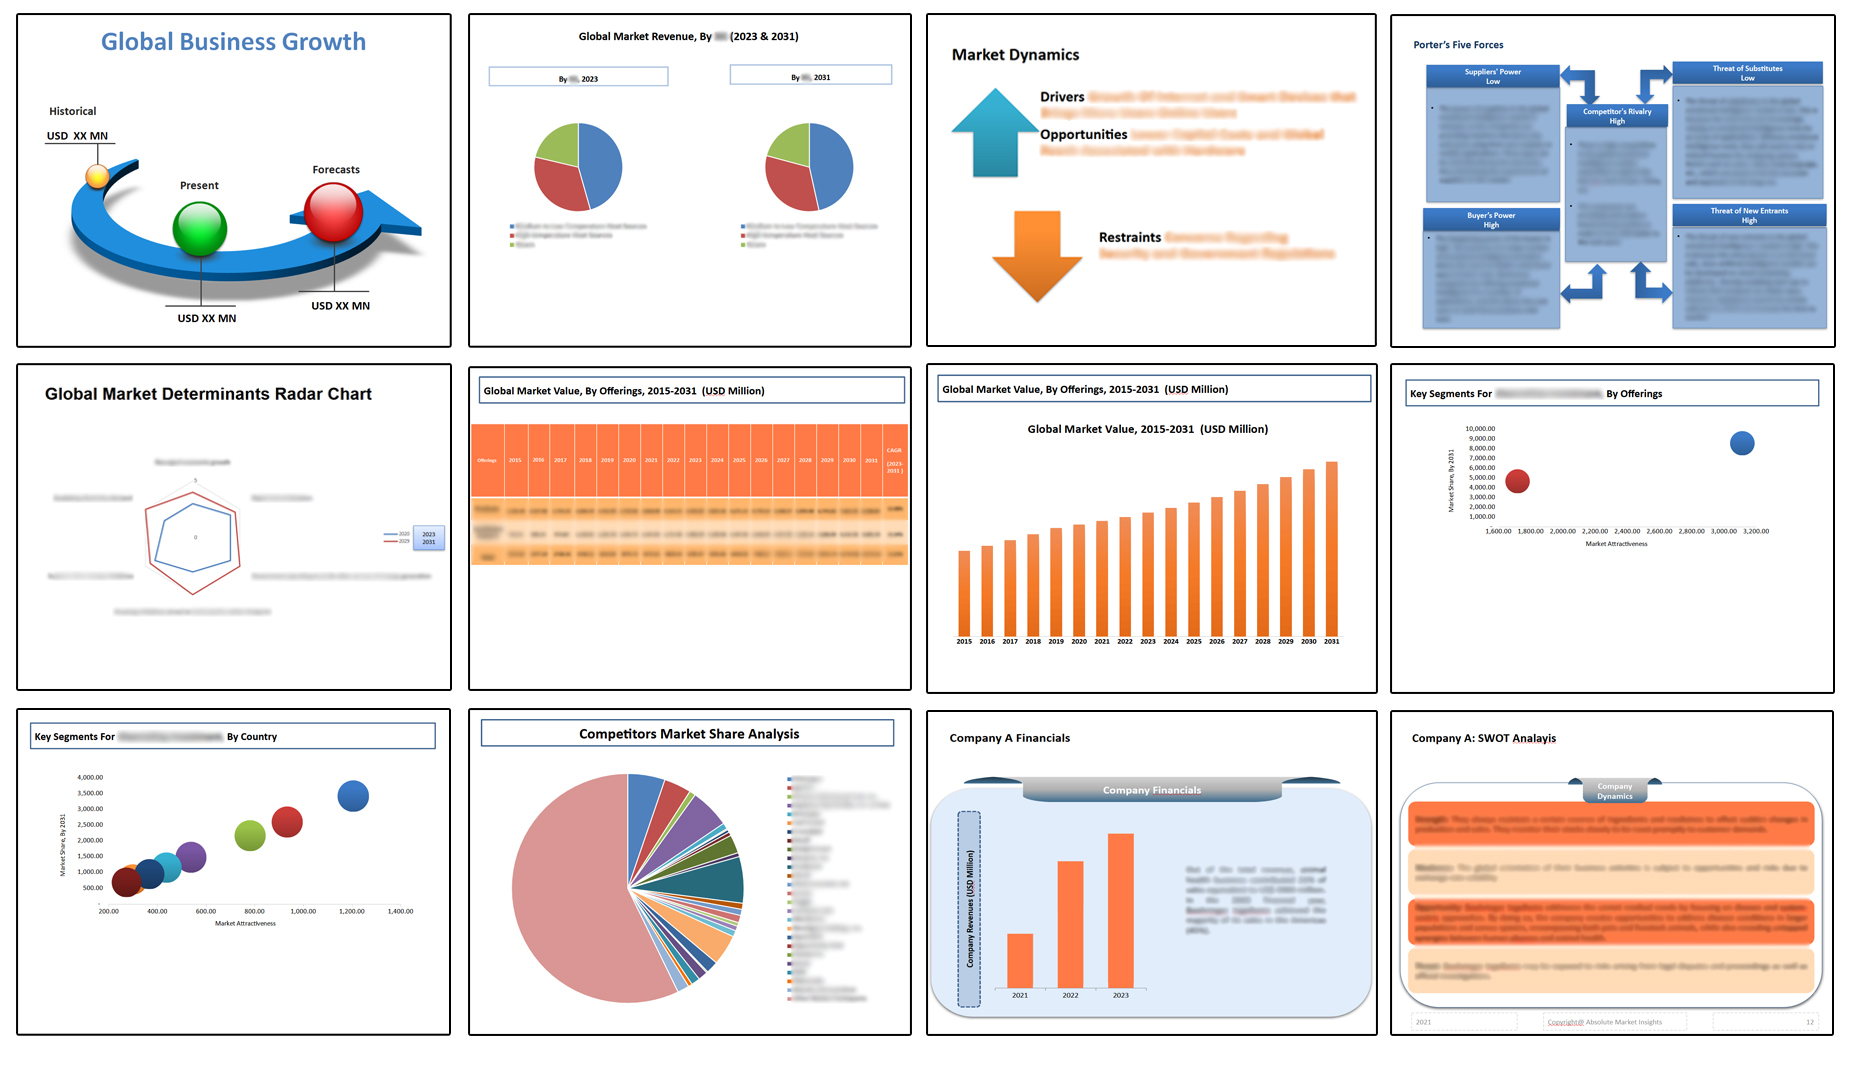
Global Animal Model Market Revenue & Forecast, (US$ Million), 2015 – 2031

COVID-19 Impact Analysis on Global Animal Model Market

Pre-COVID-19, the animal model market was witnessing steady growth driven by pharmaceutical, biotechnology, and academic research. The demand for animal models, primarily mice and rats, was fueled by the need to understand diseases, develop therapies, and test drug efficacy. However, the pandemic introduced significant disruptions. Research activities were temporarily halted or redirected towards COVID-19 studies, diverting resources and attention. Despite this, the crisis also highlighted the importance of animal models in vaccine and drug development. Post-COVID-19, the market is adapting with renewed emphasis on infectious disease research. The accelerated vaccine development showcased the agility of animal models in testing treatments. While challenges remain, the pandemic reinforced the critical role of animal models in biomedical research, potentially leading to increased investments and advancements in the field.

Report Outline 

Advancements in genetic engineering have been a key driver of the animal model market. Techniques like CRISPR-Cas9 have revolutionized the creation of genetically modified animals for disease modeling, drug testing, and understanding gene function. For instance, a survey by the International Society for Transgenic Technologies reported that the use of CRISPR-Cas9 in creating animal models has rapidly increased since its inception, contributing to more accurate disease simulations. This trend enables researchers to develop models that closely mimic human conditions, enhancing the reliability of research outcomes and drug development. Ethical concerns surrounding animal welfare and increasing regulatory pressure have posed significant challenges to the animal model market. Public opinion on animal testing is evolving, and regulations are becoming more stringent. A study by Pew Research Center indicated that a considerable percentage of people expressed concerns about animal research. Additionally, governments and organizations are pushing for alternatives to animal models. The implementation of the 3Rs principle (Replacement, Reduction, Refinement) is gaining traction, urging researchers to seek alternatives, reduce animal use, and refine experimental techniques. These factors create a delicate balance between scientific progress and ethical considerations in the animal model industry.

In the global animal model market, pharma and biotech companies have established dominance and are experiencing faster growth compared to academic research institutes. Pharma and biotech companies heavily rely on animal models to conduct preclinical trials and test the safety and efficacy of potential drug candidates. According to a study published in the journal “Nature Reviews Drug Discovery,” the use of animal models in drug development has significantly contributed to successful clinical trials. This demand has led to a substantial investment in animal models by these companies.

North America conquered major market share in the global animal model market in 2022 due to the concentration of major pharmaceutical and biotechnology firms. The US National Institutes of Health (NIH) reported that the demand for animal models remains high for drug development and disease research in this region.

Competitive Landscape

The report provides both, qualitative and quantitative research of global animal model market, as well as provides comprehensive insights and development methods adopted by the key contenders. The report also offers extensive research on the key players in this market and details on the competitiveness of these players. Key business strategies such as mergers and acquisitions (M&A), affiliations, collaborations, and contracts adopted by these major market participants are also recognized and analyzed in the report. For each company, the report studies their global presence, competitors, service offerings and specification amongst others.

Some of the players operating in the global animal model market are

  • Charles River Laboratories
  • Crown Bioscience
  • genOway
  • Hera Biolabs
  • Inotiv
  • Janvier Labs
  • Ozgene Pty Ltd.
  • Taconic Biosciences, Inc.
  • The Jackson Laboratory
  • Trans Genic Inc.
  • Other Industry Participants

Global Animal Model Market Summary

Report Specifications Details
Market Revenue in 2022 US$ 1.91 Bn
Market Size Forecast by 2031 US$ 3.18 Bn
Growth Rate (CAGR) 6.3%
Historic Data 2015 – 2021
Base Year for Estimation 2022
Forecast Period 2023 – 2031
Report Inclusions Market Size & Estimates, Market Dynamics, Competitive Scenario, Trends, Growth Factors, Market Determinants, Key Investment Segmentation, Product/Service/Solutions Benchmarking
Segments Covered By Animal Type, By Technology, By Application, By End User, By Region
Regions Covered North America, Europe, Asia Pacific, Middle East & Africa, Latin America
Countries Covered U.S., Canada, Mexico, Rest of North America,  France, The UK, Spain, Germany, Italy, Nordic Countries (Denmark, Finland, Iceland, Sweden, Norway), Benelux Union (Belgium, The Netherlands, Luxembourg), Rest of Europe,  China, Japan, India, New Zealand, Australia, South Korea, Southeast Asia (Indonesia, Thailand, Malaysia, Singapore, Rest of Southeast Asia), Rest of Asia Pacific,  Saudi Arabia, UAE, Egypt, Kuwait, South Africa, Rest of Middle East & Africa,  Brazil, Argentina, Rest of Latin America
Key Players Charles River Laboratories, Crown Bioscience, genOway, Hera Biolabs, Inotiv, Janvier Labs, Ozgene Pty Ltd., Taconic Biosciences, Inc., The Jackson Laboratory, Trans Genic Inc., Other Industry Participants
Customization Scope Customization allows for the inclusion/modification of content pertaining to geographical regions, countries, and specific market segments.
Pricing & Procurement Options Explore purchase options tailored to your specific research requirements
Contact Details Consult With Our Expert

Japan (Toll-Free):  +81 663-386-8111

South Korea (Toll-Free):  +82-808- 703-126

Saudi Arabia (Toll-Free):  +966 800-850-1643

United Kingdom: +44 753-710-5080

United States: +1 302-232-5106

E-mail:  askanexpert@thenicheresearch.com


Global Animal Model Market

By Animal Type

  • Mice
  • Rats
  • Fish
  • Birds
  • Cattle
  • Pigs
  • Amphibians
  • Guinea Pigs
  • Dogs
  • Cats
  • Rabbits
  • Monkeys
  • Sheep
  • Hamsters
  • Other animal types

By Technology

  • CRISPR
  • Microinjection
  • Embryonic Stem Cell Injection
  • Nuclear Transfer
  • Other technologies

By Application

  • Drug Discovery and Development
  • Basic Research
  • Others

By End User

  • Pharma and Biotech Companies
  • Academic Research Institutes
  • CROs and CDMOs

By Region

  • North America (U.S., Canada, Mexico, Rest of North America)
  • Europe (France, The UK, Spain, Germany, Italy, Nordic Countries (Denmark, Finland, Iceland, Sweden, Norway), Benelux Union (Belgium, The Netherlands, Luxembourg), Rest of Europe)
  • Asia Pacific (China, Japan, India, New Zealand, Australia, South Korea, Southeast Asia (Indonesia, Thailand, Malaysia, Singapore, Rest of Southeast Asia), Rest of Asia Pacific)
  • Middle East & Africa (Saudi Arabia, UAE, Egypt, Kuwait, South Africa, Rest of Middle East & Africa)
  • Latin America (Brazil, Argentina, Rest of Latin America)

.

Table of Contents

.

1.Market Scope
1.1.Market Segmentation
1.2.Years Considered
1.2.1.Historic Years: 2015 – 2021
1.2.2.Base Year: 2022
1.2.3.Forecast Years: 2023 – 2031
2.Key Target Audiences
3.Research Methodology
3.1.Primary Research
3.1.1.Research Questionnaire
3.1.2.Global Percentage Breakdown
3.1.3.Primary Interviews: Key Opinion Leaders (KOLs)
3.2.Secondary Research
3.2.1.Paid Databases
3.2.2.Secondary Sources
3.3.Market Size Estimates
3.3.1.Top-Down Approach
3.3.2.Bottom-Up Approach
3.4.Data Triangulation Methodology
3.5.Research Assumptions
4.Recommendations and Insights from AMI’s Perspective**
5.Holistic Overview of Animal Model Market
6.Market Synopsis: Animal Model Market
7.Animal Model Market Analysis: Qualitative Perspective
7.1.Introduction
7.1.1.Product Definition
7.1.2.Industry Development
7.2.Market Dynamics
7.2.1.Drivers
7.2.2.Restraints
7.2.3.Opportunities
7.2.4.Challenges
7.3.Trends in Animal Model Market
7.4.Market Determinants Radar Chart
7.5.Macro-Economic and Micro-Economic Indicators: Animal Model Market
7.6.Porter’s Five Force Analysis
7.7.Impact of Covid-19 on Animal Model Market
7.8.PESTEL Analysis
8.Global Animal Model Market Analysis and Forecasts, 2023 – 2031
8.1.Overview
8.1.1.Global Animal Model Market Revenue (US$ Mn)
8.2.Global Animal Model Market Revenue (US$ Mn) and Forecasts, By Animal Type
8.2.1.Mice
8.2.1.1.Definition
8.2.1.2.Market Estimation and Penetration, 2015 – 2022
8.2.1.3.Market Forecast, 2023 – 2031
8.2.1.4.Compound Annual Growth Rate (CAGR)
8.2.1.5.Regional Bifurcation
8.2.1.5.1.North America
8.2.1.5.1.1.Market Estimation, 2015 – 2022
8.2.1.5.1.2.Market Forecast, 2023 – 2031
8.2.1.5.2.Europe
8.2.1.5.2.1.Market Estimation, 2015 – 2022
8.2.1.5.2.2.Market Forecast, 2023 – 2031
8.2.1.5.3.Asia Pacific
8.2.1.5.3.1.Market Estimation, 2015 – 2022
8.2.1.5.3.2.Market Forecast, 2023 – 2031
8.2.1.5.4.Middle East and Africa
8.2.1.5.4.1.Market Estimation, 2015 – 2022
8.2.1.5.4.2.Market Forecast, 2023 – 2031
8.2.1.5.5.Latin America
8.2.1.5.5.1.Market Estimation, 2015 – 2022
8.2.1.5.5.2.Market Forecast, 2023 – 2031
8.2.2.Rats
8.2.2.1.Definition
8.2.2.2.Market Estimation and Penetration, 2015 – 2022
8.2.2.3.Market Forecast, 2023 – 2031
8.2.2.4.Compound Annual Growth Rate (CAGR)
8.2.2.5.Regional Bifurcation
8.2.2.5.1.North America
8.2.2.5.1.1.Market Estimation, 2015 – 2022
8.2.2.5.1.2.Market Forecast, 2023 – 2031
8.2.2.5.2.Europe
8.2.2.5.2.1.Market Estimation, 2015 – 2022
8.2.2.5.2.2.Market Forecast, 2023 – 2031
8.2.2.5.3.Asia Pacific
8.2.2.5.3.1.Market Estimation, 2015 – 2022
8.2.2.5.3.2.Market Forecast, 2023 – 2031
8.2.2.5.4.Middle East and Africa
8.2.2.5.4.1.Market Estimation, 2015 – 2022
8.2.2.5.4.2.Market Forecast, 2023 – 2031
8.2.2.5.5.Latin America
8.2.2.5.5.1.Market Estimation, 2015 – 2022
8.2.2.5.5.2.Market Forecast, 2023 – 2031
8.2.3.Fish
8.2.3.1.Definition
8.2.3.2.Market Estimation and Penetration, 2015 – 2022
8.2.3.3.Market Forecast, 2023 – 2031
8.2.3.4.Compound Annual Growth Rate (CAGR)
8.2.3.5.Regional Bifurcation
8.2.3.5.1.North America
8.2.3.5.1.1.Market Estimation, 2015 – 2022
8.2.3.5.1.2.Market Forecast, 2023 – 2031
8.2.3.5.2.Europe
8.2.3.5.2.1.Market Estimation, 2015 – 2022
8.2.3.5.2.2.Market Forecast, 2023 – 2031
8.2.3.5.3.Asia Pacific
8.2.3.5.3.1.Market Estimation, 2015 – 2022
8.2.3.5.3.2.Market Forecast, 2023 – 2031
8.2.3.5.4.Middle East and Africa
8.2.3.5.4.1.Market Estimation, 2015 – 2022
8.2.3.5.4.2.Market Forecast, 2023 – 2031
8.2.3.5.5.Latin America
8.2.3.5.5.1.Market Estimation, 2015 – 2022
8.2.3.5.5.2.Market Forecast, 2023 – 2031
8.2.4.Birds
8.2.4.1.Definition
8.2.4.2.Market Estimation and Penetration, 2015 – 2022
8.2.4.3.Market Forecast, 2023 – 2031
8.2.4.4.Compound Annual Growth Rate (CAGR)
8.2.4.5.Regional Bifurcation
8.2.4.5.1.North America
8.2.4.5.1.1.Market Estimation, 2015 – 2022
8.2.4.5.1.2.Market Forecast, 2023 – 2031
8.2.4.5.2.Europe
8.2.4.5.2.1.Market Estimation, 2015 – 2022
8.2.4.5.2.2.Market Forecast, 2023 – 2031
8.2.4.5.3.Asia Pacific
8.2.4.5.3.1.Market Estimation, 2015 – 2022
8.2.4.5.3.2.Market Forecast, 2023 – 2031
8.2.4.5.4.Middle East and Africa
8.2.4.5.4.1.Market Estimation, 2015 – 2022
8.2.4.5.4.2.Market Forecast, 2023 – 2031
8.2.4.5.5.Latin America
8.2.4.5.5.1.Market Estimation, 2015 – 2022
8.2.4.5.5.2.Market Forecast, 2023 – 2031
8.2.5.Cattle
8.2.5.1.Definition
8.2.5.2.Market Estimation and Penetration, 2015 – 2022
8.2.5.3.Market Forecast, 2023 – 2031
8.2.5.4.Compound Annual Growth Rate (CAGR)
8.2.5.5.Regional Bifurcation
8.2.5.5.1.North America
8.2.5.5.1.1.Market Estimation, 2015 – 2022
8.2.5.5.1.2.Market Forecast, 2023 – 2031
8.2.5.5.2.Europe
8.2.5.5.2.1.Market Estimation, 2015 – 2022
8.2.5.5.2.2.Market Forecast, 2023 – 2031
8.2.5.5.3.Asia Pacific
8.2.5.5.3.1.Market Estimation, 2015 – 2022
8.2.5.5.3.2.Market Forecast, 2023 – 2031
8.2.5.5.4.Middle East and Africa
8.2.5.5.4.1.Market Estimation, 2015 – 2022
8.2.5.5.4.2.Market Forecast, 2023 – 2031
8.2.5.5.5.Latin America
8.2.5.5.5.1.Market Estimation, 2015 – 2022
8.2.5.5.5.2.Market Forecast, 2023 – 2031
8.2.6.Pigs
8.2.6.1.Definition
8.2.6.2.Market Estimation and Penetration, 2015 – 2022
8.2.6.3.Market Forecast, 2023 – 2031
8.2.6.4.Compound Annual Growth Rate (CAGR)
8.2.6.5.Regional Bifurcation
8.2.6.5.1.North America
8.2.6.5.1.1.Market Estimation, 2015 – 2022
8.2.6.5.1.2.Market Forecast, 2023 – 2031
8.2.6.5.2.Europe
8.2.6.5.2.1.Market Estimation, 2015 – 2022
8.2.6.5.2.2.Market Forecast, 2023 – 2031
8.2.6.5.3.Asia Pacific
8.2.6.5.3.1.Market Estimation, 2015 – 2022
8.2.6.5.3.2.Market Forecast, 2023 – 2031
8.2.6.5.4.Middle East and Africa
8.2.6.5.4.1.Market Estimation, 2015 – 2022
8.2.6.5.4.2.Market Forecast, 2023 – 2031
8.2.6.5.5.Latin America
8.2.6.5.5.1.Market Estimation, 2015 – 2022
8.2.6.5.5.2.Market Forecast, 2023 – 2031
8.2.7.Amphibians
8.2.7.1.Definition
8.2.7.2.Market Estimation and Penetration, 2015 – 2022
8.2.7.3.Market Forecast, 2023 – 2031
8.2.7.4.Compound Annual Growth Rate (CAGR)
8.2.7.5.Regional Bifurcation
8.2.7.5.1.North America
8.2.7.5.1.1.Market Estimation, 2015 – 2022
8.2.7.5.1.2.Market Forecast, 2023 – 2031
8.2.7.5.2.Europe
8.2.7.5.2.1.Market Estimation, 2015 – 2022
8.2.7.5.2.2.Market Forecast, 2023 – 2031
8.2.7.5.3.Asia Pacific
8.2.7.5.3.1.Market Estimation, 2015 – 2022
8.2.7.5.3.2.Market Forecast, 2023 – 2031
8.2.7.5.4.Middle East and Africa
8.2.7.5.4.1.Market Estimation, 2015 – 2022
8.2.7.5.4.2.Market Forecast, 2023 – 2031
8.2.7.5.5.Latin America
8.2.7.5.5.1.Market Estimation, 2015 – 2022
8.2.7.5.5.2.Market Forecast, 2023 – 2031
8.2.8.Guinea Pigs
8.2.8.1.Definition
8.2.8.2.Market Estimation and Penetration, 2015 – 2022
8.2.8.3.Market Forecast, 2023 – 2031
8.2.8.4.Compound Annual Growth Rate (CAGR)
8.2.8.5.Regional Bifurcation
8.2.8.5.1.North America
8.2.8.5.1.1.Market Estimation, 2015 – 2022
8.2.8.5.1.2.Market Forecast, 2023 – 2031
8.2.8.5.2.Europe
8.2.8.5.2.1.Market Estimation, 2015 – 2022
8.2.8.5.2.2.Market Forecast, 2023 – 2031
8.2.8.5.3.Asia Pacific
8.2.8.5.3.1.Market Estimation, 2015 – 2022
8.2.8.5.3.2.Market Forecast, 2023 – 2031
8.2.8.5.4.Middle East and Africa
8.2.8.5.4.1.Market Estimation, 2015 – 2022
8.2.8.5.4.2.Market Forecast, 2023 – 2031
8.2.8.5.5.Latin America
8.2.8.5.5.1.Market Estimation, 2015 – 2022
8.2.8.5.5.2.Market Forecast, 2023 – 2031
8.2.9.Dogs
8.2.9.1.Definition
8.2.9.2.Market Estimation and Penetration, 2015 – 2022
8.2.9.3.Market Forecast, 2023 – 2031
8.2.9.4.Compound Annual Growth Rate (CAGR)
8.2.9.5.Regional Bifurcation
8.2.9.5.1.North America
8.2.9.5.1.1.Market Estimation, 2015 – 2022
8.2.9.5.1.2.Market Forecast, 2023 – 2031
8.2.9.5.2.Europe
8.2.9.5.2.1.Market Estimation, 2015 – 2022
8.2.9.5.2.2.Market Forecast, 2023 – 2031
8.2.9.5.3.Asia Pacific
8.2.9.5.3.1.Market Estimation, 2015 – 2022
8.2.9.5.3.2.Market Forecast, 2023 – 2031
8.2.9.5.4.Middle East and Africa
8.2.9.5.4.1.Market Estimation, 2015 – 2022
8.2.9.5.4.2.Market Forecast, 2023 – 2031
8.2.9.5.5.Latin America
8.2.9.5.5.1.Market Estimation, 2015 – 2022
8.2.9.5.5.2.Market Forecast, 2023 – 2031
8.2.10.Cats
8.2.10.1.Definition
8.2.10.2.Market Estimation and Penetration, 2015 – 2022
8.2.10.3.Market Forecast, 2023 – 2031
8.2.10.4.Compound Annual Growth Rate (CAGR)
8.2.10.5.Regional Bifurcation
8.2.10.5.1.North America
8.2.10.5.1.1.Market Estimation, 2015 – 2022
8.2.10.5.1.2.Market Forecast, 2023 – 2031
8.2.10.5.2.Europe
8.2.10.5.2.1.Market Estimation, 2015 – 2022
8.2.10.5.2.2.Market Forecast, 2023 – 2031
8.2.10.5.3.Asia Pacific
8.2.10.5.3.1.Market Estimation, 2015 – 2022
8.2.10.5.3.2.Market Forecast, 2023 – 2031
8.2.10.5.4.Middle East and Africa
8.2.10.5.4.1.Market Estimation, 2015 – 2022
8.2.10.5.4.2.Market Forecast, 2023 – 2031
8.2.10.5.5.Latin America
8.2.10.5.5.1.Market Estimation, 2015 – 2022
8.2.10.5.5.2.Market Forecast, 2023 – 2031
8.2.11.Rabbits
8.2.11.1.Definition
8.2.11.2.Market Estimation and Penetration, 2015 – 2022
8.2.11.3.Market Forecast, 2023 – 2031
8.2.11.4.Compound Annual Growth Rate (CAGR)
8.2.11.5.Regional Bifurcation
8.2.11.5.1.North America
8.2.11.5.1.1.Market Estimation, 2015 – 2022
8.2.11.5.1.2.Market Forecast, 2023 – 2031
8.2.11.5.2.Europe
8.2.11.5.2.1.Market Estimation, 2015 – 2022
8.2.11.5.2.2.Market Forecast, 2023 – 2031
8.2.11.5.3.Asia Pacific
8.2.11.5.3.1.Market Estimation, 2015 – 2022
8.2.11.5.3.2.Market Forecast, 2023 – 2031
8.2.11.5.4.Middle East and Africa
8.2.11.5.4.1.Market Estimation, 2015 – 2022
8.2.11.5.4.2.Market Forecast, 2023 – 2031
8.2.11.5.5.Latin America
8.2.11.5.5.1.Market Estimation, 2015 – 2022
8.2.11.5.5.2.Market Forecast, 2023 – 2031
8.2.12.Monkeys
8.2.12.1.Definition
8.2.12.2.Market Estimation and Penetration, 2015 – 2022
8.2.12.3.Market Forecast, 2023 – 2031
8.2.12.4.Compound Annual Growth Rate (CAGR)
8.2.12.5.Regional Bifurcation
8.2.12.5.1.North America
8.2.12.5.1.1.Market Estimation, 2015 – 2022
8.2.12.5.1.2.Market Forecast, 2023 – 2031
8.2.12.5.2.Europe
8.2.12.5.2.1.Market Estimation, 2015 – 2022
8.2.12.5.2.2.Market Forecast, 2023 – 2031
8.2.12.5.3.Asia Pacific
8.2.12.5.3.1.Market Estimation, 2015 – 2022
8.2.12.5.3.2.Market Forecast, 2023 – 2031
8.2.12.5.4.Middle East and Africa
8.2.12.5.4.1.Market Estimation, 2015 – 2022
8.2.12.5.4.2.Market Forecast, 2023 – 2031
8.2.12.5.5.Latin America
8.2.12.5.5.1.Market Estimation, 2015 – 2022
8.2.12.5.5.2.Market Forecast, 2023 – 2031
8.2.13.Sheep
8.2.13.1.Definition
8.2.13.2.Market Estimation and Penetration, 2015 – 2022
8.2.13.3.Market Forecast, 2023 – 2031
8.2.13.4.Compound Annual Growth Rate (CAGR)
8.2.13.5.Regional Bifurcation
8.2.13.5.1.North America
8.2.13.5.1.1.Market Estimation, 2015 – 2022
8.2.13.5.1.2.Market Forecast, 2023 – 2031
8.2.13.5.2.Europe
8.2.13.5.2.1.Market Estimation, 2015 – 2022
8.2.13.5.2.2.Market Forecast, 2023 – 2031
8.2.13.5.3.Asia Pacific
8.2.13.5.3.1.Market Estimation, 2015 – 2022
8.2.13.5.3.2.Market Forecast, 2023 – 2031
8.2.13.5.4.Middle East and Africa
8.2.13.5.4.1.Market Estimation, 2015 – 2022
8.2.13.5.4.2.Market Forecast, 2023 – 2031
8.2.13.5.5.Latin America
8.2.13.5.5.1.Market Estimation, 2015 – 2022
8.2.13.5.5.2.Market Forecast, 2023 – 2031
8.2.14.Hamsters
8.2.14.1.Definition
8.2.14.2.Market Estimation and Penetration, 2015 – 2022
8.2.14.3.Market Forecast, 2023 – 2031
8.2.14.4.Compound Annual Growth Rate (CAGR)
8.2.14.5.Regional Bifurcation
8.2.14.5.1.North America
8.2.14.5.1.1.Market Estimation, 2015 – 2022
8.2.14.5.1.2.Market Forecast, 2023 – 2031
8.2.14.5.2.Europe
8.2.14.5.2.1.Market Estimation, 2015 – 2022
8.2.14.5.2.2.Market Forecast, 2023 – 2031
8.2.14.5.3.Asia Pacific
8.2.14.5.3.1.Market Estimation, 2015 – 2022
8.2.14.5.3.2.Market Forecast, 2023 – 2031
8.2.14.5.4.Middle East and Africa
8.2.14.5.4.1.Market Estimation, 2015 – 2022
8.2.14.5.4.2.Market Forecast, 2023 – 2031
8.2.14.5.5.Latin America
8.2.14.5.5.1.Market Estimation, 2015 – 2022
8.2.14.5.5.2.Market Forecast, 2023 – 2031
8.2.15.Other animal types
8.2.15.1.Definition
8.2.15.2.Market Estimation and Penetration, 2015 – 2022
8.2.15.3.Market Forecast, 2023 – 2031
8.2.15.4.Compound Annual Growth Rate (CAGR)
8.2.15.5.Regional Bifurcation
8.2.15.5.1.North America
8.2.15.5.1.1.Market Estimation, 2015 – 2022
8.2.15.5.1.2.Market Forecast, 2023 – 2031
8.2.15.5.2.Europe
8.2.15.5.2.1.Market Estimation, 2015 – 2022
8.2.15.5.2.2.Market Forecast, 2023 – 2031
8.2.15.5.3.Asia Pacific
8.2.15.5.3.1.Market Estimation, 2015 – 2022
8.2.15.5.3.2.Market Forecast, 2023 – 2031
8.2.15.5.4.Middle East and Africa
8.2.15.5.4.1.Market Estimation, 2015 – 2022
8.2.15.5.4.2.Market Forecast, 2023 – 2031
8.2.15.5.5.Latin America
8.2.15.5.5.1.Market Estimation, 2015 – 2022
8.2.15.5.5.2.Market Forecast, 2023 – 2031
8.3.Key Segment for Channeling Investments
8.3.1.By Animal Type
9.Global Animal Model Market Analysis and Forecasts, 2023 – 2031
9.1.Overview
9.2.Global Animal Model Market Revenue (US$ Mn) and Forecasts, By Technology
9.2.1.CRISPR
9.2.1.1.Definition
9.2.1.2.Market Estimation and Penetration, 2015 – 2022
9.2.1.3.Market Forecast, 2023 – 2031
9.2.1.4.Compound Annual Growth Rate (CAGR)
9.2.1.5.Regional Bifurcation
9.2.1.5.1.North America
9.2.1.5.1.1.Market Estimation, 2015 – 2022
9.2.1.5.1.2.Market Forecast, 2023 – 2031
9.2.1.5.2.Europe
9.2.1.5.2.1.Market Estimation, 2015 – 2022
9.2.1.5.2.2.Market Forecast, 2023 – 2031
9.2.1.5.3.Asia Pacific
9.2.1.5.3.1.Market Estimation, 2015 – 2022
9.2.1.5.3.2.Market Forecast, 2023 – 2031
9.2.1.5.4.Middle East and Africa
9.2.1.5.4.1.Market Estimation, 2015 – 2022
9.2.1.5.4.2.Market Forecast, 2023 – 2031
9.2.1.5.5.Latin America
9.2.1.5.5.1.Market Estimation, 2015 – 2022
9.2.1.5.5.2.Market Forecast, 2023 – 2031
9.2.2.Microinjection
9.2.2.1.Definition
9.2.2.2.Market Estimation and Penetration, 2015 – 2022
9.2.2.3.Market Forecast, 2023 – 2031
9.2.2.4.Compound Annual Growth Rate (CAGR)
9.2.2.5.Regional Bifurcation
9.2.2.5.1.North America
9.2.2.5.1.1.Market Estimation, 2015 – 2022
9.2.2.5.1.2.Market Forecast, 2023 – 2031
9.2.2.5.2.Europe
9.2.2.5.2.1.Market Estimation, 2015 – 2022
9.2.2.5.2.2.Market Forecast, 2023 – 2031
9.2.2.5.3.Asia Pacific
9.2.2.5.3.1.Market Estimation, 2015 – 2022
9.2.2.5.3.2.Market Forecast, 2023 – 2031
9.2.2.5.4.Middle East and Africa
9.2.2.5.4.1.Market Estimation, 2015 – 2022
9.2.2.5.4.2.Market Forecast, 2023 – 2031
9.2.2.5.5.Latin America
9.2.2.5.5.1.Market Estimation, 2015 – 2022
9.2.2.5.5.2.Market Forecast, 2023 – 2031
9.2.3.Embryonic Stem Cell Injection
9.2.3.1.Definition
9.2.3.2.Market Estimation and Penetration, 2015 – 2022
9.2.3.3.Market Forecast, 2023 – 2031
9.2.3.4.Compound Annual Growth Rate (CAGR)
9.2.3.5.Regional Bifurcation
9.2.3.5.1.North America
9.2.3.5.1.1.Market Estimation, 2015 – 2022
9.2.3.5.1.2.Market Forecast, 2023 – 2031
9.2.3.5.2.Europe
9.2.3.5.2.1.Market Estimation, 2015 – 2022
9.2.3.5.2.2.Market Forecast, 2023 – 2031
9.2.3.5.3.Asia Pacific
9.2.3.5.3.1.Market Estimation, 2015 – 2022
9.2.3.5.3.2.Market Forecast, 2023 – 2031
9.2.3.5.4.Middle East and Africa
9.2.3.5.4.1.Market Estimation, 2015 – 2022
9.2.3.5.4.2.Market Forecast, 2023 – 2031
9.2.3.5.5.Latin America
9.2.3.5.5.1.Market Estimation, 2015 – 2022
9.2.3.5.5.2.Market Forecast, 2023 – 2031
9.2.4.Nuclear Transfer
9.2.4.1.Definition
9.2.4.2.Market Estimation and Penetration, 2015 – 2022
9.2.4.3.Market Forecast, 2023 – 2031
9.2.4.4.Compound Annual Growth Rate (CAGR)
9.2.4.5.Regional Bifurcation
9.2.4.5.1.North America
9.2.4.5.1.1.Market Estimation, 2015 – 2022
9.2.4.5.1.2.Market Forecast, 2023 – 2031
9.2.4.5.2.Europe
9.2.4.5.2.1.Market Estimation, 2015 – 2022
9.2.4.5.2.2.Market Forecast, 2023 – 2031
9.2.4.5.3.Asia Pacific
9.2.4.5.3.1.Market Estimation, 2015 – 2022
9.2.4.5.3.2.Market Forecast, 2023 – 2031
9.2.4.5.4.Middle East and Africa
9.2.4.5.4.1.Market Estimation, 2015 – 2022
9.2.4.5.4.2.Market Forecast, 2023 – 2031
9.2.4.5.5.Latin America
9.2.4.5.5.1.Market Estimation, 2015 – 2022
9.2.4.5.5.2.Market Forecast, 2023 – 2031
9.2.5.Other technologies
9.2.5.1.Definition
9.2.5.2.Market Estimation and Penetration, 2015 – 2022
9.2.5.3.Market Forecast, 2023 – 2031
9.2.5.4.Compound Annual Growth Rate (CAGR)
9.2.5.5.Regional Bifurcation
9.2.5.5.1.North America
9.2.5.5.1.1.Market Estimation, 2015 – 2022
9.2.5.5.1.2.Market Forecast, 2023 – 2031
9.2.5.5.2.Europe
9.2.5.5.2.1.Market Estimation, 2015 – 2022
9.2.5.5.2.2.Market Forecast, 2023 – 2031
9.2.5.5.3.Asia Pacific
9.2.5.5.3.1.Market Estimation, 2015 – 2022
9.2.5.5.3.2.Market Forecast, 2023 – 2031
9.2.5.5.4.Middle East and Africa
9.2.5.5.4.1.Market Estimation, 2015 – 2022
9.2.5.5.4.2.Market Forecast, 2023 – 2031
9.2.5.5.5.Latin America
9.2.5.5.5.1.Market Estimation, 2015 – 2022
9.2.5.5.5.2.Market Forecast, 2023 – 2031
9.3.Key Segment for Channeling Investments
9.3.1.By Technology
10.Global Animal Model Market Analysis and Forecasts, 2023 – 2031
10.1.Overview
10.2.Global Animal Model Market Revenue (US$ Mn) and Forecasts, By Application
10.2.1.Drug Discovery and Development
10.2.1.1.Definition
10.2.1.2.Market Estimation and Penetration, 2015 – 2022
10.2.1.3.Market Forecast, 2023 – 2031
10.2.1.4.Compound Annual Growth Rate (CAGR)
10.2.1.5.Regional Bifurcation
10.2.1.5.1.North America
10.2.1.5.1.1.Market Estimation, 2015 – 2022
10.2.1.5.1.2.Market Forecast, 2023 – 2031
10.2.1.5.2.Europe
10.2.1.5.2.1.Market Estimation, 2015 – 2022
10.2.1.5.2.2.Market Forecast, 2023 – 2031
10.2.1.5.3.Asia Pacific
10.2.1.5.3.1.Market Estimation, 2015 – 2022
10.2.1.5.3.2.Market Forecast, 2023 – 2031
10.2.1.5.4.Middle East and Africa
10.2.1.5.4.1.Market Estimation, 2015 – 2022
10.2.1.5.4.2.Market Forecast, 2023 – 2031
10.2.1.5.5.Latin America
10.2.1.5.5.1.Market Estimation, 2015 – 2022
10.2.1.5.5.2.Market Forecast, 2023 – 2031
10.2.2.Basic Research
10.2.2.1.Definition
10.2.2.2.Market Estimation and Penetration, 2015 – 2022
10.2.2.3.Market Forecast, 2023 – 2031
10.2.2.4.Compound Annual Growth Rate (CAGR)
10.2.2.5.Regional Bifurcation
10.2.2.5.1.North America
10.2.2.5.1.1.Market Estimation, 2015 – 2022
10.2.2.5.1.2.Market Forecast, 2023 – 2031
10.2.2.5.2.Europe
10.2.2.5.2.1.Market Estimation, 2015 – 2022
10.2.2.5.2.2.Market Forecast, 2023 – 2031
10.2.2.5.3.Asia Pacific
10.2.2.5.3.1.Market Estimation, 2015 – 2022
10.2.2.5.3.2.Market Forecast, 2023 – 2031
10.2.2.5.4.Middle East and Africa
10.2.2.5.4.1.Market Estimation, 2015 – 2022
10.2.2.5.4.2.Market Forecast, 2023 – 2031
10.2.2.5.5.Latin America
10.2.2.5.5.1.Market Estimation, 2015 – 2022
10.2.2.5.5.2.Market Forecast, 2023 – 2031
10.2.3.Others
10.2.3.1.Definition
10.2.3.2.Market Estimation and Penetration, 2015 – 2022
10.2.3.3.Market Forecast, 2023 – 2031
10.2.3.4.Compound Annual Growth Rate (CAGR)
10.2.3.5.Regional Bifurcation
10.2.3.5.1.North America
10.2.3.5.1.1.Market Estimation, 2015 – 2022
10.2.3.5.1.2.Market Forecast, 2023 – 2031
10.2.3.5.2.Europe
10.2.3.5.2.1.Market Estimation, 2015 – 2022
10.2.3.5.2.2.Market Forecast, 2023 – 2031
10.2.3.5.3.Asia Pacific
10.2.3.5.3.1.Market Estimation, 2015 – 2022
10.2.3.5.3.2.Market Forecast, 2023 – 2031
10.2.3.5.4.Middle East and Africa
10.2.3.5.4.1.Market Estimation, 2015 – 2022
10.2.3.5.4.2.Market Forecast, 2023 – 2031
10.2.3.5.5.Latin America
10.2.3.5.5.1.Market Estimation, 2015 – 2022
10.2.3.5.5.2.Market Forecast, 2023 – 2031
10.3.Key Segment for Channeling Investments
10.3.1.By Application
11.Global Animal Model Market Analysis and Forecasts, 2023 – 2031
11.1.Overview
11.2.Global Animal Model Market Revenue (US$ Mn) and Forecasts, By End User
11.2.1.Pharma and Biotech Companies
11.2.1.1.Definition
11.2.1.2.Market Estimation and Penetration, 2015 – 2022
11.2.1.3.Market Forecast, 2023 – 2031
11.2.1.4.Compound Annual Growth Rate (CAGR)
11.2.1.5.Regional Bifurcation
11.2.1.5.1.North America
11.2.1.5.1.1.Market Estimation, 2015 – 2022
11.2.1.5.1.2.Market Forecast, 2023 – 2031
11.2.1.5.2.Europe
11.2.1.5.2.1.Market Estimation, 2015 – 2022
11.2.1.5.2.2.Market Forecast, 2023 – 2031
11.2.1.5.3.Asia Pacific
11.2.1.5.3.1.Market Estimation, 2015 – 2022
11.2.1.5.3.2.Market Forecast, 2023 – 2031
11.2.1.5.4.Middle East and Africa
11.2.1.5.4.1.Market Estimation, 2015 – 2022
11.2.1.5.4.2.Market Forecast, 2023 – 2031
11.2.1.5.5.Latin America
11.2.1.5.5.1.Market Estimation, 2015 – 2022
11.2.1.5.5.2.Market Forecast, 2023 – 2031
11.2.2.Academic Research Institutes
11.2.2.1.Definition
11.2.2.2.Market Estimation and Penetration, 2015 – 2022
11.2.2.3.Market Forecast, 2023 – 2031
11.2.2.4.Compound Annual Growth Rate (CAGR)
11.2.2.5.Regional Bifurcation
11.2.2.5.1.North America
11.2.2.5.1.1.Market Estimation, 2015 – 2022
11.2.2.5.1.2.Market Forecast, 2023 – 2031
11.2.2.5.2.Europe
11.2.2.5.2.1.Market Estimation, 2015 – 2022
11.2.2.5.2.2.Market Forecast, 2023 – 2031
11.2.2.5.3.Asia Pacific
11.2.2.5.3.1.Market Estimation, 2015 – 2022
11.2.2.5.3.2.Market Forecast, 2023 – 2031
11.2.2.5.4.Middle East and Africa
11.2.2.5.4.1.Market Estimation, 2015 – 2022
11.2.2.5.4.2.Market Forecast, 2023 – 2031
11.2.2.5.5.Latin America
11.2.2.5.5.1.Market Estimation, 2015 – 2022
11.2.2.5.5.2.Market Forecast, 2023 – 2031
11.2.3.CROs and CDMOs
11.2.3.1.Definition
11.2.3.2.Market Estimation and Penetration, 2015 – 2022
11.2.3.3.Market Forecast, 2023 – 2031
11.2.3.4.Compound Annual Growth Rate (CAGR)
11.2.3.5.Regional Bifurcation
11.2.3.5.1.North America
11.2.3.5.1.1.Market Estimation, 2015 – 2022
11.2.3.5.1.2.Market Forecast, 2023 – 2031
11.2.3.5.2.Europe
11.2.3.5.2.1.Market Estimation, 2015 – 2022
11.2.3.5.2.2.Market Forecast, 2023 – 2031
11.2.3.5.3.Asia Pacific
11.2.3.5.3.1.Market Estimation, 2015 – 2022
11.2.3.5.3.2.Market Forecast, 2023 – 2031
11.2.3.5.4.Middle East and Africa
11.2.3.5.4.1.Market Estimation, 2015 – 2022
11.2.3.5.4.2.Market Forecast, 2023 – 2031
11.2.3.5.5.Latin America
11.2.3.5.5.1.Market Estimation, 2015 – 2022
11.2.3.5.5.2.Market Forecast, 2023 – 2031
11.3.Key Segment for Channeling Investments
11.3.1.By End User
12.North America Animal Model Market Analysis and Forecasts, 2023 – 2031
12.1.Overview
12.1.1.North America Animal Model Market Revenue (US$ Mn)
12.2.North America Animal Model Market Revenue (US$ Mn) and Forecasts, By Animal Type
12.2.1.Mice
12.2.2.Rats
12.2.3.Fish
12.2.4.Birds
12.2.5.Cattle
12.2.6.Pigs
12.2.7.Amphibians
12.2.8.Guinea Pigs
12.2.9.Dogs
12.2.10.Cats
12.2.11.Rabbits
12.2.12.Monkeys
12.2.13.Sheep
12.2.14.Hamsters
12.2.15.Other animal types
12.3.North America Animal Model Market Revenue (US$ Mn) and Forecasts, By Technology
12.3.1.CRISPR
12.3.2.Microinjection
12.3.3.Embryonic Stem Cell Injection
12.3.4.Nuclear Transfer
12.3.5.Other technologies
12.4.North America Animal Model Market Revenue (US$ Mn) and Forecasts, By Application
12.4.1.Drug Discovery and Development
12.4.2.Basic Research
12.4.3.Others
12.5.North America Animal Model Market Revenue (US$ Mn) and Forecasts, By End User
12.5.1.Pharma and Biotech Companies
12.5.2.Academic Research Institutes
12.5.3.CROs and CDMOs
12.6.North America Animal Model Market Revenue (US$ Mn) and Forecasts, By Country
12.6.1.U.S
12.6.1.1.U.S Animal Model Market Revenue (US$ Mn) and Forecasts, By Animal Type
12.6.1.1.1.Mice
12.6.1.1.2.Rats
12.6.1.1.3.Fish
12.6.1.1.4.Birds
12.6.1.1.5.Cattle
12.6.1.1.6.Pigs
12.6.1.1.7.Amphibians
12.6.1.1.8.Guinea Pigs
12.6.1.1.9.Dogs
12.6.1.1.10.Cats
12.6.1.1.11.Rabbits
12.6.1.1.12.Monkeys
12.6.1.1.13.Sheep
12.6.1.1.14.Hamsters
12.6.1.1.15.Other animal types
12.6.1.2.U.S Animal Model Market Revenue (US$ Mn) and Forecasts, By Technology
12.6.1.2.1.CRISPR
12.6.1.2.2.Microinjection
12.6.1.2.3.Embryonic Stem Cell Injection
12.6.1.2.4.Nuclear Transfer
12.6.1.2.5.Other technologies
12.6.1.3.U.S Animal Model Market Revenue (US$ Mn) and Forecasts, By Application
12.6.1.3.1.Drug Discovery and Development
12.6.1.3.2.Basic Research
12.6.1.3.3.Others
12.6.1.4.U.S Animal Model Market Revenue (US$ Mn) and Forecasts, By End User
12.6.1.4.1.Pharma and Biotech Companies
12.6.1.4.2.Academic Research Institutes
12.6.1.4.3.CROs and CDMOs
12.6.2.Canada
12.6.2.1.Canada Animal Model Market Revenue (US$ Mn) and Forecasts, By Animal Type
12.6.2.1.1.Mice
12.6.2.1.2.Rats
12.6.2.1.3.Fish
12.6.2.1.4.Birds
12.6.2.1.5.Cattle
12.6.2.1.6.Pigs
12.6.2.1.7.Amphibians
12.6.2.1.8.Guinea Pigs
12.6.2.1.9.Dogs
12.6.2.1.10.Cats
12.6.2.1.11.Rabbits
12.6.2.1.12.Monkeys
12.6.2.1.13.Sheep
12.6.2.1.14.Hamsters
12.6.2.1.15.Other animal types
12.6.2.2.Canada Animal Model Market Revenue (US$ Mn) and Forecasts, By Technology
12.6.2.2.1.CRISPR
12.6.2.2.2.Microinjection
12.6.2.2.3.Embryonic Stem Cell Injection
12.6.2.2.4.Nuclear Transfer
12.6.2.2.5.Other technologies
12.6.2.3.Canada Animal Model Market Revenue (US$ Mn) and Forecasts, By Application
12.6.2.3.1.Drug Discovery and Development
12.6.2.3.2.Basic Research
12.6.2.3.3.Others
12.6.2.4.Canada Animal Model Market Revenue (US$ Mn) and Forecasts, By End User
12.6.2.4.1.Pharma and Biotech Companies
12.6.2.4.2.Academic Research Institutes
12.6.2.4.3.CROs and CDMOs
12.6.3.Mexico
12.6.3.1.Mexico Animal Model Market Revenue (US$ Mn) and Forecasts, By Animal Type
12.6.3.1.1.Mice
12.6.3.1.2.Rats
12.6.3.1.3.Fish
12.6.3.1.4.Birds
12.6.3.1.5.Cattle
12.6.3.1.6.Pigs
12.6.3.1.7.Amphibians
12.6.3.1.8.Guinea Pigs
12.6.3.1.9.Dogs
12.6.3.1.10.Cats
12.6.3.1.11.Rabbits
12.6.3.1.12.Monkeys
12.6.3.1.13.Sheep
12.6.3.1.14.Hamsters
12.6.3.1.15.Other animal types
12.6.3.2.Mexico Animal Model Market Revenue (US$ Mn) and Forecasts, By Technology
12.6.3.2.1.CRISPR
12.6.3.2.2.Microinjection
12.6.3.2.3.Embryonic Stem Cell Injection
12.6.3.2.4.Nuclear Transfer
12.6.3.2.5.Other technologies
12.6.3.3.Mexico Animal Model Market Revenue (US$ Mn) and Forecasts, By Application
12.6.3.3.1.Drug Discovery and Development
12.6.3.3.2.Basic Research
12.6.3.3.3.Others
12.6.3.4.Mexico Animal Model Market Revenue (US$ Mn) and Forecasts, By End User
12.6.3.4.1.Pharma and Biotech Companies
12.6.3.4.2.Academic Research Institutes
12.6.3.4.3.CROs and CDMOs
12.6.4.Rest of North America
12.6.4.1.Rest of North America Animal Model Market Revenue (US$ Mn) and Forecasts, By Animal Type
12.6.4.1.1.Mice
12.6.4.1.2.Rats
12.6.4.1.3.Fish
12.6.4.1.4.Birds
12.6.4.1.5.Cattle
12.6.4.1.6.Pigs
12.6.4.1.7.Amphibians
12.6.4.1.8.Guinea Pigs
12.6.4.1.9.Dogs
12.6.4.1.10.Cats
12.6.4.1.11.Rabbits
12.6.4.1.12.Monkeys
12.6.4.1.13.Sheep
12.6.4.1.14.Hamsters
12.6.4.1.15.Other animal types
12.6.4.2.Rest of North America Animal Model Market Revenue (US$ Mn) and Forecasts, By Technology
12.6.4.2.1.CRISPR
12.6.4.2.2.Microinjection
12.6.4.2.3.Embryonic Stem Cell Injection
12.6.4.2.4.Nuclear Transfer
12.6.4.2.5.Other technologies
12.6.4.3.Rest of North America Animal Model Market Revenue (US$ Mn) and Forecasts, By Application
12.6.4.3.1.Drug Discovery and Development
12.6.4.3.2.Basic Research
12.6.4.3.3.Others
12.6.4.4.Rest of North America Animal Model Market Revenue (US$ Mn) and Forecasts, By End User
12.6.4.4.1.Pharma and Biotech Companies
12.6.4.4.2.Academic Research Institutes
12.6.4.4.3.CROs and CDMOs
12.7.Key Segment for Channeling Investments
12.7.1.By Country
12.7.2.By Animal Type
12.7.3.By Technology
12.7.4.By Application
12.7.5.By End User
13.Europe Animal Model Market Analysis and Forecasts, 2023 – 2031
13.1.Overview
13.1.1.Europe Animal Model Market Revenue (US$ Mn)
13.2.Europe Animal Model Market Revenue (US$ Mn) and Forecasts, By Animal Type
13.2.1.Mice
13.2.2.Rats
13.2.3.Fish
13.2.4.Birds
13.2.5.Cattle
13.2.6.Pigs
13.2.7.Amphibians
13.2.8.Guinea Pigs
13.2.9.Dogs
13.2.10.Cats
13.2.11.Rabbits
13.2.12.Monkeys
13.2.13.Sheep
13.2.14.Hamsters
13.2.15.Other animal types
13.3.Europe Animal Model Market Revenue (US$ Mn) and Forecasts, By Technology
13.3.1.CRISPR
13.3.2.Microinjection
13.3.3.Embryonic Stem Cell Injection
13.3.4.Nuclear Transfer
13.3.5.Other technologies
13.4.Europe Animal Model Market Revenue (US$ Mn) and Forecasts, By Application
13.4.1.Drug Discovery and Development
13.4.2.Basic Research
13.4.3.Others
13.5.Europe Animal Model Market Revenue (US$ Mn) and Forecasts, By End User
13.5.1.Pharma and Biotech Companies
13.5.2.Academic Research Institutes
13.5.3.CROs and CDMOs
13.6.Europe Animal Model Market Revenue (US$ Mn) and Forecasts, By Country
13.6.1.France
13.6.1.1.France Animal Model Market Revenue (US$ Mn) and Forecasts, By Animal Type
13.6.1.1.1.Mice
13.6.1.1.2.Rats
13.6.1.1.3.Fish
13.6.1.1.4.Birds
13.6.1.1.5.Cattle
13.6.1.1.6.Pigs
13.6.1.1.7.Amphibians
13.6.1.1.8.Guinea Pigs
13.6.1.1.9.Dogs
13.6.1.1.10.Cats
13.6.1.1.11.Rabbits
13.6.1.1.12.Monkeys
13.6.1.1.13.Sheep
13.6.1.1.14.Hamsters
13.6.1.1.15.Other animal types
13.6.1.2.France Animal Model Market Revenue (US$ Mn) and Forecasts, By Technology
13.6.1.2.1.CRISPR
13.6.1.2.2.Microinjection
13.6.1.2.3.Embryonic Stem Cell Injection
13.6.1.2.4.Nuclear Transfer
13.6.1.2.5.Other technologies
13.6.1.3.France Animal Model Market Revenue (US$ Mn) and Forecasts, By Application
13.6.1.3.1.Drug Discovery and Development
13.6.1.3.2.Basic Research
13.6.1.3.3.Others
13.6.1.4.France Animal Model Market Revenue (US$ Mn) and Forecasts, By End User
13.6.1.4.1.Pharma and Biotech Companies
13.6.1.4.2.Academic Research Institutes
13.6.1.4.3.CROs and CDMOs
13.6.2.The UK
13.6.2.1.The UK Animal Model Market Revenue (US$ Mn) and Forecasts, By Animal Type
13.6.2.1.1.Mice
13.6.2.1.2.Rats
13.6.2.1.3.Fish
13.6.2.1.4.Birds
13.6.2.1.5.Cattle
13.6.2.1.6.Pigs
13.6.2.1.7.Amphibians
13.6.2.1.8.Guinea Pigs
13.6.2.1.9.Dogs
13.6.2.1.10.Cats
13.6.2.1.11.Rabbits
13.6.2.1.12.Monkeys
13.6.2.1.13.Sheep
13.6.2.1.14.Hamsters
13.6.2.1.15.Other animal types
13.6.2.2.The UK Animal Model Market Revenue (US$ Mn) and Forecasts, By Technology
13.6.2.2.1.CRISPR
13.6.2.2.2.Microinjection
13.6.2.2.3.Embryonic Stem Cell Injection
13.6.2.2.4.Nuclear Transfer
13.6.2.2.5.Other technologies
13.6.2.3.The UK Animal Model Market Revenue (US$ Mn) and Forecasts, By Application
13.6.2.3.1.Drug Discovery and Development
13.6.2.3.2.Basic Research
13.6.2.3.3.Others
13.6.2.4.The UK Animal Model Market Revenue (US$ Mn) and Forecasts, By End User
13.6.2.4.1.Pharma and Biotech Companies
13.6.2.4.2.Academic Research Institutes
13.6.2.4.3.CROs and CDMOs
13.6.3.Spain
13.6.3.1.Spain Animal Model Market Revenue (US$ Mn) and Forecasts, By Animal Type
13.6.3.1.1.Mice
13.6.3.1.2.Rats
13.6.3.1.3.Fish
13.6.3.1.4.Birds
13.6.3.1.5.Cattle
13.6.3.1.6.Pigs
13.6.3.1.7.Amphibians
13.6.3.1.8.Guinea Pigs
13.6.3.1.9.Dogs
13.6.3.1.10.Cats
13.6.3.1.11.Rabbits
13.6.3.1.12.Monkeys
13.6.3.1.13.Sheep
13.6.3.1.14.Hamsters
13.6.3.1.15.Other animal types
13.6.3.2.Spain Animal Model Market Revenue (US$ Mn) and Forecasts, By Technology
13.6.3.2.1.CRISPR
13.6.3.2.2.Microinjection
13.6.3.2.3.Embryonic Stem Cell Injection
13.6.3.2.4.Nuclear Transfer
13.6.3.2.5.Other technologies
13.6.3.3.Spain Animal Model Market Revenue (US$ Mn) and Forecasts, By Application
13.6.3.3.1.Drug Discovery and Development
13.6.3.3.2.Basic Research
13.6.3.3.3.Others
13.6.3.4.Spain Animal Model Market Revenue (US$ Mn) and Forecasts, By End User
13.6.3.4.1.Pharma and Biotech Companies
13.6.3.4.2.Academic Research Institutes
13.6.3.4.3.CROs and CDMOs
13.6.4.Germany
13.6.4.1.Germany Animal Model Market Revenue (US$ Mn) and Forecasts, By Animal Type
13.6.4.1.1.Mice
13.6.4.1.2.Rats
13.6.4.1.3.Fish
13.6.4.1.4.Birds
13.6.4.1.5.Cattle
13.6.4.1.6.Pigs
13.6.4.1.7.Amphibians
13.6.4.1.8.Guinea Pigs
13.6.4.1.9.Dogs
13.6.4.1.10.Cats
13.6.4.1.11.Rabbits
13.6.4.1.12.Monkeys
13.6.4.1.13.Sheep
13.6.4.1.14.Hamsters
13.6.4.1.15.Other animal types
13.6.4.2.Germany Animal Model Market Revenue (US$ Mn) and Forecasts, By Technology
13.6.4.2.1.CRISPR
13.6.4.2.2.Microinjection
13.6.4.2.3.Embryonic Stem Cell Injection
13.6.4.2.4.Nuclear Transfer
13.6.4.2.5.Other technologies
13.6.4.3.Germany Animal Model Market Revenue (US$ Mn) and Forecasts, By Application
13.6.4.3.1.Drug Discovery and Development
13.6.4.3.2.Basic Research
13.6.4.3.3.Others
13.6.4.4.Germany Animal Model Market Revenue (US$ Mn) and Forecasts, By End User
13.6.4.4.1.Pharma and Biotech Companies
13.6.4.4.2.Academic Research Institutes
13.6.4.4.3.CROs and CDMOs
13.6.5.Italy
13.6.5.1.Italy Animal Model Market Revenue (US$ Mn) and Forecasts, By Animal Type
13.6.5.1.1.Mice
13.6.5.1.2.Rats
13.6.5.1.3.Fish
13.6.5.1.4.Birds
13.6.5.1.5.Cattle
13.6.5.1.6.Pigs
13.6.5.1.7.Amphibians
13.6.5.1.8.Guinea Pigs
13.6.5.1.9.Dogs
13.6.5.1.10.Cats
13.6.5.1.11.Rabbits
13.6.5.1.12.Monkeys
13.6.5.1.13.Sheep
13.6.5.1.14.Hamsters
13.6.5.1.15.Other animal types
13.6.5.2.Italy Animal Model Market Revenue (US$ Mn) and Forecasts, By Technology
13.6.5.2.1.CRISPR
13.6.5.2.2.Microinjection
13.6.5.2.3.Embryonic Stem Cell Injection
13.6.5.2.4.Nuclear Transfer
13.6.5.2.5.Other technologies
13.6.5.3.Italy Animal Model Market Revenue (US$ Mn) and Forecasts, By Application
13.6.5.3.1.Drug Discovery and Development
13.6.5.3.2.Basic Research
13.6.5.3.3.Others
13.6.5.4.Italy Animal Model Market Revenue (US$ Mn) and Forecasts, By End User
13.6.5.4.1.Pharma and Biotech Companies
13.6.5.4.2.Academic Research Institutes
13.6.5.4.3.CROs and CDMOs
13.6.6.Nordic Countries
13.6.6.1.Nordic Countries Animal Model Market Revenue (US$ Mn) and Forecasts, By Animal Type
13.6.6.1.1.Mice
13.6.6.1.2.Rats
13.6.6.1.3.Fish
13.6.6.1.4.Birds
13.6.6.1.5.Cattle
13.6.6.1.6.Pigs
13.6.6.1.7.Amphibians
13.6.6.1.8.Guinea Pigs
13.6.6.1.9.Dogs
13.6.6.1.10.Cats
13.6.6.1.11.Rabbits
13.6.6.1.12.Monkeys
13.6.6.1.13.Sheep
13.6.6.1.14.Hamsters
13.6.6.1.15.Other animal types
13.6.6.2.Nordic Countries Animal Model Market Revenue (US$ Mn) and Forecasts, By Technology
13.6.6.2.1.CRISPR
13.6.6.2.2.Microinjection
13.6.6.2.3.Embryonic Stem Cell Injection
13.6.6.2.4.Nuclear Transfer
13.6.6.2.5.Other technologies
13.6.6.3.Nordic Countries Animal Model Market Revenue (US$ Mn) and Forecasts, By Application
13.6.6.3.1.Drug Discovery and Development
13.6.6.3.2.Basic Research
13.6.6.3.3.Others
13.6.6.4.Nordic Countries Animal Model Market Revenue (US$ Mn) and Forecasts, By End User
13.6.6.4.1.Pharma and Biotech Companies
13.6.6.4.2.Academic Research Institutes
13.6.6.4.3.CROs and CDMOs
13.6.6.5.Nordic Countries Animal Model Market Revenue (US$ Mn) and Forecasts, By Country
13.6.6.5.1.Denmark
13.6.6.5.2.Finland
13.6.6.5.3.Iceland
13.6.6.5.4.Sweden
13.6.6.5.5.Norway
13.6.7.Benelux Union
13.6.7.1.Benelux Union Animal Model Market Revenue (US$ Mn) and Forecasts, By Animal Type
13.6.7.1.1.Mice
13.6.7.1.2.Rats
13.6.7.1.3.Fish
13.6.7.1.4.Birds
13.6.7.1.5.Cattle
13.6.7.1.6.Pigs
13.6.7.1.7.Amphibians
13.6.7.1.8.Guinea Pigs
13.6.7.1.9.Dogs
13.6.7.1.10.Cats
13.6.7.1.11.Rabbits
13.6.7.1.12.Monkeys
13.6.7.1.13.Sheep
13.6.7.1.14.Hamsters
13.6.7.1.15.Other animal types
13.6.7.2.Benelux Union Animal Model Market Revenue (US$ Mn) and Forecasts, By Technology
13.6.7.2.1.CRISPR
13.6.7.2.2.Microinjection
13.6.7.2.3.Embryonic Stem Cell Injection
13.6.7.2.4.Nuclear Transfer
13.6.7.2.5.Other technologies
13.6.7.3.Benelux Union Animal Model Market Revenue (US$ Mn) and Forecasts, By Application
13.6.7.3.1.Drug Discovery and Development
13.6.7.3.2.Basic Research
13.6.7.3.3.Others
13.6.7.4.Benelux Union Animal Model Market Revenue (US$ Mn) and Forecasts, By End User
13.6.7.4.1.Pharma and Biotech Companies
13.6.7.4.2.Academic Research Institutes
13.6.7.4.3.CROs and CDMOs
13.6.7.5.Benelux Union Animal Model Market Revenue (US$ Mn) and Forecasts, By Country
13.6.7.5.1.Belgium
13.6.7.5.2.The Netherlands
13.6.7.5.3.Luxembourg
13.6.8.Rest of Europe
13.6.8.1.Rest of Europe Animal Model Market Revenue (US$ Mn) and Forecasts, By Animal Type
13.6.8.1.1.Mice
13.6.8.1.2.Rats
13.6.8.1.3.Fish
13.6.8.1.4.Birds
13.6.8.1.5.Cattle
13.6.8.1.6.Pigs
13.6.8.1.7.Amphibians
13.6.8.1.8.Guinea Pigs
13.6.8.1.9.Dogs
13.6.8.1.10.Cats
13.6.8.1.11.Rabbits
13.6.8.1.12.Monkeys
13.6.8.1.13.Sheep
13.6.8.1.14.Hamsters
13.6.8.1.15.Other animal types
13.6.8.2.Rest of Europe Animal Model Market Revenue (US$ Mn) and Forecasts, By Technology
13.6.8.2.1.CRISPR
13.6.8.2.2.Microinjection
13.6.8.2.3.Embryonic Stem Cell Injection
13.6.8.2.4.Nuclear Transfer
13.6.8.2.5.Other technologies
13.6.8.3.Rest of Europe Animal Model Market Revenue (US$ Mn) and Forecasts, By Application
13.6.8.3.1.Drug Discovery and Development
13.6.8.3.2.Basic Research
13.6.8.3.3.Others
13.6.8.4.Rest of Europe Animal Model Market Revenue (US$ Mn) and Forecasts, By End User
13.6.8.4.1.Pharma and Biotech Companies
13.6.8.4.2.Academic Research Institutes
13.6.8.4.3.CROs and CDMOs
13.7.Key Segment for Channeling Investments
13.7.1.By Country
13.7.2.By Animal Type
13.7.3.By Technology
13.7.4.By Application
13.7.5.By End User
14.Asia Pacific Animal Model Market Analysis and Forecasts, 2023 – 2031
14.1.Overview
14.1.1.Asia Pacific Animal Model Market Revenue (US$ Mn)
14.2.Asia Pacific Animal Model Market Revenue (US$ Mn) and Forecasts, By Animal Type
14.2.1.Mice
14.2.2.Rats
14.2.3.Fish
14.2.4.Birds
14.2.5.Cattle
14.2.6.Pigs
14.2.7.Amphibians
14.2.8.Guinea Pigs
14.2.9.Dogs
14.2.10.Cats
14.2.11.Rabbits
14.2.12.Monkeys
14.2.13.Sheep
14.2.14.Hamsters
14.2.15.Other animal types
14.3.Asia Pacific Animal Model Market Revenue (US$ Mn) and Forecasts, By Technology
14.3.1.CRISPR
14.3.2.Microinjection
14.3.3.Embryonic Stem Cell Injection
14.3.4.Nuclear Transfer
14.3.5.Other technologies
14.4.Asia Pacific Animal Model Market Revenue (US$ Mn) and Forecasts, By Application
14.4.1.Drug Discovery and Development
14.4.2.Basic Research
14.4.3.Others
14.5.Asia Pacific Animal Model Market Revenue (US$ Mn) and Forecasts, By End User
14.5.1.Pharma and Biotech Companies
14.5.2.Academic Research Institutes
14.5.3.CROs and CDMOs
14.6.Asia Pacific Animal Model Market Revenue (US$ Mn) and Forecasts, By Country
14.6.1.China
14.6.1.1.China Animal Model Market Revenue (US$ Mn) and Forecasts, By Animal Type
14.6.1.1.1.Mice
14.6.1.1.2.Rats
14.6.1.1.3.Fish
14.6.1.1.4.Birds
14.6.1.1.5.Cattle
14.6.1.1.6.Pigs
14.6.1.1.7.Amphibians
14.6.1.1.8.Guinea Pigs
14.6.1.1.9.Dogs
14.6.1.1.10.Cats
14.6.1.1.11.Rabbits
14.6.1.1.12.Monkeys
14.6.1.1.13.Sheep
14.6.1.1.14.Hamsters
14.6.1.1.15.Other animal types
14.6.1.2.China Animal Model Market Revenue (US$ Mn) and Forecasts, By Technology
14.6.1.2.1.CRISPR
14.6.1.2.2.Microinjection
14.6.1.2.3.Embryonic Stem Cell Injection
14.6.1.2.4.Nuclear Transfer
14.6.1.2.5.Other technologies
14.6.1.3.China Animal Model Market Revenue (US$ Mn) and Forecasts, By Application
14.6.1.3.1.Drug Discovery and Development
14.6.1.3.2.Basic Research
14.6.1.3.3.Others
14.6.1.4.China Animal Model Market Revenue (US$ Mn) and Forecasts, By End User
14.6.1.4.1.Pharma and Biotech Companies
14.6.1.4.2.Academic Research Institutes
14.6.1.4.3.CROs and CDMOs
14.6.2.Japan
14.6.2.1.Japan Animal Model Market Revenue (US$ Mn) and Forecasts, By Animal Type
14.6.2.1.1.Mice
14.6.2.1.2.Rats
14.6.2.1.3.Fish
14.6.2.1.4.Birds
14.6.2.1.5.Cattle
14.6.2.1.6.Pigs
14.6.2.1.7.Amphibians
14.6.2.1.8.Guinea Pigs
14.6.2.1.9.Dogs
14.6.2.1.10.Cats
14.6.2.1.11.Rabbits
14.6.2.1.12.Monkeys
14.6.2.1.13.Sheep
14.6.2.1.14.Hamsters
14.6.2.1.15.Other animal types
14.6.2.2.Japan Animal Model Market Revenue (US$ Mn) and Forecasts, By Technology
14.6.2.2.1.CRISPR
14.6.2.2.2.Microinjection
14.6.2.2.3.Embryonic Stem Cell Injection
14.6.2.2.4.Nuclear Transfer
14.6.2.2.5.Other technologies
14.6.2.3.Japan Animal Model Market Revenue (US$ Mn) and Forecasts, By Application
14.6.2.3.1.Drug Discovery and Development
14.6.2.3.2.Basic Research
14.6.2.3.3.Others
14.6.2.4.Japan Animal Model Market Revenue (US$ Mn) and Forecasts, By End User
14.6.2.4.1.Pharma and Biotech Companies
14.6.2.4.2.Academic Research Institutes
14.6.2.4.3.CROs and CDMOs
14.6.3.India
14.6.3.1.India Animal Model Market Revenue (US$ Mn) and Forecasts, By Animal Type
14.6.3.1.1.Mice
14.6.3.1.2.Rats
14.6.3.1.3.Fish
14.6.3.1.4.Birds
14.6.3.1.5.Cattle
14.6.3.1.6.Pigs
14.6.3.1.7.Amphibians
14.6.3.1.8.Guinea Pigs
14.6.3.1.9.Dogs
14.6.3.1.10.Cats
14.6.3.1.11.Rabbits
14.6.3.1.12.Monkeys
14.6.3.1.13.Sheep
14.6.3.1.14.Hamsters
14.6.3.1.15.Other animal types
14.6.3.2.India Animal Model Market Revenue (US$ Mn) and Forecasts, By Technology
14.6.3.2.1.CRISPR
14.6.3.2.2.Microinjection
14.6.3.2.3.Embryonic Stem Cell Injection
14.6.3.2.4.Nuclear Transfer
14.6.3.2.5.Other technologies
14.6.3.3.India Animal Model Market Revenue (US$ Mn) and Forecasts, By Application
14.6.3.3.1.Drug Discovery and Development
14.6.3.3.2.Basic Research
14.6.3.3.3.Others
14.6.3.4.India Animal Model Market Revenue (US$ Mn) and Forecasts, By End User
14.6.3.4.1.Pharma and Biotech Companies
14.6.3.4.2.Academic Research Institutes
14.6.3.4.3.CROs and CDMOs
14.6.4.New Zealand
14.6.4.1.New Zealand Animal Model Market Revenue (US$ Mn) and Forecasts, By Animal Type
14.6.4.1.1.Mice
14.6.4.1.2.Rats
14.6.4.1.3.Fish
14.6.4.1.4.Birds
14.6.4.1.5.Cattle
14.6.4.1.6.Pigs
14.6.4.1.7.Amphibians
14.6.4.1.8.Guinea Pigs
14.6.4.1.9.Dogs
14.6.4.1.10.Cats
14.6.4.1.11.Rabbits
14.6.4.1.12.Monkeys
14.6.4.1.13.Sheep
14.6.4.1.14.Hamsters
14.6.4.1.15.Other animal types
14.6.4.2.New Zealand Animal Model Market Revenue (US$ Mn) and Forecasts, By Technology
14.6.4.2.1.CRISPR
14.6.4.2.2.Microinjection
14.6.4.2.3.Embryonic Stem Cell Injection
14.6.4.2.4.Nuclear Transfer
14.6.4.2.5.Other technologies
14.6.4.3.New Zealand Animal Model Market Revenue (US$ Mn) and Forecasts, By Application
14.6.4.3.1.Drug Discovery and Development
14.6.4.3.2.Basic Research
14.6.4.3.3.Others
14.6.4.4.New Zealand Animal Model Market Revenue (US$ Mn) and Forecasts, By End User
14.6.4.4.1.Pharma and Biotech Companies
14.6.4.4.2.Academic Research Institutes
14.6.4.4.3.CROs and CDMOs
14.6.5.Australia
14.6.5.1.Australia Animal Model Market Revenue (US$ Mn) and Forecasts, By Animal Type
14.6.5.1.1.Mice
14.6.5.1.2.Rats
14.6.5.1.3.Fish
14.6.5.1.4.Birds
14.6.5.1.5.Cattle
14.6.5.1.6.Pigs
14.6.5.1.7.Amphibians
14.6.5.1.8.Guinea Pigs
14.6.5.1.9.Dogs
14.6.5.1.10.Cats
14.6.5.1.11.Rabbits
14.6.5.1.12.Monkeys
14.6.5.1.13.Sheep
14.6.5.1.14.Hamsters
14.6.5.1.15.Other animal types
14.6.5.2.Australia Animal Model Market Revenue (US$ Mn) and Forecasts, By Technology
14.6.5.2.1.CRISPR
14.6.5.2.2.Microinjection
14.6.5.2.3.Embryonic Stem Cell Injection
14.6.5.2.4.Nuclear Transfer
14.6.5.2.5.Other technologies
14.6.5.3.Australia Animal Model Market Revenue (US$ Mn) and Forecasts, By Application
14.6.5.3.1.Drug Discovery and Development
14.6.5.3.2.Basic Research
14.6.5.3.3.Others
14.6.5.4.Australia Animal Model Market Revenue (US$ Mn) and Forecasts, By End User
14.6.5.4.1.Pharma and Biotech Companies
14.6.5.4.2.Academic Research Institutes
14.6.5.4.3.CROs and CDMOs
14.6.6.South Korea
14.6.6.1.South Korea Animal Model Market Revenue (US$ Mn) and Forecasts, By Animal Type
14.6.6.1.1.Mice
14.6.6.1.2.Rats
14.6.6.1.3.Fish
14.6.6.1.4.Birds
14.6.6.1.5.Cattle
14.6.6.1.6.Pigs
14.6.6.1.7.Amphibians
14.6.6.1.8.Guinea Pigs
14.6.6.1.9.Dogs
14.6.6.1.10.Cats
14.6.6.1.11.Rabbits
14.6.6.1.12.Monkeys
14.6.6.1.13.Sheep
14.6.6.1.14.Hamsters
14.6.6.1.15.Other animal types
14.6.6.2.South Korea Animal Model Market Revenue (US$ Mn) and Forecasts, By Technology
14.6.6.2.1.CRISPR
14.6.6.2.2.Microinjection
14.6.6.2.3.Embryonic Stem Cell Injection
14.6.6.2.4.Nuclear Transfer
14.6.6.2.5.Other technologies
14.6.6.3.South Korea Animal Model Market Revenue (US$ Mn) and Forecasts, By Application
14.6.6.3.1.Drug Discovery and Development
14.6.6.3.2.Basic Research
14.6.6.3.3.Others
14.6.6.4.South Korea Animal Model Market Revenue (US$ Mn) and Forecasts, By End User
14.6.6.4.1.Pharma and Biotech Companies
14.6.6.4.2.Academic Research Institutes
14.6.6.4.3.CROs and CDMOs
14.6.7.Southeast Asia
14.6.7.1.Southeast Asia Animal Model Market Revenue (US$ Mn) and Forecasts, By Animal Type
14.6.7.1.1.Mice
14.6.7.1.2.Rats
14.6.7.1.3.Fish
14.6.7.1.4.Birds
14.6.7.1.5.Cattle
14.6.7.1.6.Pigs
14.6.7.1.7.Amphibians
14.6.7.1.8.Guinea Pigs
14.6.7.1.9.Dogs
14.6.7.1.10.Cats
14.6.7.1.11.Rabbits
14.6.7.1.12.Monkeys
14.6.7.1.13.Sheep
14.6.7.1.14.Hamsters
14.6.7.1.15.Other animal types
14.6.7.2.Southeast Asia Animal Model Market Revenue (US$ Mn) and Forecasts, By Technology
14.6.7.2.1.CRISPR
14.6.7.2.2.Microinjection
14.6.7.2.3.Embryonic Stem Cell Injection
14.6.7.2.4.Nuclear Transfer
14.6.7.2.5.Other technologies
14.6.7.3.Southeast Asia Animal Model Market Revenue (US$ Mn) and Forecasts, By Application
14.6.7.3.1.Drug Discovery and Development
14.6.7.3.2.Basic Research
14.6.7.3.3.Others
14.6.7.4.Southeast Asia Animal Model Market Revenue (US$ Mn) and Forecasts, By End User
14.6.7.4.1.Pharma and Biotech Companies
14.6.7.4.2.Academic Research Institutes
14.6.7.4.3.CROs and CDMOs
14.6.7.5.Southeast Asia Animal Model Market Revenue (US$ Mn) and Forecasts, By Country
14.6.7.5.1.Indonesia
14.6.7.5.2.Thailand
14.6.7.5.3.Malaysia
14.6.7.5.4.Singapore
14.6.7.5.5.Rest of Southeast Asia
14.6.8.Rest of Asia Pacific
14.6.8.1.Rest of Asia Pacific Animal Model Market Revenue (US$ Mn) and Forecasts, By Animal Type
14.6.8.1.1.Mice
14.6.8.1.2.Rats
14.6.8.1.3.Fish
14.6.8.1.4.Birds
14.6.8.1.5.Cattle
14.6.8.1.6.Pigs
14.6.8.1.7.Amphibians
14.6.8.1.8.Guinea Pigs
14.6.8.1.9.Dogs
14.6.8.1.10.Cats
14.6.8.1.11.Rabbits
14.6.8.1.12.Monkeys
14.6.8.1.13.Sheep
14.6.8.1.14.Hamsters
14.6.8.1.15.Other animal types
14.6.8.2.Rest of Asia Pacific Animal Model Market Revenue (US$ Mn) and Forecasts, By Technology
14.6.8.2.1.CRISPR
14.6.8.2.2.Microinjection
14.6.8.2.3.Embryonic Stem Cell Injection
14.6.8.2.4.Nuclear Transfer
14.6.8.2.5.Other technologies
14.6.8.3.Rest of Asia Pacific Animal Model Market Revenue (US$ Mn) and Forecasts, By Application
14.6.8.3.1.Drug Discovery and Development
14.6.8.3.2.Basic Research
14.6.8.3.3.Others
14.6.8.4.Rest of Asia Pacific Animal Model Market Revenue (US$ Mn) and Forecasts, By End User
14.6.8.4.1.Pharma and Biotech Companies
14.6.8.4.2.Academic Research Institutes
14.6.8.4.3.CROs and CDMOs
14.7.Key Segment for Channeling Investments
14.7.1.By Country
14.7.2.By Animal Type
14.7.3.By Technology
14.7.4.By Application
14.7.5.By End User
15.Middle East and Africa Animal Model Market Analysis and Forecasts, 2023 – 2031
15.1.Overview
15.1.1.Middle East and Africa Animal Model Market Revenue (US$ Mn)
15.2.Middle East and Africa Animal Model Market Revenue (US$ Mn) and Forecasts, By Animal Type
15.2.1.Mice
15.2.2.Rats
15.2.3.Fish
15.2.4.Birds
15.2.5.Cattle
15.2.6.Pigs
15.2.7.Amphibians
15.2.8.Guinea Pigs
15.2.9.Dogs
15.2.10.Cats
15.2.11.Rabbits
15.2.12.Monkeys
15.2.13.Sheep
15.2.14.Hamsters
15.2.15.Other animal types
15.3.Middle East and Africa Animal Model Market Revenue (US$ Mn) and Forecasts, By Technology
15.3.1.CRISPR
15.3.2.Microinjection
15.3.3.Embryonic Stem Cell Injection
15.3.4.Nuclear Transfer
15.3.5.Other technologies
15.4.Middle East and Africa Animal Model Market Revenue (US$ Mn) and Forecasts, By Application
15.4.1.Drug Discovery and Development
15.4.2.Basic Research
15.4.3.Others
15.5.Middle East and Africa Animal Model Market Revenue (US$ Mn) and Forecasts, By End User
15.5.1.Pharma and Biotech Companies
15.5.2.Academic Research Institutes
15.5.3.CROs and CDMOs
15.6.Middle East and Africa Animal Model Market Revenue (US$ Mn) and Forecasts, By Country
15.6.1.Saudi Arabia
15.6.1.1.Saudi Arabia Animal Model Market Revenue (US$ Mn) and Forecasts, By Animal Type
15.6.1.1.1.Mice
15.6.1.1.2.Rats
15.6.1.1.3.Fish
15.6.1.1.4.Birds
15.6.1.1.5.Cattle
15.6.1.1.6.Pigs
15.6.1.1.7.Amphibians
15.6.1.1.8.Guinea Pigs
15.6.1.1.9.Dogs
15.6.1.1.10.Cats
15.6.1.1.11.Rabbits
15.6.1.1.12.Monkeys
15.6.1.1.13.Sheep
15.6.1.1.14.Hamsters
15.6.1.1.15.Other animal types
15.6.1.2.Saudi Arabia Animal Model Market Revenue (US$ Mn) and Forecasts, By Technology
15.6.1.2.1.CRISPR
15.6.1.2.2.Microinjection
15.6.1.2.3.Embryonic Stem Cell Injection
15.6.1.2.4.Nuclear Transfer
15.6.1.2.5.Other technologies
15.6.1.3.Saudi Arabia Animal Model Market Revenue (US$ Mn) and Forecasts, By Application
15.6.1.3.1.Drug Discovery and Development
15.6.1.3.2.Basic Research
15.6.1.3.3.Others
15.6.1.4.Saudi Arabia Animal Model Market Revenue (US$ Mn) and Forecasts, By End User
15.6.1.4.1.Pharma and Biotech Companies
15.6.1.4.2.Academic Research Institutes
15.6.1.4.3.CROs and CDMOs
15.6.2.UAE
15.6.2.1.UAE Animal Model Market Revenue (US$ Mn) and Forecasts, By Animal Type
15.6.2.1.1.Mice
15.6.2.1.2.Rats
15.6.2.1.3.Fish
15.6.2.1.4.Birds
15.6.2.1.5.Cattle
15.6.2.1.6.Pigs
15.6.2.1.7.Amphibians
15.6.2.1.8.Guinea Pigs
15.6.2.1.9.Dogs
15.6.2.1.10.Cats
15.6.2.1.11.Rabbits
15.6.2.1.12.Monkeys
15.6.2.1.13.Sheep
15.6.2.1.14.Hamsters
15.6.2.1.15.Other animal types
15.6.2.2.UAE Animal Model Market Revenue (US$ Mn) and Forecasts, By Technology
15.6.2.2.1.CRISPR
15.6.2.2.2.Microinjection
15.6.2.2.3.Embryonic Stem Cell Injection
15.6.2.2.4.Nuclear Transfer
15.6.2.2.5.Other technologies
15.6.2.3.UAE Animal Model Market Revenue (US$ Mn) and Forecasts, By Application
15.6.2.3.1.Drug Discovery and Development
15.6.2.3.2.Basic Research
15.6.2.3.3.Others
15.6.2.4.UAE Animal Model Market Revenue (US$ Mn) and Forecasts, By End User
15.6.2.4.1.Pharma and Biotech Companies
15.6.2.4.2.Academic Research Institutes
15.6.2.4.3.CROs and CDMOs
15.6.3.Egypt
15.6.3.1.Egypt Animal Model Market Revenue (US$ Mn) and Forecasts, By Animal Type
15.6.3.1.1.Mice
15.6.3.1.2.Rats
15.6.3.1.3.Fish
15.6.3.1.4.Birds
15.6.3.1.5.Cattle
15.6.3.1.6.Pigs
15.6.3.1.7.Amphibians
15.6.3.1.8.Guinea Pigs
15.6.3.1.9.Dogs
15.6.3.1.10.Cats
15.6.3.1.11.Rabbits
15.6.3.1.12.Monkeys
15.6.3.1.13.Sheep
15.6.3.1.14.Hamsters
15.6.3.1.15.Other animal types
15.6.3.2.Egypt Animal Model Market Revenue (US$ Mn) and Forecasts, By Technology
15.6.3.2.1.CRISPR
15.6.3.2.2.Microinjection
15.6.3.2.3.Embryonic Stem Cell Injection
15.6.3.2.4.Nuclear Transfer
15.6.3.2.5.Other technologies
15.6.3.3.Egypt Animal Model Market Revenue (US$ Mn) and Forecasts, By Application
15.6.3.3.1.Drug Discovery and Development
15.6.3.3.2.Basic Research
15.6.3.3.3.Others
15.6.3.4.Egypt Animal Model Market Revenue (US$ Mn) and Forecasts, By End User
15.6.3.4.1.Pharma and Biotech Companies
15.6.3.4.2.Academic Research Institutes
15.6.3.4.3.CROs and CDMOs
15.6.4.Kuwait
15.6.4.1.Kuwait Animal Model Market Revenue (US$ Mn) and Forecasts, By Animal Type
15.6.4.1.1.Mice
15.6.4.1.2.Rats
15.6.4.1.3.Fish
15.6.4.1.4.Birds
15.6.4.1.5.Cattle
15.6.4.1.6.Pigs
15.6.4.1.7.Amphibians
15.6.4.1.8.Guinea Pigs
15.6.4.1.9.Dogs
15.6.4.1.10.Cats
15.6.4.1.11.Rabbits
15.6.4.1.12.Monkeys
15.6.4.1.13.Sheep
15.6.4.1.14.Hamsters
15.6.4.1.15.Other animal types
15.6.4.2.Kuwait Animal Model Market Revenue (US$ Mn) and Forecasts, By Technology
15.6.4.2.1.CRISPR
15.6.4.2.2.Microinjection
15.6.4.2.3.Embryonic Stem Cell Injection
15.6.4.2.4.Nuclear Transfer
15.6.4.2.5.Other technologies
15.6.4.3.Kuwait Animal Model Market Revenue (US$ Mn) and Forecasts, By Application
15.6.4.3.1.Drug Discovery and Development
15.6.4.3.2.Basic Research
15.6.4.3.3.Others
15.6.4.4.Kuwait Animal Model Market Revenue (US$ Mn) and Forecasts, By End User
15.6.4.4.1.Pharma and Biotech Companies
15.6.4.4.2.Academic Research Institutes
15.6.4.4.3.CROs and CDMOs
15.6.5.South Africa
15.6.5.1.South Africa Animal Model Market Revenue (US$ Mn) and Forecasts, By Animal Type
15.6.5.1.1.Mice
15.6.5.1.2.Rats
15.6.5.1.3.Fish
15.6.5.1.4.Birds
15.6.5.1.5.Cattle
15.6.5.1.6.Pigs
15.6.5.1.7.Amphibians
15.6.5.1.8.Guinea Pigs
15.6.5.1.9.Dogs
15.6.5.1.10.Cats
15.6.5.1.11.Rabbits
15.6.5.1.12.Monkeys
15.6.5.1.13.Sheep
15.6.5.1.14.Hamsters
15.6.5.1.15.Other animal types
15.6.5.2.South Africa Animal Model Market Revenue (US$ Mn) and Forecasts, By Technology
15.6.5.2.1.CRISPR
15.6.5.2.2.Microinjection
15.6.5.2.3.Embryonic Stem Cell Injection
15.6.5.2.4.Nuclear Transfer
15.6.5.2.5.Other technologies
15.6.5.3.South Africa Animal Model Market Revenue (US$ Mn) and Forecasts, By Application
15.6.5.3.1.Drug Discovery and Development
15.6.5.3.2.Basic Research
15.6.5.3.3.Others
15.6.5.4.South Africa Animal Model Market Revenue (US$ Mn) and Forecasts, By End User
15.6.5.4.1.Pharma and Biotech Companies
15.6.5.4.2.Academic Research Institutes
15.6.5.4.3.CROs and CDMOs
15.6.6.Rest of Middle East & Africa
15.6.6.1.Rest of Middle East & Africa Animal Model Market Revenue (US$ Mn) and Forecasts, By Animal Type
15.6.6.1.1.Mice
15.6.6.1.2.Rats
15.6.6.1.3.Fish
15.6.6.1.4.Birds
15.6.6.1.5.Cattle
15.6.6.1.6.Pigs
15.6.6.1.7.Amphibians
15.6.6.1.8.Guinea Pigs
15.6.6.1.9.Dogs
15.6.6.1.10.Cats
15.6.6.1.11.Rabbits
15.6.6.1.12.Monkeys
15.6.6.1.13.Sheep
15.6.6.1.14.Hamsters
15.6.6.1.15.Other animal types
15.6.6.2.Rest of Middle East & Africa Animal Model Market Revenue (US$ Mn) and Forecasts, By Technology
15.6.6.2.1.CRISPR
15.6.6.2.2.Microinjection
15.6.6.2.3.Embryonic Stem Cell Injection
15.6.6.2.4.Nuclear Transfer
15.6.6.2.5.Other technologies
15.6.6.3.Rest of Middle East & Africa Animal Model Market Revenue (US$ Mn) and Forecasts, By Application
15.6.6.3.1.Drug Discovery and Development
15.6.6.3.2.Basic Research
15.6.6.3.3.Others
15.6.6.4.Rest of Middle East & Africa Animal Model Market Revenue (US$ Mn) and Forecasts, By End User
15.6.6.4.1.Pharma and Biotech Companies
15.6.6.4.2.Academic Research Institutes
15.6.6.4.3.CROs and CDMOs
15.7.Key Segment for Channeling Investments
15.7.1.By Country
15.7.2.By Animal Type
15.7.3.By Technology
15.7.4.By Application
15.7.5.By End User
16.Latin America Animal Model Market Analysis and Forecasts, 2023 – 2031
16.1.Overview
16.1.1.Latin America Animal Model Market Revenue (US$ Mn)
16.2.Latin America Animal Model Market Revenue (US$ Mn) and Forecasts, By Animal Type
16.2.1.Mice
16.2.2.Rats
16.2.3.Fish
16.2.4.Birds
16.2.5.Cattle
16.2.6.Pigs
16.2.7.Amphibians
16.2.8.Guinea Pigs
16.2.9.Dogs
16.2.10.Cats
16.2.11.Rabbits
16.2.12.Monkeys
16.2.13.Sheep
16.2.14.Hamsters
16.2.15.Other animal types
16.3.Latin America Animal Model Market Revenue (US$ Mn) and Forecasts, By Technology
16.3.1.CRISPR
16.3.2.Microinjection
16.3.3.Embryonic Stem Cell Injection
16.3.4.Nuclear Transfer
16.3.5.Other technologies
16.4.Latin America Animal Model Market Revenue (US$ Mn) and Forecasts, By Application
16.4.1.Drug Discovery and Development
16.4.2.Basic Research
16.4.3.Others
16.5.Latin America Animal Model Market Revenue (US$ Mn) and Forecasts, By End User
16.5.1.Pharma and Biotech Companies
16.5.2.Academic Research Institutes
16.5.3.CROs and CDMOs
16.6.Latin America Animal Model Market Revenue (US$ Mn) and Forecasts, By Country
16.6.1.Brazil
16.6.1.1.Brazil Animal Model Market Revenue (US$ Mn) and Forecasts, By Animal Type
16.6.1.1.1.Mice
16.6.1.1.2.Rats
16.6.1.1.3.Fish
16.6.1.1.4.Birds
16.6.1.1.5.Cattle
16.6.1.1.6.Pigs
16.6.1.1.7.Amphibians
16.6.1.1.8.Guinea Pigs
16.6.1.1.9.Dogs
16.6.1.1.10.Cats
16.6.1.1.11.Rabbits
16.6.1.1.12.Monkeys
16.6.1.1.13.Sheep
16.6.1.1.14.Hamsters
16.6.1.1.15.Other animal types
16.6.1.2.Brazil Animal Model Market Revenue (US$ Mn) and Forecasts, By Technology
16.6.1.2.1.CRISPR
16.6.1.2.2.Microinjection
16.6.1.2.3.Embryonic Stem Cell Injection
16.6.1.2.4.Nuclear Transfer
16.6.1.2.5.Other technologies
16.6.1.3.Brazil Animal Model Market Revenue (US$ Mn) and Forecasts, By Application
16.6.1.3.1.Drug Discovery and Development
16.6.1.3.2.Basic Research
16.6.1.3.3.Others
16.6.1.4.Brazil Animal Model Market Revenue (US$ Mn) and Forecasts, By End User
16.6.1.4.1.Pharma and Biotech Companies
16.6.1.4.2.Academic Research Institutes
16.6.1.4.3.CROs and CDMOs
16.6.2.Argentina
16.6.2.1.Argentina Animal Model Market Revenue (US$ Mn) and Forecasts, By Animal Type
16.6.2.1.1.Mice
16.6.2.1.2.Rats
16.6.2.1.3.Fish
16.6.2.1.4.Birds
16.6.2.1.5.Cattle
16.6.2.1.6.Pigs
16.6.2.1.7.Amphibians
16.6.2.1.8.Guinea Pigs
16.6.2.1.9.Dogs
16.6.2.1.10.Cats
16.6.2.1.11.Rabbits
16.6.2.1.12.Monkeys
16.6.2.1.13.Sheep
16.6.2.1.14.Hamsters
16.6.2.1.15.Other animal types
16.6.2.2.Argentina Animal Model Market Revenue (US$ Mn) and Forecasts, By Technology
16.6.2.2.1.CRISPR
16.6.2.2.2.Microinjection
16.6.2.2.3.Embryonic Stem Cell Injection
16.6.2.2.4.Nuclear Transfer
16.6.2.2.5.Other technologies
16.6.2.3.Argentina Animal Model Market Revenue (US$ Mn) and Forecasts, By Application
16.6.2.3.1.Drug Discovery and Development
16.6.2.3.2.Basic Research
16.6.2.3.3.Others
16.6.2.4.Argentina Animal Model Market Revenue (US$ Mn) and Forecasts, By End User
16.6.2.4.1.Pharma and Biotech Companies
16.6.2.4.2.Academic Research Institutes
16.6.2.4.3.CROs and CDMOs
16.6.3.Rest of Latin America
16.6.3.1.Rest of Latin America Animal Model Market Revenue (US$ Mn) and Forecasts, By Animal Type
16.6.3.1.1.Mice
16.6.3.1.2.Rats
16.6.3.1.3.Fish
16.6.3.1.4.Birds
16.6.3.1.5.Cattle
16.6.3.1.6.Pigs
16.6.3.1.7.Amphibians
16.6.3.1.8.Guinea Pigs
16.6.3.1.9.Dogs
16.6.3.1.10.Cats
16.6.3.1.11.Rabbits
16.6.3.1.12.Monkeys
16.6.3.1.13.Sheep
16.6.3.1.14.Hamsters
16.6.3.1.15.Other animal types
16.6.3.2.Rest of Latin America Animal Model Market Revenue (US$ Mn) and Forecasts, By Technology
16.6.3.2.1.CRISPR
16.6.3.2.2.Microinjection
16.6.3.2.3.Embryonic Stem Cell Injection
16.6.3.2.4.Nuclear Transfer
16.6.3.2.5.Other technologies
16.6.3.3.Rest of Latin America Animal Model Market Revenue (US$ Mn) and Forecasts, By Application
16.6.3.3.1.Drug Discovery and Development
16.6.3.3.2.Basic Research
16.6.3.3.3.Others
16.6.3.4.Rest of Latin America Animal Model Market Revenue (US$ Mn) and Forecasts, By End User
16.6.3.4.1.Pharma and Biotech Companies
16.6.3.4.2.Academic Research Institutes
16.6.3.4.3.CROs and CDMOs
16.7.Key Segment for Channeling Investments
16.7.1.By Country
16.7.2.By Animal Type
16.7.3.By Technology
16.7.4.By Application
16.7.5.By End User
17.Competitive Benchmarking
17.1.Brand Benchmarking
17.2.Market Share Analysis, 2022
17.3.Global Presence and Growth Strategies
17.3.1.Mergers and Acquisitions
17.3.2.Product Launches
17.3.3.Investments Trends
17.3.4.R&D Initiatives
18.Player Profiles
18.1.Charles River Laboratories
18.1.1.Company Details
18.1.2.Company Overview
18.1.3.Product Offerings
18.1.4.Key Developments
18.1.5.Financial Analysis
18.1.6.SWOT Analysis
18.1.7.Business Strategies
18.2.Crown Bioscience
18.2.1.Company Details
18.2.2.Company Overview
18.2.3.Product Offerings
18.2.4.Key Developments
18.2.5.Financial Analysis
18.2.6.SWOT Analysis
18.2.7.Business Strategies
18.3.genOway
18.3.1.Company Details
18.3.2.Company Overview
18.3.3.Product Offerings
18.3.4.Key Developments
18.3.5.Financial Analysis
18.3.6.SWOT Analysis
18.3.7.Business Strategies
18.4.Hera Biolabs
18.4.1.Company Details
18.4.2.Company Overview
18.4.3.Product Offerings
18.4.4.Key Developments
18.4.5.Financial Analysis
18.4.6.SWOT Analysis
18.4.7.Business Strategies
18.5.Inotiv
18.5.1.Company Details
18.5.2.Company Overview
18.5.3.Product Offerings
18.5.4.Key Developments
18.5.5.Financial Analysis
18.5.6.SWOT Analysis
18.5.7.Business Strategies
18.6.Janvier Labs
18.6.1.Company Details
18.6.2.Company Overview
18.6.3.Product Offerings
18.6.4.Key Developments
18.6.5.Financial Analysis
18.6.6.SWOT Analysis
18.6.7.Business Strategies
18.7.Ozgene Pty Ltd.
18.7.1.Company Details
18.7.2.Company Overview
18.7.3.Product Offerings
18.7.4.Key Developments
18.7.5.Financial Analysis
18.7.6.SWOT Analysis
18.7.7.Business Strategies
18.8.Taconic Biosciences, Inc.
18.8.1.Company Details
18.8.2.Company Overview
18.8.3.Product Offerings
18.8.4.Key Developments
18.8.5.Financial Analysis
18.8.6.SWOT Analysis
18.8.7.Business Strategies
18.9.The Jackson Laboratory
18.9.1.Company Details
18.9.2.Company Overview
18.9.3.Product Offerings
18.9.4.Key Developments
18.9.5.Financial Analysis
18.9.6.SWOT Analysis
18.9.7.Business Strategies
18.10.Trans Genic Inc.
18.10.1.Company Details
18.10.2.Company Overview
18.10.3.Product Offerings
18.10.4.Key Developments
18.10.5.Financial Analysis
18.10.6.SWOT Analysis
18.10.7.Business Strategies
18.11.Other Market Participants
19.Key Findings

.

**Exclusive for Multi-User and Enterprise User.

Global Animal Model Market

By Animal Type

 Mice
 Rats
 Fish
 Birds
 Cattle
 Pigs
 Amphibians
 Guinea Pigs
 Dogs
 Cats
 Rabbits
 Monkeys
 Sheep
 Hamsters
 Other animal types

By Technology

 CRISPR
 Microinjection
 Embryonic Stem Cell Injection
 Nuclear Transfer
 Other technologies

By Application

 Drug Discovery and Development
 Basic Research
 Others

By End User

 Pharma and Biotech Companies
 Academic Research Institutes
 CROs and CDMOs

By Region

 North America (U.S., Canada, Mexico, Rest of North America)
 Europe (France, The UK, Spain, Germany, Italy, Nordic Countries (Denmark, Finland, Iceland, Sweden, Norway), Benelux Union (Belgium, The Netherlands, Luxembourg), Rest of Europe)
 Asia Pacific (China, Japan, India, New Zealand, Australia, South Korea, Southeast Asia (Indonesia, Thailand, Malaysia, Singapore, Rest of Southeast Asia), Rest of Asia Pacific)
 Middle East & Africa (Saudi Arabia, UAE, Egypt, Kuwait, South Africa, Rest of Middle East & Africa)
 Latin America (Brazil, Argentina, Rest of Latin America)

**Note: The report covers cross-segmentation analysis by region further into countries

.

The Niche Research approach encompasses both primary and secondary research methods to provide comprehensive insights. While primary research is the cornerstone of our studies, we also incorporate secondary research sources such as company annual reports, premium industry databases, press releases, industry journals, and white papers.

Within our primary research, we actively engage with various industry stakeholders, conducting paid interviews and surveys. Our meticulous analysis extends to every market participant in major countries, allowing us to thoroughly examine their portfolios, calculate market shares, and segment revenues.

Our data collection primarily focuses on individual countries within our research scope, enabling us to estimate regional market sizes. Typically, we employ a bottom-up approach, meticulously tracking trends in different countries. We analyze growth drivers, constraints, technological innovations, and opportunities for each country, ultimately arriving at regional figures.Our process begins by examining the growth prospects of each country. Building upon these insights, we project growth and trends for the entire region. Finally, we utilize our proprietary model to refine estimations and forecasts.

Our data validation standards are integral to ensuring the reliability and accuracy of our research findings. Here’s a breakdown of our data validation processes and the stakeholders we engage with during our primary research:

  • Supply Side Analysis: We initiate a supply side analysis by directly contacting market participants, through telephonic interviews and questionnaires containing both open-ended and close-ended questions. We gather information on their portfolios, segment revenues, developments, and growth strategies.
  • Demand Side Analysis: To gain insights into adoption trends and consumer preferences, we reach out to target customers and users (non-vendors). This information forms a vital part of the qualitative analysis section of our reports, covering market dynamics, adoption trends, consumer behavior, spending patterns, and other related aspects.
  • Consultant Insights: We tap into the expertise of our partner consultants from around the world to obtain their unique viewpoints and perspectives. Their insights contribute to a well-rounded understanding of the markets under investigation.
  • In-House Validation: To ensure data accuracy and reliability, we conduct cross-validation of data points and information through our in-house team of consultants and utilize advanced data modeling tools for thorough verification.

The forecasts we provide are based on a comprehensive assessment of various factors, including:

  • Market Trends and Past Performance (Last Five Years): We accurately analyze market trends and performance data from preceding five years to identify historical patterns and understand the market’s evolution.
  • Historical Performance and Growth of Market Participants: We assess the historical performance and growth trajectories of key market participants. This analysis provides insights into the competitive landscape and individual company strategies.
  • Market Determinants Impact Analysis (Next Eight Years): We conduct a rigorous analysis of the factors that are projected to influence the market over the next eight years. This includes assessing both internal and external determinants that can shape market dynamics.
  • Drivers and Challenges for the Forecast Period:Identify the factors expected to drive market growth during the forecast period, as well as the challenges that the industry may face. This analysis aids in deriving an accurate growth rate projection.
  • New Acquisitions, Collaborations, or Partnerships: We keep a close watch on any new acquisitions, collaborations, or partnerships within the industry. These developments can have a significant impact on market dynamics and competitiveness.
  • Macro and Micro Factors Analysis:A thorough examination of both macro-level factors (e.g., economic trends, regulatory changes) and micro-level factors (e.g., technological advancements, consumer preferences) that may influence the market during the forecast period.
  • End-User Sentiment Analysis: To understand the market from the end-user perspective, we conduct sentiment analysis. This involves assessing the sentiment, preferences, and feedback of the end-users, which can provide valuable insights into market trends.
  • Perspective of Primary Participants: Insights gathered directly from primary research participants play a crucial role in shaping our forecasts. Their perspectives and experiences provide valuable qualitative data.
  • Year-on-Year Growth Trend: We utilize a year-on-year growth trend based on historical market growth and expected future trends. This helps in formulating our growth projections, aligning them with the market’s historical performance.

Research process adopted by TNR involves multiple stages, including data collection, validation, quality checks, and presentation. It’s crucial that the data and information we provide add value to your existing market understanding and expertise. We have also established partnerships with business consulting, research, and survey organizations across regions and globally to collaborate on regional analysis and data validation, ensuring the highest level of accuracy and reliability in our reports.


Procure Comprehensive Study of

Global Animal Model Market

Online Only

  • Online Access
  • Read Only File
  • Validity 3 Months
  • Print, Copy, Paste & Download
  • PPT, Excel
  • Cost-Free Report in the Next Update
$3300
Buy Now

Single User

  • Access to One User on One System
  • Read Only File
  • Validity 6 Months
  • Limited Print,Copy, Paste
  • PPT, Excel
  • Cost-Free Report in the Next Update
$4200
Buy Now

Multi User

  • Access to Fiver Users
  • PDF File
  • Validity 1 Year
  • Upto FivePrints
  • Cost-Free Report in the Next Update
  • PPT, Excel
$6000
Buy Now

Enterprise User

  • Access to Unlimited Users
  • PDF, PPT, Excel
  • Unlimited Validity, Prints&Downloads
  • 1 Hour Cost-Free & Dedicated Analyst Support
  • 10% Cost-Free Customization
  • Cost-Free Report Update Twice in a Year
  • Recommendations for Business Strategies
  • Authorization to Quote TNR, The Niche Research
$7300
Buy Now

Library Access

  • Online Access to Content Publications
  • Access Player Profiles Online
  • Get Immediate Access to Newly Added Content
  • Acquire 12 PDF Downloads
  • Acquire 5 Excel Data Sets
  • Gain Access to 290+ PDFs of Company Profiles
  • Round-the-clock Email and Phone Assistance
  • Dashboard Usage and Trends
  • Renewal & Upgrade Assistance
  • Assessing Customization Options and Alerts for New Reports
$10788
Buy Now
*Taxes/Fees, if applicable will be added during checkout. All prices in USD

Why TNR The Niche Research?

  • Unwavering Commitment to Excellence

  • Veteran Team of Researchers

  • Accurate and Timely Insights

  • Ethical Practices and Customized Service

  • Uninterrupted Availability Around the Clock

Scroll to Top