Global Augmented Reality Market, By Component, By Technology, By Application, By Region & Segmental Insights Trends and Forecast, 2024 – 2034

  • Industry: Technology
  • Report ID: TNR-110-1099
  • Number of Pages: 420
  • Table/Charts : Yes
  • May, 2024
  • Base Year : 2024
  • No. of Companies : 10+
  • No. of Countries : 29
  • Views : 10277
  • Covid Impact Covered: Yes
  • War Impact Covered: Yes
  • Formats : PDF, Excel, PPT

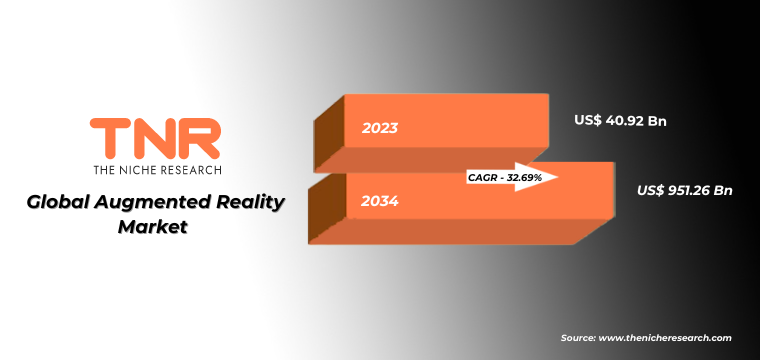
In Terms of Revenue, the Global Augmented Reality Market was Worth US$ 40.92 Bn in 2023 and is Anticipated to Witness a CAGR of 32.69% During 2024 – 2034.

The augmented reality (AR) market has witnessed significant growth, driven by advancements in technology and increasing applications across various sectors. AR overlays digital content onto the real world, enhancing user experiences in fields like gaming, retail, healthcare, and education. The integration of AR in smartphones and wearable devices has broadened its accessibility, fostering consumer engagement and immersive experiences. Key players, including Apple, Google, and Microsoft, are investing heavily in AR innovations, signaling robust market expansion. Enterprise adoption is also rising, with businesses utilizing AR for training, maintenance, and remote collaboration. Despite challenges such as high development costs and privacy concerns, the AR market is poised for substantial growth, projected to reach multi-billion-dollar valuations in the coming years.

Augmented Reality Market Dynamics

Growth Driver- Rapid Advancement in Smartphone Technology

Modern smartphones are equipped with powerful processors, high-resolution cameras, and advanced sensors like accelerometers and gyroscopes, which are essential for AR functionality. These technological enhancements enable smartphones to deliver seamless and immersive AR experiences, making AR more accessible to the general public. Additionally, major tech companies such as Apple and Google are continuously developing and integrating AR software development kits (SDKs) like ARKit and ARCore, simplifying the creation of AR applications for developers. This ecosystem support encourages a proliferation of AR apps across various domains, including gaming, retail, education, and real estate.

As smartphone penetration continues to rise globally, the user base for AR applications expands correspondingly, driving market growth. The continuous evolution in smartphone capabilities thus acts as a catalyst, propelling the widespread adoption and integration of AR technologies in everyday life.

Trends- Increasing Integration of AR in e-Commerce and Retail

Retailers are leveraging AR to create more engaging and personalized shopping experiences. AR allows customers to virtually try on clothes, accessories, or makeup through their smartphones or AR-enabled mirrors in stores. This not only enhances the shopping experience but also reduces the return rates by helping customers make more informed purchase decisions. Major brands like IKEA and Sephora have successfully implemented AR apps, allowing customers to visualize furniture in their homes or experiment with different makeup looks.

Additionally, AR is being used for interactive product demonstrations and virtual showrooms, enabling businesses to showcase their products in innovative ways. This trend reflects a broader shift towards digital transformation in retail, where AR is becoming a crucial tool for driving customer engagement, satisfaction, and ultimately, sales.

Challenge- High Cost of Development and Implementation

Creating sophisticated AR applications requires substantial investment in advanced hardware, software, and skilled developers. The initial costs can be prohibitive for small and medium-sized enterprises, limiting their ability to adopt AR technology. Additionally, developing high-quality AR experiences demands ongoing research and innovation, which can strain resources. The cost of AR hardware, such as AR glasses and headsets, also remains relatively high, restricting widespread consumer adoption. These financial barriers can slow the pace at which AR technology is integrated across various industries.

Moreover, businesses must ensure that their AR solutions are compatible with multiple devices and platforms, adding to the complexity and expense. Overcoming these cost-related challenges is essential for the broader and more inclusive growth of the AR market, requiring strategic investments and perhaps more affordable technological breakthroughs.

Augmented Reality Market Segmentation by Component, Technology, Application and Region

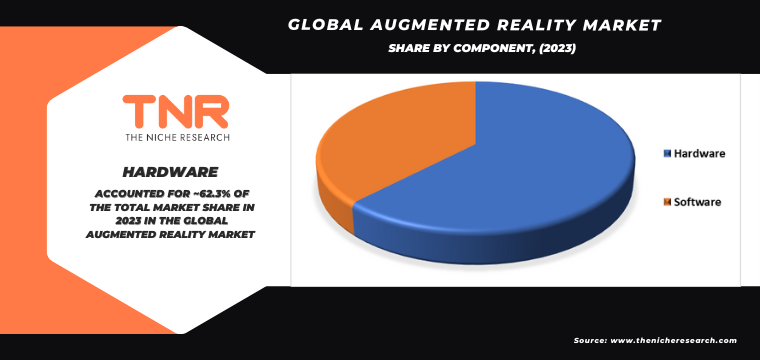
The hardware segment is poised to assert its dominance in the augmented reality market, boasting a substantial revenue share of 62.3% over the forecast period. Development and sales of AR devices like smart glasses, headsets, and AR-enabled smartphones are driving significant revenue. These devices are essential for delivering immersive AR experiences. Secondly, continuous advancements in AR hardware, such as improved sensors, processors, and displays, enhance user experience and broaden application possibilities. Additionally, the growing adoption of AR hardware in sectors like healthcare, manufacturing, and retail for training, maintenance, and customer engagement further boosts demand, solidifying the hardware segment’s market dominance.

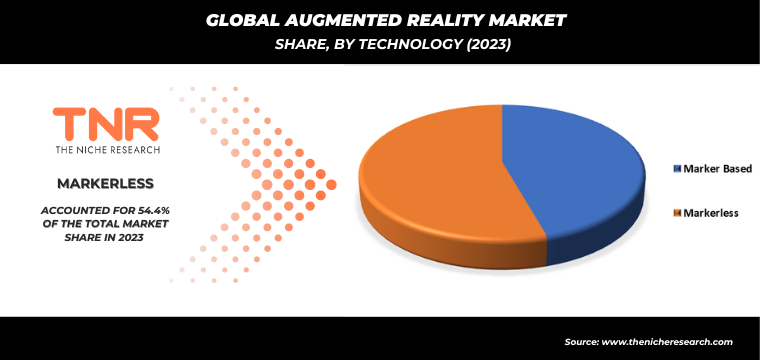
The marker based technology is anticipated as the fastest growing segment in the augmented reality market, boasting a substantial revenue share of 45.6% over the forecast period. This technology uses visual markers, like QR codes or images, to trigger AR experiences, making it cost-effective and simple for developers to create AR applications. It offers precise tracking and recognition, enhancing user interaction and experience. Industries such as retail, education, and marketing increasingly adopt marker-based AR for interactive product displays, educational tools, and immersive advertisements, driving its rapid growth and significant revenue share in the AR market.

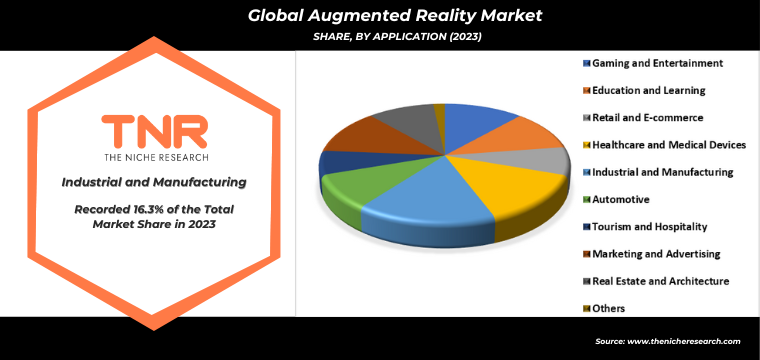
By application industrial and manufacturing segment dominated the augmented reality market, boasting a substantial revenue share of 16.3% over the forecast period. AR enhances productivity and efficiency through applications like maintenance and repair, where real-time, hands-free instructions overlay equipment, reducing downtime and error rates. Training programs benefit from immersive simulations, accelerating skill acquisition and improving safety. Additionally, AR supports complex assembly processes by providing visual guidance, ensuring precision and reducing assembly time. The integration of AR in quality control also enables better defect detection and process optimization, driving widespread adoption and significant revenue in the industrial and manufacturing sectors.

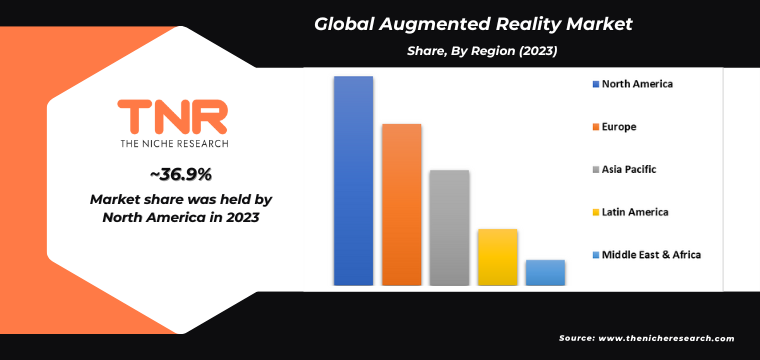
In 2023, North America is anticipated to play a significant role in propelling the growth of the augmented reality market, contributing approximately 36.9% to its overall expansion. The region is home to leading technology companies like Apple, Google, and Microsoft, which are heavily investing in AR innovation and development. There is also a robust ecosystem of AR startups and research institutions fostering advancements in AR technology. High consumer adoption rates of advanced gadgets and a strong demand for immersive experiences across sectors like gaming, retail, and healthcare further fuel market growth. Additionally, substantial funding and supportive government initiatives for AR applications enhance North America’s dominant position in the market.

Key Developments

  • In May 2022, Magic Leap, Inc. revealed a strategic partnership with the digital firm Globant. This collaboration is focused on promoting the adoption of augmented reality within enterprises, aiming to broaden the scope of enterprise AR applications.
  • In April 2021, Google LLC introduced the WebXR collection to provide an enhanced immersive experience for users. This platform encompasses tools such as Sodar, Measure UP, Floom, and Picturescape, delivering a comprehensive immersive experience specifically for Android users.

Major Players in Augmented Reality Market

  • Apple, Inc.
  • Blippar Group Limited
  • Google LLC
  • Lenovo
  • Magic Leap, Inc.
  • Meta
  • Microsoft
  • PTC
  • Snap, Inc.
  • Sony Semiconductor Solutions Corporation
  • TeamViewer AG
  • Visometry GmbH
  • Vuzix
  • Wikitude
  • Xiaomi
  • Zappar Ltd
  • Other Industry Participants

Global Augmented Reality Market Key Insights:

Report Specifications Details
Market Revenue in 2023 US$ 40.92 Bn
Market Size Forecast by 2034 US$ 951.26 Bn
Growth Rate (CAGR) 32.69%
Historic Data 2016 – 2022
Base Year for Estimation 2023
Forecast Period 2024 – 2034
Report Inclusions Market Size & Estimates, Market Dynamics, Competitive Scenario, Trends, Growth Factors, Market Determinants, Key Investment Segmentation, Product/Service/Solutions Benchmarking
Segments Covered By Component, By Technology, By Application, By Region
Regions Covered North America, Europe, Asia Pacific, Middle East & Africa, Latin America
Countries Covered U.S., Canada, Mexico, Rest of North America,  France, The UK, Spain, Germany, Italy, Nordic Countries (Denmark, Finland, Iceland, Sweden, Norway), Benelux Union (Belgium, The Netherlands, Luxembourg), Rest of Europe,  China, Japan, India, New Zealand, Australia, South Korea, Southeast Asia (Indonesia, Thailand, Malaysia, Singapore, Rest of Southeast Asia), Rest of Asia Pacific,  Saudi Arabia, UAE, Egypt, Kuwait, South Africa, Rest of Middle East & Africa,  Brazil, Argentina, Rest of Latin America
Key Players Apple, Inc., Blippar Group Limited, Google LLC, Lenovo, Magic Leap, Inc., Meta, Microsoft, PTC, Snap, Inc., Sony Semiconductor Solutions Corporation, TeamViewer AG, Visometry GmbH, Vuzix, Wikitude, Xiaomi, Zappar Ltd, Other Market Participants
Customization Scope Customization allows for the inclusion/modification of content pertaining to geographical regions, countries, and specific market segments.
Pricing & Procurement Options Explore purchase options tailored to your specific research requirements
Contact Details Consult With Our Expert

Japan (Toll-Free):  +81 663-386-8111

South Korea (Toll-Free):  +82-808- 703-126

Saudi Arabia (Toll-Free):  +966 800-850-1643

United Kingdom: +44 753-710-5080

United States: +1 302-232-5106

E-mail:  askanexpert@thenicheresearch.com


Global Augmented Reality Market

By Component

  • Hardware
  • Software

By Technology

  • Marker Based
  • Markerless
    • Location-based AR
    • Projection-based AR
    • Overlay AR
    • Contour-based AR

By Application

  • Gaming and Entertainment
  • Education and Learning
  • Retail and E-commerce
  • Healthcare and Medical Devices
  • Industrial and Manufacturing
  • Automotive
  • Tourism and Hospitality
  • Marketing and Advertising
  • Real Estate and Architecture
  • Others

By Region

  • North America (U.S., Canada, Mexico, Rest of North America)
  • Europe (France, The UK, Spain, Germany, Italy, Nordic Countries (Denmark, Finland, Iceland, Sweden, Norway), Benelux Union (Belgium, The Netherlands, Luxembourg), Rest of Europe)
  • Asia Pacific (China, Japan, India, New Zealand, Australia, South Korea, Southeast Asia (Indonesia, Thailand, Malaysia, Singapore, Rest of Southeast Asia), Rest of Asia Pacific)
  • Middle East & Africa (Saudi Arabia, UAE, Egypt, Kuwait, South Africa, Rest of Middle East & Africa)
  • Latin America (Brazil, Argentina, Rest of Latin America)

Report Coverage: 


Table of Contents

.

1.Market Scope
1.1.Market Segmentation
1.2.Years Considered
1.2.1.Historic Years: 2016 – 2022
1.2.2.Base Year: 2023
1.2.3.Forecast Years: 2024 – 2034
2.Key Target Audiences
3.Research Methodology
3.1.Primary Research
3.1.1.Research Questionnaire
3.1.2.Global Percentage Breakdown
3.1.3.Primary Interviews: Key Opinion Leaders (KOLs)
3.2.Secondary Research
3.2.1.Paid Databases
3.2.2.Secondary Sources
3.3.Market Size Estimates
3.3.1.Top-Down Approach
3.3.2.Bottom-Up Approach
3.4.Data Triangulation Methodology
3.5.Research Assumptions
4.Recommendations and Insights from TNR’s Perspective**
5.Holistic Overview of Augmented Reality Market
6.Market Synopsis: Augmented Reality Market
7.Augmented Reality Market Analysis: Qualitative Perspective
7.1.Introduction
7.1.1.Product Definition
7.1.2.Industry Development
7.2.Market Dynamics
7.2.1.Drivers
7.2.2.Restraints
7.2.3.Opportunities
7.2.4.Challenges
7.3.Trends in Augmented Reality Market
7.4.Market Determinants Radar Chart
7.5.Macro-Economic and Micro-Economic Indicators: Augmented Reality Market
7.6.Porter’s Five Force Analysis
7.7.Impact of Covid-19 on Augmented Reality Market
7.8.PESTEL Analysis
7.9.Value Chain Analysis
8.Global Augmented Reality Market Analysis and Forecasts, 2024 – 2034
8.1.Overview
8.1.1.Global Augmented Reality Market Revenue (US$ Mn)
8.2.Global Augmented Reality Market Revenue (US$ Mn) and Forecasts, By Component
8.2.1.Hardware
8.2.1.1.Definition
8.2.1.2.Market Estimation and Penetration, 2016 – 2023
8.2.1.3.Market Forecast, 2024 – 2034
8.2.1.4.Compound Annual Growth Rate (CAGR)
8.2.1.5.Regional Bifurcation
8.2.1.5.1.North America
8.2.1.5.1.1.Market Estimation, 2016 – 2023
8.2.1.5.1.2.Market Forecast, 2024 – 2034
8.2.1.5.2.Europe
8.2.1.5.2.1.Market Estimation, 2016 – 2023
8.2.1.5.2.2.Market Forecast, 2024 – 2034
8.2.1.5.3.Asia Pacific
8.2.1.5.3.1.Market Estimation, 2016 – 2023
8.2.1.5.3.2.Market Forecast, 2024 – 2034
8.2.1.5.4.Middle East and Africa
8.2.1.5.4.1.Market Estimation, 2016 – 2023
8.2.1.5.4.2.Market Forecast, 2024 – 2034
8.2.1.5.5.Latin America
8.2.1.5.5.1.Market Estimation, 2016 – 2023
8.2.1.5.5.2.Market Forecast, 2024 – 2034
8.2.2.Software
8.2.2.1.Definition
8.2.2.2.Market Estimation and Penetration, 2016 – 2023
8.2.2.3.Market Forecast, 2024 – 2034
8.2.2.4.Compound Annual Growth Rate (CAGR)
8.2.2.5.Regional Bifurcation
8.2.2.5.1.North America
8.2.2.5.1.1.Market Estimation, 2016 – 2023
8.2.2.5.1.2.Market Forecast, 2024 – 2034
8.2.2.5.2.Europe
8.2.2.5.2.1.Market Estimation, 2016 – 2023
8.2.2.5.2.2.Market Forecast, 2024 – 2034
8.2.2.5.3.Asia Pacific
8.2.2.5.3.1.Market Estimation, 2016 – 2023
8.2.2.5.3.2.Market Forecast, 2024 – 2034
8.2.2.5.4.Middle East and Africa
8.2.2.5.4.1.Market Estimation, 2016 – 2023
8.2.2.5.4.2.Market Forecast, 2024 – 2034
8.2.2.5.5.Latin America
8.2.2.5.5.1.Market Estimation, 2016 – 2023
8.2.2.5.5.2.Market Forecast, 2024 – 2034
8.3.Key Segment for Channeling Investments
8.3.1.By Component
9.Global Augmented Reality Market Analysis and Forecasts, 2024 – 2034
9.1.Overview
9.2.Global Augmented Reality Market Revenue (US$ Mn) and Forecasts, By Technology
9.2.1.Marker Based
9.2.1.1.Definition
9.2.1.2.Market Estimation and Penetration, 2016 – 2023
9.2.1.3.Market Forecast, 2024 – 2034
9.2.1.4.Compound Annual Growth Rate (CAGR)
9.2.1.5.Regional Bifurcation
9.2.1.5.1.North America
9.2.1.5.1.1.Market Estimation, 2016 – 2023
9.2.1.5.1.2.Market Forecast, 2024 – 2034
9.2.1.5.2.Europe
9.2.1.5.2.1.Market Estimation, 2016 – 2023
9.2.1.5.2.2.Market Forecast, 2024 – 2034
9.2.1.5.3.Asia Pacific
9.2.1.5.3.1.Market Estimation, 2016 – 2023
9.2.1.5.3.2.Market Forecast, 2024 – 2034
9.2.1.5.4.Middle East and Africa
9.2.1.5.4.1.Market Estimation, 2016 – 2023
9.2.1.5.4.2.Market Forecast, 2024 – 2034
9.2.1.5.5.Latin America
9.2.1.5.5.1.Market Estimation, 2016 – 2023
9.2.1.5.5.2.Market Forecast, 2024 – 2034
9.2.2.Markerless (Definition, Market Estimation and Penetration, 2016 – 2023, Market Estimation (2016 – 2023), Market Forecast (2024 – 2034), Compound Annual Growth Rate (CAGR), Regional Bifurcation (North America, Europe, Asia Pacific, Middle East and Africa, Latin America) and Information on Location-based AR, Projection-based AR, Overlay AR, Contour-based AR)
9.2.2.1.Location-based AR
9.2.2.2.Projection-based AR
9.2.2.3.Overlay AR
9.2.2.4.Contour-based AR
9.3.Key Segment for Channeling Investments
9.3.1.By Technology
10.Global Augmented Reality Market Analysis and Forecasts, 2024 – 2034
10.1.Overview
10.2.Global Augmented Reality Market Revenue (US$ Mn) and Forecasts, By Application
10.2.1.Gaming and Entertainment
10.2.1.1.Definition
10.2.1.2.Market Estimation and Penetration, 2016 – 2023
10.2.1.3.Market Forecast, 2024 – 2034
10.2.1.4.Compound Annual Growth Rate (CAGR)
10.2.1.5.Regional Bifurcation
10.2.1.5.1.North America
10.2.1.5.1.1.Market Estimation, 2016 – 2023
10.2.1.5.1.2.Market Forecast, 2024 – 2034
10.2.1.5.2.Europe
10.2.1.5.2.1.Market Estimation, 2016 – 2023
10.2.1.5.2.2.Market Forecast, 2024 – 2034
10.2.1.5.3.Asia Pacific
10.2.1.5.3.1.Market Estimation, 2016 – 2023
10.2.1.5.3.2.Market Forecast, 2024 – 2034
10.2.1.5.4.Middle East and Africa
10.2.1.5.4.1.Market Estimation, 2016 – 2023
10.2.1.5.4.2.Market Forecast, 2024 – 2034
10.2.1.5.5.Latin America
10.2.1.5.5.1.Market Estimation, 2016 – 2023
10.2.1.5.5.2.Market Forecast, 2024 – 2034
10.2.2.Education and Learning
10.2.2.1.Definition
10.2.2.2.Market Estimation and Penetration, 2016 – 2023
10.2.2.3.Market Forecast, 2024 – 2034
10.2.2.4.Compound Annual Growth Rate (CAGR)
10.2.2.5.Regional Bifurcation
10.2.2.5.1.North America
10.2.2.5.1.1.Market Estimation, 2016 – 2023
10.2.2.5.1.2.Market Forecast, 2024 – 2034
10.2.2.5.2.Europe
10.2.2.5.2.1.Market Estimation, 2016 – 2023
10.2.2.5.2.2.Market Forecast, 2024 – 2034
10.2.2.5.3.Asia Pacific
10.2.2.5.3.1.Market Estimation, 2016 – 2023
10.2.2.5.3.2.Market Forecast, 2024 – 2034
10.2.2.5.4.Middle East and Africa
10.2.2.5.4.1.Market Estimation, 2016 – 2023
10.2.2.5.4.2.Market Forecast, 2024 – 2034
10.2.2.5.5.Latin America
10.2.2.5.5.1.Market Estimation, 2016 – 2023
10.2.2.5.5.2.Market Forecast, 2024 – 2034
10.2.3.Retail and E-commerce
10.2.3.1.Definition
10.2.3.2.Market Estimation and Penetration, 2016 – 2023
10.2.3.3.Market Forecast, 2024 – 2034
10.2.3.4.Compound Annual Growth Rate (CAGR)
10.2.3.5.Regional Bifurcation
10.2.3.5.1.North America
10.2.3.5.1.1.Market Estimation, 2016 – 2023
10.2.3.5.1.2.Market Forecast, 2024 – 2034
10.2.3.5.2.Europe
10.2.3.5.2.1.Market Estimation, 2016 – 2023
10.2.3.5.2.2.Market Forecast, 2024 – 2034
10.2.3.5.3.Asia Pacific
10.2.3.5.3.1.Market Estimation, 2016 – 2023
10.2.3.5.3.2.Market Forecast, 2024 – 2034
10.2.3.5.4.Middle East and Africa
10.2.3.5.4.1.Market Estimation, 2016 – 2023
10.2.3.5.4.2.Market Forecast, 2024 – 2034
10.2.3.5.5.Latin America
10.2.3.5.5.1.Market Estimation, 2016 – 2023
10.2.3.5.5.2.Market Forecast, 2024 – 2034
10.2.4.Healthcare and Medical Devices
10.2.4.1.Definition
10.2.4.2.Market Estimation and Penetration, 2016 – 2023
10.2.4.3.Market Forecast, 2024 – 2034
10.2.4.4.Compound Annual Growth Rate (CAGR)
10.2.4.5.Regional Bifurcation
10.2.4.5.1.North America
10.2.4.5.1.1.Market Estimation, 2016 – 2023
10.2.4.5.1.2.Market Forecast, 2024 – 2034
10.2.4.5.2.Europe
10.2.4.5.2.1.Market Estimation, 2016 – 2023
10.2.4.5.2.2.Market Forecast, 2024 – 2034
10.2.4.5.3.Asia Pacific
10.2.4.5.3.1.Market Estimation, 2016 – 2023
10.2.4.5.3.2.Market Forecast, 2024 – 2034
10.2.4.5.4.Middle East and Africa
10.2.4.5.4.1.Market Estimation, 2016 – 2023
10.2.4.5.4.2.Market Forecast, 2024 – 2034
10.2.4.5.5.Latin America
10.2.4.5.5.1.Market Estimation, 2016 – 2023
10.2.4.5.5.2.Market Forecast, 2024 – 2034
10.2.5.Industrial and Manufacturing
10.2.5.1.Definition
10.2.5.2.Market Estimation and Penetration, 2016 – 2023
10.2.5.3.Market Forecast, 2024 – 2034
10.2.5.4.Compound Annual Growth Rate (CAGR)
10.2.5.5.Regional Bifurcation
10.2.5.5.1.North America
10.2.5.5.1.1.Market Estimation, 2016 – 2023
10.2.5.5.1.2.Market Forecast, 2024 – 2034
10.2.5.5.2.Europe
10.2.5.5.2.1.Market Estimation, 2016 – 2023
10.2.5.5.2.2.Market Forecast, 2024 – 2034
10.2.5.5.3.Asia Pacific
10.2.5.5.3.1.Market Estimation, 2016 – 2023
10.2.5.5.3.2.Market Forecast, 2024 – 2034
10.2.5.5.4.Middle East and Africa
10.2.5.5.4.1.Market Estimation, 2016 – 2023
10.2.5.5.4.2.Market Forecast, 2024 – 2034
10.2.5.5.5.Latin America
10.2.5.5.5.1.Market Estimation, 2016 – 2023
10.2.5.5.5.2.Market Forecast, 2024 – 2034
10.2.6.Automotive
10.2.6.1.Definition
10.2.6.2.Market Estimation and Penetration, 2016 – 2023
10.2.6.3.Market Forecast, 2024 – 2034
10.2.6.4.Compound Annual Growth Rate (CAGR)
10.2.6.5.Regional Bifurcation
10.2.6.5.1.North America
10.2.6.5.1.1.Market Estimation, 2016 – 2023
10.2.6.5.1.2.Market Forecast, 2024 – 2034
10.2.6.5.2.Europe
10.2.6.5.2.1.Market Estimation, 2016 – 2023
10.2.6.5.2.2.Market Forecast, 2024 – 2034
10.2.6.5.3.Asia Pacific
10.2.6.5.3.1.Market Estimation, 2016 – 2023
10.2.6.5.3.2.Market Forecast, 2024 – 2034
10.2.6.5.4.Middle East and Africa
10.2.6.5.4.1.Market Estimation, 2016 – 2023
10.2.6.5.4.2.Market Forecast, 2024 – 2034
10.2.6.5.5.Latin America
10.2.6.5.5.1.Market Estimation, 2016 – 2023
10.2.6.5.5.2.Market Forecast, 2024 – 2034
10.2.7.Tourism and Hospitality
10.2.7.1.Definition
10.2.7.2.Market Estimation and Penetration, 2016 – 2023
10.2.7.3.Market Forecast, 2024 – 2034
10.2.7.4.Compound Annual Growth Rate (CAGR)
10.2.7.5.Regional Bifurcation
10.2.7.5.1.North America
10.2.7.5.1.1.Market Estimation, 2016 – 2023
10.2.7.5.1.2.Market Forecast, 2024 – 2034
10.2.7.5.2.Europe
10.2.7.5.2.1.Market Estimation, 2016 – 2023
10.2.7.5.2.2.Market Forecast, 2024 – 2034
10.2.7.5.3.Asia Pacific
10.2.7.5.3.1.Market Estimation, 2016 – 2023
10.2.7.5.3.2.Market Forecast, 2024 – 2034
10.2.7.5.4.Middle East and Africa
10.2.7.5.4.1.Market Estimation, 2016 – 2023
10.2.7.5.4.2.Market Forecast, 2024 – 2034
10.2.7.5.5.Latin America
10.2.7.5.5.1.Market Estimation, 2016 – 2023
10.2.7.5.5.2.Market Forecast, 2024 – 2034
10.2.8.Marketing and Advertising
10.2.8.1.Definition
10.2.8.2.Market Estimation and Penetration, 2016 – 2023
10.2.8.3.Market Forecast, 2024 – 2034
10.2.8.4.Compound Annual Growth Rate (CAGR)
10.2.8.5.Regional Bifurcation
10.2.8.5.1.North America
10.2.8.5.1.1.Market Estimation, 2016 – 2023
10.2.8.5.1.2.Market Forecast, 2024 – 2034
10.2.8.5.2.Europe
10.2.8.5.2.1.Market Estimation, 2016 – 2023
10.2.8.5.2.2.Market Forecast, 2024 – 2034
10.2.8.5.3.Asia Pacific
10.2.8.5.3.1.Market Estimation, 2016 – 2023
10.2.8.5.3.2.Market Forecast, 2024 – 2034
10.2.8.5.4.Middle East and Africa
10.2.8.5.4.1.Market Estimation, 2016 – 2023
10.2.8.5.4.2.Market Forecast, 2024 – 2034
10.2.8.5.5.Latin America
10.2.8.5.5.1.Market Estimation, 2016 – 2023
10.2.8.5.5.2.Market Forecast, 2024 – 2034
10.2.9.Real Estate and Architecture
10.2.9.1.Definition
10.2.9.2.Market Estimation and Penetration, 2016 – 2023
10.2.9.3.Market Forecast, 2024 – 2034
10.2.9.4.Compound Annual Growth Rate (CAGR)
10.2.9.5.Regional Bifurcation
10.2.9.5.1.North America
10.2.9.5.1.1.Market Estimation, 2016 – 2023
10.2.9.5.1.2.Market Forecast, 2024 – 2034
10.2.9.5.2.Europe
10.2.9.5.2.1.Market Estimation, 2016 – 2023
10.2.9.5.2.2.Market Forecast, 2024 – 2034
10.2.9.5.3.Asia Pacific
10.2.9.5.3.1.Market Estimation, 2016 – 2023
10.2.9.5.3.2.Market Forecast, 2024 – 2034
10.2.9.5.4.Middle East and Africa
10.2.9.5.4.1.Market Estimation, 2016 – 2023
10.2.9.5.4.2.Market Forecast, 2024 – 2034
10.2.9.5.5.Latin America
10.2.9.5.5.1.Market Estimation, 2016 – 2023
10.2.9.5.5.2.Market Forecast, 2024 – 2034
10.2.10.Others
10.2.10.1.Definition
10.2.10.2.Market Estimation and Penetration, 2016 – 2023
10.2.10.3.Market Forecast, 2024 – 2034
10.2.10.4.Compound Annual Growth Rate (CAGR)
10.2.10.5.Regional Bifurcation
10.2.10.5.1.North America
10.2.10.5.1.1.Market Estimation, 2016 – 2023
10.2.10.5.1.2.Market Forecast, 2024 – 2034
10.2.10.5.2.Europe
10.2.10.5.2.1.Market Estimation, 2016 – 2023
10.2.10.5.2.2.Market Forecast, 2024 – 2034
10.2.10.5.3.Asia Pacific
10.2.10.5.3.1.Market Estimation, 2016 – 2023
10.2.10.5.3.2.Market Forecast, 2024 – 2034
10.2.10.5.4.Middle East and Africa
10.2.10.5.4.1.Market Estimation, 2016 – 2023
10.2.10.5.4.2.Market Forecast, 2024 – 2034
10.2.10.5.5.Latin America
10.2.10.5.5.1.Market Estimation, 2016 – 2023
10.2.10.5.5.2.Market Forecast, 2024 – 2034
10.3.Key Segment for Channeling Investments
10.3.1.By Application
11.North America Augmented Reality Market Analysis and Forecasts, 2024 – 2034
11.1.Overview
11.1.1.North America Augmented Reality Market Revenue (US$ Mn)
11.2.North America Augmented Reality Market Revenue (US$ Mn) and Forecasts, By Component
11.2.1.Hardware
11.2.2.Software
11.3.North America Augmented Reality Market Revenue (US$ Mn) and Forecasts, By Technology
11.3.1.Marker Based
11.3.2.Markerless
11.3.2.1.Location-based AR
11.3.2.2.Projection-based AR
11.3.2.3.Overlay AR
11.3.2.4.Contour-based AR
11.4.North America Augmented Reality Market Revenue (US$ Mn) and Forecasts, By Application
11.4.1.Gaming and Entertainment
11.4.2.Education and Learning
11.4.3.Retail and E-commerce
11.4.4.Healthcare and Medical Devices
11.4.5.Industrial and Manufacturing
11.4.6.Automotive
11.4.7.Tourism and Hospitality
11.4.8.Marketing and Advertising
11.4.9.Real Estate and Architecture
11.4.10.Others
11.5.North America Augmented Reality Market Revenue (US$ Mn) and Forecasts, By Country
11.5.1.U.S
11.5.1.1.U.S Augmented Reality Market Revenue (US$ Mn) and Forecasts, By Component
11.5.1.1.1.Hardware
11.5.1.1.2.Software
11.5.1.2.U.S Augmented Reality Market Revenue (US$ Mn) and Forecasts, By Technology
11.5.1.2.1.Marker Based
11.5.1.2.2.Markerless
11.5.1.2.2.1.Location-based AR
11.5.1.2.2.2.Projection-based AR
11.5.1.2.2.3.Overlay AR
11.5.1.2.2.4.Contour-based AR
11.5.1.3.U.S Augmented Reality Market Revenue (US$ Mn) and Forecasts, By Application
11.5.1.3.1.Gaming and Entertainment
11.5.1.3.2.Education and Learning
11.5.1.3.3.Retail and E-commerce
11.5.1.3.4.Healthcare and Medical Devices
11.5.1.3.5.Industrial and Manufacturing
11.5.1.3.6.Automotive
11.5.1.3.7.Tourism and Hospitality
11.5.1.3.8.Marketing and Advertising
11.5.1.3.9.Real Estate and Architecture
11.5.1.3.10.Others
11.5.2.Canada
11.5.2.1.Canada Augmented Reality Market Revenue (US$ Mn) and Forecasts, By Component
11.5.2.1.1.Hardware
11.5.2.1.2.Software
11.5.2.2.Canada Augmented Reality Market Revenue (US$ Mn) and Forecasts, By Technology
11.5.2.2.1.Marker Based
11.5.2.2.2.Markerless
11.5.2.2.2.1.Location-based AR
11.5.2.2.2.2.Projection-based AR
11.5.2.2.2.3.Overlay AR
11.5.2.2.2.4.Contour-based AR
11.5.2.3.Canada Augmented Reality Market Revenue (US$ Mn) and Forecasts, By Application
11.5.2.3.1.Gaming and Entertainment
11.5.2.3.2.Education and Learning
11.5.2.3.3.Retail and E-commerce
11.5.2.3.4.Healthcare and Medical Devices
11.5.2.3.5.Industrial and Manufacturing
11.5.2.3.6.Automotive
11.5.2.3.7.Tourism and Hospitality
11.5.2.3.8.Marketing and Advertising
11.5.2.3.9.Real Estate and Architecture
11.5.2.3.10.Others
11.5.3.Mexico
11.5.3.1.Mexico Augmented Reality Market Revenue (US$ Mn) and Forecasts, By Component
11.5.3.1.1.Hardware
11.5.3.1.2.Software
11.5.3.2.Mexico Augmented Reality Market Revenue (US$ Mn) and Forecasts, By Technology
11.5.3.2.1.Marker Based
11.5.3.2.2.Markerless
11.5.3.2.2.1.Location-based AR
11.5.3.2.2.2.Projection-based AR
11.5.3.2.2.3.Overlay AR
11.5.3.2.2.4.Contour-based AR
11.5.3.3.Mexico Augmented Reality Market Revenue (US$ Mn) and Forecasts, By Application
11.5.3.3.1.Gaming and Entertainment
11.5.3.3.2.Education and Learning
11.5.3.3.3.Retail and E-commerce
11.5.3.3.4.Healthcare and Medical Devices
11.5.3.3.5.Industrial and Manufacturing
11.5.3.3.6.Automotive
11.5.3.3.7.Tourism and Hospitality
11.5.3.3.8.Marketing and Advertising
11.5.3.3.9.Real Estate and Architecture
11.5.3.3.10.Others
11.5.4.Rest of North America
11.5.4.1.Rest of North America Augmented Reality Market Revenue (US$ Mn) and Forecasts, By Component
11.5.4.1.1.Hardware
11.5.4.1.2.Software
11.5.4.2.Rest of North America Augmented Reality Market Revenue (US$ Mn) and Forecasts, By Technology
11.5.4.2.1.Marker Based
11.5.4.2.2.Markerless
11.5.4.2.2.1.Location-based AR
11.5.4.2.2.2.Projection-based AR
11.5.4.2.2.3.Overlay AR
11.5.4.2.2.4.Contour-based AR
11.5.4.3.Rest of North America Augmented Reality Market Revenue (US$ Mn) and Forecasts, By Application
11.5.4.3.1.Gaming and Entertainment
11.5.4.3.2.Education and Learning
11.5.4.3.3.Retail and E-commerce
11.5.4.3.4.Healthcare and Medical Devices
11.5.4.3.5.Industrial and Manufacturing
11.5.4.3.6.Automotive
11.5.4.3.7.Tourism and Hospitality
11.5.4.3.8.Marketing and Advertising
11.5.4.3.9.Real Estate and Architecture
11.5.4.3.10.Others
11.6.Key Segment for Channeling Investments
11.6.1.By Country
11.6.2.By Component
11.6.3.By Technology
11.6.4.By Application
12.Europe Augmented Reality Market Analysis and Forecasts, 2024 – 2034
12.1.Overview
12.1.1.Europe Augmented Reality Market Revenue (US$ Mn)
12.2.Europe Augmented Reality Market Revenue (US$ Mn) and Forecasts, By Component
12.2.1.Hardware
12.2.2.Software
12.3.Europe Augmented Reality Market Revenue (US$ Mn) and Forecasts, By Technology
12.3.1.Marker Based
12.3.2.Markerless
12.3.2.1.Location-based AR
12.3.2.2.Projection-based AR
12.3.2.3.Overlay AR
12.3.2.4.Contour-based AR
12.4.Europe Augmented Reality Market Revenue (US$ Mn) and Forecasts, By Application
12.4.1.Gaming and Entertainment
12.4.2.Education and Learning
12.4.3.Retail and E-commerce
12.4.4.Healthcare and Medical Devices
12.4.5.Industrial and Manufacturing
12.4.6.Automotive
12.4.7.Tourism and Hospitality
12.4.8.Marketing and Advertising
12.4.9.Real Estate and Architecture
12.4.10.Others
12.5.Europe Augmented Reality Market Revenue (US$ Mn) and Forecasts, By Country
12.5.1.France
12.5.1.1.France Augmented Reality Market Revenue (US$ Mn) and Forecasts, By Component
12.5.1.1.1.Hardware
12.5.1.1.2.Software
12.5.1.2.France Augmented Reality Market Revenue (US$ Mn) and Forecasts, By Technology
12.5.1.2.1.Marker Based
12.5.1.2.2.Markerless
12.5.1.2.2.1.Location-based AR
12.5.1.2.2.2.Projection-based AR
12.5.1.2.2.3.Overlay AR
12.5.1.2.2.4.Contour-based AR
12.5.1.3.France Augmented Reality Market Revenue (US$ Mn) and Forecasts, By Application
12.5.1.3.1.Gaming and Entertainment
12.5.1.3.2.Education and Learning
12.5.1.3.3.Retail and E-commerce
12.5.1.3.4.Healthcare and Medical Devices
12.5.1.3.5.Industrial and Manufacturing
12.5.1.3.6.Automotive
12.5.1.3.7.Tourism and Hospitality
12.5.1.3.8.Marketing and Advertising
12.5.1.3.9.Real Estate and Architecture
12.5.1.3.10.Others
12.5.2.The UK
12.5.2.1.The UK Augmented Reality Market Revenue (US$ Mn) and Forecasts, By Component
12.5.2.1.1.Hardware
12.5.2.1.2.Software
12.5.2.2.The UK Augmented Reality Market Revenue (US$ Mn) and Forecasts, By Technology
12.5.2.2.1.Marker Based
12.5.2.2.2.Markerless
12.5.2.2.2.1.Location-based AR
12.5.2.2.2.2.Projection-based AR
12.5.2.2.2.3.Overlay AR
12.5.2.2.2.4.Contour-based AR
12.5.2.3.The UK Augmented Reality Market Revenue (US$ Mn) and Forecasts, By Application
12.5.2.3.1.Gaming and Entertainment
12.5.2.3.2.Education and Learning
12.5.2.3.3.Retail and E-commerce
12.5.2.3.4.Healthcare and Medical Devices
12.5.2.3.5.Industrial and Manufacturing
12.5.2.3.6.Automotive
12.5.2.3.7.Tourism and Hospitality
12.5.2.3.8.Marketing and Advertising
12.5.2.3.9.Real Estate and Architecture
12.5.2.3.10.Others
12.5.3.Spain
12.5.3.1.Spain Augmented Reality Market Revenue (US$ Mn) and Forecasts, By Component
12.5.3.1.1.Hardware
12.5.3.1.2.Software
12.5.3.2.Spain Augmented Reality Market Revenue (US$ Mn) and Forecasts, By Technology
12.5.3.2.1.Marker Based
12.5.3.2.2.Markerless
12.5.3.2.2.1.Location-based AR
12.5.3.2.2.2.Projection-based AR
12.5.3.2.2.3.Overlay AR
12.5.3.2.2.4.Contour-based AR
12.5.3.3.Spain Augmented Reality Market Revenue (US$ Mn) and Forecasts, By Application
12.5.3.3.1.Gaming and Entertainment
12.5.3.3.2.Education and Learning
12.5.3.3.3.Retail and E-commerce
12.5.3.3.4.Healthcare and Medical Devices
12.5.3.3.5.Industrial and Manufacturing
12.5.3.3.6.Automotive
12.5.3.3.7.Tourism and Hospitality
12.5.3.3.8.Marketing and Advertising
12.5.3.3.9.Real Estate and Architecture
12.5.3.3.10.Others
12.5.4.Germany
12.5.4.1.Germany Augmented Reality Market Revenue (US$ Mn) and Forecasts, By Component
12.5.4.1.1.Hardware
12.5.4.1.2.Software
12.5.4.2.Germany Augmented Reality Market Revenue (US$ Mn) and Forecasts, By Technology
12.5.4.2.1.Marker Based
12.5.4.2.2.Markerless
12.5.4.2.2.1.Location-based AR
12.5.4.2.2.2.Projection-based AR
12.5.4.2.2.3.Overlay AR
12.5.4.2.2.4.Contour-based AR
12.5.4.3.Germany Augmented Reality Market Revenue (US$ Mn) and Forecasts, By Application
12.5.4.3.1.Gaming and Entertainment
12.5.4.3.2.Education and Learning
12.5.4.3.3.Retail and E-commerce
12.5.4.3.4.Healthcare and Medical Devices
12.5.4.3.5.Industrial and Manufacturing
12.5.4.3.6.Automotive
12.5.4.3.7.Tourism and Hospitality
12.5.4.3.8.Marketing and Advertising
12.5.4.3.9.Real Estate and Architecture
12.5.4.3.10.Others
12.5.5.Italy
12.5.5.1.Italy Augmented Reality Market Revenue (US$ Mn) and Forecasts, By Component
12.5.5.1.1.Hardware
12.5.5.1.2.Software
12.5.5.2.Italy Augmented Reality Market Revenue (US$ Mn) and Forecasts, By Technology
12.5.5.2.1.Marker Based
12.5.5.2.2.Markerless
12.5.5.2.2.1.Location-based AR
12.5.5.2.2.2.Projection-based AR
12.5.5.2.2.3.Overlay AR
12.5.5.2.2.4.Contour-based AR
12.5.5.3.Italy Augmented Reality Market Revenue (US$ Mn) and Forecasts, By Application
12.5.5.3.1.Gaming and Entertainment
12.5.5.3.2.Education and Learning
12.5.5.3.3.Retail and E-commerce
12.5.5.3.4.Healthcare and Medical Devices
12.5.5.3.5.Industrial and Manufacturing
12.5.5.3.6.Automotive
12.5.5.3.7.Tourism and Hospitality
12.5.5.3.8.Marketing and Advertising
12.5.5.3.9.Real Estate and Architecture
12.5.5.3.10.Others
12.5.6.Nordic Countries
12.5.6.1.Nordic Countries Augmented Reality Market Revenue (US$ Mn) and Forecasts, By Component
12.5.6.1.1.Hardware
12.5.6.1.2.Software
12.5.6.2.Nordic Countries Augmented Reality Market Revenue (US$ Mn) and Forecasts, By Technology
12.5.6.2.1.Marker Based
12.5.6.2.2.Markerless
12.5.6.2.2.1.Location-based AR
12.5.6.2.2.2.Projection-based AR
12.5.6.2.2.3.Overlay AR
12.5.6.2.2.4.Contour-based AR
12.5.6.3.Nordic Countries Augmented Reality Market Revenue (US$ Mn) and Forecasts, By Application
12.5.6.3.1.Gaming and Entertainment
12.5.6.3.2.Education and Learning
12.5.6.3.3.Retail and E-commerce
12.5.6.3.4.Healthcare and Medical Devices
12.5.6.3.5.Industrial and Manufacturing
12.5.6.3.6.Automotive
12.5.6.3.7.Tourism and Hospitality
12.5.6.3.8.Marketing and Advertising
12.5.6.3.9.Real Estate and Architecture
12.5.6.3.10.Others
12.5.6.4.Nordic Countries Augmented Reality Market Revenue (US$ Mn) and Forecasts, By Country
12.5.6.4.1.Denmark
12.5.6.4.2.Finland
12.5.6.4.3.Iceland
12.5.6.4.4.Sweden
12.5.6.4.5.Norway
12.5.7.Benelux Union
12.5.7.1.Benelux Union Augmented Reality Market Revenue (US$ Mn) and Forecasts, By Component
12.5.7.1.1.Hardware
12.5.7.1.2.Software
12.5.7.2.Benelux Union Augmented Reality Market Revenue (US$ Mn) and Forecasts, By Technology
12.5.7.2.1.Marker Based
12.5.7.2.2.Markerless
12.5.7.2.2.1.Location-based AR
12.5.7.2.2.2.Projection-based AR
12.5.7.2.2.3.Overlay AR
12.5.7.2.2.4.Contour-based AR
12.5.7.3.Benelux Union Augmented Reality Market Revenue (US$ Mn) and Forecasts, By Application
12.5.7.3.1.Gaming and Entertainment
12.5.7.3.2.Education and Learning
12.5.7.3.3.Retail and E-commerce
12.5.7.3.4.Healthcare and Medical Devices
12.5.7.3.5.Industrial and Manufacturing
12.5.7.3.6.Automotive
12.5.7.3.7.Tourism and Hospitality
12.5.7.3.8.Marketing and Advertising
12.5.7.3.9.Real Estate and Architecture
12.5.7.3.10.Others
12.5.7.4.Benelux Union Augmented Reality Market Revenue (US$ Mn) and Forecasts, By Country
12.5.7.4.1.Belgium
12.5.7.4.2.The Netherlands
12.5.7.4.3.Luxembourg
12.5.8.Rest of Europe
12.5.8.1.Rest of Europe Augmented Reality Market Revenue (US$ Mn) and Forecasts, By Component
12.5.8.1.1.Hardware
12.5.8.1.2.Software
12.5.8.2.Rest of Europe Augmented Reality Market Revenue (US$ Mn) and Forecasts, By Technology
12.5.8.2.1.Marker Based
12.5.8.2.2.Markerless
12.5.8.2.2.1.Location-based AR
12.5.8.2.2.2.Projection-based AR
12.5.8.2.2.3.Overlay AR
12.5.8.2.2.4.Contour-based AR
12.5.8.3.Rest of Europe Augmented Reality Market Revenue (US$ Mn) and Forecasts, By Application
12.5.8.3.1.Gaming and Entertainment
12.5.8.3.2.Education and Learning
12.5.8.3.3.Retail and E-commerce
12.5.8.3.4.Healthcare and Medical Devices
12.5.8.3.5.Industrial and Manufacturing
12.5.8.3.6.Automotive
12.5.8.3.7.Tourism and Hospitality
12.5.8.3.8.Marketing and Advertising
12.5.8.3.9.Real Estate and Architecture
12.5.8.3.10.Others
12.6.Key Segment for Channeling Investments
12.6.1.By Country
12.6.2.By Component
12.6.3.By Technology
12.6.4.By Application
13.Asia Pacific Augmented Reality Market Analysis and Forecasts, 2024 – 2034
13.1.Overview
13.1.1.Asia Pacific Augmented Reality Market Revenue (US$ Mn)
13.2.Asia Pacific Augmented Reality Market Revenue (US$ Mn) and Forecasts, By Component
13.2.1.Hardware
13.2.2.Software
13.3.Asia Pacific Augmented Reality Market Revenue (US$ Mn) and Forecasts, By Technology
13.3.1.Marker Based
13.3.2.Markerless
13.3.2.1.Location-based AR
13.3.2.2.Projection-based AR
13.3.2.3.Overlay AR
13.3.2.4.Contour-based AR
13.4.Asia Pacific Augmented Reality Market Revenue (US$ Mn) and Forecasts, By Application
13.4.1.Gaming and Entertainment
13.4.2.Education and Learning
13.4.3.Retail and E-commerce
13.4.4.Healthcare and Medical Devices
13.4.5.Industrial and Manufacturing
13.4.6.Automotive
13.4.7.Tourism and Hospitality
13.4.8.Marketing and Advertising
13.4.9.Real Estate and Architecture
13.4.10.Others
13.5.Asia Pacific Augmented Reality Market Revenue (US$ Mn) and Forecasts, By Country
13.5.1.China
13.5.1.1.China Augmented Reality Market Revenue (US$ Mn) and Forecasts, By Component
13.5.1.1.1.Hardware
13.5.1.1.2.Software
13.5.1.2.China Augmented Reality Market Revenue (US$ Mn) and Forecasts, By Technology
13.5.1.2.1.Marker Based
13.5.1.2.2.Markerless
13.5.1.2.2.1.Location-based AR
13.5.1.2.2.2.Projection-based AR
13.5.1.2.2.3.Overlay AR
13.5.1.2.2.4.Contour-based AR
13.5.1.3.China Augmented Reality Market Revenue (US$ Mn) and Forecasts, By Application
13.5.1.3.1.Gaming and Entertainment
13.5.1.3.2.Education and Learning
13.5.1.3.3.Retail and E-commerce
13.5.1.3.4.Healthcare and Medical Devices
13.5.1.3.5.Industrial and Manufacturing
13.5.1.3.6.Automotive
13.5.1.3.7.Tourism and Hospitality
13.5.1.3.8.Marketing and Advertising
13.5.1.3.9.Real Estate and Architecture
13.5.1.3.10.Others
13.5.2.Japan
13.5.2.1.Japan Augmented Reality Market Revenue (US$ Mn) and Forecasts, By Component
13.5.2.1.1.Hardware
13.5.2.1.2.Software
13.5.2.2.Japan Augmented Reality Market Revenue (US$ Mn) and Forecasts, By Technology
13.5.2.2.1.Marker Based
13.5.2.2.2.Markerless
13.5.2.2.2.1.Location-based AR
13.5.2.2.2.2.Projection-based AR
13.5.2.2.2.3.Overlay AR
13.5.2.2.2.4.Contour-based AR
13.5.2.3.Japan Augmented Reality Market Revenue (US$ Mn) and Forecasts, By Application
13.5.2.3.1.Gaming and Entertainment
13.5.2.3.2.Education and Learning
13.5.2.3.3.Retail and E-commerce
13.5.2.3.4.Healthcare and Medical Devices
13.5.2.3.5.Industrial and Manufacturing
13.5.2.3.6.Automotive
13.5.2.3.7.Tourism and Hospitality
13.5.2.3.8.Marketing and Advertising
13.5.2.3.9.Real Estate and Architecture
13.5.2.3.10.Others
13.5.3.India
13.5.3.1.India Augmented Reality Market Revenue (US$ Mn) and Forecasts, By Component
13.5.3.1.1.Hardware
13.5.3.1.2.Software
13.5.3.2.India Augmented Reality Market Revenue (US$ Mn) and Forecasts, By Technology
13.5.3.2.1.Marker Based
13.5.3.2.2.Markerless
13.5.3.2.2.1.Location-based AR
13.5.3.2.2.2.Projection-based AR
13.5.3.2.2.3.Overlay AR
13.5.3.2.2.4.Contour-based AR
13.5.3.3.India Augmented Reality Market Revenue (US$ Mn) and Forecasts, By Application
13.5.3.3.1.Gaming and Entertainment
13.5.3.3.2.Education and Learning
13.5.3.3.3.Retail and E-commerce
13.5.3.3.4.Healthcare and Medical Devices
13.5.3.3.5.Industrial and Manufacturing
13.5.3.3.6.Automotive
13.5.3.3.7.Tourism and Hospitality
13.5.3.3.8.Marketing and Advertising
13.5.3.3.9.Real Estate and Architecture
13.5.3.3.10.Others
13.5.4.New Zealand
13.5.4.1.New Zealand Augmented Reality Market Revenue (US$ Mn) and Forecasts, By Component
13.5.4.1.1.Hardware
13.5.4.1.2.Software
13.5.4.2.New Zealand Augmented Reality Market Revenue (US$ Mn) and Forecasts, By Technology
13.5.4.2.1.Marker Based
13.5.4.2.2.Markerless
13.5.4.2.2.1.Location-based AR
13.5.4.2.2.2.Projection-based AR
13.5.4.2.2.3.Overlay AR
13.5.4.2.2.4.Contour-based AR
13.5.4.3.New Zealand Augmented Reality Market Revenue (US$ Mn) and Forecasts, By Application
13.5.4.3.1.Gaming and Entertainment
13.5.4.3.2.Education and Learning
13.5.4.3.3.Retail and E-commerce
13.5.4.3.4.Healthcare and Medical Devices
13.5.4.3.5.Industrial and Manufacturing
13.5.4.3.6.Automotive
13.5.4.3.7.Tourism and Hospitality
13.5.4.3.8.Marketing and Advertising
13.5.4.3.9.Real Estate and Architecture
13.5.4.3.10.Others
13.5.5.Australia
13.5.5.1.Australia Augmented Reality Market Revenue (US$ Mn) and Forecasts, By Component
13.5.5.1.1.Hardware
13.5.5.1.2.Software
13.5.5.2.Australia Augmented Reality Market Revenue (US$ Mn) and Forecasts, By Technology
13.5.5.2.1.Marker Based
13.5.5.2.2.Markerless
13.5.5.2.2.1.Location-based AR
13.5.5.2.2.2.Projection-based AR
13.5.5.2.2.3.Overlay AR
13.5.5.2.2.4.Contour-based AR
13.5.5.3.Australia Augmented Reality Market Revenue (US$ Mn) and Forecasts, By Application
13.5.5.3.1.Gaming and Entertainment
13.5.5.3.2.Education and Learning
13.5.5.3.3.Retail and E-commerce
13.5.5.3.4.Healthcare and Medical Devices
13.5.5.3.5.Industrial and Manufacturing
13.5.5.3.6.Automotive
13.5.5.3.7.Tourism and Hospitality
13.5.5.3.8.Marketing and Advertising
13.5.5.3.9.Real Estate and Architecture
13.5.5.3.10.Others
13.5.6.South Korea
13.5.6.1.South Korea Augmented Reality Market Revenue (US$ Mn) and Forecasts, By Component
13.5.6.1.1.Hardware
13.5.6.1.2.Software
13.5.6.2.South Korea Augmented Reality Market Revenue (US$ Mn) and Forecasts, By Technology
13.5.6.2.1.Marker Based
13.5.6.2.2.Markerless
13.5.6.2.2.1.Location-based AR
13.5.6.2.2.2.Projection-based AR
13.5.6.2.2.3.Overlay AR
13.5.6.2.2.4.Contour-based AR
13.5.6.3.South Korea Augmented Reality Market Revenue (US$ Mn) and Forecasts, By Application
13.5.6.3.1.Gaming and Entertainment
13.5.6.3.2.Education and Learning
13.5.6.3.3.Retail and E-commerce
13.5.6.3.4.Healthcare and Medical Devices
13.5.6.3.5.Industrial and Manufacturing
13.5.6.3.6.Automotive
13.5.6.3.7.Tourism and Hospitality
13.5.6.3.8.Marketing and Advertising
13.5.6.3.9.Real Estate and Architecture
13.5.6.3.10.Others
13.5.7.Southeast Asia
13.5.7.1.Southeast Asia Augmented Reality Market Revenue (US$ Mn) and Forecasts, By Component
13.5.7.1.1.Hardware
13.5.7.1.2.Software
13.5.7.2.Southeast Asia Augmented Reality Market Revenue (US$ Mn) and Forecasts, By Technology
13.5.7.2.1.Marker Based
13.5.7.2.2.Markerless
13.5.7.2.2.1.Location-based AR
13.5.7.2.2.2.Projection-based AR
13.5.7.2.2.3.Overlay AR
13.5.7.2.2.4.Contour-based AR
13.5.7.3.Southeast Asia Augmented Reality Market Revenue (US$ Mn) and Forecasts, By Application
13.5.7.3.1.Gaming and Entertainment
13.5.7.3.2.Education and Learning
13.5.7.3.3.Retail and E-commerce
13.5.7.3.4.Healthcare and Medical Devices
13.5.7.3.5.Industrial and Manufacturing
13.5.7.3.6.Automotive
13.5.7.3.7.Tourism and Hospitality
13.5.7.3.8.Marketing and Advertising
13.5.7.3.9.Real Estate and Architecture
13.5.7.3.10.Others
13.5.7.4.Southeast Asia Augmented Reality Market Revenue (US$ Mn) and Forecasts, By Country
13.5.7.4.1.Indonesia
13.5.7.4.2.Thailand
13.5.7.4.3.Malaysia
13.5.7.4.4.Singapore
13.5.7.4.5.Rest of Southeast Asia
13.5.8.Rest of Asia Pacific
13.5.8.1.Rest of Asia Pacific Augmented Reality Market Revenue (US$ Mn) and Forecasts, By Component
13.5.8.1.1.Hardware
13.5.8.1.2.Software
13.5.8.2.Rest of Asia Pacific Augmented Reality Market Revenue (US$ Mn) and Forecasts, By Technology
13.5.8.2.1.Marker Based
13.5.8.2.2.Markerless
13.5.8.2.2.1.Location-based AR
13.5.8.2.2.2.Projection-based AR
13.5.8.2.2.3.Overlay AR
13.5.8.2.2.4.Contour-based AR
13.5.8.3.Rest of Asia Pacific Augmented Reality Market Revenue (US$ Mn) and Forecasts, By Application
13.5.8.3.1.Gaming and Entertainment
13.5.8.3.2.Education and Learning
13.5.8.3.3.Retail and E-commerce
13.5.8.3.4.Healthcare and Medical Devices
13.5.8.3.5.Industrial and Manufacturing
13.5.8.3.6.Automotive
13.5.8.3.7.Tourism and Hospitality
13.5.8.3.8.Marketing and Advertising
13.5.8.3.9.Real Estate and Architecture
13.5.8.3.10.Others
13.6.Key Segment for Channeling Investments
13.6.1.By Country
13.6.2.By Component
13.6.3.By Technology
13.6.4.By Application
14.Middle East and Africa Augmented Reality Market Analysis and Forecasts, 2024 – 2034
14.1.Overview
14.1.1.Middle East and Africa Augmented Reality Market Revenue (US$ Mn)
14.2.Middle East and Africa Augmented Reality Market Revenue (US$ Mn) and Forecasts, By Component
14.2.1.Hardware
14.2.2.Software
14.3.Middle East and Africa Augmented Reality Market Revenue (US$ Mn) and Forecasts, By Technology
14.3.1.Marker Based
14.3.2.Markerless
14.3.2.1.Location-based AR
14.3.2.2.Projection-based AR
14.3.2.3.Overlay AR
14.3.2.4.Contour-based AR
14.4.Middle East and Africa Augmented Reality Market Revenue (US$ Mn) and Forecasts, By Application
14.4.1.Gaming and Entertainment
14.4.2.Education and Learning
14.4.3.Retail and E-commerce
14.4.4.Healthcare and Medical Devices
14.4.5.Industrial and Manufacturing
14.4.6.Automotive
14.4.7.Tourism and Hospitality
14.4.8.Marketing and Advertising
14.4.9.Real Estate and Architecture
14.4.10.Others
14.5.Middle East and Africa Augmented Reality Market Revenue (US$ Mn) and Forecasts, By Country
14.5.1.Saudi Arabia
14.5.1.1.Saudi Arabia Augmented Reality Market Revenue (US$ Mn) and Forecasts, By Component
14.5.1.1.1.Hardware
14.5.1.1.2.Software
14.5.1.2.Saudi Arabia Augmented Reality Market Revenue (US$ Mn) and Forecasts, By Technology
14.5.1.2.1.Marker Based
14.5.1.2.2.Markerless
14.5.1.2.2.1.Location-based AR
14.5.1.2.2.2.Projection-based AR
14.5.1.2.2.3.Overlay AR
14.5.1.2.2.4.Contour-based AR
14.5.1.3.Saudi Arabia Augmented Reality Market Revenue (US$ Mn) and Forecasts, By Application
14.5.1.3.1.Gaming and Entertainment
14.5.1.3.2.Education and Learning
14.5.1.3.3.Retail and E-commerce
14.5.1.3.4.Healthcare and Medical Devices
14.5.1.3.5.Industrial and Manufacturing
14.5.1.3.6.Automotive
14.5.1.3.7.Tourism and Hospitality
14.5.1.3.8.Marketing and Advertising
14.5.1.3.9.Real Estate and Architecture
14.5.1.3.10.Others
14.5.2.UAE
14.5.2.1.UAE Augmented Reality Market Revenue (US$ Mn) and Forecasts, By Component
14.5.2.1.1.Hardware
14.5.2.1.2.Software
14.5.2.2.UAE Augmented Reality Market Revenue (US$ Mn) and Forecasts, By Technology
14.5.2.2.1.Marker Based
14.5.2.2.2.Markerless
14.5.2.2.2.1.Location-based AR
14.5.2.2.2.2.Projection-based AR
14.5.2.2.2.3.Overlay AR
14.5.2.2.2.4.Contour-based AR
14.5.2.3.UAE Augmented Reality Market Revenue (US$ Mn) and Forecasts, By Application
14.5.2.3.1.Gaming and Entertainment
14.5.2.3.2.Education and Learning
14.5.2.3.3.Retail and E-commerce
14.5.2.3.4.Healthcare and Medical Devices
14.5.2.3.5.Industrial and Manufacturing
14.5.2.3.6.Automotive
14.5.2.3.7.Tourism and Hospitality
14.5.2.3.8.Marketing and Advertising
14.5.2.3.9.Real Estate and Architecture
14.5.2.3.10.Others
14.5.3.Egypt
14.5.3.1.Egypt Augmented Reality Market Revenue (US$ Mn) and Forecasts, By Component
14.5.3.1.1.Hardware
14.5.3.1.2.Software
14.5.3.2.Egypt Augmented Reality Market Revenue (US$ Mn) and Forecasts, By Technology
14.5.3.2.1.Marker Based
14.5.3.2.2.Markerless
14.5.3.2.2.1.Location-based AR
14.5.3.2.2.2.Projection-based AR
14.5.3.2.2.3.Overlay AR
14.5.3.2.2.4.Contour-based AR
14.5.3.3.Egypt Augmented Reality Market Revenue (US$ Mn) and Forecasts, By Application
14.5.3.3.1.Gaming and Entertainment
14.5.3.3.2.Education and Learning
14.5.3.3.3.Retail and E-commerce
14.5.3.3.4.Healthcare and Medical Devices
14.5.3.3.5.Industrial and Manufacturing
14.5.3.3.6.Automotive
14.5.3.3.7.Tourism and Hospitality
14.5.3.3.8.Marketing and Advertising
14.5.3.3.9.Real Estate and Architecture
14.5.3.3.10.Others
14.5.4.Kuwait
14.5.4.1.Kuwait Augmented Reality Market Revenue (US$ Mn) and Forecasts, By Component
14.5.4.1.1.Hardware
14.5.4.1.2.Software
14.5.4.2.Kuwait Augmented Reality Market Revenue (US$ Mn) and Forecasts, By Technology
14.5.4.2.1.Marker Based
14.5.4.2.2.Markerless
14.5.4.2.2.1.Location-based AR
14.5.4.2.2.2.Projection-based AR
14.5.4.2.2.3.Overlay AR
14.5.4.2.2.4.Contour-based AR
14.5.4.3.Kuwait Augmented Reality Market Revenue (US$ Mn) and Forecasts, By Application
14.5.4.3.1.Gaming and Entertainment
14.5.4.3.2.Education and Learning
14.5.4.3.3.Retail and E-commerce
14.5.4.3.4.Healthcare and Medical Devices
14.5.4.3.5.Industrial and Manufacturing
14.5.4.3.6.Automotive
14.5.4.3.7.Tourism and Hospitality
14.5.4.3.8.Marketing and Advertising
14.5.4.3.9.Real Estate and Architecture
14.5.4.3.10.Others
14.5.5.South Africa
14.5.5.1.South Africa Augmented Reality Market Revenue (US$ Mn) and Forecasts, By Component
14.5.5.1.1.Hardware
14.5.5.1.2.Software
14.5.5.2.South Africa Augmented Reality Market Revenue (US$ Mn) and Forecasts, By Technology
14.5.5.2.1.Marker Based
14.5.5.2.2.Markerless
14.5.5.2.2.1.Location-based AR
14.5.5.2.2.2.Projection-based AR
14.5.5.2.2.3.Overlay AR
14.5.5.2.2.4.Contour-based AR
14.5.5.3.South Africa Augmented Reality Market Revenue (US$ Mn) and Forecasts, By Application
14.5.5.3.1.Gaming and Entertainment
14.5.5.3.2.Education and Learning
14.5.5.3.3.Retail and E-commerce
14.5.5.3.4.Healthcare and Medical Devices
14.5.5.3.5.Industrial and Manufacturing
14.5.5.3.6.Automotive
14.5.5.3.7.Tourism and Hospitality
14.5.5.3.8.Marketing and Advertising
14.5.5.3.9.Real Estate and Architecture
14.5.5.3.10.Others
14.5.6.Rest of Middle East & Africa
14.5.6.1.Rest of Middle East & Africa Augmented Reality Market Revenue (US$ Mn) and Forecasts, By Component
14.5.6.1.1.Hardware
14.5.6.1.2.Software
14.5.6.2.Rest of Middle East & Africa Augmented Reality Market Revenue (US$ Mn) and Forecasts, By Technology
14.5.6.2.1.Marker Based
14.5.6.2.2.Markerless
14.5.6.2.2.1.Location-based AR
14.5.6.2.2.2.Projection-based AR
14.5.6.2.2.3.Overlay AR
14.5.6.2.2.4.Contour-based AR
14.5.6.3.Rest of Middle East & Africa Augmented Reality Market Revenue (US$ Mn) and Forecasts, By Application
14.5.6.3.1.Gaming and Entertainment
14.5.6.3.2.Education and Learning
14.5.6.3.3.Retail and E-commerce
14.5.6.3.4.Healthcare and Medical Devices
14.5.6.3.5.Industrial and Manufacturing
14.5.6.3.6.Automotive
14.5.6.3.7.Tourism and Hospitality
14.5.6.3.8.Marketing and Advertising
14.5.6.3.9.Real Estate and Architecture
14.5.6.3.10.Others
14.6.Key Segment for Channeling Investments
14.6.1.By Country
14.6.2.By Component
14.6.3.By Technology
14.6.4.By Application
15.Latin America Augmented Reality Market Analysis and Forecasts, 2024 – 2034
15.1.Overview
15.1.1.Latin America Augmented Reality Market Revenue (US$ Mn)
15.2.Latin America Augmented Reality Market Revenue (US$ Mn) and Forecasts, By Component
15.2.1.Hardware
15.2.2.Software
15.3.Latin America Augmented Reality Market Revenue (US$ Mn) and Forecasts, By Technology
15.3.1.Marker Based
15.3.2.Markerless
15.3.2.1.Location-based AR
15.3.2.2.Projection-based AR
15.3.2.3.Overlay AR
15.3.2.4.Contour-based AR
15.4.Latin America Augmented Reality Market Revenue (US$ Mn) and Forecasts, By Application
15.4.1.Gaming and Entertainment
15.4.2.Education and Learning
15.4.3.Retail and E-commerce
15.4.4.Healthcare and Medical Devices
15.4.5.Industrial and Manufacturing
15.4.6.Automotive
15.4.7.Tourism and Hospitality
15.4.8.Marketing and Advertising
15.4.9.Real Estate and Architecture
15.4.10.Others
15.5.Latin America Augmented Reality Market Revenue (US$ Mn) and Forecasts, By Country
15.5.1.Brazil
15.5.1.1.Brazil Augmented Reality Market Revenue (US$ Mn) and Forecasts, By Component
15.5.1.1.1.Hardware
15.5.1.1.2.Software
15.5.1.2.Brazil Augmented Reality Market Revenue (US$ Mn) and Forecasts, By Technology
15.5.1.2.1.Marker Based
15.5.1.2.2.Markerless
15.5.1.2.2.1.Location-based AR
15.5.1.2.2.2.Projection-based AR
15.5.1.2.2.3.Overlay AR
15.5.1.2.2.4.Contour-based AR
15.5.1.3.Brazil Augmented Reality Market Revenue (US$ Mn) and Forecasts, By Application
15.5.1.3.1.Gaming and Entertainment
15.5.1.3.2.Education and Learning
15.5.1.3.3.Retail and E-commerce
15.5.1.3.4.Healthcare and Medical Devices
15.5.1.3.5.Industrial and Manufacturing
15.5.1.3.6.Automotive
15.5.1.3.7.Tourism and Hospitality
15.5.1.3.8.Marketing and Advertising
15.5.1.3.9.Real Estate and Architecture
15.5.1.3.10.Others
15.5.2.Argentina
15.5.2.1.Argentina Augmented Reality Market Revenue (US$ Mn) and Forecasts, By Component
15.5.2.1.1.Hardware
15.5.2.1.2.Software
15.5.2.2.Argentina Augmented Reality Market Revenue (US$ Mn) and Forecasts, By Technology
15.5.2.2.1.Marker Based
15.5.2.2.2.Markerless
15.5.2.2.2.1.Location-based AR
15.5.2.2.2.2.Projection-based AR
15.5.2.2.2.3.Overlay AR
15.5.2.2.2.4.Contour-based AR
15.5.2.3.Argentina Augmented Reality Market Revenue (US$ Mn) and Forecasts, By Application
15.5.2.3.1.Gaming and Entertainment
15.5.2.3.2.Education and Learning
15.5.2.3.3.Retail and E-commerce
15.5.2.3.4.Healthcare and Medical Devices
15.5.2.3.5.Industrial and Manufacturing
15.5.2.3.6.Automotive
15.5.2.3.7.Tourism and Hospitality
15.5.2.3.8.Marketing and Advertising
15.5.2.3.9.Real Estate and Architecture
15.5.2.3.10.Others
15.5.3.Rest of Latin America
15.5.3.1.Rest of Latin America Augmented Reality Market Revenue (US$ Mn) and Forecasts, By Component
15.5.3.1.1.Hardware
15.5.3.1.2.Software
15.5.3.2.Rest of Latin America Augmented Reality Market Revenue (US$ Mn) and Forecasts, By Technology
15.5.3.2.1.Marker Based
15.5.3.2.2.Markerless
15.5.3.2.2.1.Location-based AR
15.5.3.2.2.2.Projection-based AR
15.5.3.2.2.3.Overlay AR
15.5.3.2.2.4.Contour-based AR
15.5.3.3.Rest of Latin America Augmented Reality Market Revenue (US$ Mn) and Forecasts, By Application
15.5.3.3.1.Gaming and Entertainment
15.5.3.3.2.Education and Learning
15.5.3.3.3.Retail and E-commerce
15.5.3.3.4.Healthcare and Medical Devices
15.5.3.3.5.Industrial and Manufacturing
15.5.3.3.6.Automotive
15.5.3.3.7.Tourism and Hospitality
15.5.3.3.8.Marketing and Advertising
15.5.3.3.9.Real Estate and Architecture
15.5.3.3.10.Others
15.6.Key Segment for Channeling Investments
15.6.1.By Country
15.6.2.By Component
15.6.3.By Technology
15.6.4.By Application
16.Competitive Benchmarking
16.1.Brand Benchmarking
16.2.Market Share Analysis, 2023
16.3.Global Presence and Growth Strategies
16.3.1.Mergers and Acquisitions
16.3.2.Product Launches
16.3.3.Investments Trends
16.3.4.R&D Initiatives
17.Player Profiles
17.1.Apple, Inc.
17.1.1.Company Details
17.1.2.Company Overview
17.1.3.Product Offerings
17.1.4.Key Developments
17.1.5.Financial Analysis
17.1.6.SWOT Analysis
17.1.7.Business Strategies
17.2.Blippar Group Limited
17.2.1.Company Details
17.2.2.Company Overview
17.2.3.Product Offerings
17.2.4.Key Developments
17.2.5.Financial Analysis
17.2.6.SWOT Analysis
17.2.7.Business Strategies
17.3.Google LLC
17.3.1.Company Details
17.3.2.Company Overview
17.3.3.Product Offerings
17.3.4.Key Developments
17.3.5.Financial Analysis
17.3.6.SWOT Analysis
17.3.7.Business Strategies
17.4.Lenovo
17.4.1.Company Details
17.4.2.Company Overview
17.4.3.Product Offerings
17.4.4.Key Developments
17.4.5.Financial Analysis
17.4.6.SWOT Analysis
17.4.7.Business Strategies
17.5.Magic Leap, Inc.
17.5.1.Company Details
17.5.2.Company Overview
17.5.3.Product Offerings
17.5.4.Key Developments
17.5.5.Financial Analysis
17.5.6.SWOT Analysis
17.5.7.Business Strategies
17.6.Meta
17.6.1.Company Details
17.6.2.Company Overview
17.6.3.Product Offerings
17.6.4.Key Developments
17.6.5.Financial Analysis
17.6.6.SWOT Analysis
17.6.7.Business Strategies
17.7.Microsoft 
17.7.1.Company Details
17.7.2.Company Overview
17.7.3.Product Offerings
17.7.4.Key Developments
17.7.5.Financial Analysis
17.7.6.SWOT Analysis
17.7.7.Business Strategies
17.8.PTC
17.8.1.Company Details
17.8.2.Company Overview
17.8.3.Product Offerings
17.8.4.Key Developments
17.8.5.Financial Analysis
17.8.6.SWOT Analysis
17.8.7.Business Strategies
17.9.Snap, Inc.
17.9.1.Company Details
17.9.2.Company Overview
17.9.3.Product Offerings
17.9.4.Key Developments
17.9.5.Financial Analysis
17.9.6.SWOT Analysis
17.9.7.Business Strategies
17.10.Sony Semiconductor Solutions Corporation
17.10.1.Company Details
17.10.2.Company Overview
17.10.3.Product Offerings
17.10.4.Key Developments
17.10.5.Financial Analysis
17.10.6.SWOT Analysis
17.10.7.Business Strategies
17.11.TeamViewer AG
17.11.1.Company Details
17.11.2.Company Overview
17.11.3.Product Offerings
17.11.4.Key Developments
17.11.5.Financial Analysis
17.11.6.SWOT Analysis
17.11.7.Business Strategies
17.12.Visometry GmbH 
17.12.1.Company Details
17.12.2.Company Overview
17.12.3.Product Offerings
17.12.4.Key Developments
17.12.5.Financial Analysis
17.12.6.SWOT Analysis
17.12.7.Business Strategies
17.13.Vuzix
17.13.1.Company Details
17.13.2.Company Overview
17.13.3.Product Offerings
17.13.4.Key Developments
17.13.5.Financial Analysis
17.13.6.SWOT Analysis
17.13.7.Business Strategies
17.14.Wikitude
17.14.1.Company Details
17.14.2.Company Overview
17.14.3.Product Offerings
17.14.4.Key Developments
17.14.5.Financial Analysis
17.14.6.SWOT Analysis
17.14.7.Business Strategies
17.15.Xiaomi
17.15.1.Company Details
17.15.2.Company Overview
17.15.3.Product Offerings
17.15.4.Key Developments
17.15.5.Financial Analysis
17.15.6.SWOT Analysis
17.15.7.Business Strategies
17.16.Zappar Ltd
17.16.1.Company Details
17.16.2.Company Overview
17.16.3.Product Offerings
17.16.4.Key Developments
17.16.5.Financial Analysis
17.16.6.SWOT Analysis
17.16.7.Business Strategies
17.17.Other Industry Participants
18.Key Findings

.

Note: This ToC is tentative and can be changed according to the research study conducted during the course of report completion.

.

**Exclusive for Multi-User and Enterprise User.

.

.

.

Global Augmented Reality Market

By Component

  • Hardware
  • Software

By Technology

  • Marker Based
  • Markerless
    • Location-based AR
    • Projection-based AR
    • Overlay AR
    • Contour-based AR

By Application

  • Gaming and Entertainment
  • Education and Learning
  • Retail and E-commerce
  • Healthcare and Medical Devices
  • Industrial and Manufacturing
  • Automotive
  • Tourism and Hospitality
  • Marketing and Advertising
  • Real Estate and Architecture
  • Others

By Region

  • North America (U.S., Canada, Mexico, Rest of North America)
  • Europe (France, The UK, Spain, Germany, Italy, Nordic Countries (Denmark, Finland, Iceland, Sweden, Norway), Benelux Union (Belgium, The Netherlands, Luxembourg), Rest of Europe)
  • Asia Pacific (China, Japan, India, New Zealand, Australia, South Korea, Southeast Asia (Indonesia, Thailand, Malaysia, Singapore, Rest of Southeast Asia), Rest of Asia Pacific)
  • Middle East & Africa (Saudi Arabia, UAE, Egypt, Kuwait, South Africa, Rest of Middle East & Africa)
  • Latin America (Brazil, Argentina, Rest of Latin America)

.

The Niche Research approach encompasses both primary and secondary research methods to provide comprehensive insights. While primary research is the cornerstone of our studies, we also incorporate secondary research sources such as company annual reports, premium industry databases, press releases, industry journals, and white papers.

Within our primary research, we actively engage with various industry stakeholders, conducting paid interviews and surveys. Our meticulous analysis extends to every market participant in major countries, allowing us to thoroughly examine their portfolios, calculate market shares, and segment revenues.

Our data collection primarily focuses on individual countries within our research scope, enabling us to estimate regional market sizes. Typically, we employ a bottom-up approach, meticulously tracking trends in different countries. We analyze growth drivers, constraints, technological innovations, and opportunities for each country, ultimately arriving at regional figures.Our process begins by examining the growth prospects of each country. Building upon these insights, we project growth and trends for the entire region. Finally, we utilize our proprietary model to refine estimations and forecasts.

Our data validation standards are integral to ensuring the reliability and accuracy of our research findings. Here’s a breakdown of our data validation processes and the stakeholders we engage with during our primary research:

  • Supply Side Analysis: We initiate a supply side analysis by directly contacting market participants, through telephonic interviews and questionnaires containing both open-ended and close-ended questions. We gather information on their portfolios, segment revenues, developments, and growth strategies.
  • Demand Side Analysis: To gain insights into adoption trends and consumer preferences, we reach out to target customers and users (non-vendors). This information forms a vital part of the qualitative analysis section of our reports, covering market dynamics, adoption trends, consumer behavior, spending patterns, and other related aspects.
  • Consultant Insights: We tap into the expertise of our partner consultants from around the world to obtain their unique viewpoints and perspectives. Their insights contribute to a well-rounded understanding of the markets under investigation.
  • In-House Validation: To ensure data accuracy and reliability, we conduct cross-validation of data points and information through our in-house team of consultants and utilize advanced data modeling tools for thorough verification.

The forecasts we provide are based on a comprehensive assessment of various factors, including:

  • Market Trends and Past Performance (Last Five Years): We accurately analyze market trends and performance data from preceding five years to identify historical patterns and understand the market’s evolution.
  • Historical Performance and Growth of Market Participants: We assess the historical performance and growth trajectories of key market participants. This analysis provides insights into the competitive landscape and individual company strategies.
  • Market Determinants Impact Analysis (Next Eight Years): We conduct a rigorous analysis of the factors that are projected to influence the market over the next eight years. This includes assessing both internal and external determinants that can shape market dynamics.
  • Drivers and Challenges for the Forecast Period:Identify the factors expected to drive market growth during the forecast period, as well as the challenges that the industry may face. This analysis aids in deriving an accurate growth rate projection.
  • New Acquisitions, Collaborations, or Partnerships: We keep a close watch on any new acquisitions, collaborations, or partnerships within the industry. These developments can have a significant impact on market dynamics and competitiveness.
  • Macro and Micro Factors Analysis:A thorough examination of both macro-level factors (e.g., economic trends, regulatory changes) and micro-level factors (e.g., technological advancements, consumer preferences) that may influence the market during the forecast period.
  • End-User Sentiment Analysis: To understand the market from the end-user perspective, we conduct sentiment analysis. This involves assessing the sentiment, preferences, and feedback of the end-users, which can provide valuable insights into market trends.
  • Perspective of Primary Participants: Insights gathered directly from primary research participants play a crucial role in shaping our forecasts. Their perspectives and experiences provide valuable qualitative data.
  • Year-on-Year Growth Trend: We utilize a year-on-year growth trend based on historical market growth and expected future trends. This helps in formulating our growth projections, aligning them with the market’s historical performance.

Research process adopted by TNR involves multiple stages, including data collection, validation, quality checks, and presentation. It’s crucial that the data and information we provide add value to your existing market understanding and expertise. We have also established partnerships with business consulting, research, and survey organizations across regions and globally to collaborate on regional analysis and data validation, ensuring the highest level of accuracy and reliability in our reports.


Procure Comprehensive Study of

Global Augmented Reality Market

Online Only

  • Online Access
  • Read Only File
  • Validity 3 Months
  • Print, Copy, Paste & Download
  • PPT, Excel
  • Cost-Free Report in the Next Update
$3300
Buy Now

Single User

  • Access to One User on One System
  • Read Only File
  • Validity 6 Months
  • Limited Print,Copy, Paste
  • PPT, Excel
  • Cost-Free Report in the Next Update
$4200
Buy Now

Multi User

  • Access to Fiver Users
  • PDF File
  • Validity 1 Year
  • Upto FivePrints
  • Cost-Free Report in the Next Update
  • PPT, Excel
$6000
Buy Now

Enterprise User

  • Access to Unlimited Users
  • PDF, PPT, Excel
  • Unlimited Validity, Prints&Downloads
  • 1 Hour Cost-Free & Dedicated Analyst Support
  • 10% Cost-Free Customization
  • Cost-Free Report Update Twice in a Year
  • Recommendations for Business Strategies
  • Authorization to Quote TNR, The Niche Research
$7300
Buy Now

Library Access

  • Online Access to Content Publications
  • Access Player Profiles Online
  • Get Immediate Access to Newly Added Content
  • Acquire 12 PDF Downloads
  • Acquire 5 Excel Data Sets
  • Gain Access to 290+ PDFs of Company Profiles
  • Round-the-clock Email and Phone Assistance
  • Dashboard Usage and Trends
  • Renewal & Upgrade Assistance
  • Assessing Customization Options and Alerts for New Reports
$10788
Buy Now
*Taxes/Fees, if applicable will be added during checkout. All prices in USD

Why TNR The Niche Research?

  • Unwavering Commitment to Excellence

  • Veteran Team of Researchers

  • Accurate and Timely Insights

  • Ethical Practices and Customized Service

  • Uninterrupted Availability Around the Clock

Scroll to Top