Global Biofuels Market By Sources, By Type, By Form, By Application & By Region Segmental Trends and Forecasts, 2023 – 2031
- Industry: Energy & Power
- Report ID: TNR-110-902
- Number of Pages: 420
- Table/Charts : Yes
- October, 2023
- Base Year : 2024
- No. of Companies : 10+
- No. of Countries : 29
- Views : 10262
- Covid Impact Covered: Yes
- War Impact Covered: Yes
- Formats : PDF, Excel, PPT
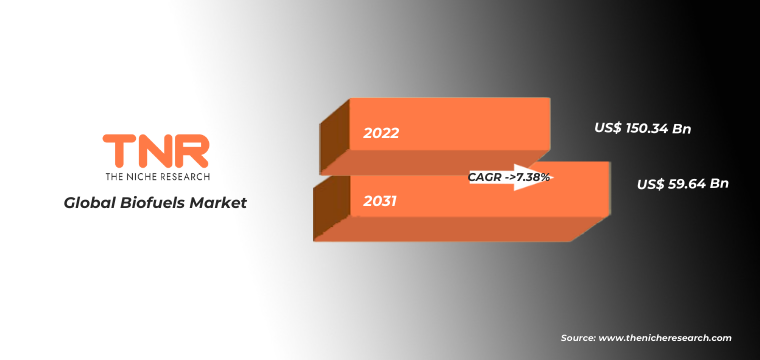
Global Biofuels Market Accounted for US$ 150.34 Bn in 2022, Growing at a CAGR of 7.38% over the Forecast Period (2023 – 2031)
Biofuel is a type of renewable energy derived from organic materials, such as plants, algae, and organic waste. It is considered an alternative to fossil fuels like coal, oil, and natural gas because it can be produced from sustainable sources and has the potential to reduce greenhouse gas emissions and dependence on non-renewable resources. Biofuels are used for various applications, including transportation, electricity generation, and industrial processes. The global biofuels market has witnessed significant growth in recent years, driven by increasing environmental concerns, government regulations promoting sustainable energy sources, and advancements in biofuel production technologies.
Global Biofuels Market Revenue & Volume Forecast, (US$ Million & Thousand Units), 2020 – 2031
The biofuels market is undergoing significant changes, with a notable increase in demand for renewable diesel, ethanol, and biodiesel. This growth is attributed to a combination of factors including government policies, recovery from the impacts of the Covid-19 pandemic, and increasing awareness of the need for greenhouse gas (GHG) reductions. A few key trends and drivers behind the rising demand for these biofuels market is mentioned below:
Renewable Diesel Demand: The demand for renewable diesel is projected to experience a nearly threefold increase from 2020 to 2026. This surge in demand is primarily driven by policies and regulations implemented in the United States and Europe. Both regions have established frameworks that incentivize the use of low-GHG intensity fuels and set limits on certain biofuel feedstocks. Renewable diesel stands out as a favorable option due to its ability to be produced with low GHG emissions using waste and residue feedstocks. Furthermore, its potential for higher blending levels compared to biodiesel adds to its appeal.
Ethanol Demand: While renewable diesel demand is expected to grow significantly, ethanol demand is also on the rise. The growth in ethanol demand is driven by a combination of factors. In Asia, countries like India are working toward ambitious ethanol blending targets, with a goal of reaching 20% ethanol blending by 2025. Similarly, Indonesia’s plan to implement a 40% biodiesel blending mandate in 2022 has further stimulated biodiesel expansion. These efforts, combined with increasing transport fuel demand, contribute to the growth in biofuels market.
Biodiesel Growth: The demand for biodiesel is supported by policies in various regions, especially in Latin America. Brazil’s biofuel policies, coupled with a rising demand for gasoline and diesel, are driving up the use of biodiesel. The country’s focus on renewable energy sources aligns with its efforts to reduce carbon emissions and promotes sustainable practices.
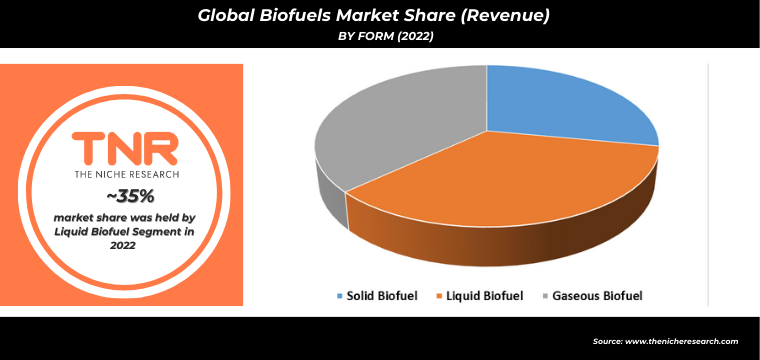
Liquid biofuels have historically held the highest market share within the biofuels market. This is largely due to their compatibility with existing transportation infrastructure, ease of distribution, and ability to directly replace or blend with conventional liquid fossil fuels. Liquid biofuels, such as ethanol and biodiesel, are compatible with existing transportation and distribution infrastructure. This compatibility makes it easier for these biofuels to seamlessly integrate into the current fuel supply chain, including storage, transportation, and dispensing systems. Research and development efforts in the biofuels market have aimed at improving the efficiency, yield, and sustainability of liquid biofuel production. These advancements will likely further strengthen the position of liquid biofuels in the market.
Many regions and countries have established regulatory mandates and incentives to promote the use of renewable fuels, including liquid biofuels. These policies require a certain percentage of biofuels to be blended with fossil fuels, further driving the demand for liquid biofuels. For example, The European Union’s Renewable Energy Directive (RED) sets targets for the use of renewable energy in the transport sector.
The directive requires member states to achieve a minimum share of renewable energy in their transport fuels, with liquid biofuels playing a significant role. The RED II, which came into effect in 2021, increased the target for renewable energy use in transport to 14% by 2030. The EU also has a sustainability criteria framework to ensure that biofuels used, meet certain environmental standards.
The dominance of the transportation segment within the global biofuels market underscores the pivotal role that biofuels play in decarbonizing the transportation sector and reducing greenhouse gas emissions. In 2022, the transportation segment accounted for the majority of the industry’s revenue, with a share of ~71%. This significant market share highlights the widespread adoption of biofuels in various modes of transportation and reflects the industry’s contribution to achieving sustainability and energy security goals.
Several factors contribute to the transportation segment’s dominance in the biofuels market:
- Vehicle Fueling: Biofuels, such as ethanol and biodiesel, are widely used as fuel options in the transportation sector. They are compatible with existing vehicle engines and fueling infrastructure, making it relatively straightforward for consumers to transition to biofuels.
- Emission Reduction: One of the primary motivations for adopting biofuels in transportation is their ability to reduce carbon emissions compared to conventional fossil fuels. Biofuels contribute to cleaner air quality and help countries meet their climate commitments.
- Renewable Energy Targets: Biofuels contribute directly to achieving renewable energy targets set by governments and international organizations. These drives have increased demand for biofuels market in the transportation sector.
- Infrastructure Compatibility: Liquid biofuels, such as ethanol and biodiesel, can be easily integrated into the existing fuel distribution network. This compatibility makes it feasible to supply and distribute biofuels to a broad range of consumers.
- Consumer Acceptance: With biofuels readily available at fueling stations, consumers have the option to choose cleaner alternatives when refueling their vehicles. This ease of access and choice contributes to their adoption.
- Research and Innovation: Continued research and innovation in biofuel production technologies and feedstock utilization enhance the efficiency and sustainability of biofuels, further bolstering their appeal in the transportation sector.
Competitive Landscape
Key operating players in the global biofuels market are:
- Abengoa
- Air Liquide
- Alto Ingredients Inc.
- Archer Daniels Midland Company
- Bunge North America, Inc.
- Butamax Advanced Biofuels LLC
- CropEnergies AG
- Gevo
- Green Plains Inc.
- Petrobras
- Renewable Energy Group, Inc.
- Royal Dutch Shell Plc
- Valero Energy Corp.
- Wilmar International Ltd.
- Other Market Participants
Global Biofuels Market Report Coverage
| Report Specifications | Details |
| Market Revenue in 2022 | US$ 150.34 Billion |
| Market Size Forecast by 2031 | US$ 356.3 Billion |
| Growth Rate (CAGR) | 7.38 % |
| Historic Data | 2020 – 2021 |
| Base Year for Estimation | 2022 |
| Forecast Period | 2023 – 2031 |
| Report Inclusions | Market Size & Estimates, Market Dynamics, Competitive Scenario, Trends, Growth Factors, Market Determinants, Key Investment Segmentation, Product/Service/Solutions Benchmarking |
| Segments Covered | By Sources, By Type, By Form, By Application |
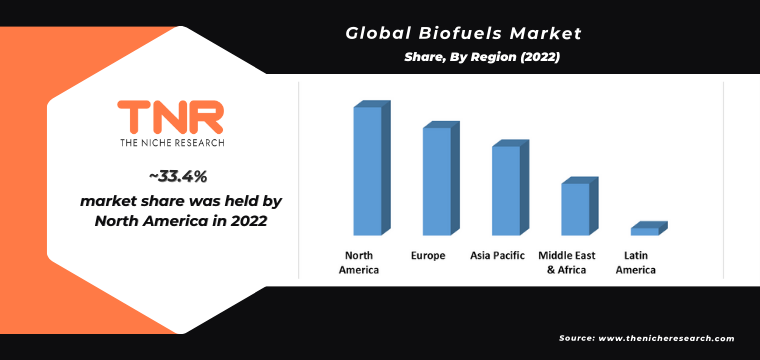
| Regions Covered | North America, Europe, Asia Pacific, Middle East & Africa, Latin America |
| Countries Covered | U.S., Canada, Mexico, Rest of North America, France, The UK, Spain, Germany, Italy, Nordic Countries (Denmark, Finland, Iceland, Sweden, Norway), Benelux Union (Belgium, The Netherlands, Luxembourg), Rest of Europe, China, Japan, India, New Zealand, Australia, South Korea, Southeast Asia (Indonesia, Thailand, Malaysia, Singapore, Rest of Southeast Asia), Rest of Asia Pacific, Saudi Arabia, UAE, Egypt, Kuwait, South Africa, Rest of Middle East & Africa, Brazil, Argentina, Rest of Latin America |
| Key Players | Abengoa, Air Liquide, Alto Ingredients Inc., Archer Daniels Midland Company, Bunge North America, Inc., Butamax Advanced Biofuels LLC, CropEnergies AG, Gevo, Green Plains Inc., Petrobras, Renewable Energy Group, Inc., Royal Dutch Shell Plc, Valero Energy Corp., Wilmar International Ltd.Other Industry Participants |
| Customization Scope | Customization allows for the inclusion/modification of content pertaining to geographical regions, countries, and specific market segments. |
| Pricing & Procurement Options | Explore purchase options tailored to your specific research requirements |
| Contact Details | Consult With Our Expert
Japan – +81 South Korea – +82-808- 703-126 Saudi Arabia – + United States: +1 302-232-5106 United Kingdom: +447537105080 E-mail: askanexpert@thenicheresearch.com
|
Global Biofuels Market
By Form
- Solid Biofuel
- Liquid Biofuel
- Gaseous Biofuel
By Type
- Ethanol
- Biodiesel
- Renewable Diesel
- Others
By Sources
- Sugar and Starch Crops
- Fiber and Grass Cellulosic Crops
- Oil Crops
- Crop Residues, Manures and Organic Wastes
- Wood Products
By Application
- Aviation
- Transport
- Marine and Shipping
- Agriculture and Farming
- Electricity Generation
- Heating and Cooling
- Others
By Region
- North America (U.S., Canada, Mexico, Rest of North America)
- Europe (France, The UK, Spain, Germany, Italy, Nordic Countries (Denmark, Finland, Iceland, Sweden, Norway), Benelux Union (Belgium, The Netherlands, Luxembourg), Rest of Europe)
- Asia Pacific (China, Japan, India, New Zealand, Australia, South Korea, Southeast Asia (Indonesia, Thailand, Malaysia, Singapore, Rest of Southeast Asia), Rest of Asia Pacific)
- Middle East & Africa (Saudi Arabia, UAE, Egypt, Kuwait, South Africa, Rest of Middle East & Africa)
- Latin America (Brazil, Argentina, Rest of Latin America)
- Report Coverage and Deliverable
Table of Contents
**Exclusive for Multi-User and Enterprise User.
Global Biofuels Market Segmentation
By Form Outlook (Revenue & Volume, USD Billion & Thousand Units, 2020 – 2031)
By Type Outlook (Revenue & Volume, USD Billion & Thousand Units, 2020 – 2031)
By Sources Outlook (Revenue & Volume, USD Billion & Thousand Units, 2020 – 2031)
By Application Outlook (Revenue & Volume, USD Billion & Thousand Units, 2020 – 2031)
By Region Outlook (Revenue & Volume, USD Billion & Thousand Units, 2020 – 2031)
**Note: The report covers cross-segmentation analysis by region further into countries
The Niche Research approach encompasses both primary and secondary research methods to provide comprehensive insights. While primary research is the cornerstone of our studies, we also incorporate secondary research sources such as company annual reports, premium industry databases, press releases, industry journals, and white papers.
Within our primary research, we actively engage with various industry stakeholders, conducting paid interviews and surveys. Our meticulous analysis extends to every market participant in major countries, allowing us to thoroughly examine their portfolios, calculate market shares, and segment revenues.
Our data collection primarily focuses on individual countries within our research scope, enabling us to estimate regional market sizes. Typically, we employ a bottom-up approach, meticulously tracking trends in different countries. We analyze growth drivers, constraints, technological innovations, and opportunities for each country, ultimately arriving at regional figures.Our process begins by examining the growth prospects of each country. Building upon these insights, we project growth and trends for the entire region. Finally, we utilize our proprietary model to refine estimations and forecasts.
Our data validation standards are integral to ensuring the reliability and accuracy of our research findings. Here’s a breakdown of our data validation processes and the stakeholders we engage with during our primary research:
- Supply Side Analysis: We initiate a supply side analysis by directly contacting market participants, through telephonic interviews and questionnaires containing both open-ended and close-ended questions. We gather information on their portfolios, segment revenues, developments, and growth strategies.
- Demand Side Analysis: To gain insights into adoption trends and consumer preferences, we reach out to target customers and users (non-vendors). This information forms a vital part of the qualitative analysis section of our reports, covering market dynamics, adoption trends, consumer behavior, spending patterns, and other related aspects.
- Consultant Insights: We tap into the expertise of our partner consultants from around the world to obtain their unique viewpoints and perspectives. Their insights contribute to a well-rounded understanding of the markets under investigation.
- In-House Validation: To ensure data accuracy and reliability, we conduct cross-validation of data points and information through our in-house team of consultants and utilize advanced data modeling tools for thorough verification.
The forecasts we provide are based on a comprehensive assessment of various factors, including:
- Market Trends and Past Performance (Last Five Years): We accurately analyze market trends and performance data from preceding five years to identify historical patterns and understand the market’s evolution.
- Historical Performance and Growth of Market Participants: We assess the historical performance and growth trajectories of key market participants. This analysis provides insights into the competitive landscape and individual company strategies.
- Market Determinants Impact Analysis (Next Eight Years): We conduct a rigorous analysis of the factors that are projected to influence the market over the next eight years. This includes assessing both internal and external determinants that can shape market dynamics.
- Drivers and Challenges for the Forecast Period:Identify the factors expected to drive market growth during the forecast period, as well as the challenges that the industry may face. This analysis aids in deriving an accurate growth rate projection.
- New Acquisitions, Collaborations, or Partnerships: We keep a close watch on any new acquisitions, collaborations, or partnerships within the industry. These developments can have a significant impact on market dynamics and competitiveness.
- Macro and Micro Factors Analysis:A thorough examination of both macro-level factors (e.g., economic trends, regulatory changes) and micro-level factors (e.g., technological advancements, consumer preferences) that may influence the market during the forecast period.
- End-User Sentiment Analysis: To understand the market from the end-user perspective, we conduct sentiment analysis. This involves assessing the sentiment, preferences, and feedback of the end-users, which can provide valuable insights into market trends.
- Perspective of Primary Participants: Insights gathered directly from primary research participants play a crucial role in shaping our forecasts. Their perspectives and experiences provide valuable qualitative data.
- Year-on-Year Growth Trend: We utilize a year-on-year growth trend based on historical market growth and expected future trends. This helps in formulating our growth projections, aligning them with the market’s historical performance.
Research process adopted by TNR involves multiple stages, including data collection, validation, quality checks, and presentation. It’s crucial that the data and information we provide add value to your existing market understanding and expertise. We have also established partnerships with business consulting, research, and survey organizations across regions and globally to collaborate on regional analysis and data validation, ensuring the highest level of accuracy and reliability in our reports.