Global Biopolymers in Electrical & Electronics Market, By Type, By Application, By Region & Segmental Insights Trends and Forecast, 2023 – 2031
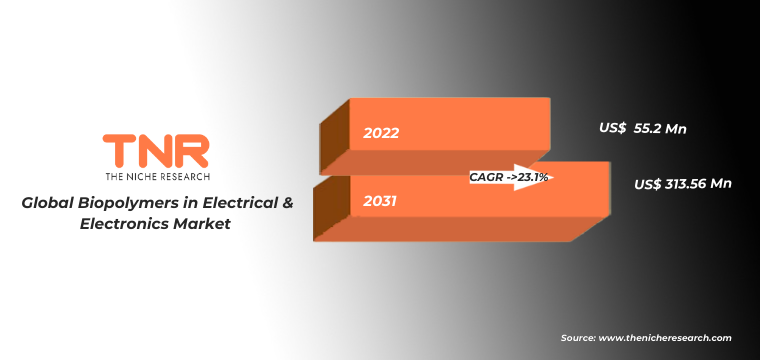
Biopolymers in Electrical & Electronics are sustainable materials used to create components like casings and connectors. They reduce environmental impact by replacing traditional plastics, promoting eco-friendly practices in manufacturing and disposal, thus aligning with the growing demand for green technologies globally. In terms of revenue, the global biopolymers in electrical & electronics market was worth US$ 55.2 Mn in 2022, anticipated to witness CAGR of 23.1% during 2023 – 2031.
Global Biopolymers in Electrical & Electronics Market Revenue & Volume Forecast, (US$ Million & Tons), 2015 – 2031
Trends in the Global Biopolymers in Electrical & Electronics Market
- There is a rising awareness among consumers and manufacturers about the environmental impact of electronic waste. As a result, companies are increasingly shifting towards using biopolymers in their products. This trend is being fueled by ongoing efforts to reduce plastic pollution and carbon emissions. Manufacturers in the U.S. and around the world are actively seeking biopolymer solutions to align with eco-conscious consumer preferences, leading to a surge in demand for sustainable materials.
- Government bodies in various countries are introducing stringent regulations aimed at reducing the use of traditional plastics in electronics. Simultaneously, they are offering incentives and tax benefits to companies adopting eco-friendly materials like biopolymers. This dual approach creates a favorable environment for the adoption of biopolymers in the electrical & electronics market. Companies are compelled to comply with these regulations and are encouraged by financial benefits, thus driving the integration of biopolymers into their product lines, boosting the biopolymers in electrical & electronics market.
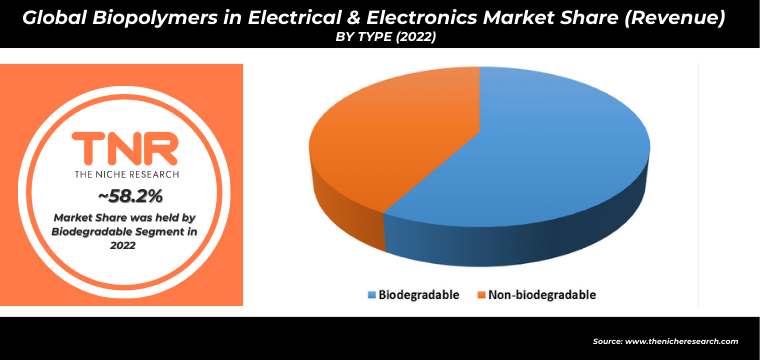
Biodegradable segment has gained popularity in recent years and is anticipated to be the fastest growing segment in the global biopolymers in electrical & electronics market during the forecast period. This growth is driven by increased environmental awareness and regulatory initiatives. Biodegradable biopolymers have gained significant traction. Regulatory support, exemplified by recent US legislation encouraging eco-friendly materials in electronics, is propelling their growth. Furthermore, consumer demand for sustainable products is on the rise, with eco-consciousness driving adoption.
Wires and Cables application segment had the highest share in the global biopolymers in electrical & electronics market in 2022. According to the study, irregularities along tooth edges, such as chips and unevenness, are reported as the most common cosmetic concern among patients, representing nearly 40% of cases. These imperfections often result from daily wear and tear, making them widespread. Dental contouring efficiently addresses such irregularities, offering a quick and cost-effective solution. Patients increasingly opt for this minimally invasive procedure to enhance their smiles. The high demand for irregular edge correction, driven by patient preferences and a minimally invasive approach, positions it as a dominant segment in the biopolymers in electrical & electronics market.
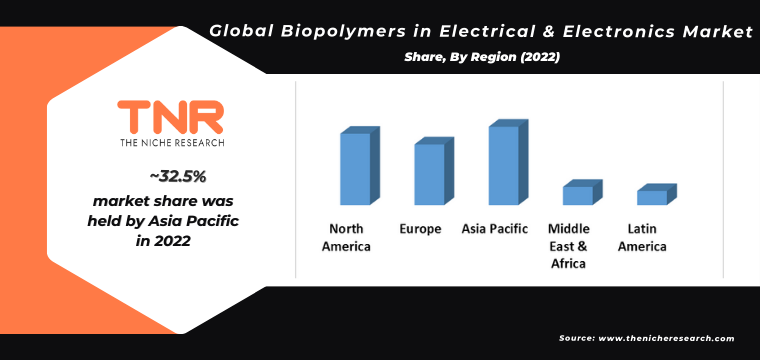
Latin America is expected to witness the highest growth rate in the biopolymers in electrical & electronics market during the forecast period. The region’s increasing focus on sustainability and environmental conservation aligns with the adoption of eco-friendly materials like biopolymers. Government initiatives and regulations promoting green technologies further support this trend. Additionally, cost efficiencies achieved through localized production and supply chains are making biopolymers an attractive choice for electronics manufacturers in Latin America. These factors contribute to the potential expansion of biopolymers in the Latin American market.
Competitive Landscape
Some of the players operating in the biopolymers in electrical & electronics market are
- BASF SE
- Braskem
- Futerro
- NatureWorks LLC
- SABIC
- Solvay
- TEIJIN LIMITED
- TotalEnergies Corbion
- Toyota Tsusho Corporation
- Trinseo
- Other Industry Participants
Report Summary of Global Biopolymers in Electrical & Electronics Market
| Report Specifications |
Details |
| Market Revenue in 2022 |
US$ 55.2 Million |
| Market Size Forecast by 2031 |
US$ 313.56 Million |
| Growth Rate (CAGR) |
23.1% |
| Historic Data |
2015 – 2021 |
| Base Year for Estimation |
2022 |
| Forecast Period |
2023 – 2031 |
| Report Inclusions |
Market Size & Estimates, Market Dynamics, Competitive Scenario, Trends, Growth Factors, Market Determinants, Key Investment Segmentation, Product/Service/Solutions Benchmarking |
| Segments Covered |
By Type, By Application |
| Regions Covered |
North America, Europe, Asia Pacific, Middle East & Africa, Latin America |
| Countries Covered |
U.S., Canada, Mexico, Rest of North America, France, The UK, Spain, Germany, Italy, Nordic Countries (Denmark, Finland, Iceland, Sweden, Norway), Benelux Union (Belgium, The Netherlands, Luxembourg), Rest of Europe, China, Japan, India, New Zealand, Australia, South Korea, Southeast Asia (Indonesia, Thailand, Malaysia, Singapore, Rest of Southeast Asia), Rest of Asia Pacific, Saudi Arabia, UAE, Egypt, Kuwait, South Africa, Rest of Middle East & Africa, Brazil, Argentina, Rest of Latin America |
| Key Players |
BASF SE, Braskem, Futerro, NatureWorks LLC, SABIC, Solvay, TEIJIN LIMITED, TotalEnergies Corbion, Toyota Tsusho Corporation, Trinseo, Other Industry Participants |
| Customization Scope |
Customization allows for the inclusion/modification of content pertaining to geographical regions, countries, and specific market segments. |
| Pricing & Procurement Options |
Explore purchase options tailored to your specific research requirements |
| Contact Details |
Consult With Our Expert
Japan (Toll-Free): – +81 663-386-8111
South Korea (Toll-Free): – +82-808- 703-126
Saudi Arabia (Toll-Free): – +966 800 850 1643
United States: +1 302-232-5106
United Kingdom: +447537105080
E-mail: askanexpert@thenicheresearch.com
|
Global Biopolymers in Electrical & Electronics Market
By Type
-
- Polylactic Acid (PLA)
- Polybutylene Adipate Terephthalate (PBAT)
-
- Polyethylene (PE)
- Polyethylene Terephthalate (PET)
- Polyamide (PA)
By Application
- Rechargeable Batteries
- Wires & Cables
- Electrical Insulator
- Panel Displays
- Electronic Device Casings
- Others
By Region
- North America (U.S., Canada, Mexico, Rest of North America)
- Europe (France, The UK, Spain, Germany, Italy, Nordic Countries (Denmark, Finland, Iceland, Sweden, Norway), Benelux Union (Belgium, The Netherlands, Luxembourg), Rest of Europe)
- Asia Pacific (China, Japan, India, New Zealand, Australia, South Korea, Southeast Asia (Indonesia, Thailand, Malaysia, Singapore, Rest of Southeast Asia), Rest of Asia Pacific)
- Middle East & Africa (Saudi Arabia, UAE, Egypt, Kuwait, South Africa, Rest of Middle East & Africa)
- Latin America (Brazil, Argentina, Rest of Latin America)
Report Coverage and Deliverables:
Table of Contents
.
1.Market Scope
1.2.Years Considered
1.2.1.Historic Years: 2015 – 2021
1.2.3.Forecast Years: 2023 – 2031
3.Research Methodology
3.1.Primary Research
3.1.1.Research Questionnaire
3.1.2.Global Percentage Breakdown
3.1.3.Primary Interviews: Key Opinion Leaders (KOLs)
3.3.Market Size Estimates
3.4.Data Triangulation Methodology
4.Recommendations and Insights from TNR’s Perspective**
5.Holistic Overview of Biopolymers in Electrical and Electronics Market
6.Market Synopsis: Biopolymers in Electrical and Electronics Market
7.Biopolymers in Electrical and Electronics Market Analysis: Qualitative Perspective
7.1.Introduction
7.1.2.Industry Development
7.3.Trends in Biopolymers in Electrical and Electronics Market
7.4.Market Determinants Radar Chart
7.5.Macro-Economic and Micro-Economic Indicators: Biopolymers in Electrical and Electronics Market
8.Global Biopolymers in Electrical and Electronics Market Analysis and Forecasts, 2023 – 2031
8.1.Overview
8.1.1.Global Biopolymers in Electrical and Electronics Market Revenue & Volume (US$ Mn & Tons)
8.2.Global Biopolymers in Electrical and Electronics Market Revenue & Volume (US$ Mn & Tons) and Forecasts, By Type
8.2.1.Biodegradable (Definition, Market Estimation and Penetration, 2015 – 2022, Market Estimation (2015 – 2022), Market Forecast (2023 – 2031), Compound Annual Growth Rate (CAGR), Regional Bifurcation (North America, Europe, Asia Pacific, Middle East and Africa, Latin America) and Information on Polylactic Acid (PLA), Polybutylene Adipate Terephthalate (PBAT))
8.2.1.1.Polylactic Acid (PLA)
8.2.1.2.Polybutylene Adipate Terephthalate (PBAT)
8.2.2.Non-biodegradable (Definition, Market Estimation and Penetration, 2015 – 2022, Market Estimation (2015 – 2022), Market Forecast (2023 – 2031), Compound Annual Growth Rate (CAGR), Regional Bifurcation (North America, Europe, Asia Pacific, Middle East and Africa, Latin America) and Information on Polyethylene (PE), Polyethylene Terephthalate (PET), Polyamide (PA))
8.2.2.1.Polyethylene (PE)
8.2.2.2.Polyethylene Terephthalate (PET)
8.3.Key Segment for Channeling Investments
9.Global Biopolymers in Electrical and Electronics Market Analysis and Forecasts, 2023 – 2031
9.2.Global Biopolymers in Electrical and Electronics Market Revenue & Volume (US$ Mn & Tons) and Forecasts, By Application
9.2.1.Rechargeable Batteries
9.2.1.2.Market Estimation and Penetration, 2015 – 2022
9.2.1.3.Market Forecast, 2023 – 2031
9.2.1.4.Compound Annual Growth Rate (CAGR)
9.2.1.5.Regional Bifurcation
9.2.1.5.1.North America
9.2.1.5.1.1.Market Estimation, 2015 – 2022
9.2.1.5.1.2.Market Forecast, 2023 – 2031
9.2.1.5.2.Europe
9.2.1.5.2.1.Market Estimation, 2015 – 2022
9.2.1.5.2.2.Market Forecast, 2023 – 2031
9.2.1.5.3.Asia Pacific
9.2.1.5.3.1.Market Estimation, 2015 – 2022
9.2.1.5.3.2.Market Forecast, 2023 – 2031
9.2.1.5.4.Middle East and Africa
9.2.1.5.4.1.Market Estimation, 2015 – 2022
9.2.1.5.4.2.Market Forecast, 2023 – 2031
9.2.1.5.5.Latin America
9.2.1.5.5.1.Market Estimation, 2015 – 2022
9.2.1.5.5.2.Market Forecast, 2023 – 2031
9.2.2.Wires and Cables
9.2.2.2.Market Estimation and Penetration, 2015 – 2022
9.2.2.3.Market Forecast, 2023 – 2031
9.2.2.4.Compound Annual Growth Rate (CAGR)
9.2.2.5.Regional Bifurcation
9.2.2.5.1.North America
9.2.2.5.1.1.Market Estimation, 2015 – 2022
9.2.2.5.1.2.Market Forecast, 2023 – 2031
9.2.2.5.2.Europe
9.2.2.5.2.1.Market Estimation, 2015 – 2022
9.2.2.5.2.2.Market Forecast, 2023 – 2031
9.2.2.5.3.Asia Pacific
9.2.2.5.3.1.Market Estimation, 2015 – 2022
9.2.2.5.3.2.Market Forecast, 2023 – 2031
9.2.2.5.4.Middle East and Africa
9.2.2.5.4.1.Market Estimation, 2015 – 2022
9.2.2.5.4.2.Market Forecast, 2023 – 2031
9.2.2.5.5.Latin America
9.2.2.5.5.1.Market Estimation, 2015 – 2022
9.2.2.5.5.2.Market Forecast, 2023 – 2031
9.2.3.Electrical Insulator
9.2.3.2.Market Estimation and Penetration, 2015 – 2022
9.2.3.3.Market Forecast, 2023 – 2031
9.2.3.4.Compound Annual Growth Rate (CAGR)
9.2.3.5.Regional Bifurcation
9.2.3.5.1.North America
9.2.3.5.1.1.Market Estimation, 2015 – 2022
9.2.3.5.1.2.Market Forecast, 2023 – 2031
9.2.3.5.2.Europe
9.2.3.5.2.1.Market Estimation, 2015 – 2022
9.2.3.5.2.2.Market Forecast, 2023 – 2031
9.2.3.5.3.Asia Pacific
9.2.3.5.3.1.Market Estimation, 2015 – 2022
9.2.3.5.3.2.Market Forecast, 2023 – 2031
9.2.3.5.4.Middle East and Africa
9.2.3.5.4.1.Market Estimation, 2015 – 2022
9.2.3.5.4.2.Market Forecast, 2023 – 2031
9.2.3.5.5.Latin America
9.2.3.5.5.1.Market Estimation, 2015 – 2022
9.2.3.5.5.2.Market Forecast, 2023 – 2031
9.2.4.Panel Displays
9.2.4.2.Market Estimation and Penetration, 2015 – 2022
9.2.4.3.Market Forecast, 2023 – 2031
9.2.4.4.Compound Annual Growth Rate (CAGR)
9.2.4.5.Regional Bifurcation
9.2.4.5.1.North America
9.2.4.5.1.1.Market Estimation, 2015 – 2022
9.2.4.5.1.2.Market Forecast, 2023 – 2031
9.2.4.5.2.Europe
9.2.4.5.2.1.Market Estimation, 2015 – 2022
9.2.4.5.2.2.Market Forecast, 2023 – 2031
9.2.4.5.3.Asia Pacific
9.2.4.5.3.1.Market Estimation, 2015 – 2022
9.2.4.5.3.2.Market Forecast, 2023 – 2031
9.2.4.5.4.Middle East and Africa
9.2.4.5.4.1.Market Estimation, 2015 – 2022
9.2.4.5.4.2.Market Forecast, 2023 – 2031
9.2.4.5.5.Latin America
9.2.4.5.5.1.Market Estimation, 2015 – 2022
9.2.4.5.5.2.Market Forecast, 2023 – 2031
9.2.5.Electronic Device Casings
9.2.5.2.Market Estimation and Penetration, 2015 – 2022
9.2.5.3.Market Forecast, 2023 – 2031
9.2.5.4.Compound Annual Growth Rate (CAGR)
9.2.5.5.Regional Bifurcation
9.2.5.5.1.North America
9.2.5.5.1.1.Market Estimation, 2015 – 2022
9.2.5.5.1.2.Market Forecast, 2023 – 2031
9.2.5.5.2.Europe
9.2.5.5.2.1.Market Estimation, 2015 – 2022
9.2.5.5.2.2.Market Forecast, 2023 – 2031
9.2.5.5.3.Asia Pacific
9.2.5.5.3.1.Market Estimation, 2015 – 2022
9.2.5.5.3.2.Market Forecast, 2023 – 2031
9.2.5.5.4.Middle East and Africa
9.2.5.5.4.1.Market Estimation, 2015 – 2022
9.2.5.5.4.2.Market Forecast, 2023 – 2031
9.2.5.5.5.Latin America
9.2.5.5.5.1.Market Estimation, 2015 – 2022
9.2.5.5.5.2.Market Forecast, 2023 – 2031
9.2.6.Others
9.2.6.2.Market Estimation and Penetration, 2015 – 2022
9.2.6.3.Market Forecast, 2023 – 2031
9.2.6.4.Compound Annual Growth Rate (CAGR)
9.2.6.5.Regional Bifurcation
9.2.6.5.1.North America
9.2.6.5.1.1.Market Estimation, 2015 – 2022
9.2.6.5.1.2.Market Forecast, 2023 – 2031
9.2.6.5.2.Europe
9.2.6.5.2.1.Market Estimation, 2015 – 2022
9.2.6.5.2.2.Market Forecast, 2023 – 2031
9.2.6.5.3.Asia Pacific
9.2.6.5.3.1.Market Estimation, 2015 – 2022
9.2.6.5.3.2.Market Forecast, 2023 – 2031
9.2.6.5.4.Middle East and Africa
9.2.6.5.4.1.Market Estimation, 2015 – 2022
9.2.6.5.4.2.Market Forecast, 2023 – 2031
9.2.6.5.5.Latin America
9.2.6.5.5.1.Market Estimation, 2015 – 2022
9.2.6.5.5.2.Market Forecast, 2023 – 2031
9.3.Key Segment for Channeling Investments
10.North America Biopolymers in Electrical and Electronics Market Analysis and Forecasts, 2023 – 2031
10.1.Overview
10.1.1.North America Biopolymers in Electrical and Electronics Market Revenue & Volume (US$ Mn & Tons)
10.2.North America Biopolymers in Electrical and Electronics Market Revenue & Volume (US$ Mn & Tons) and Forecasts, By Type
10.2.1.Biodegradable
10.2.1.1.Polylactic Acid (PLA)
10.2.1.2.Polybutylene Adipate Terephthalate (PBAT)
10.2.2.Non-biodegradable
10.2.2.1.Polyethylene (PE)
10.2.2.2.Polyethylene Terephthalate (PET)
10.3.North America Biopolymers in Electrical and Electronics Market Revenue & Volume (US$ Mn & Tons) and Forecasts, By Application
10.3.1.Rechargeable Batteries
10.3.3.Electrical Insulator
10.3.5.Electronic Device Casings
10.4.North America Biopolymers in Electrical and Electronics Market Revenue & Volume (US$ Mn & Tons) and Forecasts, By Country
10.4.1.U.S
10.4.1.1.U.S Biopolymers in Electrical and Electronics Market Revenue & Volume (US$ Mn & Tons) and Forecasts, By Type
10.4.1.1.1.Biodegradable
10.4.1.1.1.1.Polylactic Acid (PLA)
10.4.1.1.1.2.Polybutylene Adipate Terephthalate (PBAT)
10.4.1.1.2.Non-biodegradable
10.4.1.1.2.1.Polyethylene (PE)
10.4.1.1.2.2.Polyethylene Terephthalate (PET)
10.4.1.1.2.3.Polyamide (PA)
10.4.1.2.U.S Biopolymers in Electrical and Electronics Market Revenue & Volume (US$ Mn & Tons) and Forecasts, By Application
10.4.1.2.1.Rechargeable Batteries
10.4.1.2.2.Wires and Cables
10.4.1.2.3.Electrical Insulator
10.4.1.2.4.Panel Displays
10.4.1.2.5.Electronic Device Casings
10.4.2.Canada
10.4.2.1.Canada Biopolymers in Electrical and Electronics Market Revenue & Volume (US$ Mn & Tons) and Forecasts, By Type
10.4.2.1.1.Biodegradable
10.4.2.1.1.1.Polylactic Acid (PLA)
10.4.2.1.1.2.Polybutylene Adipate Terephthalate (PBAT)
10.4.2.1.2.Non-biodegradable
10.4.2.1.2.1.Polyethylene (PE)
10.4.2.1.2.2.Polyethylene Terephthalate (PET)
10.4.2.1.2.3.Polyamide (PA)
10.4.2.2.Canada Biopolymers in Electrical and Electronics Market Revenue & Volume (US$ Mn & Tons) and Forecasts, By Application
10.4.2.2.1.Rechargeable Batteries
10.4.2.2.2.Wires and Cables
10.4.2.2.3.Electrical Insulator
10.4.2.2.4.Panel Displays
10.4.2.2.5.Electronic Device Casings
10.4.3.Mexico
10.4.3.1.Mexico Biopolymers in Electrical and Electronics Market Revenue & Volume (US$ Mn & Tons) and Forecasts, By Type
10.4.3.1.1.Biodegradable
10.4.3.1.1.1.Polylactic Acid (PLA)
10.4.3.1.1.2.Polybutylene Adipate Terephthalate (PBAT)
10.4.3.1.2.Non-biodegradable
10.4.3.1.2.1.Polyethylene (PE)
10.4.3.1.2.2.Polyethylene Terephthalate (PET)
10.4.3.1.2.3.Polyamide (PA)
10.4.3.2.Mexico Biopolymers in Electrical and Electronics Market Revenue & Volume (US$ Mn & Tons) and Forecasts, By Application
10.4.3.2.1.Rechargeable Batteries
10.4.3.2.2.Wires and Cables
10.4.3.2.3.Electrical Insulator
10.4.3.2.4.Panel Displays
10.4.3.2.5.Electronic Device Casings
10.4.4.Rest of North America
10.4.4.1.Rest of North America Biopolymers in Electrical and Electronics Market Revenue & Volume (US$ Mn & Tons) and Forecasts, By Type
10.4.4.1.1.Biodegradable
10.4.4.1.1.1.Polylactic Acid (PLA)
10.4.4.1.1.2.Polybutylene Adipate Terephthalate (PBAT)
10.4.4.1.2.Non-biodegradable
10.4.4.1.2.1.Polyethylene (PE)
10.4.4.1.2.2.Polyethylene Terephthalate (PET)
10.4.4.1.2.3.Polyamide (PA)
10.4.4.2.Rest of North America Biopolymers in Electrical and Electronics Market Revenue & Volume (US$ Mn & Tons) and Forecasts, By Application
10.4.4.2.1.Rechargeable Batteries
10.4.4.2.2.Wires and Cables
10.4.4.2.3.Electrical Insulator
10.4.4.2.4.Panel Displays
10.4.4.2.5.Electronic Device Casings
10.5.Key Segment for Channeling Investments
11.Europe Biopolymers in Electrical and Electronics Market Analysis and Forecasts, 2023 – 2031
11.1.Overview
11.1.1.Europe Biopolymers in Electrical and Electronics Market Revenue & Volume (US$ Mn & Tons)
11.2.Europe Biopolymers in Electrical and Electronics Market Revenue & Volume (US$ Mn & Tons) and Forecasts, By Type
11.2.1.Biodegradable
11.2.1.1.Polylactic Acid (PLA)
11.2.1.2.Polybutylene Adipate Terephthalate (PBAT)
11.2.2.Non-biodegradable
11.2.2.1.Polyethylene (PE)
11.2.2.2.Polyethylene Terephthalate (PET)
11.3.Europe Biopolymers in Electrical and Electronics Market Revenue & Volume (US$ Mn & Tons) and Forecasts, By Application
11.3.1.Rechargeable Batteries
11.3.3.Electrical Insulator
11.3.5.Electronic Device Casings
11.4.Europe Biopolymers in Electrical and Electronics Market Revenue & Volume (US$ Mn & Tons) and Forecasts, By Country
11.4.1.France
11.4.1.1.France Biopolymers in Electrical and Electronics Market Revenue & Volume (US$ Mn & Tons) and Forecasts, By Type
11.4.1.1.1.Biodegradable
11.4.1.1.1.1.Polylactic Acid (PLA)
11.4.1.1.1.2.Polybutylene Adipate Terephthalate (PBAT)
11.4.1.1.2.Non-biodegradable
11.4.1.1.2.1.Polyethylene (PE)
11.4.1.1.2.2.Polyethylene Terephthalate (PET)
11.4.1.1.2.3.Polyamide (PA)
11.4.1.2.France Biopolymers in Electrical and Electronics Market Revenue & Volume (US$ Mn & Tons) and Forecasts, By Application
11.4.1.2.1.Rechargeable Batteries
11.4.1.2.2.Wires and Cables
11.4.1.2.3.Electrical Insulator
11.4.1.2.4.Panel Displays
11.4.1.2.5.Electronic Device Casings
11.4.2.The UK
11.4.2.1.The UK Biopolymers in Electrical and Electronics Market Revenue & Volume (US$ Mn & Tons) and Forecasts, By Type
11.4.2.1.1.Biodegradable
11.4.2.1.1.1.Polylactic Acid (PLA)
11.4.2.1.1.2.Polybutylene Adipate Terephthalate (PBAT)
11.4.2.1.2.Non-biodegradable
11.4.2.1.2.1.Polyethylene (PE)
11.4.2.1.2.2.Polyethylene Terephthalate (PET)
11.4.2.1.2.3.Polyamide (PA)
11.4.2.2.The UK Biopolymers in Electrical and Electronics Market Revenue & Volume (US$ Mn & Tons) and Forecasts, By Application
11.4.2.2.1.Rechargeable Batteries
11.4.2.2.2.Wires and Cables
11.4.2.2.3.Electrical Insulator
11.4.2.2.4.Panel Displays
11.4.2.2.5.Electronic Device Casings
11.4.3.Spain
11.4.3.1.Spain Biopolymers in Electrical and Electronics Market Revenue & Volume (US$ Mn & Tons) and Forecasts, By Type
11.4.3.1.1.Biodegradable
11.4.3.1.1.1.Polylactic Acid (PLA)
11.4.3.1.1.2.Polybutylene Adipate Terephthalate (PBAT)
11.4.3.1.2.Non-biodegradable
11.4.3.1.2.1.Polyethylene (PE)
11.4.3.1.2.2.Polyethylene Terephthalate (PET)
11.4.3.1.2.3.Polyamide (PA)
11.4.3.2.Spain Biopolymers in Electrical and Electronics Market Revenue & Volume (US$ Mn & Tons) and Forecasts, By Application
11.4.3.2.1.Rechargeable Batteries
11.4.3.2.2.Wires and Cables
11.4.3.2.3.Electrical Insulator
11.4.3.2.4.Panel Displays
11.4.3.2.5.Electronic Device Casings
11.4.4.Germany
11.4.4.1.Germany Biopolymers in Electrical and Electronics Market Revenue & Volume (US$ Mn & Tons) and Forecasts, By Type
11.4.4.1.1.Biodegradable
11.4.4.1.1.1.Polylactic Acid (PLA)
11.4.4.1.1.2.Polybutylene Adipate Terephthalate (PBAT)
11.4.4.1.2.Non-biodegradable
11.4.4.1.2.1.Polyethylene (PE)
11.4.4.1.2.2.Polyethylene Terephthalate (PET)
11.4.4.1.2.3.Polyamide (PA)
11.4.4.2.Germany Biopolymers in Electrical and Electronics Market Revenue & Volume (US$ Mn & Tons) and Forecasts, By Application
11.4.4.2.1.Rechargeable Batteries
11.4.4.2.2.Wires and Cables
11.4.4.2.3.Electrical Insulator
11.4.4.2.4.Panel Displays
11.4.4.2.5.Electronic Device Casings
11.4.5.Italy
11.4.5.1.Italy Biopolymers in Electrical and Electronics Market Revenue & Volume (US$ Mn & Tons) and Forecasts, By Type
11.4.5.1.1.Biodegradable
11.4.5.1.1.1.Polylactic Acid (PLA)
11.4.5.1.1.2.Polybutylene Adipate Terephthalate (PBAT)
11.4.5.1.2.Non-biodegradable
11.4.5.1.2.1.Polyethylene (PE)
11.4.5.1.2.2.Polyethylene Terephthalate (PET)
11.4.5.1.2.3.Polyamide (PA)
11.4.5.2.Italy Biopolymers in Electrical and Electronics Market Revenue & Volume (US$ Mn & Tons) and Forecasts, By Application
11.4.5.2.1.Rechargeable Batteries
11.4.5.2.2.Wires and Cables
11.4.5.2.3.Electrical Insulator
11.4.5.2.4.Panel Displays
11.4.5.2.5.Electronic Device Casings
11.4.6.Nordic Countries
11.4.6.1.Nordic Countries Biopolymers in Electrical and Electronics Market Revenue & Volume (US$ Mn & Tons) and Forecasts, By Type
11.4.6.1.1.Biodegradable
11.4.6.1.1.1.Polylactic Acid (PLA)
11.4.6.1.1.2.Polybutylene Adipate Terephthalate (PBAT)
11.4.6.1.2.Non-biodegradable
11.4.6.1.2.1.Polyethylene (PE)
11.4.6.1.2.2.Polyethylene Terephthalate (PET)
11.4.6.1.2.3.Polyamide (PA)
11.4.6.2.Nordic Countries Biopolymers in Electrical and Electronics Market Revenue & Volume (US$ Mn & Tons) and Forecasts, By Application
11.4.6.2.1.Rechargeable Batteries
11.4.6.2.2.Wires and Cables
11.4.6.2.3.Electrical Insulator
11.4.6.2.4.Panel Displays
11.4.6.2.5.Electronic Device Casings
11.4.6.3.Nordic Countries Biopolymers in Electrical and Electronics Market Revenue & Volume (US$ Mn & Tons) and Forecasts, By Country
11.4.7.Benelux Union
11.4.7.1.Benelux Union Biopolymers in Electrical and Electronics Market Revenue & Volume (US$ Mn & Tons) and Forecasts, By Type
11.4.7.1.1.Biodegradable
11.4.7.1.1.1.Polylactic Acid (PLA)
11.4.7.1.1.2.Polybutylene Adipate Terephthalate (PBAT)
11.4.7.1.2.Non-biodegradable
11.4.7.1.2.1.Polyethylene (PE)
11.4.7.1.2.2.Polyethylene Terephthalate (PET)
11.4.7.1.2.3.Polyamide (PA)
11.4.7.2.Benelux Union Biopolymers in Electrical and Electronics Market Revenue & Volume (US$ Mn & Tons) and Forecasts, By Application
11.4.7.2.1.Rechargeable Batteries
11.4.7.2.2.Wires and Cables
11.4.7.2.3.Electrical Insulator
11.4.7.2.4.Panel Displays
11.4.7.2.5.Electronic Device Casings
11.4.7.3.Benelux Union Biopolymers in Electrical and Electronics Market Revenue & Volume (US$ Mn & Tons) and Forecasts, By Country
11.4.7.3.2.The Netherlands
11.4.8.Rest of Europe
11.4.8.1.Rest of Europe Biopolymers in Electrical and Electronics Market Revenue & Volume (US$ Mn & Tons) and Forecasts, By Type
11.4.8.1.1.Biodegradable
11.4.8.1.1.1.Polylactic Acid (PLA)
11.4.8.1.1.2.Polybutylene Adipate Terephthalate (PBAT)
11.4.8.1.2.Non-biodegradable
11.4.8.1.2.1.Polyethylene (PE)
11.4.8.1.2.2.Polyethylene Terephthalate (PET)
11.4.8.1.2.3.Polyamide (PA)
11.4.8.2.Rest of Europe Biopolymers in Electrical and Electronics Market Revenue & Volume (US$ Mn & Tons) and Forecasts, By Application
11.4.8.2.1.Rechargeable Batteries
11.4.8.2.2.Wires and Cables
11.4.8.2.3.Electrical Insulator
11.4.8.2.4.Panel Displays
11.4.8.2.5.Electronic Device Casings
11.5.Key Segment for Channeling Investments
12.Asia Pacific Biopolymers in Electrical and Electronics Market Analysis and Forecasts, 2023 – 2031
12.1.Overview
12.1.1.Asia Pacific Biopolymers in Electrical and Electronics Market Revenue & Volume (US$ Mn & Tons)
12.2.Asia Pacific Biopolymers in Electrical and Electronics Market Revenue & Volume (US$ Mn & Tons) and Forecasts, By Type
12.2.1.Biodegradable
12.2.1.1.Polylactic Acid (PLA)
12.2.1.2.Polybutylene Adipate Terephthalate (PBAT)
12.2.2.Non-biodegradable
12.2.2.1.Polyethylene (PE)
12.2.2.2.Polyethylene Terephthalate (PET)
12.3.Asia Pacific Biopolymers in Electrical and Electronics Market Revenue & Volume (US$ Mn & Tons) and Forecasts, By Application
12.3.1.Rechargeable Batteries
12.3.3.Electrical Insulator
12.3.5.Electronic Device Casings
12.4.Asia Pacific Biopolymers in Electrical and Electronics Market Revenue & Volume (US$ Mn & Tons) and Forecasts, By Country
12.4.1.China
12.4.1.1.China Biopolymers in Electrical and Electronics Market Revenue & Volume (US$ Mn & Tons) and Forecasts, By Type
12.4.1.1.1.Biodegradable
12.4.1.1.1.1.Polylactic Acid (PLA)
12.4.1.1.1.2.Polybutylene Adipate Terephthalate (PBAT)
12.4.1.1.2.Non-biodegradable
12.4.1.1.2.1.Polyethylene (PE)
12.4.1.1.2.2.Polyethylene Terephthalate (PET)
12.4.1.1.2.3.Polyamide (PA)
12.4.1.2.China Biopolymers in Electrical and Electronics Market Revenue & Volume (US$ Mn & Tons) and Forecasts, By Application
12.4.1.2.1.Rechargeable Batteries
12.4.1.2.2.Wires and Cables
12.4.1.2.3.Electrical Insulator
12.4.1.2.4.Panel Displays
12.4.1.2.5.Electronic Device Casings
12.4.2.Japan
12.4.2.1.Japan Biopolymers in Electrical and Electronics Market Revenue & Volume (US$ Mn & Tons) and Forecasts, By Type
12.4.2.1.1.Biodegradable
12.4.2.1.1.1.Polylactic Acid (PLA)
12.4.2.1.1.2.Polybutylene Adipate Terephthalate (PBAT)
12.4.2.1.2.Non-biodegradable
12.4.2.1.2.1.Polyethylene (PE)
12.4.2.1.2.2.Polyethylene Terephthalate (PET)
12.4.2.1.2.3.Polyamide (PA)
12.4.2.2.Japan Biopolymers in Electrical and Electronics Market Revenue & Volume (US$ Mn & Tons) and Forecasts, By Application
12.4.2.2.1.Rechargeable Batteries
12.4.2.2.2.Wires and Cables
12.4.2.2.3.Electrical Insulator
12.4.2.2.4.Panel Displays
12.4.2.2.5.Electronic Device Casings
12.4.3.India
12.4.3.1.India Biopolymers in Electrical and Electronics Market Revenue & Volume (US$ Mn & Tons) and Forecasts, By Type
12.4.3.1.1.Biodegradable
12.4.3.1.1.1.Polylactic Acid (PLA)
12.4.3.1.1.2.Polybutylene Adipate Terephthalate (PBAT)
12.4.3.1.2.Non-biodegradable
12.4.3.1.2.1.Polyethylene (PE)
12.4.3.1.2.2.Polyethylene Terephthalate (PET)
12.4.3.1.2.3.Polyamide (PA)
12.4.3.2.India Biopolymers in Electrical and Electronics Market Revenue & Volume (US$ Mn & Tons) and Forecasts, By Application
12.4.3.2.1.Rechargeable Batteries
12.4.3.2.2.Wires and Cables
12.4.3.2.3.Electrical Insulator
12.4.3.2.4.Panel Displays
12.4.3.2.5.Electronic Device Casings
12.4.4.New Zealand
12.4.4.1.New Zealand Biopolymers in Electrical and Electronics Market Revenue & Volume (US$ Mn & Tons) and Forecasts, By Type
12.4.4.1.1.Biodegradable
12.4.4.1.1.1.Polylactic Acid (PLA)
12.4.4.1.1.2.Polybutylene Adipate Terephthalate (PBAT)
12.4.4.1.2.Non-biodegradable
12.4.4.1.2.1.Polyethylene (PE)
12.4.4.1.2.2.Polyethylene Terephthalate (PET)
12.4.4.1.2.3.Polyamide (PA)
12.4.4.2.New Zealand Biopolymers in Electrical and Electronics Market Revenue & Volume (US$ Mn & Tons) and Forecasts, By Application
12.4.4.2.1.Rechargeable Batteries
12.4.4.2.2.Wires and Cables
12.4.4.2.3.Electrical Insulator
12.4.4.2.4.Panel Displays
12.4.4.2.5.Electronic Device Casings
12.4.5.Australia
12.4.5.1.Australia Biopolymers in Electrical and Electronics Market Revenue & Volume (US$ Mn & Tons) and Forecasts, By Type
12.4.5.1.1.Biodegradable
12.4.5.1.1.1.Polylactic Acid (PLA)
12.4.5.1.1.2.Polybutylene Adipate Terephthalate (PBAT)
12.4.5.1.2.Non-biodegradable
12.4.5.1.2.1.Polyethylene (PE)
12.4.5.1.2.2.Polyethylene Terephthalate (PET)
12.4.5.1.2.3.Polyamide (PA)
12.4.5.2.Australia Biopolymers in Electrical and Electronics Market Revenue & Volume (US$ Mn & Tons) and Forecasts, By Application
12.4.5.2.1.Rechargeable Batteries
12.4.5.2.2.Wires and Cables
12.4.5.2.3.Electrical Insulator
12.4.5.2.4.Panel Displays
12.4.5.2.5.Electronic Device Casings
12.4.6.South Korea
12.4.6.1.South Korea Biopolymers in Electrical and Electronics Market Revenue & Volume (US$ Mn & Tons) and Forecasts, By Type
12.4.6.1.1.Biodegradable
12.4.6.1.1.1.Polylactic Acid (PLA)
12.4.6.1.1.2.Polybutylene Adipate Terephthalate (PBAT)
12.4.6.1.2.Non-biodegradable
12.4.6.1.2.1.Polyethylene (PE)
12.4.6.1.2.2.Polyethylene Terephthalate (PET)
12.4.6.1.2.3.Polyamide (PA)
12.4.6.2.South Korea Biopolymers in Electrical and Electronics Market Revenue & Volume (US$ Mn & Tons) and Forecasts, By Application
12.4.6.2.1.Rechargeable Batteries
12.4.6.2.2.Wires and Cables
12.4.6.2.3.Electrical Insulator
12.4.6.2.4.Panel Displays
12.4.6.2.5.Electronic Device Casings
12.4.7.Southeast Asia
12.4.7.1.Southeast Asia Biopolymers in Electrical and Electronics Market Revenue & Volume (US$ Mn & Tons) and Forecasts, By Type
12.4.7.1.1.Biodegradable
12.4.7.1.1.1.Polylactic Acid (PLA)
12.4.7.1.1.2.Polybutylene Adipate Terephthalate (PBAT)
12.4.7.1.2.Non-biodegradable
12.4.7.1.2.1.Polyethylene (PE)
12.4.7.1.2.2.Polyethylene Terephthalate (PET)
12.4.7.1.2.3.Polyamide (PA)
12.4.7.2.Southeast Asia Biopolymers in Electrical and Electronics Market Revenue & Volume (US$ Mn & Tons) and Forecasts, By Application
12.4.7.2.1.Rechargeable Batteries
12.4.7.2.2.Wires and Cables
12.4.7.2.3.Electrical Insulator
12.4.7.2.4.Panel Displays
12.4.7.2.5.Electronic Device Casings
12.4.7.3.Southeast Asia Biopolymers in Electrical and Electronics Market Revenue & Volume (US$ Mn & Tons) and Forecasts, By Country
12.4.7.3.5.Rest of Southeast Asia
12.4.8.Rest of Asia Pacific
12.4.8.1.Rest of Asia Pacific Biopolymers in Electrical and Electronics Market Revenue & Volume (US$ Mn & Tons) and Forecasts, By Type
12.4.8.1.1.Biodegradable
12.4.8.1.1.1.Polylactic Acid (PLA)
12.4.8.1.1.2.Polybutylene Adipate Terephthalate (PBAT)
12.4.8.1.2.Non-biodegradable
12.4.8.1.2.1.Polyethylene (PE)
12.4.8.1.2.2.Polyethylene Terephthalate (PET)
12.4.8.1.2.3.Polyamide (PA)
12.4.8.2.Rest of Asia Pacific Biopolymers in Electrical and Electronics Market Revenue & Volume (US$ Mn & Tons) and Forecasts, By Application
12.4.8.2.1.Rechargeable Batteries
12.4.8.2.2.Wires and Cables
12.4.8.2.3.Electrical Insulator
12.4.8.2.4.Panel Displays
12.4.8.2.5.Electronic Device Casings
12.5.Key Segment for Channeling Investments
13.Middle East and Africa Biopolymers in Electrical and Electronics Market Analysis and Forecasts, 2023 – 2031
13.1.Overview
13.1.1.Middle East and Africa Biopolymers in Electrical and Electronics Market Revenue & Volume (US$ Mn & Tons)
13.2.Middle East and Africa Biopolymers in Electrical and Electronics Market Revenue & Volume (US$ Mn & Tons) and Forecasts, By Type
13.2.1.Biodegradable
13.2.1.1.Polylactic Acid (PLA)
13.2.1.2.Polybutylene Adipate Terephthalate (PBAT)
13.2.2.Non-biodegradable
13.2.2.1.Polyethylene (PE)
13.2.2.2.Polyethylene Terephthalate (PET)
13.3.Middle East and Africa Biopolymers in Electrical and Electronics Market Revenue & Volume (US$ Mn & Tons) and Forecasts, By Application
13.3.1.Rechargeable Batteries
13.3.3.Electrical Insulator
13.3.5.Electronic Device Casings
13.4.Middle East and Africa Biopolymers in Electrical and Electronics Market Revenue & Volume (US$ Mn & Tons) and Forecasts, By Country
13.4.1.Saudi Arabia
13.4.1.1.Saudi Arabia Biopolymers in Electrical and Electronics Market Revenue & Volume (US$ Mn & Tons) and Forecasts, By Type
13.4.1.1.1.Biodegradable
13.4.1.1.1.1.Polylactic Acid (PLA)
13.4.1.1.1.2.Polybutylene Adipate Terephthalate (PBAT)
13.4.1.1.2.Non-biodegradable
13.4.1.1.2.1.Polyethylene (PE)
13.4.1.1.2.2.Polyethylene Terephthalate (PET)
13.4.1.1.2.3.Polyamide (PA)
13.4.1.2.Saudi Arabia Biopolymers in Electrical and Electronics Market Revenue & Volume (US$ Mn & Tons) and Forecasts, By Application
13.4.1.2.1.Rechargeable Batteries
13.4.1.2.2.Wires and Cables
13.4.1.2.3.Electrical Insulator
13.4.1.2.4.Panel Displays
13.4.1.2.5.Electronic Device Casings
13.4.2.UAE
13.4.2.1.UAE Biopolymers in Electrical and Electronics Market Revenue & Volume (US$ Mn & Tons) and Forecasts, By Type
13.4.2.1.1.Biodegradable
13.4.2.1.1.1.Polylactic Acid (PLA)
13.4.2.1.1.2.Polybutylene Adipate Terephthalate (PBAT)
13.4.2.1.2.Non-biodegradable
13.4.2.1.2.1.Polyethylene (PE)
13.4.2.1.2.2.Polyethylene Terephthalate (PET)
13.4.2.1.2.3.Polyamide (PA)
13.4.2.2.UAE Biopolymers in Electrical and Electronics Market Revenue & Volume (US$ Mn & Tons) and Forecasts, By Application
13.4.2.2.1.Rechargeable Batteries
13.4.2.2.2.Wires and Cables
13.4.2.2.3.Electrical Insulator
13.4.2.2.4.Panel Displays
13.4.2.2.5.Electronic Device Casings
13.4.3.Egypt
13.4.3.1.Egypt Biopolymers in Electrical and Electronics Market Revenue & Volume (US$ Mn & Tons) and Forecasts, By Type
13.4.3.1.1.Biodegradable
13.4.3.1.1.1.Polylactic Acid (PLA)
13.4.3.1.1.2.Polybutylene Adipate Terephthalate (PBAT)
13.4.3.1.2.Non-biodegradable
13.4.3.1.2.1.Polyethylene (PE)
13.4.3.1.2.2.Polyethylene Terephthalate (PET)
13.4.3.1.2.3.Polyamide (PA)
13.4.3.2.Egypt Biopolymers in Electrical and Electronics Market Revenue & Volume (US$ Mn & Tons) and Forecasts, By Application
13.4.3.2.1.Rechargeable Batteries
13.4.3.2.2.Wires and Cables
13.4.3.2.3.Electrical Insulator
13.4.3.2.4.Panel Displays
13.4.3.2.5.Electronic Device Casings
13.4.4.Kuwait
13.4.4.1.Kuwait Biopolymers in Electrical and Electronics Market Revenue & Volume (US$ Mn & Tons) and Forecasts, By Type
13.4.4.1.1.Biodegradable
13.4.4.1.1.1.Polylactic Acid (PLA)
13.4.4.1.1.2.Polybutylene Adipate Terephthalate (PBAT)
13.4.4.1.2.Non-biodegradable
13.4.4.1.2.1.Polyethylene (PE)
13.4.4.1.2.2.Polyethylene Terephthalate (PET)
13.4.4.1.2.3.Polyamide (PA)
13.4.4.2.Kuwait Biopolymers in Electrical and Electronics Market Revenue & Volume (US$ Mn & Tons) and Forecasts, By Application
13.4.4.2.1.Rechargeable Batteries
13.4.4.2.2.Wires and Cables
13.4.4.2.3.Electrical Insulator
13.4.4.2.4.Panel Displays
13.4.4.2.5.Electronic Device Casings
13.4.5.South Africa
13.4.5.1.South Africa Biopolymers in Electrical and Electronics Market Revenue & Volume (US$ Mn & Tons) and Forecasts, By Type
13.4.5.1.1.Biodegradable
13.4.5.1.1.1.Polylactic Acid (PLA)
13.4.5.1.1.2.Polybutylene Adipate Terephthalate (PBAT)
13.4.5.1.2.Non-biodegradable
13.4.5.1.2.1.Polyethylene (PE)
13.4.5.1.2.2.Polyethylene Terephthalate (PET)
13.4.5.1.2.3.Polyamide (PA)
13.4.5.2.South Africa Biopolymers in Electrical and Electronics Market Revenue & Volume (US$ Mn & Tons) and Forecasts, By Application
13.4.5.2.1.Rechargeable Batteries
13.4.5.2.2.Wires and Cables
13.4.5.2.3.Electrical Insulator
13.4.5.2.4.Panel Displays
13.4.5.2.5.Electronic Device Casings
13.4.6.Rest of Middle East & Africa
13.4.6.1.Rest of Middle East & Africa Biopolymers in Electrical and Electronics Market Revenue & Volume (US$ Mn & Tons) and Forecasts, By Type
13.4.6.1.1.Biodegradable
13.4.6.1.1.1.Polylactic Acid (PLA)
13.4.6.1.1.2.Polybutylene Adipate Terephthalate (PBAT)
13.4.6.1.2.Non-biodegradable
13.4.6.1.2.1.Polyethylene (PE)
13.4.6.1.2.2.Polyethylene Terephthalate (PET)
13.4.6.1.2.3.Polyamide (PA)
13.4.6.2.Rest of Middle East & Africa Biopolymers in Electrical and Electronics Market Revenue & Volume (US$ Mn & Tons) and Forecasts, By Application
13.4.6.2.1.Rechargeable Batteries
13.4.6.2.2.Wires and Cables
13.4.6.2.3.Electrical Insulator
13.4.6.2.4.Panel Displays
13.4.6.2.5.Electronic Device Casings
13.5.Key Segment for Channeling Investments
14.Latin America Biopolymers in Electrical and Electronics Market Analysis and Forecasts, 2023 – 2031
14.1.Overview
14.1.1.Latin America Biopolymers in Electrical and Electronics Market Revenue & Volume (US$ Mn & Tons)
14.2.Latin America Biopolymers in Electrical and Electronics Market Revenue & Volume (US$ Mn & Tons) and Forecasts, By Type
14.2.1.Biodegradable
14.2.1.1.Polylactic Acid (PLA)
14.2.1.2.Polybutylene Adipate Terephthalate (PBAT)
14.2.2.Non-biodegradable
14.2.2.1.Polyethylene (PE)
14.2.2.2.Polyethylene Terephthalate (PET)
14.3.Latin America Biopolymers in Electrical and Electronics Market Revenue & Volume (US$ Mn & Tons) and Forecasts, By Application
14.3.1.Rechargeable Batteries
14.3.3.Electrical Insulator
14.3.5.Electronic Device Casings
14.4.Latin America Biopolymers in Electrical and Electronics Market Revenue & Volume (US$ Mn & Tons) and Forecasts, By Country
14.4.1.Brazil
14.4.1.1.Brazil Biopolymers in Electrical and Electronics Market Revenue & Volume (US$ Mn & Tons) and Forecasts, By Type
14.4.1.1.1.Biodegradable
14.4.1.1.1.1.Polylactic Acid (PLA)
14.4.1.1.1.2.Polybutylene Adipate Terephthalate (PBAT)
14.4.1.1.2.Non-biodegradable
14.4.1.1.2.1.Polyethylene (PE)
14.4.1.1.2.2.Polyethylene Terephthalate (PET)
14.4.1.1.2.3.Polyamide (PA)
14.4.1.2.Brazil Biopolymers in Electrical and Electronics Market Revenue & Volume (US$ Mn & Tons) and Forecasts, By Application
14.4.1.2.1.Rechargeable Batteries
14.4.1.2.2.Wires and Cables
14.4.1.2.3.Electrical Insulator
14.4.1.2.4.Panel Displays
14.4.1.2.5.Electronic Device Casings
14.4.2.Argentina
14.4.2.1.Argentina Biopolymers in Electrical and Electronics Market Revenue & Volume (US$ Mn & Tons) and Forecasts, By Type
14.4.2.1.1.Biodegradable
14.4.2.1.1.1.Polylactic Acid (PLA)
14.4.2.1.1.2.Polybutylene Adipate Terephthalate (PBAT)
14.4.2.1.2.Non-biodegradable
14.4.2.1.2.1.Polyethylene (PE)
14.4.2.1.2.2.Polyethylene Terephthalate (PET)
14.4.2.1.2.3.Polyamide (PA)
14.4.2.2.Argentina Biopolymers in Electrical and Electronics Market Revenue & Volume (US$ Mn & Tons) and Forecasts, By Application
14.4.2.2.1.Rechargeable Batteries
14.4.2.2.2.Wires and Cables
14.4.2.2.3.Electrical Insulator
14.4.2.2.4.Panel Displays
14.4.2.2.5.Electronic Device Casings
14.4.3.Rest of Latin America
14.4.3.1.Rest of Latin America Biopolymers in Electrical and Electronics Market Revenue & Volume (US$ Mn & Tons) and Forecasts, By Type
14.4.3.1.1.Biodegradable
14.4.3.1.1.1.Polylactic Acid (PLA)
14.4.3.1.1.2.Polybutylene Adipate Terephthalate (PBAT)
14.4.3.1.2.Non-biodegradable
14.4.3.1.2.1.Polyethylene (PE)
14.4.3.1.2.2.Polyethylene Terephthalate (PET)
14.4.3.1.2.3.Polyamide (PA)
14.4.3.2.Rest of Latin America Biopolymers in Electrical and Electronics Market Revenue & Volume (US$ Mn & Tons) and Forecasts, By Application
14.4.3.2.1.Rechargeable Batteries
14.4.3.2.2.Wires and Cables
14.4.3.2.3.Electrical Insulator
14.4.3.2.4.Panel Displays
14.4.3.2.5.Electronic Device Casings
14.5.Key Segment for Channeling Investments
15.Competitive Benchmarking
15.1.Market Share Analysis, 2022
15.2.Global Presence and Growth Strategies
15.2.1.Mergers and Acquisitions
15.2.3.Investments Trends
16.Player Profiles
16.1.BASF SE
16.1.5.Financial Analysis
16.1.7.Business Strategies
16.2.Other Market Participants
.
**Exclusive for Multi-User and Enterprise User.
Global Biopolymers in Electrical & Electronics Market Segmentation
Global Biopolymers in Electrical & Electronics Market By Type Outlook (Revenue & Volume, US$ Mn & Tons)
Global Biopolymers in Electrical & Electronics Market By Application Outlook (Revenue & Volume, US$ Mn & Tons)
◦ Electronic Device Casings
Global Biopolymers in Electrical & Electronics Market By Region Outlook (Revenue & Volume, US$ Mn & Tons)
◦ North America (U.S., Canada, Mexico, Rest of North America)
◦ Europe (France, The UK, Spain, Germany, Italy, Nordic Countries (Denmark, Finland, Iceland, Sweden, Norway), Benelux Union (Belgium, The Netherlands, Luxembourg), Rest of Europe)
◦ Asia Pacific (China, Japan, India, New Zealand, Australia, South Korea, Southeast Asia (Indonesia, Thailand, Malaysia, Singapore, Rest of Southeast Asia), Rest of Asia Pacific)
◦ Middle East & Africa (Saudi Arabia, UAE, Egypt, Kuwait, South Africa, Rest of Middle East & Africa)
◦ Latin America (Brazil, Argentina, Rest of Latin America)
**Note: The report covers cross-segmentation analysis by region further into countries
.
The Niche Research approach encompasses both primary and secondary research methods to provide comprehensive insights. While primary research is the cornerstone of our studies, we also incorporate secondary research sources such as company annual reports, premium industry databases, press releases, industry journals, and white papers.
Within our primary research, we actively engage with various industry stakeholders, conducting paid interviews and surveys. Our meticulous analysis extends to every market participant in major countries, allowing us to thoroughly examine their portfolios, calculate market shares, and segment revenues.
Our data collection primarily focuses on individual countries within our research scope, enabling us to estimate regional market sizes. Typically, we employ a bottom-up approach, meticulously tracking trends in different countries. We analyze growth drivers, constraints, technological innovations, and opportunities for each country, ultimately arriving at regional figures.Our process begins by examining the growth prospects of each country. Building upon these insights, we project growth and trends for the entire region. Finally, we utilize our proprietary model to refine estimations and forecasts.
Our data validation standards are integral to ensuring the reliability and accuracy of our research findings. Here’s a breakdown of our data validation processes and the stakeholders we engage with during our primary research:
- Supply Side Analysis: We initiate a supply side analysis by directly contacting market participants, through telephonic interviews and questionnaires containing both open-ended and close-ended questions. We gather information on their portfolios, segment revenues, developments, and growth strategies.
- Demand Side Analysis: To gain insights into adoption trends and consumer preferences, we reach out to target customers and users (non-vendors). This information forms a vital part of the qualitative analysis section of our reports, covering market dynamics, adoption trends, consumer behavior, spending patterns, and other related aspects.
- Consultant Insights: We tap into the expertise of our partner consultants from around the world to obtain their unique viewpoints and perspectives. Their insights contribute to a well-rounded understanding of the markets under investigation.
- In-House Validation: To ensure data accuracy and reliability, we conduct cross-validation of data points and information through our in-house team of consultants and utilize advanced data modeling tools for thorough verification.
The forecasts we provide are based on a comprehensive assessment of various factors, including:
- Market Trends and Past Performance (Last Five Years): We accurately analyze market trends and performance data from preceding five years to identify historical patterns and understand the market’s evolution.
- Historical Performance and Growth of Market Participants: We assess the historical performance and growth trajectories of key market participants. This analysis provides insights into the competitive landscape and individual company strategies.
- Market Determinants Impact Analysis (Next Eight Years): We conduct a rigorous analysis of the factors that are projected to influence the market over the next eight years. This includes assessing both internal and external determinants that can shape market dynamics.
- Drivers and Challenges for the Forecast Period:Identify the factors expected to drive market growth during the forecast period, as well as the challenges that the industry may face. This analysis aids in deriving an accurate growth rate projection.
- New Acquisitions, Collaborations, or Partnerships: We keep a close watch on any new acquisitions, collaborations, or partnerships within the industry. These developments can have a significant impact on market dynamics and competitiveness.
- Macro and Micro Factors Analysis:A thorough examination of both macro-level factors (e.g., economic trends, regulatory changes) and micro-level factors (e.g., technological advancements, consumer preferences) that may influence the market during the forecast period.
- End-User Sentiment Analysis: To understand the market from the end-user perspective, we conduct sentiment analysis. This involves assessing the sentiment, preferences, and feedback of the end-users, which can provide valuable insights into market trends.
- Perspective of Primary Participants: Insights gathered directly from primary research participants play a crucial role in shaping our forecasts. Their perspectives and experiences provide valuable qualitative data.
- Year-on-Year Growth Trend: We utilize a year-on-year growth trend based on historical market growth and expected future trends. This helps in formulating our growth projections, aligning them with the market’s historical performance.
Research process adopted by TNR involves multiple stages, including data collection, validation, quality checks, and presentation. It’s crucial that the data and information we provide add value to your existing market understanding and expertise. We have also established partnerships with business consulting, research, and survey organizations across regions and globally to collaborate on regional analysis and data validation, ensuring the highest level of accuracy and reliability in our reports.