Global Carbon Negative Materials Market By Material Type, By End Use Industry, By Region & Segmental Insights Trends and Forecast, 2024 – 2034
- Industry: Chemicals & Materials
- Report ID: TNR-110-1319
- Number of Pages: 420
- Table/Charts : Yes
- September, 2024
- Base Year : 2024
- No. of Companies : 10+
- No. of Countries : 29
- Views : 10042
- Covid Impact Covered: Yes
- War Impact Covered: Yes
- Formats : PDF, Excel, PPT
The global carbon negative materials market is gaining traction as industries and governments strive to mitigate climate change. Carbon negative materials capture more CO₂ than they emit during production and usage, playing a crucial role in reducing the overall carbon footprint. These materials are used in various sectors, such as construction, packaging, and textiles. For example, CarbonCure Technologies uses recycled CO₂ to produce low-carbon concrete, which is widely adopted in construction projects. Similarly, BioMason produces carbon-negative bricks by using microorganisms to create cement, eliminating the need for traditional energy-intensive methods.
The importance of carbon negative materials is underscored by their potential to help achieve net-zero emission targets by 2050. Their adoption could significantly reduce global greenhouse gas emissions, fostering sustainable development and supporting environmental goals. In terms of revenue, the global carbon negative materials market was worth US$ 1.7 Bn in 2023, anticipated to witness a CAGR of 11.3% during 2024 – 2034.

Global Carbon Negative Materials Market Segmental Analysis:
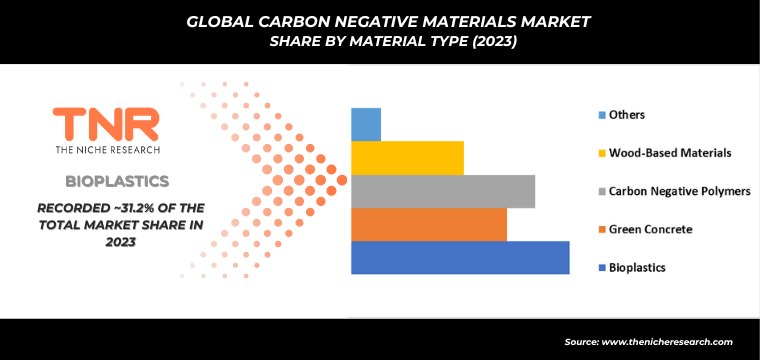
Carbon Negative Materials Market By Material Type
In 2023, bioplastics dominated the global carbon negative materials market, accounting for 31.2% of the revenue share. This growth is driven by increased demand for sustainable packaging solutions and alternatives to conventional plastics. Companies like NatureWorks and Novamont are leading the industry with products such as Ingeo, a bioplastic made from corn, and Mater-Bi, derived from plant starches. These materials are increasingly used in packaging, agriculture, and consumer goods. For example, Coca-Cola’s PlantBottle, which utilizes bioplastics, is gaining traction as an eco-friendlier packaging option. As consumers and industries seek to reduce their environmental impact, the adoption of bioplastics is expected to continue growing, further supporting market expansion.
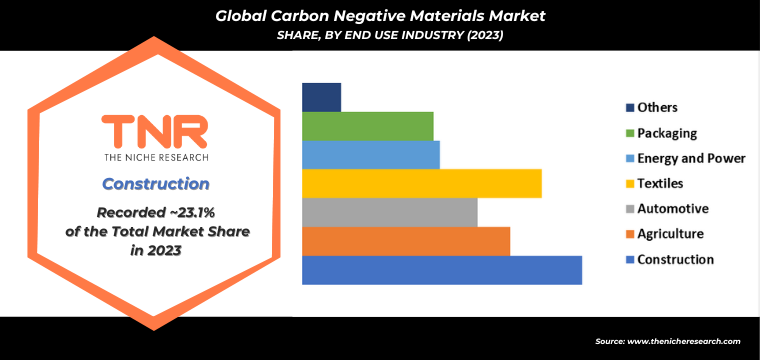
Carbon Negative Materials Market By End Use Industry
In 2023, the energy and power sector is expected to experience the fastest growth in the carbon negative materials market, securing a substantial revenue share of 11.4%. This surge is driven by the sector’s increasing focus on carbon capture and storage (CCS) technologies. For instance, companies like Climeworks are developing direct air capture systems that remove CO₂ from the atmosphere, which can be used for enhanced oil recovery or stored underground. Similarly, Carbfix, an Icelandic company, is injecting captured CO₂ into basalt rocks, transforming it into solid minerals. Renewable energy projects are also integrating carbon negative materials, such as biochar, to offset emissions and improve soil health, further accelerating the sector’s growth.
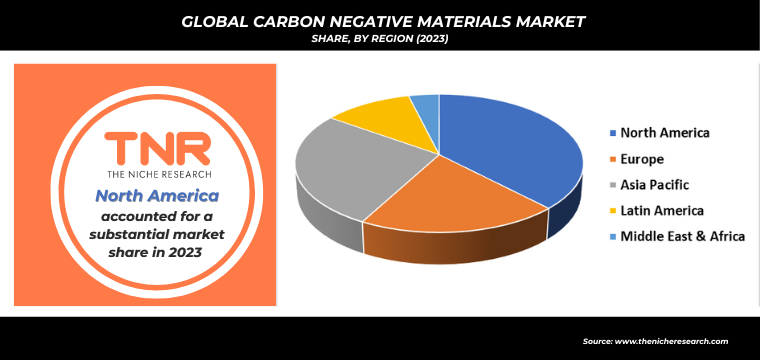
Carbon Negative Materials Market By Region
Europe is projected to be the fastest-growing region in the carbon negative materials market during the forecast period, driven by stringent environmental regulations and increasing investments in sustainable technologies. For instance, the European Union’s Green Deal aims to achieve net-zero emissions by 2050, fostering innovation in carbon capture and utilization. Companies like BASF and Covestro are actively developing bio-based materials, such as biodegradable plastics and sustainable construction materials. Furthermore, Sweden’s Hybrit project aims to revolutionize steel production by eliminating carbon emissions, showcasing the region’s commitment to sustainable practices. With these initiatives, Europe is poised to become a global leader in carbon-negative solutions.
Applications of Material in Carbon Negative Material Market:
| Material Type | Application/Use | Description | Example | Year |
| Bioplastics | Packaging Materials | Bioplastics derived from renewable sources like corn starch or sugarcane reduce dependency on fossil fuels and can be biodegradable. | Coca-Cola’s PlantBottle partially made from plant-based materials (30% bioplastic). | 2009 |
| Medical Devices | Bioplastics are used to make biodegradable medical tools, reducing waste and carbon emissions. | The University of Minnesota developed biodegradable stents from polylactic acid (PLA). | 2017 | |
| Consumer Goods | Used in everyday items like bags, bottles, and utensils to replace petroleum-based plastics and lower carbon emissions. | Danone’s Activia Yogurt introduced bioplastic cups, reducing their reliance on conventional plastic materials. | 2018 | |
| Green Concrete | Construction of Buildings | Green concrete incorporates recycled materials and CO2 in its production process, reducing carbon emissions. | CarbonCure Technologies developed concrete that captures CO2 during curing, used in several buildings in Canada. | 2020 |
| Infrastructure Projects | Green concrete is used in infrastructure such as roads and bridges, significantly cutting embodied carbon emissions. | In Norway, the HeidelbergCement Group used carbon-negative concrete for public infrastructure projects. | 2021 | |
| Eco-friendly Construction Projects | Helps create carbon-neutral buildings by capturing carbon during the curing process. | A Walmart store in Georgia incorporated green concrete made by CarbonCure into its construction. | 2020 | |
| Carbon Negative Polymers | Automotive and Aerospace Components | Polymers derived from captured CO2 are lightweight and strong, making them ideal for transportation, reducing fuel use and emissions. | Covestro launched a foam for car interiors made from CO2-based polymers. | 2016 |
| Furniture and Consumer Products | Carbon-negative polymers are used to manufacture eco-friendly furniture and consumer goods, replacing traditional plastics. | IKEA partnered with Newlight Technologies to produce furniture made from carbon-negative polymers. | 2018 | |
| Packaging and Insulation Materials | Used in creating packaging materials that are not only durable but also sequester carbon, reducing overall carbon footprint. | Newlight Technologies’ AirCarbon, a carbon-negative polymer, has been used in packaging for companies like Dell. | 2014 | |
| Wood-Based Materials | Sustainable Construction Materials | Cross-laminated timber (CLT) captures carbon and provides a sustainable alternative to steel and concrete in buildings. | The Mjøstårnet building in Norway, the world’s tallest timber building, is constructed with CLT. | 2019 |
| Furniture Manufacturing | Wood-based materials offer renewable solutions for furniture while acting as carbon sinks. | Herman Miller introduced wood-based furniture lines using sustainably sourced timber to lower carbon impact. | 2015 | |
| Paper and Packaging | Wood fibers are used in sustainable packaging materials that replace plastic, contributing to carbon sequestration. | Stora Enso developed wood-based packaging to replace fossil-fuel-based alternatives. | 2018 | |
| Others (e.g., Hempcrete, Algae-based materials) | Building Insulation | Hempcrete, a material made from hemp fibers, is used for insulating walls in buildings while storing carbon. | The Marks & Spencer eco-store in the UK used hempcrete in its construction for energy-efficient insulation. | 2007 |
| Biodegradable Packaging from Algae | Algae-based materials are used in biodegradable packaging, reducing carbon emissions associated with conventional plastic. | Loliware introduced seaweed-based straws, fully biodegradable and carbon-negative. | 2019 | |
| Algae-based Textiles for Fashion | Algae-based fibers are used in sustainable fashion, creating biodegradable clothing that sequesters carbon during growth. | Vollebak launched a biodegradable algae T-shirt made from plant and algae-based materials. | 2021 |
Global Carbon Negative Materials Market Dynamics
Global Carbon Negative Materials Market Growth Driver:
A significant growth driver for the global carbon negative materials market is the increasing implementation of stringent government regulations and climate policies aimed at reducing greenhouse gas emissions. For instance, the European Union’s “Fit for 55” package, introduced in 2021, mandates a 55% reduction in emissions by 2030, encouraging the adoption of carbon negative solutions. Similarly, the U.S. Inflation Reduction Act of 2022 offers incentives for companies using sustainable materials, including carbon capture and storage technologies. These policies are pushing industries to innovate, leading to the development of materials like carbon-negative concrete, bio-based plastics, and carbon-storing building materials, which are now seeing broader application in construction and packaging sectors globally.
Global Carbon Negative Materials Market Restraint:
One of the primary restraints for the global carbon negative materials market is the high production costs and limited scalability of these technologies. For instance, while carbon-negative concrete, like that developed by CarbonCure, is environmentally beneficial, it is often more expensive to produce than traditional concrete, limiting widespread adoption. Similarly, producing bio-based plastics from materials like algae or agricultural waste involves costly processes that are not yet economically competitive with conventional plastics. In 2023, BioMason’s carbon-negative bricks faced challenges in scaling up production to meet the demands of large construction projects due to the high costs of microbial cultivation and specialized equipment. These financial barriers hinder the market growth and broader implementation of carbon negative materials.
Global Carbon Negative Materials Market Opportunity:
The increasing demand for sustainable construction materials presents a significant opportunity for the global carbon negative materials market. As countries aim to achieve net-zero emissions, the construction industry is turning to greener alternatives. For example, in 2024, the UK government set a target to halve construction emissions by 2030, prompting companies to explore carbon-negative options like CarbonCure’s CO₂-infused concrete and Hempcrete, a biocomposite made from hemp. Additionally, large-scale projects, such as Google’s sustainable campus in California, are incorporating these materials to reduce their environmental footprint. This trend is driving investment and innovation, creating a lucrative opportunity for the development and adoption of carbon-negative building products worldwide.
Global Carbon Negative Materials Market Trend:
A growing trend in the global carbon negative materials market is the increasing adoption of bio-based materials that sequester carbon during their lifecycle. For instance, in 2023, companies like Origin Materials are producing bioplastics from plant-based feedstocks, capturing CO₂ in the process. Similarly, biochar, a carbon-rich product obtained from biomass, is gaining popularity for its use in agriculture and construction, as seen in projects in the U.S. and Europe. These materials not only reduce emissions but also enhance soil health and building insulation. The shift towards bio-based solutions reflects a broader industry movement to integrate circular economy principles and promote sustainable development.
Competitive Landscape
The global Carbon Negative Materials Market is highly competitive, with key players focusing on innovation, mergers, and partnerships. Companies like Sony, LG Display, and eMagin dominate, continually advancing display technologies to gain market share and meet diverse industry demands.
Some of the players operating in the carbon negative materials market are
- Algix
- Biomason
- CarbonCure Technologies
- Ciena Corporation
- Ecovative
- Full Cycle Bioplastics
- Newlight Technologies
- Origin Materials
- Renewlogy
- Other Industry Participants
Global Carbon Negative Materials Market Scope:
| Report Specifications | Details |
| Market Revenue in 2023 | US$ 1.7 Bn |
| Market Size Forecast by 2034 | US$ 5.4 Bn |
| Growth Rate (CAGR) | 11.3% |
| Historic Data | 2016 – 2022 |
| Base Year for Estimation | 2023 |
| Forecast Period | 2024 – 2034 |
| Report Inclusions | Market Size & Estimates, Market Dynamics, Competitive Scenario, Trends, Growth Factors, Market Determinants, Key Investment Segmentation, Product/Service/Solutions Benchmarking |
| Segments Covered | By Material Type, By End Use Industry, By Region |
| Regions Covered | North America, Europe, Asia Pacific, Middle East & Africa, Latin America |
| Countries Covered | U.S., Canada, Mexico, Rest of North America, France, The UK, Spain, Germany, Italy, Nordic Countries (Denmark, Finland, Iceland, Sweden, Norway), Benelux Union (Belgium, The Netherlands, Luxembourg), Rest of Europe, China, Japan, India, New Zealand, Australia, South Korea, Southeast Asia (Indonesia, Thailand, Malaysia, Singapore, Rest of Southeast Asia), Rest of Asia Pacific, Saudi Arabia, UAE, Egypt, Kuwait, South Africa, Rest of Middle East & Africa, Brazil, Argentina, Rest of Latin America |
| Key Players | Ecovative, CarbonCure Technologies, Biomason, Renewlogy, Newlight Technologies, Algix, Full Cycle Bioplastics, Origin Materials, Ciena Corporation |
| Customization Scope | Customization allows for the inclusion/modification of content pertaining to geographical regions, countries, and specific market segments. |
| Pricing & Procurement Options | Explore purchase options tailored to your specific research requirements |
| Contact Details | Consult With Our Expert
Japan (Toll-Free): +81 663-386-8111 South Korea (Toll-Free): +82-808- 703-126 Saudi Arabia (Toll-Free): +966 800-850-1643 United Kingdom: +44 753-710-5080 United States: +1 302-232-5106 E-mail: askanexpert@thenicheresearch.com
|
Global Carbon Negative Materials Market
By Material Type
- Bioplastics
- Green Concrete
- Carbon Negative Polymers
- Wood-Based Materials
- Others
By End Use Industry
- Construction
- Agriculture
- Automotive
- Textiles
- Energy and Power
- Packaging
- Others
By Region
- North America (U.S., Canada, Mexico, Rest of North America)
- Europe (France, The UK, Spain, Germany, Italy, Nordic Countries (Denmark, Finland, Iceland, Sweden, Norway), Benelux Union (Belgium, The Netherlands, Luxembourg), Rest of Europe)
- Asia Pacific (China, Japan, India, New Zealand, Australia, South Korea, Southeast Asia (Indonesia, Thailand, Malaysia, Singapore, Rest of Southeast Asia), Rest of Asia Pacific)
- Middle East & Africa (Saudi Arabia, UAE, Egypt, Kuwait, South Africa, Rest of Middle East & Africa)
- Latin America (Brazil, Argentina, Rest of Latin America)
Report Layout:
Table of Contents
Note: This ToC is tentative and can be changed according to the research study conducted during the course of report completion.
**Exclusive for Multi-User and Enterprise User.
Global Carbon Negative Materials Market
By Material Type
- Bioplastics
- Green Concrete
- Carbon Negative Polymers
- Wood-Based Materials
- Others
By End Use Industry
- Construction
- Agriculture
- Automotive
- Textiles
- Energy and Power
- Packaging
- Others
By Region
- North America (U.S., Canada, Mexico, Rest of North America)
- Europe (France, The UK, Spain, Germany, Italy, Nordic Countries (Denmark, Finland, Iceland, Sweden, Norway), Benelux Union (Belgium, The Netherlands, Luxembourg), Rest of Europe)
- Asia Pacific (China, Japan, India, New Zealand, Australia, South Korea, Southeast Asia (Indonesia, Thailand, Malaysia, Singapore, Rest of Southeast Asia), Rest of Asia Pacific)
- Middle East & Africa (Saudi Arabia, UAE, Egypt, Kuwait, South Africa, Rest of Middle East & Africa)
- Latin America (Brazil, Argentina, Rest of Latin America)
The Niche Research approach encompasses both primary and secondary research methods to provide comprehensive insights. While primary research is the cornerstone of our studies, we also incorporate secondary research sources such as company annual reports, premium industry databases, press releases, industry journals, and white papers.
Within our primary research, we actively engage with various industry stakeholders, conducting paid interviews and surveys. Our meticulous analysis extends to every market participant in major countries, allowing us to thoroughly examine their portfolios, calculate market shares, and segment revenues.
Our data collection primarily focuses on individual countries within our research scope, enabling us to estimate regional market sizes. Typically, we employ a bottom-up approach, meticulously tracking trends in different countries. We analyze growth drivers, constraints, technological innovations, and opportunities for each country, ultimately arriving at regional figures.Our process begins by examining the growth prospects of each country. Building upon these insights, we project growth and trends for the entire region. Finally, we utilize our proprietary model to refine estimations and forecasts.
Our data validation standards are integral to ensuring the reliability and accuracy of our research findings. Here’s a breakdown of our data validation processes and the stakeholders we engage with during our primary research:
- Supply Side Analysis: We initiate a supply side analysis by directly contacting market participants, through telephonic interviews and questionnaires containing both open-ended and close-ended questions. We gather information on their portfolios, segment revenues, developments, and growth strategies.
- Demand Side Analysis: To gain insights into adoption trends and consumer preferences, we reach out to target customers and users (non-vendors). This information forms a vital part of the qualitative analysis section of our reports, covering market dynamics, adoption trends, consumer behavior, spending patterns, and other related aspects.
- Consultant Insights: We tap into the expertise of our partner consultants from around the world to obtain their unique viewpoints and perspectives. Their insights contribute to a well-rounded understanding of the markets under investigation.
- In-House Validation: To ensure data accuracy and reliability, we conduct cross-validation of data points and information through our in-house team of consultants and utilize advanced data modeling tools for thorough verification.
The forecasts we provide are based on a comprehensive assessment of various factors, including:
- Market Trends and Past Performance (Last Five Years): We accurately analyze market trends and performance data from preceding five years to identify historical patterns and understand the market’s evolution.
- Historical Performance and Growth of Market Participants: We assess the historical performance and growth trajectories of key market participants. This analysis provides insights into the competitive landscape and individual company strategies.
- Market Determinants Impact Analysis (Next Eight Years): We conduct a rigorous analysis of the factors that are projected to influence the market over the next eight years. This includes assessing both internal and external determinants that can shape market dynamics.
- Drivers and Challenges for the Forecast Period:Identify the factors expected to drive market growth during the forecast period, as well as the challenges that the industry may face. This analysis aids in deriving an accurate growth rate projection.
- New Acquisitions, Collaborations, or Partnerships: We keep a close watch on any new acquisitions, collaborations, or partnerships within the industry. These developments can have a significant impact on market dynamics and competitiveness.
- Macro and Micro Factors Analysis:A thorough examination of both macro-level factors (e.g., economic trends, regulatory changes) and micro-level factors (e.g., technological advancements, consumer preferences) that may influence the market during the forecast period.
- End-User Sentiment Analysis: To understand the market from the end-user perspective, we conduct sentiment analysis. This involves assessing the sentiment, preferences, and feedback of the end-users, which can provide valuable insights into market trends.
- Perspective of Primary Participants: Insights gathered directly from primary research participants play a crucial role in shaping our forecasts. Their perspectives and experiences provide valuable qualitative data.
- Year-on-Year Growth Trend: We utilize a year-on-year growth trend based on historical market growth and expected future trends. This helps in formulating our growth projections, aligning them with the market’s historical performance.
Research process adopted by TNR involves multiple stages, including data collection, validation, quality checks, and presentation. It’s crucial that the data and information we provide add value to your existing market understanding and expertise. We have also established partnerships with business consulting, research, and survey organizations across regions and globally to collaborate on regional analysis and data validation, ensuring the highest level of accuracy and reliability in our reports.