Global Ceramic Matrix Composite Market, By Product, By Fiber Type, By Matrix Type, By Application, By Region & Segmental Insights Trends and Forecast, 2024 – 2034
- Industry: Chemicals & Materials
- Report ID: TNR-110-1183
- Number of Pages: 420
- Table/Charts : Yes
- June, 2024
- Base Year : 2024
- No. of Companies : 10+
- No. of Countries : 29
- Views : 10108
- Covid Impact Covered: Yes
- War Impact Covered: Yes
- Formats : PDF, Excel, PPT
A ceramic matrix composite (CMC) is an advanced material composed of ceramic fibres or particles embedded in a ceramic matrix, designed to combine the best properties of both materials. CMCs offer exceptional mechanical strength, high stiffness, and excellent thermal stability, making them ideal for applications in high-temperature and harsh environments where traditional metals or polymers may not suffice. The ceramic matrix provides a robust structure, while the fibres enhance toughness and resistance to cracking under stress.
This combination allows CMCs to withstand extreme temperatures, corrosive environments, and mechanical wear, making them suitable for aerospace components like turbine blades, automotive parts requiring lightweighting, and energy sector applications such as turbine components for power generation. As technological advancements improve manufacturing processes and material formulations, CMCs continue to evolve as a vital material solution for enhancing performance, efficiency, and sustainability across diverse industries globally.
The demand for CMCs is being driven by their exceptional performance in high-temperature applications across industries like aerospace, automotive, and energy. CMCs combine ceramic fibres or particles with a ceramic matrix, offering superior properties such as high thermal stability, excellent mechanical strength, and resistance to corrosion and wear. In the aerospace sector, CMCs are crucial for components like engine turbine blades and thermal protection systems, where they enhance fuel efficiency and reduce weight compared to traditional metallic alloys. Similarly, the automotive industry adopts CMCs for lightweighting initiatives in engine components and brake systems to improve vehicle performance and fuel economy.
In the energy sector, CMCs are utilized in turbine components for gas turbines and thermal management systems for renewable energy technologies, supporting higher efficiency and reliability. The increasing demand for CMCs is driven by their ability to address performance challenges in extreme environments while aligning with sustainability goals and regulatory requirements in various global markets.
In terms of revenue, the global ceramic matrix composite market was worth US$ 3.6 Bn in 2023, anticipated to witness CAGR of 12.6% during 2024 – 2034.

Trends in the Global Ceramic Matrix Composite Market
- Increasing Demand in Aerospace Applications Ceramic matrix composites (CMCs) are increasingly favoured in aerospace for their lightweight properties and high-temperature capabilities, which enhance fuel efficiency and reduce emissions. These materials are used in engine components, exhaust systems, and structural elements to improve performance and durability in demanding flight conditions.
- Expansion in Automotive Lightweighting The automotive industry is adopting CMCs to achieve weight reduction goals, enhancing vehicle performance and fuel efficiency. Applications include engine parts, brake systems, and structural components, where CMCs offer a balance of strength, stiffness, and thermal resistance compared to traditional materials.
- Rise in Energy Sector Applications CMCs are finding applications in the energy sector, particularly in turbine blades for gas turbines and thermal management systems for renewable energy technologies like wind turbines and solar panels. These materials improve efficiency, reduce maintenance costs, and extend component lifespan in harsh operational environments.
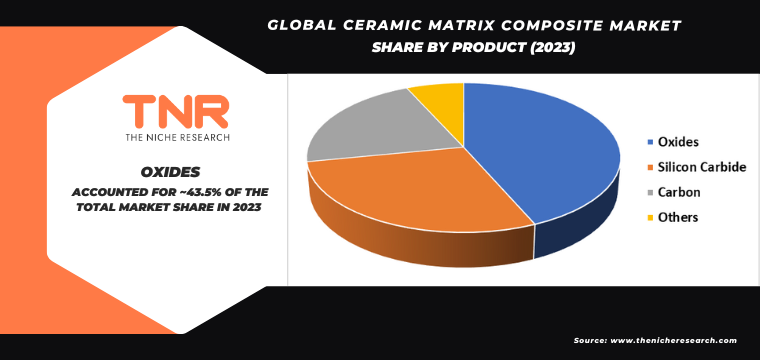
By Product, Oxide Segment had the Highest Share in the Global Ceramic Matrix Composite Market in 2023.
Oxides are emerging as a critical component in ceramic matrix composites (CMCs), driving demand across various industries due to their unique properties and applications. One of the primary demand drivers for oxide-based CMCs is their exceptional thermal and chemical stability, making them ideal for high-temperature applications in industries such as aerospace, automotive, and energy. In aerospace, oxides like alumina (Al2O3) and zirconia (ZrO2) are incorporated into CMCs for engine components, exhaust systems, and thermal barriers, where they provide superior heat resistance and mechanical strength.
The automotive sector utilizes oxide-based CMCs for lightweighting initiatives aimed at improving fuel efficiency and reducing emissions, particularly in engine parts and brake components. In the energy sector, oxides play a crucial role in CMCs for applications such as turbine blades in gas turbines and thermal insulation in nuclear reactors, where they contribute to increased efficiency and reliability. As technological advancements continue to enhance the manufacturing and performance capabilities of oxide-based CMCs, their demand is poised to grow, driven by the pursuit of higher performance, sustainability, and cost-effectiveness across global industries.
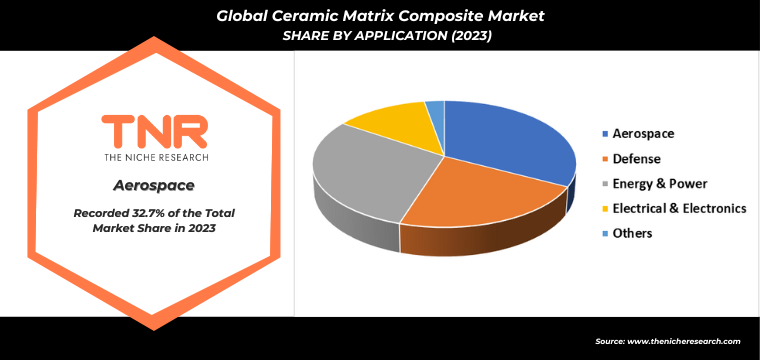
By Application, Aerospace Segment had the Highest Share in the Global Ceramic Matrix Composite Market in 2023.
The aerospace industry is increasingly turning to ceramic matrix composites (CMCs) as a pivotal solution to enhance aircraft performance and efficiency. One of the demand drivers for CMCs in aerospace is their exceptional mechanical properties, including high strength-to-weight ratio, excellent thermal stability, and resistance to corrosion and high temperatures. These properties make CMCs ideal for critical aerospace components such as engine turbine blades, exhaust nozzles, and thermal protection systems.
By integrating CMCs into aircraft structures, manufacturers can achieve significant weight reduction compared to traditional metallic alloys, which directly translates into improved fuel efficiency and reduced emissions. Moreover, CMCs contribute to extended component lifespan and reduced maintenance requirements due to their durability and resistance to fatigue and wear. As the aerospace industry strives for greener and more sustainable aviation solutions, the demand for CMCs is expected to continue growing, driven by their unique performance advantages and contribution to achieving stringent environmental regulations and operational efficiencies in modern aircraft designs.
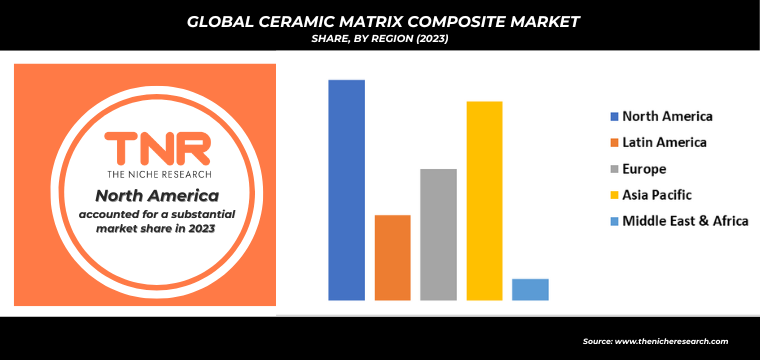
By Region, Asia Pacific is Anticipated as Fastest Growing Region in Global Ceramic Matrix Composite Market in 2023.
Asia-Pacific is projected as the fastest growing region in the ceramic matrix composite market during the forecasted period. Growing aerospace industry, which increasingly relies on lightweight and high-performance materials like CMCs to improve fuel efficiency and reduce emissions is driving the demand for ceramic matrix composite in Asia-Pacific region. CMCs offer exceptional mechanical properties such as high strength, stiffness, and thermal resistance, making them ideal for aerospace applications including engine components, thermal protection systems, and structural elements. Additionally, the automotive sector in countries like China and Japan is adopting CMCs for lightweighting initiatives aimed at enhancing vehicle performance and fuel economy.
The renewable energy sector is also contributing to the demand for CMCs, particularly in applications such as turbine blades for wind energy and thermal management systems for solar power generation. As technological advancements and manufacturing capabilities in the Asia-Pacific continue to evolve, the demand for CMCs is expected to grow, driven by their unique combination of performance benefits across various industries.
Competitive Landscape
Some of the players operating in the ceramic matrix composite market are
- 3M Company
- COI Ceramics, Inc.
- Coorstek, Inc.
- General Electric Company
- Kyocera Corporation
- Lancer Systems LP
- SGL Carbon Company
- Ube Industries, Ltd.
- Ultramet, Inc.
- Other Industry Participants
Global Ceramic Matrix Composite Market Scope
| Report Specifications | Details |
| Market Revenue in 2023 | US$ 3.6 Bn |
| Market Size Forecast by 2034 | US$ 13.3 Bn |
| Growth Rate (CAGR) | 12.6% |
| Historic Data | 2016 – 2022 |
| Base Year for Estimation | 2023 |
| Forecast Period | 2024 – 2034 |
| Report Inclusions | Market Size & Estimates, Market Dynamics, Competitive Scenario, Trends, Growth Factors, Market Determinants, Key Investment Segmentation, Product/Service/Solutions Benchmarking |
| Segments Covered | By Product, By Fiber Type, By Matrix Type, By Application, By Region |
| Regions Covered | North America, Europe, Asia Pacific, Middle East & Africa, Latin America |
| Countries Covered | U.S., Canada, Mexico, Rest of North America, France, The UK, Spain, Germany, Italy, Nordic Countries (Denmark, Finland, Iceland, Sweden, Norway), Benelux Union (Belgium, The Netherlands, Luxembourg), Rest of Europe, China, Japan, India, New Zealand, Australia, South Korea, Southeast Asia (Indonesia, Thailand, Malaysia, Singapore, Rest of Southeast Asia), Rest of Asia Pacific, Saudi Arabia, UAE, Egypt, Kuwait, South Africa, Rest of Middle East & Africa, Brazil, Argentina, Rest of Latin America |
| Key Players | 3M Company, COI Ceramics, Inc., Coorstek, Inc., General Electric Company, Kyocera Corporation, Lancer Systems LP, SGL Carbon Company, Ube Industries, Ltd., Ultramet, Inc. |
| Customization Scope | Customization allows for the inclusion/modification of content pertaining to geographical regions, countries, and specific market segments. |
| Pricing & Procurement Options | Explore purchase options tailored to your specific research requirements |
| Contact Details | Consult With Our Expert
Japan (Toll-Free): +81 663-386-8111 South Korea (Toll-Free): +82-808- 703-126 Saudi Arabia (Toll-Free): +966 800-850-1643 United Kingdom: +44 753-710-5080 United States: +1 302-232-5106 E-mail: askanexpert@thenicheresearch.com
|
Global Ceramic Matrix Composite Market
By Product
- Oxides
- Silicon Carbide
- Carbon
- Others
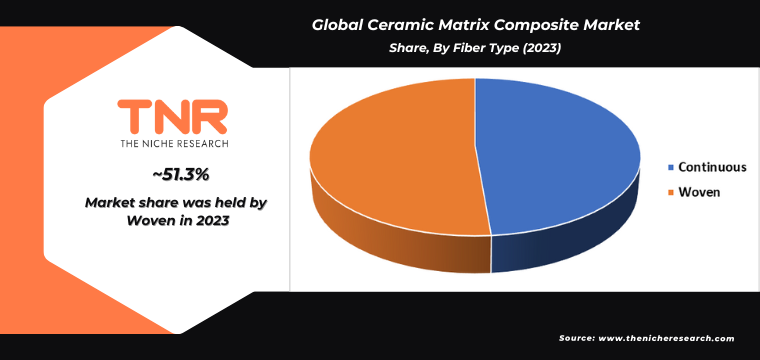
By Fiber Type
- Continuous
- Woven
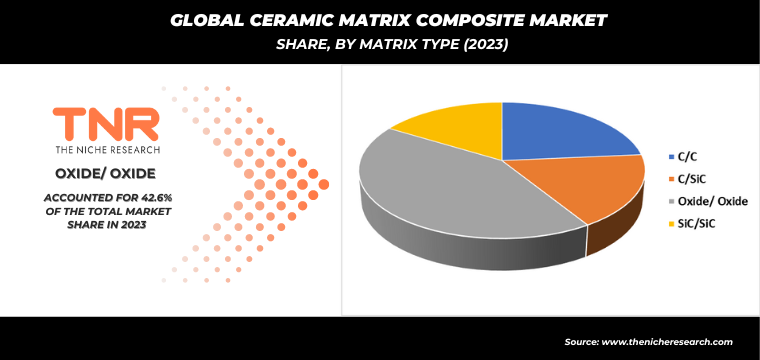
By Matrix Type
- C/C
- C/SiC
- Oxide/ Oxide
- SiC/SiC
By Application
- Aerospace
- Defense
- Energy & Power
- Electrical & Electronics
- Others
By Region
- North America (U.S., Canada, Mexico, Rest of North America)
- Europe (France, The UK, Spain, Germany, Italy, Nordic Countries (Denmark, Finland, Iceland, Sweden, Norway), Benelux Union (Belgium, The Netherlands, Luxembourg), Rest of Europe)
- Asia Pacific (China, Japan, India, New Zealand, Australia, South Korea, Southeast Asia (Indonesia, Thailand, Malaysia, Singapore, Rest of Southeast Asia), Rest of Asia Pacific)
- Middle East & Africa (Saudi Arabia, UAE, Egypt, Kuwait, South Africa, Rest of Middle East & Africa)
- Latin America (Brazil, Argentina, Rest of Latin America)
Report Layout:
Table of Contents
Note: This ToC is tentative and can be changed according to the research study conducted during the course of report completion.
**Exclusive for Multi-User and Enterprise User.
Global Ceramic Matrix Composite Market
By Product
- Oxides
- Silicon Carbide
- Carbon
- Others
By Fiber Type
- Continuous
- Woven
By Matrix Type
- C/C
- C/SiC
- Oxide/ Oxide
- SiC/SiC
By Application
- Aerospace
- Defense
- Energy & Power
- Electrical & Electronics
- Others
By Region
- North America (U.S., Canada, Mexico, Rest of North America)
- Europe (France, The UK, Spain, Germany, Italy, Nordic Countries (Denmark, Finland, Iceland, Sweden, Norway), Benelux Union (Belgium, The Netherlands, Luxembourg), Rest of Europe)
- Asia Pacific (China, Japan, India, New Zealand, Australia, South Korea, Southeast Asia (Indonesia, Thailand, Malaysia, Singapore, Rest of Southeast Asia), Rest of Asia Pacific)
- Middle East & Africa (Saudi Arabia, UAE, Egypt, Kuwait, South Africa, Rest of Middle East & Africa)
- Latin America (Brazil, Argentina, Rest of Latin America)
The Niche Research approach encompasses both primary and secondary research methods to provide comprehensive insights. While primary research is the cornerstone of our studies, we also incorporate secondary research sources such as company annual reports, premium industry databases, press releases, industry journals, and white papers.
Within our primary research, we actively engage with various industry stakeholders, conducting paid interviews and surveys. Our meticulous analysis extends to every market participant in major countries, allowing us to thoroughly examine their portfolios, calculate market shares, and segment revenues.
Our data collection primarily focuses on individual countries within our research scope, enabling us to estimate regional market sizes. Typically, we employ a bottom-up approach, meticulously tracking trends in different countries. We analyze growth drivers, constraints, technological innovations, and opportunities for each country, ultimately arriving at regional figures.Our process begins by examining the growth prospects of each country. Building upon these insights, we project growth and trends for the entire region. Finally, we utilize our proprietary model to refine estimations and forecasts.
Our data validation standards are integral to ensuring the reliability and accuracy of our research findings. Here’s a breakdown of our data validation processes and the stakeholders we engage with during our primary research:
- Supply Side Analysis: We initiate a supply side analysis by directly contacting market participants, through telephonic interviews and questionnaires containing both open-ended and close-ended questions. We gather information on their portfolios, segment revenues, developments, and growth strategies.
- Demand Side Analysis: To gain insights into adoption trends and consumer preferences, we reach out to target customers and users (non-vendors). This information forms a vital part of the qualitative analysis section of our reports, covering market dynamics, adoption trends, consumer behavior, spending patterns, and other related aspects.
- Consultant Insights: We tap into the expertise of our partner consultants from around the world to obtain their unique viewpoints and perspectives. Their insights contribute to a well-rounded understanding of the markets under investigation.
- In-House Validation: To ensure data accuracy and reliability, we conduct cross-validation of data points and information through our in-house team of consultants and utilize advanced data modeling tools for thorough verification.
The forecasts we provide are based on a comprehensive assessment of various factors, including:
- Market Trends and Past Performance (Last Five Years): We accurately analyze market trends and performance data from preceding five years to identify historical patterns and understand the market’s evolution.
- Historical Performance and Growth of Market Participants: We assess the historical performance and growth trajectories of key market participants. This analysis provides insights into the competitive landscape and individual company strategies.
- Market Determinants Impact Analysis (Next Eight Years): We conduct a rigorous analysis of the factors that are projected to influence the market over the next eight years. This includes assessing both internal and external determinants that can shape market dynamics.
- Drivers and Challenges for the Forecast Period:Identify the factors expected to drive market growth during the forecast period, as well as the challenges that the industry may face. This analysis aids in deriving an accurate growth rate projection.
- New Acquisitions, Collaborations, or Partnerships: We keep a close watch on any new acquisitions, collaborations, or partnerships within the industry. These developments can have a significant impact on market dynamics and competitiveness.
- Macro and Micro Factors Analysis:A thorough examination of both macro-level factors (e.g., economic trends, regulatory changes) and micro-level factors (e.g., technological advancements, consumer preferences) that may influence the market during the forecast period.
- End-User Sentiment Analysis: To understand the market from the end-user perspective, we conduct sentiment analysis. This involves assessing the sentiment, preferences, and feedback of the end-users, which can provide valuable insights into market trends.
- Perspective of Primary Participants: Insights gathered directly from primary research participants play a crucial role in shaping our forecasts. Their perspectives and experiences provide valuable qualitative data.
- Year-on-Year Growth Trend: We utilize a year-on-year growth trend based on historical market growth and expected future trends. This helps in formulating our growth projections, aligning them with the market’s historical performance.
Research process adopted by TNR involves multiple stages, including data collection, validation, quality checks, and presentation. It’s crucial that the data and information we provide add value to your existing market understanding and expertise. We have also established partnerships with business consulting, research, and survey organizations across regions and globally to collaborate on regional analysis and data validation, ensuring the highest level of accuracy and reliability in our reports.