Global Clean Label Ingredients Market, By Type, by Form, By Application, By Region & Segmental Insights Trends and Forecast, 2024 – 2034

  • Industry: Food & Beverages
  • Report ID: TNR-110-1292
  • Number of Pages: 420
  • Table/Charts : Yes
  • September, 2024
  • Base Year : 2024
  • No. of Companies : 10+
  • No. of Countries : 29
  • Views : 10019
  • Covid Impact Covered: Yes
  • War Impact Covered: Yes
  • Formats : PDF, Excel, PPT

Clean label ingredients refer to natural, minimally processed ingredients that consumers recognize and trust. These ingredients are free from artificial additives, preservatives, and chemicals, aligning with the growing consumer demand for transparency and healthier food options.

The clean label ingredient market has experienced substantial growth as consumers increasingly seek foods and beverages made with recognizable, natural ingredients. These ingredients are vital in various applications, including beverages, bakery products, dairy, and processed foods. Consumers use clean label products daily, from enjoying a morning smoothie made with natural flavors and sweeteners to choosing snacks free from synthetic additives. The importance of clean label ingredients lies in their contribution to overall well-being, offering a healthier alternative to conventional processed foods and aligning with the global trend toward health-conscious eating.

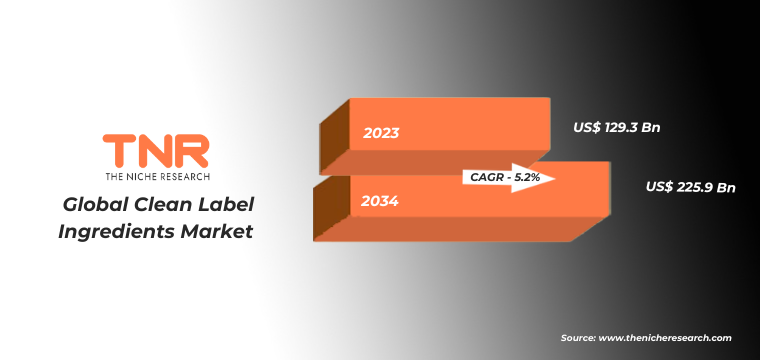
“The Global Clean Label Ingredients Market Generated Revenue of US$ 129.3 Billion in 2023 and US$ 225.9 Billion in 2034 and is Expected to Grow at a CAGR of 5.2% from 2024 to 2034.”

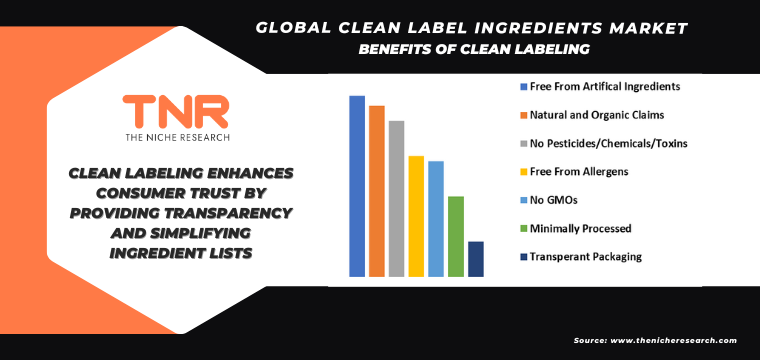
Benefits of Clean Labeling:

Clean labeling offers multiple benefits to both consumers and manufacturers. For consumers, it ensures transparency, allowing them to make informed choices based on clear, simple ingredient lists. This fosters trust and aligns with growing health consciousness. For manufacturers, clean labeling meets consumer demand for natural, minimally processed ingredients, enhancing brand reputation and loyalty. Additionally, it provides a competitive edge in a market increasingly focused on health and wellness. By embracing clean labeling, companies can appeal to a broader audience, supporting long-term growth and sustainability in the food industry.

Clean Label Ingredients Market Dynamic:

Growth Drivers-

  • Rising Consumer Health Consciousness: Growing awareness of the health impacts of artificial additives is driving demand for clean label ingredients. Consumers increasingly prefer natural, recognizable ingredients, fueling market growth as manufacturers reformulate products to meet this demand for healthier, more transparent options.
  • Stringent Regulatory Standards: Governments worldwide are implementing stricter food labeling regulations, encouraging the use of clean label ingredients. These regulations push manufacturers to adopt natural alternatives, driving market growth as they strive to comply with evolving standards and meet consumer expectations for transparency.
  • Increased Preference for Natural Products: A significant shift towards natural and organic foods is boosting the clean label ingredient market. As consumers seek minimally processed products with fewer artificial additives, manufacturers are responding by incorporating clean label ingredients, driving growth across various food and beverage categories.

Challenges-

  • High Production Costs: Clean label ingredients often involve higher production costs due to the use of natural, minimally processed materials. These costs can be challenging for manufacturers, impacting profit margins and potentially leading to higher product prices, which might limit consumer accessibility and market expansion.
  • Limited Ingredient Availability: The global availability of clean label ingredients can be inconsistent, leading to supply chain challenges. Sourcing high-quality, natural ingredients may be difficult, particularly in regions with limited agricultural resources, impacting manufacturers’ ability to consistently produce clean label products at scale.
  • Consumer Misunderstanding: Despite growing demand, many consumers still lack a clear understanding of clean label terminology. Misinterpretation or skepticism can lead to confusion and reduced trust, posing a challenge for manufacturers trying to market these products effectively and educate consumers on the benefits of clean label ingredients.

Clean Label Ingredients Market Segmentation by Type, Form, Application, Region

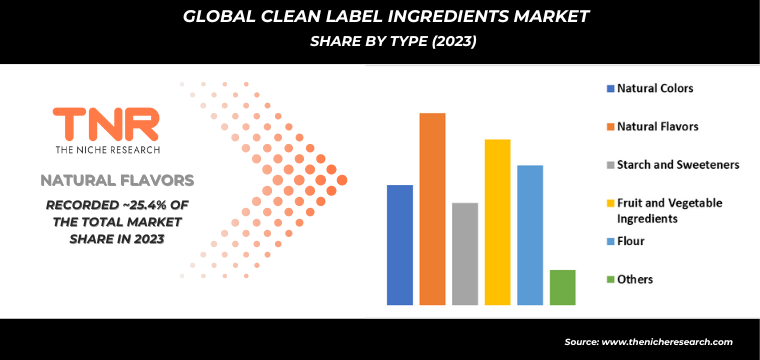
Fruit and vegetable ingredients segment is set to dominate the clean label ingredients market, commanding a substantial revenue share of 21.9% over the forecast period. This dominance is driven by the increasing consumer preference for natural, whole-food-based ingredients in their diets. Fruits and vegetables are perceived as healthier and more authentic, aligning perfectly with the clean label movement’s emphasis on transparency and simplicity. These ingredients are extensively used in a wide range of food products, including snacks, beverages, and baked goods, further boosting their market share. As consumers continue to prioritize natural, minimally processed foods, the demand for fruit and vegetable ingredients is expected to grow steadily.

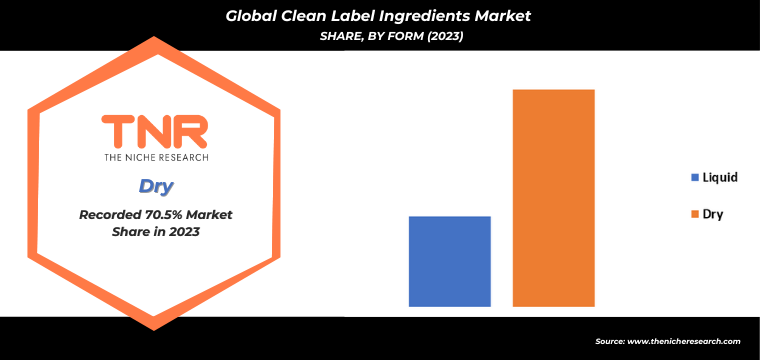
Liquid form dominated the global clean label ingredients market, acquiring a revenue share of 29.5% due to its versatility and ease of use. Unlike dry forms, liquid ingredients are more easily integrated into a wide range of food and beverage products, allowing for consistent texture and flavor distribution. Their ability to blend seamlessly without the need for rehydration or complex processing makes them highly preferred in the industry. Additionally, liquid ingredients are often more stable and can be more easily adjusted for concentration, offering manufacturers greater flexibility in formulation, further driving their dominance in the market.

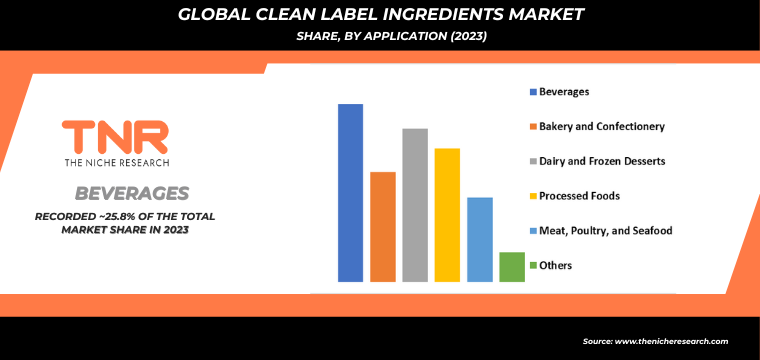
Dairy and frozen desserts segment is anticipated to be the fastest-growing application in the clean label ingredients market, capturing a substantial revenue share of 22.3% over the forecast period. This growth is fueled by increasing consumer demand for healthier, natural alternatives in indulgent products like ice cream, yogurt, and frozen treats. As consumers become more health-conscious, they seek clean label products free from artificial additives, preservatives, and colorings. Manufacturers are responding by reformulating their offerings with clean label ingredients, enhancing product appeal while maintaining taste and quality. This trend is driving rapid expansion in the dairy and frozen desserts sector within the clean label market.

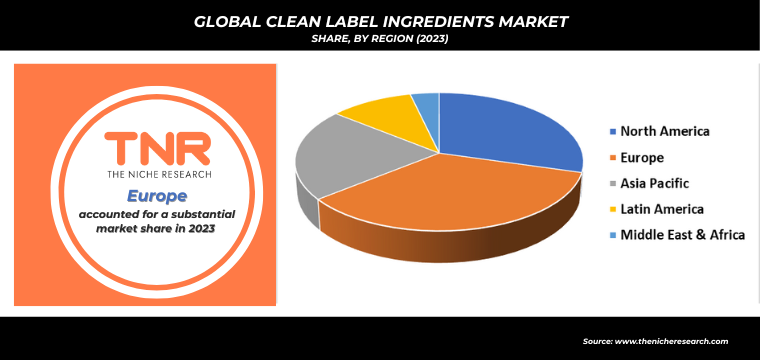
In 2023, North America is anticipated to play a significant role in propelling the growth of the clean label ingredients market, contributing approximately 29.5% to its overall expansion. This significant role is attributed to the region’s strong consumer demand for transparency and natural products, driven by heightened health consciousness and awareness of food additives. The robust presence of leading food and beverage manufacturers in North America, coupled with strict regulatory standards, further accelerates the adoption of clean label ingredients. As consumers increasingly prioritize clean, natural ingredients in their diets, the region’s influence on the market’s expansion is set to remain substantial.

Major Players in Clean Label Ingredients Market

  • Archer Daniels Midland
  • Cargill
  • Corbion Inc.
  • Dupont De Nemours and Company
  • Fluoryx
  • Frutarom
  • Ingredion Incorporated
  • Kerry Group Plc
  • Kerry Group PLC
  • Koninklijke DSM N.V
  • Sensient Technologies
  • Tate & Lyle Plc
  • TCI Chemicals
  • Wilshire Technologies
  • Other Industry Participants

Global Clean Label Ingredients Market Scope:

Report Specifications Details
Market Revenue in 2023 US$ 129.3 Bn
Market Size Forecast by 2034 US$ 225.9 Bn
Growth Rate (CAGR) 5.2%
Historic Data 2016 – 2022
Base Year for Estimation 2023
Forecast Period 2024 – 2034
Report Inclusions Market Size & Estimates, Market Dynamics, Competitive Scenario, Trends, Growth Factors, Market Determinants, Key Investment Segmentation, Product/Service/Solutions Benchmarking
Segments Covered By Type, By Form, By Application, By Region
Regions Covered North America, Europe, Asia Pacific, Middle East & Africa, Latin America
Countries Covered U.S., Canada, Mexico, Rest of North America,  France, The UK, Spain, Germany, Italy, Nordic Countries (Denmark, Finland, Iceland, Sweden, Norway), Benelux Union (Belgium, The Netherlands, Luxembourg), Rest of Europe,  China, Japan, India, New Zealand, Australia, South Korea, Southeast Asia (Indonesia, Thailand, Malaysia, Singapore, Rest of Southeast Asia), Rest of Asia Pacific,  Saudi Arabia, UAE, Egypt, Kuwait, South Africa, Rest of Middle East & Africa,  Brazil, Argentina, Rest of Latin America
Key Players Archer Daniels Midland, Cargill, Corbion Inc., Dupont De Nemours and Company, Fluoryx, Frutarom, Ingredion Incorporated, Kerry Group Plc, Kerry Group PLC, Koninklijke DSM N.V, Sensient Technologies, Tate & Lyle Plc, TCI Chemicals, Wilshire Technologies
Customization Scope Customization allows for the inclusion/modification of content pertaining to geographical regions, countries, and specific market segments.
Pricing & Procurement Options Explore purchase options tailored to your specific research requirements
Contact Details Consult With Our Expert

Japan (Toll-Free):  +81 663-386-8111

South Korea (Toll-Free):  +82-808- 703-126

Saudi Arabia (Toll-Free):  +966 800-850-1643

United Kingdom: +44 753-710-5080

United States: +1 302-232-5106

E-mail:  askanexpert@thenicheresearch.com


Global Clean Label Ingredients Market

By Type

  • Natural Colors
  • Natural Flavors
  • Starch and Sweeteners
  • Fruit and Vegetable Ingredients
  • Flour
  • Others

By Form

  • Liquid
  • Dry

By Application

  • Beverages
  • Bakery and Confectionery
  • Dairy and Frozen Desserts
  • Processed Foods
  • Meat, Poultry, and Seafood
  • Others

By Region

  • North America (U.S., Canada, Mexico, Rest of North America)
  • Europe (France, The UK, Spain, Germany, Italy, Nordic Countries (Denmark, Finland, Iceland, Sweden, Norway), Benelux Union (Belgium, The Netherlands, Luxembourg), Rest of Europe)
  • Asia Pacific (China, Japan, India, New Zealand, Australia, South Korea, Southeast Asia (Indonesia, Thailand, Malaysia, Singapore, Rest of Southeast Asia), Rest of Asia Pacific)
  • Middle East & Africa (Saudi Arabia, UAE, Egypt, Kuwait, South Africa, Rest of Middle East & Africa)
  • Latin America (Brazil, Argentina, Rest of Latin America)

Report Layout:

Table of Contents

.

1.Market Scope
1.1.Market Segmentation
1.2.Years Considered
1.2.1.Historic Years: 2016 – 2022
1.2.2.Base Year: 2023
1.2.3.Forecast Years: 2024 – 2034
2.Key Target Audiences
3.Research Methodology
3.1.Primary Research
3.1.1.Research Questionnaire
3.1.2.Global Percentage Breakdown
3.1.3.Primary Interviews: Key Opinion Leaders (KOLs)
3.2.Secondary Research
3.2.1.Paid Databases
3.2.2.Secondary Sources
3.3.Market Size Estimates
3.3.1.Top-Down Approach
3.3.2.Bottom-Up Approach
3.4.Data Triangulation Methodology
3.5.Research Assumptions
4.Recommendations and Insights from TNR’s Perspective**
5.Holistic Overview of Clean Label Ingredients Market
6.Market Synopsis: Clean Label Ingredients Market
7.Clean Label Ingredients Market Analysis: Qualitative Perspective
7.1.Introduction
7.1.1.Product Definition
7.1.2.Industry Development
7.2.Market Dynamics
7.2.1.Drivers
7.2.2.Restraints
7.2.3.Opportunities
7.2.4.Challenges
7.3.Trends in Clean Label Ingredients Market
7.4.Market Determinants Radar Chart
7.5.Macro-Economic and Micro-Economic Indicators: Clean Label Ingredients Market
7.6.Industry Gross Margin Overview
7.7.Porter’s Five Force Analysis
7.8.Impact of Covid-19 on Clean Label Ingredients Market
7.9.PESTEL Analysis
7.10.Value Chain Analysis
7.11.Pricing Analysis, By Region (2023)
7.11.1.North America
7.11.2.Europe
7.11.3.Asia Pacific
7.11.4.Middle East and Africa
7.11.5.Latin America
8.Global Clean Label Ingredients Market Analysis and Forecasts, 2024 – 2034
8.1.Overview
8.1.1.Global Clean Label Ingredients Market Revenue (US$ Mn)
8.2.Global Clean Label Ingredients Market Revenue (US$ Mn) and Forecasts, By Type
8.2.1.Natural Colors
8.2.1.1.Definition
8.2.1.2.Market Estimation and Penetration, 2016 – 2023
8.2.1.3.Market Forecast, 2024 – 2034
8.2.1.4.Compound Annual Growth Rate (CAGR)
8.2.1.5.Regional Bifurcation
8.2.1.5.1.North America
8.2.1.5.1.1.Market Estimation, 2016 – 2023
8.2.1.5.1.2.Market Forecast, 2024 – 2034
8.2.1.5.2.Europe
8.2.1.5.2.1.Market Estimation, 2016 – 2023
8.2.1.5.2.2.Market Forecast, 2024 – 2034
8.2.1.5.3.Asia Pacific
8.2.1.5.3.1.Market Estimation, 2016 – 2023
8.2.1.5.3.2.Market Forecast, 2024 – 2034
8.2.1.5.4.Middle East and Africa
8.2.1.5.4.1.Market Estimation, 2016 – 2023
8.2.1.5.4.2.Market Forecast, 2024 – 2034
8.2.1.5.5.Latin America
8.2.1.5.5.1.Market Estimation, 2016 – 2023
8.2.1.5.5.2.Market Forecast, 2024 – 2034
8.2.2.Natural Flavors
8.2.2.1.Definition
8.2.2.2.Market Estimation and Penetration, 2016 – 2023
8.2.2.3.Market Forecast, 2024 – 2034
8.2.2.4.Compound Annual Growth Rate (CAGR)
8.2.2.5.Regional Bifurcation
8.2.2.5.1.North America
8.2.2.5.1.1.Market Estimation, 2016 – 2023
8.2.2.5.1.2.Market Forecast, 2024 – 2034
8.2.2.5.2.Europe
8.2.2.5.2.1.Market Estimation, 2016 – 2023
8.2.2.5.2.2.Market Forecast, 2024 – 2034
8.2.2.5.3.Asia Pacific
8.2.2.5.3.1.Market Estimation, 2016 – 2023
8.2.2.5.3.2.Market Forecast, 2024 – 2034
8.2.2.5.4.Middle East and Africa
8.2.2.5.4.1.Market Estimation, 2016 – 2023
8.2.2.5.4.2.Market Forecast, 2024 – 2034
8.2.2.5.5.Latin America
8.2.2.5.5.1.Market Estimation, 2016 – 2023
8.2.2.5.5.2.Market Forecast, 2024 – 2034
8.2.3.Starch and Sweeteners
8.2.3.1.Definition
8.2.3.2.Market Estimation and Penetration, 2016 – 2023
8.2.3.3.Market Forecast, 2024 – 2034
8.2.3.4.Compound Annual Growth Rate (CAGR)
8.2.3.5.Regional Bifurcation
8.2.3.5.1.North America
8.2.3.5.1.1.Market Estimation, 2016 – 2023
8.2.3.5.1.2.Market Forecast, 2024 – 2034
8.2.3.5.2.Europe
8.2.3.5.2.1.Market Estimation, 2016 – 2023
8.2.3.5.2.2.Market Forecast, 2024 – 2034
8.2.3.5.3.Asia Pacific
8.2.3.5.3.1.Market Estimation, 2016 – 2023
8.2.3.5.3.2.Market Forecast, 2024 – 2034
8.2.3.5.4.Middle East and Africa
8.2.3.5.4.1.Market Estimation, 2016 – 2023
8.2.3.5.4.2.Market Forecast, 2024 – 2034
8.2.3.5.5.Latin America
8.2.3.5.5.1.Market Estimation, 2016 – 2023
8.2.3.5.5.2.Market Forecast, 2024 – 2034
8.2.4.Fruit and Vegetable Ingredients
8.2.4.1.Definition
8.2.4.2.Market Estimation and Penetration, 2016 – 2023
8.2.4.3.Market Forecast, 2024 – 2034
8.2.4.4.Compound Annual Growth Rate (CAGR)
8.2.4.5.Regional Bifurcation
8.2.4.5.1.North America
8.2.4.5.1.1.Market Estimation, 2016 – 2023
8.2.4.5.1.2.Market Forecast, 2024 – 2034
8.2.4.5.2.Europe
8.2.4.5.2.1.Market Estimation, 2016 – 2023
8.2.4.5.2.2.Market Forecast, 2024 – 2034
8.2.4.5.3.Asia Pacific
8.2.4.5.3.1.Market Estimation, 2016 – 2023
8.2.4.5.3.2.Market Forecast, 2024 – 2034
8.2.4.5.4.Middle East and Africa
8.2.4.5.4.1.Market Estimation, 2016 – 2023
8.2.4.5.4.2.Market Forecast, 2024 – 2034
8.2.4.5.5.Latin America
8.2.4.5.5.1.Market Estimation, 2016 – 2023
8.2.4.5.5.2.Market Forecast, 2024 – 2034
8.2.5.Flour
8.2.5.1.Definition
8.2.5.2.Market Estimation and Penetration, 2016 – 2023
8.2.5.3.Market Forecast, 2024 – 2034
8.2.5.4.Compound Annual Growth Rate (CAGR)
8.2.5.5.Regional Bifurcation
8.2.5.5.1.North America
8.2.5.5.1.1.Market Estimation, 2016 – 2023
8.2.5.5.1.2.Market Forecast, 2024 – 2034
8.2.5.5.2.Europe
8.2.5.5.2.1.Market Estimation, 2016 – 2023
8.2.5.5.2.2.Market Forecast, 2024 – 2034
8.2.5.5.3.Asia Pacific
8.2.5.5.3.1.Market Estimation, 2016 – 2023
8.2.5.5.3.2.Market Forecast, 2024 – 2034
8.2.5.5.4.Middle East and Africa
8.2.5.5.4.1.Market Estimation, 2016 – 2023
8.2.5.5.4.2.Market Forecast, 2024 – 2034
8.2.5.5.5.Latin America
8.2.5.5.5.1.Market Estimation, 2016 – 2023
8.2.5.5.5.2.Market Forecast, 2024 – 2034
8.2.6.Others
8.2.6.1.Definition
8.2.6.2.Market Estimation and Penetration, 2016 – 2023
8.2.6.3.Market Forecast, 2024 – 2034
8.2.6.4.Compound Annual Growth Rate (CAGR)
8.2.6.5.Regional Bifurcation
8.2.6.5.1.North America
8.2.6.5.1.1.Market Estimation, 2016 – 2023
8.2.6.5.1.2.Market Forecast, 2024 – 2034
8.2.6.5.2.Europe
8.2.6.5.2.1.Market Estimation, 2016 – 2023
8.2.6.5.2.2.Market Forecast, 2024 – 2034
8.2.6.5.3.Asia Pacific
8.2.6.5.3.1.Market Estimation, 2016 – 2023
8.2.6.5.3.2.Market Forecast, 2024 – 2034
8.2.6.5.4.Middle East and Africa
8.2.6.5.4.1.Market Estimation, 2016 – 2023
8.2.6.5.4.2.Market Forecast, 2024 – 2034
8.2.6.5.5.Latin America
8.2.6.5.5.1.Market Estimation, 2016 – 2023
8.2.6.5.5.2.Market Forecast, 2024 – 2034
8.3.Key Segment for Channeling Investments
8.3.1.By Type
9.Global Clean Label Ingredients Market Analysis and Forecasts, 2024 – 2034
9.1.Overview
9.2.Global Clean Label Ingredients Market Revenue (US$ Mn) and Forecasts, By Form
9.2.1.Liquid
9.2.1.1.Definition
9.2.1.2.Market Estimation and Penetration, 2016 – 2023
9.2.1.3.Market Forecast, 2024 – 2034
9.2.1.4.Compound Annual Growth Rate (CAGR)
9.2.1.5.Regional Bifurcation
9.2.1.5.1.North America
9.2.1.5.1.1.Market Estimation, 2016 – 2023
9.2.1.5.1.2.Market Forecast, 2024 – 2034
9.2.1.5.2.Europe
9.2.1.5.2.1.Market Estimation, 2016 – 2023
9.2.1.5.2.2.Market Forecast, 2024 – 2034
9.2.1.5.3.Asia Pacific
9.2.1.5.3.1.Market Estimation, 2016 – 2023
9.2.1.5.3.2.Market Forecast, 2024 – 2034
9.2.1.5.4.Middle East and Africa
9.2.1.5.4.1.Market Estimation, 2016 – 2023
9.2.1.5.4.2.Market Forecast, 2024 – 2034
9.2.1.5.5.Latin America
9.2.1.5.5.1.Market Estimation, 2016 – 2023
9.2.1.5.5.2.Market Forecast, 2024 – 2034
9.2.2.Dry
9.2.2.1.Definition
9.2.2.2.Market Estimation and Penetration, 2016 – 2023
9.2.2.3.Market Forecast, 2024 – 2034
9.2.2.4.Compound Annual Growth Rate (CAGR)
9.2.2.5.Regional Bifurcation
9.2.2.5.1.North America
9.2.2.5.1.1.Market Estimation, 2016 – 2023
9.2.2.5.1.2.Market Forecast, 2024 – 2034
9.2.2.5.2.Europe
9.2.2.5.2.1.Market Estimation, 2016 – 2023
9.2.2.5.2.2.Market Forecast, 2024 – 2034
9.2.2.5.3.Asia Pacific
9.2.2.5.3.1.Market Estimation, 2016 – 2023
9.2.2.5.3.2.Market Forecast, 2024 – 2034
9.2.2.5.4.Middle East and Africa
9.2.2.5.4.1.Market Estimation, 2016 – 2023
9.2.2.5.4.2.Market Forecast, 2024 – 2034
9.2.2.5.5.Latin America
9.2.2.5.5.1.Market Estimation, 2016 – 2023
9.2.2.5.5.2.Market Forecast, 2024 – 2034
9.3.Key Segment for Channeling Investments
9.3.1.By Form
10.Global Clean Label Ingredients Market Analysis and Forecasts, 2024 – 2034
10.1.Overview
10.2.Global Clean Label Ingredients Market Revenue (US$ Mn) and Forecasts, By Application
10.2.1.Beverages
10.2.1.1.Definition
10.2.1.2.Market Estimation and Penetration, 2016 – 2023
10.2.1.3.Market Forecast, 2024 – 2034
10.2.1.4.Compound Annual Growth Rate (CAGR)
10.2.1.5.Regional Bifurcation
10.2.1.5.1.North America
10.2.1.5.1.1.Market Estimation, 2016 – 2023
10.2.1.5.1.2.Market Forecast, 2024 – 2034
10.2.1.5.2.Europe
10.2.1.5.2.1.Market Estimation, 2016 – 2023
10.2.1.5.2.2.Market Forecast, 2024 – 2034
10.2.1.5.3.Asia Pacific
10.2.1.5.3.1.Market Estimation, 2016 – 2023
10.2.1.5.3.2.Market Forecast, 2024 – 2034
10.2.1.5.4.Middle East and Africa
10.2.1.5.4.1.Market Estimation, 2016 – 2023
10.2.1.5.4.2.Market Forecast, 2024 – 2034
10.2.1.5.5.Latin America
10.2.1.5.5.1.Market Estimation, 2016 – 2023
10.2.1.5.5.2.Market Forecast, 2024 – 2034
10.2.2.Bakery and Confectionery
10.2.2.1.Definition
10.2.2.2.Market Estimation and Penetration, 2016 – 2023
10.2.2.3.Market Forecast, 2024 – 2034
10.2.2.4.Compound Annual Growth Rate (CAGR)
10.2.2.5.Regional Bifurcation
10.2.2.5.1.North America
10.2.2.5.1.1.Market Estimation, 2016 – 2023
10.2.2.5.1.2.Market Forecast, 2024 – 2034
10.2.2.5.2.Europe
10.2.2.5.2.1.Market Estimation, 2016 – 2023
10.2.2.5.2.2.Market Forecast, 2024 – 2034
10.2.2.5.3.Asia Pacific
10.2.2.5.3.1.Market Estimation, 2016 – 2023
10.2.2.5.3.2.Market Forecast, 2024 – 2034
10.2.2.5.4.Middle East and Africa
10.2.2.5.4.1.Market Estimation, 2016 – 2023
10.2.2.5.4.2.Market Forecast, 2024 – 2034
10.2.2.5.5.Latin America
10.2.2.5.5.1.Market Estimation, 2016 – 2023
10.2.2.5.5.2.Market Forecast, 2024 – 2034
10.2.3.Dairy and Frozen Desserts
10.2.3.1.Definition
10.2.3.2.Market Estimation and Penetration, 2016 – 2023
10.2.3.3.Market Forecast, 2024 – 2034
10.2.3.4.Compound Annual Growth Rate (CAGR)
10.2.3.5.Regional Bifurcation
10.2.3.5.1.North America
10.2.3.5.1.1.Market Estimation, 2016 – 2023
10.2.3.5.1.2.Market Forecast, 2024 – 2034
10.2.3.5.2.Europe
10.2.3.5.2.1.Market Estimation, 2016 – 2023
10.2.3.5.2.2.Market Forecast, 2024 – 2034
10.2.3.5.3.Asia Pacific
10.2.3.5.3.1.Market Estimation, 2016 – 2023
10.2.3.5.3.2.Market Forecast, 2024 – 2034
10.2.3.5.4.Middle East and Africa
10.2.3.5.4.1.Market Estimation, 2016 – 2023
10.2.3.5.4.2.Market Forecast, 2024 – 2034
10.2.3.5.5.Latin America
10.2.3.5.5.1.Market Estimation, 2016 – 2023
10.2.3.5.5.2.Market Forecast, 2024 – 2034
10.2.4.Processed Foods
10.2.4.1.Definition
10.2.4.2.Market Estimation and Penetration, 2016 – 2023
10.2.4.3.Market Forecast, 2024 – 2034
10.2.4.4.Compound Annual Growth Rate (CAGR)
10.2.4.5.Regional Bifurcation
10.2.4.5.1.North America
10.2.4.5.1.1.Market Estimation, 2016 – 2023
10.2.4.5.1.2.Market Forecast, 2024 – 2034
10.2.4.5.2.Europe
10.2.4.5.2.1.Market Estimation, 2016 – 2023
10.2.4.5.2.2.Market Forecast, 2024 – 2034
10.2.4.5.3.Asia Pacific
10.2.4.5.3.1.Market Estimation, 2016 – 2023
10.2.4.5.3.2.Market Forecast, 2024 – 2034
10.2.4.5.4.Middle East and Africa
10.2.4.5.4.1.Market Estimation, 2016 – 2023
10.2.4.5.4.2.Market Forecast, 2024 – 2034
10.2.4.5.5.Latin America
10.2.4.5.5.1.Market Estimation, 2016 – 2023
10.2.4.5.5.2.Market Forecast, 2024 – 2034
10.2.5.Meat, Poultry, and Seafood
10.2.5.1.Definition
10.2.5.2.Market Estimation and Penetration, 2016 – 2023
10.2.5.3.Market Forecast, 2024 – 2034
10.2.5.4.Compound Annual Growth Rate (CAGR)
10.2.5.5.Regional Bifurcation
10.2.5.5.1.North America
10.2.5.5.1.1.Market Estimation, 2016 – 2023
10.2.5.5.1.2.Market Forecast, 2024 – 2034
10.2.5.5.2.Europe
10.2.5.5.2.1.Market Estimation, 2016 – 2023
10.2.5.5.2.2.Market Forecast, 2024 – 2034
10.2.5.5.3.Asia Pacific
10.2.5.5.3.1.Market Estimation, 2016 – 2023
10.2.5.5.3.2.Market Forecast, 2024 – 2034
10.2.5.5.4.Middle East and Africa
10.2.5.5.4.1.Market Estimation, 2016 – 2023
10.2.5.5.4.2.Market Forecast, 2024 – 2034
10.2.5.5.5.Latin America
10.2.5.5.5.1.Market Estimation, 2016 – 2023
10.2.5.5.5.2.Market Forecast, 2024 – 2034
10.2.6.Others
10.2.6.1.Definition
10.2.6.2.Market Estimation and Penetration, 2016 – 2023
10.2.6.3.Market Forecast, 2024 – 2034
10.2.6.4.Compound Annual Growth Rate (CAGR)
10.2.6.5.Regional Bifurcation
10.2.6.5.1.North America
10.2.6.5.1.1.Market Estimation, 2016 – 2023
10.2.6.5.1.2.Market Forecast, 2024 – 2034
10.2.6.5.2.Europe
10.2.6.5.2.1.Market Estimation, 2016 – 2023
10.2.6.5.2.2.Market Forecast, 2024 – 2034
10.2.6.5.3.Asia Pacific
10.2.6.5.3.1.Market Estimation, 2016 – 2023
10.2.6.5.3.2.Market Forecast, 2024 – 2034
10.2.6.5.4.Middle East and Africa
10.2.6.5.4.1.Market Estimation, 2016 – 2023
10.2.6.5.4.2.Market Forecast, 2024 – 2034
10.2.6.5.5.Latin America
10.2.6.5.5.1.Market Estimation, 2016 – 2023
10.2.6.5.5.2.Market Forecast, 2024 – 2034
10.3.Key Segment for Channeling Investments
10.3.1.By Application
11.North America Clean Label Ingredients Market Analysis and Forecasts, 2024 – 2034
11.1.Overview
11.1.1.North America Clean Label Ingredients Market Revenue (US$ Mn)
11.2.North America Clean Label Ingredients Market Revenue (US$ Mn) and Forecasts, By Type
11.2.1.Natural Colors
11.2.2.Natural Flavors
11.2.3.Starch and Sweeteners
11.2.4.Fruit and Vegetable Ingredients
11.2.5.Flour
11.2.6.Others
11.3.North America Clean Label Ingredients Market Revenue (US$ Mn) and Forecasts, By Form
11.3.1.Liquid
11.3.2.Dry
11.4.North America Clean Label Ingredients Market Revenue (US$ Mn) and Forecasts, By Application
11.4.1.Beverages
11.4.2.Bakery and Confectionery
11.4.3.Dairy and Frozen Desserts
11.4.4.Processed Foods
11.4.5.Meat, Poultry, and Seafood
11.4.6.Others
11.5.North America Clean Label Ingredients Market Revenue (US$ Mn) and Forecasts, By Country
11.5.1.U.S
11.5.1.1.U.S Clean Label Ingredients Market Revenue (US$ Mn) and Forecasts, By Type
11.5.1.1.1.Natural Colors
11.5.1.1.2.Natural Flavors
11.5.1.1.3.Starch and Sweeteners
11.5.1.1.4.Fruit and Vegetable Ingredients
11.5.1.1.5.Flour
11.5.1.1.6.Others
11.5.1.2.U.S Clean Label Ingredients Market Revenue (US$ Mn) and Forecasts, By Form
11.5.1.2.1.Liquid
11.5.1.2.2.Dry
11.5.1.3.U.S Clean Label Ingredients Market Revenue (US$ Mn) and Forecasts, By Application
11.5.1.3.1.Beverages
11.5.1.3.2.Bakery and Confectionery
11.5.1.3.3.Dairy and Frozen Desserts
11.5.1.3.4.Processed Foods
11.5.1.3.5.Meat, Poultry, and Seafood
11.5.1.3.6.Others
11.5.2.Canada
11.5.2.1.Canada Clean Label Ingredients Market Revenue (US$ Mn) and Forecasts, By Type
11.5.2.1.1.Natural Colors
11.5.2.1.2.Natural Flavors
11.5.2.1.3.Starch and Sweeteners
11.5.2.1.4.Fruit and Vegetable Ingredients
11.5.2.1.5.Flour
11.5.2.1.6.Others
11.5.2.2.Canada Clean Label Ingredients Market Revenue (US$ Mn) and Forecasts, By Form
11.5.2.2.1.Liquid
11.5.2.2.2.Dry
11.5.2.3.Canada Clean Label Ingredients Market Revenue (US$ Mn) and Forecasts, By Application
11.5.2.3.1.Beverages
11.5.2.3.2.Bakery and Confectionery
11.5.2.3.3.Dairy and Frozen Desserts
11.5.2.3.4.Processed Foods
11.5.2.3.5.Meat, Poultry, and Seafood
11.5.2.3.6.Others
11.5.3.Mexico
11.5.3.1.Mexico Clean Label Ingredients Market Revenue (US$ Mn) and Forecasts, By Type
11.5.3.1.1.Natural Colors
11.5.3.1.2.Natural Flavors
11.5.3.1.3.Starch and Sweeteners
11.5.3.1.4.Fruit and Vegetable Ingredients
11.5.3.1.5.Flour
11.5.3.1.6.Others
11.5.3.2.Mexico Clean Label Ingredients Market Revenue (US$ Mn) and Forecasts, By Form
11.5.3.2.1.Liquid
11.5.3.2.2.Dry
11.5.3.3.Mexico Clean Label Ingredients Market Revenue (US$ Mn) and Forecasts, By Application
11.5.3.3.1.Beverages
11.5.3.3.2.Bakery and Confectionery
11.5.3.3.3.Dairy and Frozen Desserts
11.5.3.3.4.Processed Foods
11.5.3.3.5.Meat, Poultry, and Seafood
11.5.3.3.6.Others
11.5.4.Rest of North America
11.5.4.1.Rest of North America Clean Label Ingredients Market Revenue (US$ Mn) and Forecasts, By Type
11.5.4.1.1.Natural Colors
11.5.4.1.2.Natural Flavors
11.5.4.1.3.Starch and Sweeteners
11.5.4.1.4.Fruit and Vegetable Ingredients
11.5.4.1.5.Flour
11.5.4.1.6.Others
11.5.4.2.Rest of North America Clean Label Ingredients Market Revenue (US$ Mn) and Forecasts, By Form
11.5.4.2.1.Liquid
11.5.4.2.2.Dry
11.5.4.3.Rest of North America Clean Label Ingredients Market Revenue (US$ Mn) and Forecasts, By Application
11.5.4.3.1.Beverages
11.5.4.3.2.Bakery and Confectionery
11.5.4.3.3.Dairy and Frozen Desserts
11.5.4.3.4.Processed Foods
11.5.4.3.5.Meat, Poultry, and Seafood
11.5.4.3.6.Others
11.6.Key Segment for Channeling Investments
11.6.1.By Country
11.6.2.By Type
11.6.3.By Form
11.6.4.By Application
12.Europe Clean Label Ingredients Market Analysis and Forecasts, 2024 – 2034
12.1.Overview
12.1.1.Europe Clean Label Ingredients Market Revenue (US$ Mn)
12.2.Europe Clean Label Ingredients Market Revenue (US$ Mn) and Forecasts, By Type
12.2.1.Natural Colors
12.2.2.Natural Flavors
12.2.3.Starch and Sweeteners
12.2.4.Fruit and Vegetable Ingredients
12.2.5.Flour
12.2.6.Others
12.3.Europe Clean Label Ingredients Market Revenue (US$ Mn) and Forecasts, By Form
12.3.1.Liquid
12.3.2.Dry
12.4.Europe Clean Label Ingredients Market Revenue (US$ Mn) and Forecasts, By Application
12.4.1.Beverages
12.4.2.Bakery and Confectionery
12.4.3.Dairy and Frozen Desserts
12.4.4.Processed Foods
12.4.5.Meat, Poultry, and Seafood
12.4.6.Others
12.5.Europe Clean Label Ingredients Market Revenue (US$ Mn) and Forecasts, By Country
12.5.1.France
12.5.1.1.France Clean Label Ingredients Market Revenue (US$ Mn) and Forecasts, By Type
12.5.1.1.1.Natural Colors
12.5.1.1.2.Natural Flavors
12.5.1.1.3.Starch and Sweeteners
12.5.1.1.4.Fruit and Vegetable Ingredients
12.5.1.1.5.Flour
12.5.1.1.6.Others
12.5.1.2.France Clean Label Ingredients Market Revenue (US$ Mn) and Forecasts, By Form
12.5.1.2.1.Liquid
12.5.1.2.2.Dry
12.5.1.3.France Clean Label Ingredients Market Revenue (US$ Mn) and Forecasts, By Application
12.5.1.3.1.Beverages
12.5.1.3.2.Bakery and Confectionery
12.5.1.3.3.Dairy and Frozen Desserts
12.5.1.3.4.Processed Foods
12.5.1.3.5.Meat, Poultry, and Seafood
12.5.1.3.6.Others
12.5.2.The UK
12.5.2.1.The UK Clean Label Ingredients Market Revenue (US$ Mn) and Forecasts, By Type
12.5.2.1.1.Natural Colors
12.5.2.1.2.Natural Flavors
12.5.2.1.3.Starch and Sweeteners
12.5.2.1.4.Fruit and Vegetable Ingredients
12.5.2.1.5.Flour
12.5.2.1.6.Others
12.5.2.2.The UK Clean Label Ingredients Market Revenue (US$ Mn) and Forecasts, By Form
12.5.2.2.1.Liquid
12.5.2.2.2.Dry
12.5.2.3.The UK Clean Label Ingredients Market Revenue (US$ Mn) and Forecasts, By Application
12.5.2.3.1.Beverages
12.5.2.3.2.Bakery and Confectionery
12.5.2.3.3.Dairy and Frozen Desserts
12.5.2.3.4.Processed Foods
12.5.2.3.5.Meat, Poultry, and Seafood
12.5.2.3.6.Others
12.5.3.Spain
12.5.3.1.Spain Clean Label Ingredients Market Revenue (US$ Mn) and Forecasts, By Type
12.5.3.1.1.Natural Colors
12.5.3.1.2.Natural Flavors
12.5.3.1.3.Starch and Sweeteners
12.5.3.1.4.Fruit and Vegetable Ingredients
12.5.3.1.5.Flour
12.5.3.1.6.Others
12.5.3.2.Spain Clean Label Ingredients Market Revenue (US$ Mn) and Forecasts, By Form
12.5.3.2.1.Liquid
12.5.3.2.2.Dry
12.5.3.3.Spain Clean Label Ingredients Market Revenue (US$ Mn) and Forecasts, By Application
12.5.3.3.1.Beverages
12.5.3.3.2.Bakery and Confectionery
12.5.3.3.3.Dairy and Frozen Desserts
12.5.3.3.4.Processed Foods
12.5.3.3.5.Meat, Poultry, and Seafood
12.5.3.3.6.Others
12.5.4.Germany
12.5.4.1.Germany Clean Label Ingredients Market Revenue (US$ Mn) and Forecasts, By Type
12.5.4.1.1.Natural Colors
12.5.4.1.2.Natural Flavors
12.5.4.1.3.Starch and Sweeteners
12.5.4.1.4.Fruit and Vegetable Ingredients
12.5.4.1.5.Flour
12.5.4.1.6.Others
12.5.4.2.Germany Clean Label Ingredients Market Revenue (US$ Mn) and Forecasts, By Form
12.5.4.2.1.Liquid
12.5.4.2.2.Dry
12.5.4.3.Germany Clean Label Ingredients Market Revenue (US$ Mn) and Forecasts, By Application
12.5.4.3.1.Beverages
12.5.4.3.2.Bakery and Confectionery
12.5.4.3.3.Dairy and Frozen Desserts
12.5.4.3.4.Processed Foods
12.5.4.3.5.Meat, Poultry, and Seafood
12.5.4.3.6.Others
12.5.5.Italy
12.5.5.1.Italy Clean Label Ingredients Market Revenue (US$ Mn) and Forecasts, By Type
12.5.5.1.1.Natural Colors
12.5.5.1.2.Natural Flavors
12.5.5.1.3.Starch and Sweeteners
12.5.5.1.4.Fruit and Vegetable Ingredients
12.5.5.1.5.Flour
12.5.5.1.6.Others
12.5.5.2.Italy Clean Label Ingredients Market Revenue (US$ Mn) and Forecasts, By Form
12.5.5.2.1.Liquid
12.5.5.2.2.Dry
12.5.5.3.Italy Clean Label Ingredients Market Revenue (US$ Mn) and Forecasts, By Application
12.5.5.3.1.Beverages
12.5.5.3.2.Bakery and Confectionery
12.5.5.3.3.Dairy and Frozen Desserts
12.5.5.3.4.Processed Foods
12.5.5.3.5.Meat, Poultry, and Seafood
12.5.5.3.6.Others
12.5.6.Nordic Countries
12.5.6.1.Nordic Countries Clean Label Ingredients Market Revenue (US$ Mn) and Forecasts, By Type
12.5.6.1.1.Natural Colors
12.5.6.1.2.Natural Flavors
12.5.6.1.3.Starch and Sweeteners
12.5.6.1.4.Fruit and Vegetable Ingredients
12.5.6.1.5.Flour
12.5.6.1.6.Others
12.5.6.2.Nordic Countries Clean Label Ingredients Market Revenue (US$ Mn) and Forecasts, By Form
12.5.6.2.1.Liquid
12.5.6.2.2.Dry
12.5.6.3.Nordic Countries Clean Label Ingredients Market Revenue (US$ Mn) and Forecasts, By Application
12.5.6.3.1.Beverages
12.5.6.3.2.Bakery and Confectionery
12.5.6.3.3.Dairy and Frozen Desserts
12.5.6.3.4.Processed Foods
12.5.6.3.5.Meat, Poultry, and Seafood
12.5.6.3.6.Others
12.5.6.4.Nordic Countries Clean Label Ingredients Market Revenue (US$ Mn) and Forecasts, By Country
12.5.6.4.1.Denmark
12.5.6.4.2.Finland
12.5.6.4.3.Iceland
12.5.6.4.4.Sweden
12.5.6.4.5.Norway
12.5.7.Benelux Union
12.5.7.1.Benelux Union Clean Label Ingredients Market Revenue (US$ Mn) and Forecasts, By Type
12.5.7.1.1.Natural Colors
12.5.7.1.2.Natural Flavors
12.5.7.1.3.Starch and Sweeteners
12.5.7.1.4.Fruit and Vegetable Ingredients
12.5.7.1.5.Flour
12.5.7.1.6.Others
12.5.7.2.Benelux Union Clean Label Ingredients Market Revenue (US$ Mn) and Forecasts, By Form
12.5.7.2.1.Liquid
12.5.7.2.2.Dry
12.5.7.3.Benelux Union Clean Label Ingredients Market Revenue (US$ Mn) and Forecasts, By Application
12.5.7.3.1.Beverages
12.5.7.3.2.Bakery and Confectionery
12.5.7.3.3.Dairy and Frozen Desserts
12.5.7.3.4.Processed Foods
12.5.7.3.5.Meat, Poultry, and Seafood
12.5.7.3.6.Others
12.5.7.4.Benelux Union Clean Label Ingredients Market Revenue (US$ Mn) and Forecasts, By Country
12.5.7.4.1.Belgium
12.5.7.4.2.The Netherlands
12.5.7.4.3.Luxembourg
12.5.8.Rest of Europe
12.5.8.1.Rest of Europe Clean Label Ingredients Market Revenue (US$ Mn) and Forecasts, By Type
12.5.8.1.1.Natural Colors
12.5.8.1.2.Natural Flavors
12.5.8.1.3.Starch and Sweeteners
12.5.8.1.4.Fruit and Vegetable Ingredients
12.5.8.1.5.Flour
12.5.8.1.6.Others
12.5.8.2.Rest of Europe Clean Label Ingredients Market Revenue (US$ Mn) and Forecasts, By Form
12.5.8.2.1.Liquid
12.5.8.2.2.Dry
12.5.8.3.Rest of Europe Clean Label Ingredients Market Revenue (US$ Mn) and Forecasts, By Application
12.5.8.3.1.Beverages
12.5.8.3.2.Bakery and Confectionery
12.5.8.3.3.Dairy and Frozen Desserts
12.5.8.3.4.Processed Foods
12.5.8.3.5.Meat, Poultry, and Seafood
12.5.8.3.6.Others
12.6.Key Segment for Channeling Investments
12.6.1.By Country
12.6.2.By Type
12.6.3.By Form
12.6.4.By Application
13.Asia Pacific Clean Label Ingredients Market Analysis and Forecasts, 2024 – 2034
13.1.Overview
13.1.1.Asia Pacific Clean Label Ingredients Market Revenue (US$ Mn)
13.2.Asia Pacific Clean Label Ingredients Market Revenue (US$ Mn) and Forecasts, By Type
13.2.1.Natural Colors
13.2.2.Natural Flavors
13.2.3.Starch and Sweeteners
13.2.4.Fruit and Vegetable Ingredients
13.2.5.Flour
13.2.6.Others
13.3.Asia Pacific Clean Label Ingredients Market Revenue (US$ Mn) and Forecasts, By Form
13.3.1.Liquid
13.3.2.Dry
13.4.Asia Pacific Clean Label Ingredients Market Revenue (US$ Mn) and Forecasts, By Application
13.4.1.Beverages
13.4.2.Bakery and Confectionery
13.4.3.Dairy and Frozen Desserts
13.4.4.Processed Foods
13.4.5.Meat, Poultry, and Seafood
13.4.6.Others
13.5.Asia Pacific Clean Label Ingredients Market Revenue (US$ Mn) and Forecasts, By Country
13.5.1.China
13.5.1.1.China Clean Label Ingredients Market Revenue (US$ Mn) and Forecasts, By Type
13.5.1.1.1.Natural Colors
13.5.1.1.2.Natural Flavors
13.5.1.1.3.Starch and Sweeteners
13.5.1.1.4.Fruit and Vegetable Ingredients
13.5.1.1.5.Flour
13.5.1.1.6.Others
13.5.1.2.China Clean Label Ingredients Market Revenue (US$ Mn) and Forecasts, By Form
13.5.1.2.1.Liquid
13.5.1.2.2.Dry
13.5.1.3.China Clean Label Ingredients Market Revenue (US$ Mn) and Forecasts, By Application
13.5.1.3.1.Beverages
13.5.1.3.2.Bakery and Confectionery
13.5.1.3.3.Dairy and Frozen Desserts
13.5.1.3.4.Processed Foods
13.5.1.3.5.Meat, Poultry, and Seafood
13.5.1.3.6.Others
13.5.2.Japan
13.5.2.1.Japan Clean Label Ingredients Market Revenue (US$ Mn) and Forecasts, By Type
13.5.2.1.1.Natural Colors
13.5.2.1.2.Natural Flavors
13.5.2.1.3.Starch and Sweeteners
13.5.2.1.4.Fruit and Vegetable Ingredients
13.5.2.1.5.Flour
13.5.2.1.6.Others
13.5.2.2.Japan Clean Label Ingredients Market Revenue (US$ Mn) and Forecasts, By Form
13.5.2.2.1.Liquid
13.5.2.2.2.Dry
13.5.2.3.Japan Clean Label Ingredients Market Revenue (US$ Mn) and Forecasts, By Application
13.5.2.3.1.Beverages
13.5.2.3.2.Bakery and Confectionery
13.5.2.3.3.Dairy and Frozen Desserts
13.5.2.3.4.Processed Foods
13.5.2.3.5.Meat, Poultry, and Seafood
13.5.2.3.6.Others
13.5.3.India
13.5.3.1.India Clean Label Ingredients Market Revenue (US$ Mn) and Forecasts, By Type
13.5.3.1.1.Natural Colors
13.5.3.1.2.Natural Flavors
13.5.3.1.3.Starch and Sweeteners
13.5.3.1.4.Fruit and Vegetable Ingredients
13.5.3.1.5.Flour
13.5.3.1.6.Others
13.5.3.2.India Clean Label Ingredients Market Revenue (US$ Mn) and Forecasts, By Form
13.5.3.2.1.Liquid
13.5.3.2.2.Dry
13.5.3.3.India Clean Label Ingredients Market Revenue (US$ Mn) and Forecasts, By Application
13.5.3.3.1.Beverages
13.5.3.3.2.Bakery and Confectionery
13.5.3.3.3.Dairy and Frozen Desserts
13.5.3.3.4.Processed Foods
13.5.3.3.5.Meat, Poultry, and Seafood
13.5.3.3.6.Others
13.5.4.New Zealand
13.5.4.1.New Zealand Clean Label Ingredients Market Revenue (US$ Mn) and Forecasts, By Type
13.5.4.1.1.Natural Colors
13.5.4.1.2.Natural Flavors
13.5.4.1.3.Starch and Sweeteners
13.5.4.1.4.Fruit and Vegetable Ingredients
13.5.4.1.5.Flour
13.5.4.1.6.Others
13.5.4.2.New Zealand Clean Label Ingredients Market Revenue (US$ Mn) and Forecasts, By Form
13.5.4.2.1.Liquid
13.5.4.2.2.Dry
13.5.4.3.New Zealand Clean Label Ingredients Market Revenue (US$ Mn) and Forecasts, By Application
13.5.4.3.1.Beverages
13.5.4.3.2.Bakery and Confectionery
13.5.4.3.3.Dairy and Frozen Desserts
13.5.4.3.4.Processed Foods
13.5.4.3.5.Meat, Poultry, and Seafood
13.5.4.3.6.Others
13.5.5.Australia
13.5.5.1.Australia Clean Label Ingredients Market Revenue (US$ Mn) and Forecasts, By Type
13.5.5.1.1.Natural Colors
13.5.5.1.2.Natural Flavors
13.5.5.1.3.Starch and Sweeteners
13.5.5.1.4.Fruit and Vegetable Ingredients
13.5.5.1.5.Flour
13.5.5.1.6.Others
13.5.5.2.Australia Clean Label Ingredients Market Revenue (US$ Mn) and Forecasts, By Form
13.5.5.2.1.Liquid
13.5.5.2.2.Dry
13.5.5.3.Australia Clean Label Ingredients Market Revenue (US$ Mn) and Forecasts, By Application
13.5.5.3.1.Beverages
13.5.5.3.2.Bakery and Confectionery
13.5.5.3.3.Dairy and Frozen Desserts
13.5.5.3.4.Processed Foods
13.5.5.3.5.Meat, Poultry, and Seafood
13.5.5.3.6.Others
13.5.6.South Korea
13.5.6.1.South Korea Clean Label Ingredients Market Revenue (US$ Mn) and Forecasts, By Type
13.5.6.1.1.Natural Colors
13.5.6.1.2.Natural Flavors
13.5.6.1.3.Starch and Sweeteners
13.5.6.1.4.Fruit and Vegetable Ingredients
13.5.6.1.5.Flour
13.5.6.1.6.Others
13.5.6.2.South Korea Clean Label Ingredients Market Revenue (US$ Mn) and Forecasts, By Form
13.5.6.2.1.Liquid
13.5.6.2.2.Dry
13.5.6.3.South Korea Clean Label Ingredients Market Revenue (US$ Mn) and Forecasts, By Application
13.5.6.3.1.Beverages
13.5.6.3.2.Bakery and Confectionery
13.5.6.3.3.Dairy and Frozen Desserts
13.5.6.3.4.Processed Foods
13.5.6.3.5.Meat, Poultry, and Seafood
13.5.6.3.6.Others
13.5.7.Southeast Asia
13.5.7.1.Southeast Asia Clean Label Ingredients Market Revenue (US$ Mn) and Forecasts, By Type
13.5.7.1.1.Natural Colors
13.5.7.1.2.Natural Flavors
13.5.7.1.3.Starch and Sweeteners
13.5.7.1.4.Fruit and Vegetable Ingredients
13.5.7.1.5.Flour
13.5.7.1.6.Others
13.5.7.2.Southeast Asia Clean Label Ingredients Market Revenue (US$ Mn) and Forecasts, By Form
13.5.7.2.1.Liquid
13.5.7.2.2.Dry
13.5.7.3.Southeast Asia Clean Label Ingredients Market Revenue (US$ Mn) and Forecasts, By Application
13.5.7.3.1.Beverages
13.5.7.3.2.Bakery and Confectionery
13.5.7.3.3.Dairy and Frozen Desserts
13.5.7.3.4.Processed Foods
13.5.7.3.5.Meat, Poultry, and Seafood
13.5.7.3.6.Others
13.5.7.4.Southeast Asia Clean Label Ingredients Market Revenue (US$ Mn) and Forecasts, By Country
13.5.7.4.1.Indonesia
13.5.7.4.2.Thailand
13.5.7.4.3.Malaysia
13.5.7.4.4.Singapore
13.5.7.4.5.Rest of Southeast Asia
13.5.8.Rest of Asia Pacific
13.5.8.1.Rest of Asia Pacific Clean Label Ingredients Market Revenue (US$ Mn) and Forecasts, By Type
13.5.8.1.1.Natural Colors
13.5.8.1.2.Natural Flavors
13.5.8.1.3.Starch and Sweeteners
13.5.8.1.4.Fruit and Vegetable Ingredients
13.5.8.1.5.Flour
13.5.8.1.6.Others
13.5.8.2.Rest of Asia Pacific Clean Label Ingredients Market Revenue (US$ Mn) and Forecasts, By Form
13.5.8.2.1.Liquid
13.5.8.2.2.Dry
13.5.8.3.Rest of Asia Pacific Clean Label Ingredients Market Revenue (US$ Mn) and Forecasts, By Application
13.5.8.3.1.Beverages
13.5.8.3.2.Bakery and Confectionery
13.5.8.3.3.Dairy and Frozen Desserts
13.5.8.3.4.Processed Foods
13.5.8.3.5.Meat, Poultry, and Seafood
13.5.8.3.6.Others
13.6.Key Segment for Channeling Investments
13.6.1.By Country
13.6.2.By Type
13.6.3.By Form
13.6.4.By Application
14.Middle East and Africa Clean Label Ingredients Market Analysis and Forecasts, 2024 – 2034
14.1.Overview
14.1.1.Middle East and Africa Clean Label Ingredients Market Revenue (US$ Mn)
14.2.Middle East and Africa Clean Label Ingredients Market Revenue (US$ Mn) and Forecasts, By Type
14.2.1.Natural Colors
14.2.2.Natural Flavors
14.2.3.Starch and Sweeteners
14.2.4.Fruit and Vegetable Ingredients
14.2.5.Flour
14.2.6.Others
14.3.Middle East and Africa Clean Label Ingredients Market Revenue (US$ Mn) and Forecasts, By Form
14.3.1.Liquid
14.3.2.Dry
14.4.Middle East and Africa Clean Label Ingredients Market Revenue (US$ Mn) and Forecasts, By Application
14.4.1.Beverages
14.4.2.Bakery and Confectionery
14.4.3.Dairy and Frozen Desserts
14.4.4.Processed Foods
14.4.5.Meat, Poultry, and Seafood
14.4.6.Others
14.5.Middle East and Africa Clean Label Ingredients Market Revenue (US$ Mn) and Forecasts, By Country
14.5.1.Saudi Arabia
14.5.1.1.Saudi Arabia Clean Label Ingredients Market Revenue (US$ Mn) and Forecasts, By Type
14.5.1.1.1.Natural Colors
14.5.1.1.2.Natural Flavors
14.5.1.1.3.Starch and Sweeteners
14.5.1.1.4.Fruit and Vegetable Ingredients
14.5.1.1.5.Flour
14.5.1.1.6.Others
14.5.1.2.Saudi Arabia Clean Label Ingredients Market Revenue (US$ Mn) and Forecasts, By Form
14.5.1.2.1.Liquid
14.5.1.2.2.Dry
14.5.1.3.Saudi Arabia Clean Label Ingredients Market Revenue (US$ Mn) and Forecasts, By Application
14.5.1.3.1.Beverages
14.5.1.3.2.Bakery and Confectionery
14.5.1.3.3.Dairy and Frozen Desserts
14.5.1.3.4.Processed Foods
14.5.1.3.5.Meat, Poultry, and Seafood
14.5.1.3.6.Others
14.5.2.UAE
14.5.2.1.UAE Clean Label Ingredients Market Revenue (US$ Mn) and Forecasts, By Type
14.5.2.1.1.Natural Colors
14.5.2.1.2.Natural Flavors
14.5.2.1.3.Starch and Sweeteners
14.5.2.1.4.Fruit and Vegetable Ingredients
14.5.2.1.5.Flour
14.5.2.1.6.Others
14.5.2.2.UAE Clean Label Ingredients Market Revenue (US$ Mn) and Forecasts, By Form
14.5.2.2.1.Liquid
14.5.2.2.2.Dry
14.5.2.3.UAE Clean Label Ingredients Market Revenue (US$ Mn) and Forecasts, By Application
14.5.2.3.1.Beverages
14.5.2.3.2.Bakery and Confectionery
14.5.2.3.3.Dairy and Frozen Desserts
14.5.2.3.4.Processed Foods
14.5.2.3.5.Meat, Poultry, and Seafood
14.5.2.3.6.Others
14.5.3.Egypt
14.5.3.1.Egypt Clean Label Ingredients Market Revenue (US$ Mn) and Forecasts, By Type
14.5.3.1.1.Natural Colors
14.5.3.1.2.Natural Flavors
14.5.3.1.3.Starch and Sweeteners
14.5.3.1.4.Fruit and Vegetable Ingredients
14.5.3.1.5.Flour
14.5.3.1.6.Others
14.5.3.2.Egypt Clean Label Ingredients Market Revenue (US$ Mn) and Forecasts, By Form
14.5.3.2.1.Liquid
14.5.3.2.2.Dry
14.5.3.3.Egypt Clean Label Ingredients Market Revenue (US$ Mn) and Forecasts, By Application
14.5.3.3.1.Beverages
14.5.3.3.2.Bakery and Confectionery
14.5.3.3.3.Dairy and Frozen Desserts
14.5.3.3.4.Processed Foods
14.5.3.3.5.Meat, Poultry, and Seafood
14.5.3.3.6.Others
14.5.4.Kuwait
14.5.4.1.Kuwait Clean Label Ingredients Market Revenue (US$ Mn) and Forecasts, By Type
14.5.4.1.1.Natural Colors
14.5.4.1.2.Natural Flavors
14.5.4.1.3.Starch and Sweeteners
14.5.4.1.4.Fruit and Vegetable Ingredients
14.5.4.1.5.Flour
14.5.4.1.6.Others
14.5.4.2.Kuwait Clean Label Ingredients Market Revenue (US$ Mn) and Forecasts, By Form
14.5.4.2.1.Liquid
14.5.4.2.2.Dry
14.5.4.3.Kuwait Clean Label Ingredients Market Revenue (US$ Mn) and Forecasts, By Application
14.5.4.3.1.Beverages
14.5.4.3.2.Bakery and Confectionery
14.5.4.3.3.Dairy and Frozen Desserts
14.5.4.3.4.Processed Foods
14.5.4.3.5.Meat, Poultry, and Seafood
14.5.4.3.6.Others
14.5.5.South Africa
14.5.5.1.South Africa Clean Label Ingredients Market Revenue (US$ Mn) and Forecasts, By Type
14.5.5.1.1.Natural Colors
14.5.5.1.2.Natural Flavors
14.5.5.1.3.Starch and Sweeteners
14.5.5.1.4.Fruit and Vegetable Ingredients
14.5.5.1.5.Flour
14.5.5.1.6.Others
14.5.5.2.South Africa Clean Label Ingredients Market Revenue (US$ Mn) and Forecasts, By Form
14.5.5.2.1.Liquid
14.5.5.2.2.Dry
14.5.5.3.South Africa Clean Label Ingredients Market Revenue (US$ Mn) and Forecasts, By Application
14.5.5.3.1.Beverages
14.5.5.3.2.Bakery and Confectionery
14.5.5.3.3.Dairy and Frozen Desserts
14.5.5.3.4.Processed Foods
14.5.5.3.5.Meat, Poultry, and Seafood
14.5.5.3.6.Others
14.5.6.Rest of Middle East & Africa
14.5.6.1.Rest of Middle East & Africa Clean Label Ingredients Market Revenue (US$ Mn) and Forecasts, By Type
14.5.6.1.1.Natural Colors
14.5.6.1.2.Natural Flavors
14.5.6.1.3.Starch and Sweeteners
14.5.6.1.4.Fruit and Vegetable Ingredients
14.5.6.1.5.Flour
14.5.6.1.6.Others
14.5.6.2.Rest of Middle East & Africa Clean Label Ingredients Market Revenue (US$ Mn) and Forecasts, By Form
14.5.6.2.1.Liquid
14.5.6.2.2.Dry
14.5.6.3.Rest of Middle East & Africa Clean Label Ingredients Market Revenue (US$ Mn) and Forecasts, By Application
14.5.6.3.1.Beverages
14.5.6.3.2.Bakery and Confectionery
14.5.6.3.3.Dairy and Frozen Desserts
14.5.6.3.4.Processed Foods
14.5.6.3.5.Meat, Poultry, and Seafood
14.5.6.3.6.Others
14.6.Key Segment for Channeling Investments
14.6.1.By Country
14.6.2.By Type
14.6.3.By Form
14.6.4.By Application
15.Latin America Clean Label Ingredients Market Analysis and Forecasts, 2024 – 2034
15.1.Overview
15.1.1.Latin America Clean Label Ingredients Market Revenue (US$ Mn)
15.2.Latin America Clean Label Ingredients Market Revenue (US$ Mn) and Forecasts, By Type
15.2.1.Natural Colors
15.2.2.Natural Flavors
15.2.3.Starch and Sweeteners
15.2.4.Fruit and Vegetable Ingredients
15.2.5.Flour
15.2.6.Others
15.3.Latin America Clean Label Ingredients Market Revenue (US$ Mn) and Forecasts, By Form
15.3.1.Liquid
15.3.2.Dry
15.4.Latin America Clean Label Ingredients Market Revenue (US$ Mn) and Forecasts, By Application
15.4.1.Beverages
15.4.2.Bakery and Confectionery
15.4.3.Dairy and Frozen Desserts
15.4.4.Processed Foods
15.4.5.Meat, Poultry, and Seafood
15.4.6.Others
15.5.Latin America Clean Label Ingredients Market Revenue (US$ Mn) and Forecasts, By Country
15.5.1.Brazil
15.5.1.1.Brazil Clean Label Ingredients Market Revenue (US$ Mn) and Forecasts, By Type
15.5.1.1.1.Natural Colors
15.5.1.1.2.Natural Flavors
15.5.1.1.3.Starch and Sweeteners
15.5.1.1.4.Fruit and Vegetable Ingredients
15.5.1.1.5.Flour
15.5.1.1.6.Others
15.5.1.2.Brazil Clean Label Ingredients Market Revenue (US$ Mn) and Forecasts, By Form
15.5.1.2.1.Liquid
15.5.1.2.2.Dry
15.5.1.3.Brazil Clean Label Ingredients Market Revenue (US$ Mn) and Forecasts, By Application
15.5.1.3.1.Beverages
15.5.1.3.2.Bakery and Confectionery
15.5.1.3.3.Dairy and Frozen Desserts
15.5.1.3.4.Processed Foods
15.5.1.3.5.Meat, Poultry, and Seafood
15.5.1.3.6.Others
15.5.2.Argentina
15.5.2.1.Argentina Clean Label Ingredients Market Revenue (US$ Mn) and Forecasts, By Type
15.5.2.1.1.Natural Colors
15.5.2.1.2.Natural Flavors
15.5.2.1.3.Starch and Sweeteners
15.5.2.1.4.Fruit and Vegetable Ingredients
15.5.2.1.5.Flour
15.5.2.1.6.Others
15.5.2.2.Argentina Clean Label Ingredients Market Revenue (US$ Mn) and Forecasts, By Form
15.5.2.2.1.Liquid
15.5.2.2.2.Dry
15.5.2.3.Argentina Clean Label Ingredients Market Revenue (US$ Mn) and Forecasts, By Application
15.5.2.3.1.Beverages
15.5.2.3.2.Bakery and Confectionery
15.5.2.3.3.Dairy and Frozen Desserts
15.5.2.3.4.Processed Foods
15.5.2.3.5.Meat, Poultry, and Seafood
15.5.2.3.6.Others
15.5.3.Rest of Latin America
15.5.3.1.Rest of Latin America Clean Label Ingredients Market Revenue (US$ Mn) and Forecasts, By Type
15.5.3.1.1.Natural Colors
15.5.3.1.2.Natural Flavors
15.5.3.1.3.Starch and Sweeteners
15.5.3.1.4.Fruit and Vegetable Ingredients
15.5.3.1.5.Flour
15.5.3.1.6.Others
15.5.3.2.Rest of Latin America Clean Label Ingredients Market Revenue (US$ Mn) and Forecasts, By Form
15.5.3.2.1.Liquid
15.5.3.2.2.Dry
15.5.3.3.Rest of Latin America Clean Label Ingredients Market Revenue (US$ Mn) and Forecasts, By Application
15.5.3.3.1.Beverages
15.5.3.3.2.Bakery and Confectionery
15.5.3.3.3.Dairy and Frozen Desserts
15.5.3.3.4.Processed Foods
15.5.3.3.5.Meat, Poultry, and Seafood
15.5.3.3.6.Others
15.6.Key Segment for Channeling Investments
15.6.1.By Country
15.6.2.By Type
15.6.3.By Form
15.6.4.By Application
16.Competitive Benchmarking
16.1.Brand Benchmarking
16.2.Market Share Analysis, 2023
16.3.Global Presence and Growth Strategies
16.3.1.Mergers and Acquisitions
16.3.2.Product Launches
16.3.3.Investments Trends
16.3.4.R&D Initiatives
17.Player Profiles
17.1.Archer Daniels Midland
17.1.1.Company Details
17.1.2.Company Overview
17.1.3.Product Offerings
17.1.4.Key Developments
17.1.5.Financial Analysis
17.1.6.SWOT Analysis
17.1.7.Business Strategies
17.2.Cargill
17.2.1.Company Details
17.2.2.Company Overview
17.2.3.Product Offerings
17.2.4.Key Developments
17.2.5.Financial Analysis
17.2.6.SWOT Analysis
17.2.7.Business Strategies
17.3.Corbion Inc.
17.3.1.Company Details
17.3.2.Company Overview
17.3.3.Product Offerings
17.3.4.Key Developments
17.3.5.Financial Analysis
17.3.6.SWOT Analysis
17.3.7.Business Strategies
17.4.Dupont De Nemours and Company
17.4.1.Company Details
17.4.2.Company Overview
17.4.3.Product Offerings
17.4.4.Key Developments
17.4.5.Financial Analysis
17.4.6.SWOT Analysis
17.4.7.Business Strategies
17.5.Fluoryx
17.5.1.Company Details
17.5.2.Company Overview
17.5.3.Product Offerings
17.5.4.Key Developments
17.5.5.Financial Analysis
17.5.6.SWOT Analysis
17.5.7.Business Strategies
17.6.Frutarom
17.6.1.Company Details
17.6.2.Company Overview
17.6.3.Product Offerings
17.6.4.Key Developments
17.6.5.Financial Analysis
17.6.6.SWOT Analysis
17.6.7.Business Strategies
17.7.Ingredion Incorporated
17.7.1.Company Details
17.7.2.Company Overview
17.7.3.Product Offerings
17.7.4.Key Developments
17.7.5.Financial Analysis
17.7.6.SWOT Analysis
17.7.7.Business Strategies
17.8.Kerry Group Plc
17.8.1.Company Details
17.8.2.Company Overview
17.8.3.Product Offerings
17.8.4.Key Developments
17.8.5.Financial Analysis
17.8.6.SWOT Analysis
17.8.7.Business Strategies
17.9.Koninklijke DSM N.V
17.9.1.Company Details
17.9.2.Company Overview
17.9.3.Product Offerings
17.9.4.Key Developments
17.9.5.Financial Analysis
17.9.6.SWOT Analysis
17.9.7.Business Strategies
17.10.Sensient Technologies
17.10.1.Company Details
17.10.2.Company Overview
17.10.3.Product Offerings
17.10.4.Key Developments
17.10.5.Financial Analysis
17.10.6.SWOT Analysis
17.10.7.Business Strategies
17.11.Tate & Lyle Plc
17.11.1.Company Details
17.11.2.Company Overview
17.11.3.Product Offerings
17.11.4.Key Developments
17.11.5.Financial Analysis
17.11.6.SWOT Analysis
17.11.7.Business Strategies
17.12.TCI Chemicals
17.12.1.Company Details
17.12.2.Company Overview
17.12.3.Product Offerings
17.12.4.Key Developments
17.12.5.Financial Analysis
17.12.6.SWOT Analysis
17.12.7.Business Strategies
17.13.Wilshire Technologies
17.13.1.Company Details
17.13.2.Company Overview
17.13.3.Product Offerings
17.13.4.Key Developments
17.13.5.Financial Analysis
17.13.6.SWOT Analysis
17.13.7.Business Strategies
17.14.Other Industry Participants
18.Key Findings

.

Note: This ToC is tentative and can be changed according to the research study conducted during the course of report completion.

.

**Exclusive for Multi-User and Enterprise User.

Global Clean Label Ingredients Market

By Type

  • Natural Colors
  • Natural Flavors
  • Starch and Sweeteners
  • Fruit and Vegetable Ingredients
  • Flour
  • Others

By Form

  • Liquid
  • Dry

By Application

  • Beverages
  • Bakery and Confectionery
  • Dairy and Frozen Desserts
  • Processed Foods
  • Meat, Poultry, and Seafood
  • Others

By Region

  • North America (U.S., Canada, Mexico, Rest of North America)
  • Europe (France, The UK, Spain, Germany, Italy, Nordic Countries (Denmark, Finland, Iceland, Sweden, Norway), Benelux Union (Belgium, The Netherlands, Luxembourg), Rest of Europe)
  • Asia Pacific (China, Japan, India, New Zealand, Australia, South Korea, Southeast Asia (Indonesia, Thailand, Malaysia, Singapore, Rest of Southeast Asia), Rest of Asia Pacific)
  • Middle East & Africa (Saudi Arabia, UAE, Egypt, Kuwait, South Africa, Rest of Middle East & Africa)
  • Latin America (Brazil, Argentina, Rest of Latin America)

The Niche Research approach encompasses both primary and secondary research methods to provide comprehensive insights. While primary research is the cornerstone of our studies, we also incorporate secondary research sources such as company annual reports, premium industry databases, press releases, industry journals, and white papers.

Within our primary research, we actively engage with various industry stakeholders, conducting paid interviews and surveys. Our meticulous analysis extends to every market participant in major countries, allowing us to thoroughly examine their portfolios, calculate market shares, and segment revenues.

Our data collection primarily focuses on individual countries within our research scope, enabling us to estimate regional market sizes. Typically, we employ a bottom-up approach, meticulously tracking trends in different countries. We analyze growth drivers, constraints, technological innovations, and opportunities for each country, ultimately arriving at regional figures.Our process begins by examining the growth prospects of each country. Building upon these insights, we project growth and trends for the entire region. Finally, we utilize our proprietary model to refine estimations and forecasts.

Our data validation standards are integral to ensuring the reliability and accuracy of our research findings. Here’s a breakdown of our data validation processes and the stakeholders we engage with during our primary research:

  • Supply Side Analysis: We initiate a supply side analysis by directly contacting market participants, through telephonic interviews and questionnaires containing both open-ended and close-ended questions. We gather information on their portfolios, segment revenues, developments, and growth strategies.
  • Demand Side Analysis: To gain insights into adoption trends and consumer preferences, we reach out to target customers and users (non-vendors). This information forms a vital part of the qualitative analysis section of our reports, covering market dynamics, adoption trends, consumer behavior, spending patterns, and other related aspects.
  • Consultant Insights: We tap into the expertise of our partner consultants from around the world to obtain their unique viewpoints and perspectives. Their insights contribute to a well-rounded understanding of the markets under investigation.
  • In-House Validation: To ensure data accuracy and reliability, we conduct cross-validation of data points and information through our in-house team of consultants and utilize advanced data modeling tools for thorough verification.

The forecasts we provide are based on a comprehensive assessment of various factors, including:

  • Market Trends and Past Performance (Last Five Years): We accurately analyze market trends and performance data from preceding five years to identify historical patterns and understand the market’s evolution.
  • Historical Performance and Growth of Market Participants: We assess the historical performance and growth trajectories of key market participants. This analysis provides insights into the competitive landscape and individual company strategies.
  • Market Determinants Impact Analysis (Next Eight Years): We conduct a rigorous analysis of the factors that are projected to influence the market over the next eight years. This includes assessing both internal and external determinants that can shape market dynamics.
  • Drivers and Challenges for the Forecast Period:Identify the factors expected to drive market growth during the forecast period, as well as the challenges that the industry may face. This analysis aids in deriving an accurate growth rate projection.
  • New Acquisitions, Collaborations, or Partnerships: We keep a close watch on any new acquisitions, collaborations, or partnerships within the industry. These developments can have a significant impact on market dynamics and competitiveness.
  • Macro and Micro Factors Analysis:A thorough examination of both macro-level factors (e.g., economic trends, regulatory changes) and micro-level factors (e.g., technological advancements, consumer preferences) that may influence the market during the forecast period.
  • End-User Sentiment Analysis: To understand the market from the end-user perspective, we conduct sentiment analysis. This involves assessing the sentiment, preferences, and feedback of the end-users, which can provide valuable insights into market trends.
  • Perspective of Primary Participants: Insights gathered directly from primary research participants play a crucial role in shaping our forecasts. Their perspectives and experiences provide valuable qualitative data.
  • Year-on-Year Growth Trend: We utilize a year-on-year growth trend based on historical market growth and expected future trends. This helps in formulating our growth projections, aligning them with the market’s historical performance.

Research process adopted by TNR involves multiple stages, including data collection, validation, quality checks, and presentation. It’s crucial that the data and information we provide add value to your existing market understanding and expertise. We have also established partnerships with business consulting, research, and survey organizations across regions and globally to collaborate on regional analysis and data validation, ensuring the highest level of accuracy and reliability in our reports.


Procure Comprehensive Study of

Global Clean Label Ingredients Market

Online Only

  • Online Access
  • Read Only File
  • Validity 3 Months
  • Print, Copy, Paste & Download
  • PPT, Excel
  • Cost-Free Report in the Next Update
$3300
Buy Now

Single User

  • Access to One User on One System
  • Read Only File
  • Validity 6 Months
  • Limited Print,Copy, Paste
  • PPT, Excel
  • Cost-Free Report in the Next Update
$4200
Buy Now

Multi User

  • Access to Fiver Users
  • PDF File
  • Validity 1 Year
  • Upto FivePrints
  • Cost-Free Report in the Next Update
  • PPT, Excel
$6000
Buy Now

Enterprise User

  • Access to Unlimited Users
  • PDF, PPT, Excel
  • Unlimited Validity, Prints&Downloads
  • 1 Hour Cost-Free & Dedicated Analyst Support
  • 10% Cost-Free Customization
  • Cost-Free Report Update Twice in a Year
  • Recommendations for Business Strategies
  • Authorization to Quote TNR, The Niche Research
$7300
Buy Now

Library Access

  • Online Access to Content Publications
  • Access Player Profiles Online
  • Get Immediate Access to Newly Added Content
  • Acquire 12 PDF Downloads
  • Acquire 5 Excel Data Sets
  • Gain Access to 290+ PDFs of Company Profiles
  • Round-the-clock Email and Phone Assistance
  • Dashboard Usage and Trends
  • Renewal & Upgrade Assistance
  • Assessing Customization Options and Alerts for New Reports
$10788
Buy Now
*Taxes/Fees, if applicable will be added during checkout. All prices in USD

Why TNR The Niche Research?

  • Unwavering Commitment to Excellence

  • Veteran Team of Researchers

  • Accurate and Timely Insights

  • Ethical Practices and Customized Service

  • Uninterrupted Availability Around the Clock

Scroll to Top