Global Dark Fiber Network Market Insights, Growth, Share, Size: By Type, By Configuration, By Organization Size, By End Users, By Region & Segmental Forecast, 2023-2031, Comparative Analysis and Trends

  • Industry: Technology
  • Report ID: TNR-110-957
  • Number of Pages: 420
  • Table/Charts : Yes
  • November, 2023
  • Base Year : 2024
  • No. of Companies : 14+
  • No. of Countries : 29
  • Views : 10161
  • Covid Impact Covered: Yes
  • War Impact Covered: Yes
  • Formats : PDF, Excel, PPT

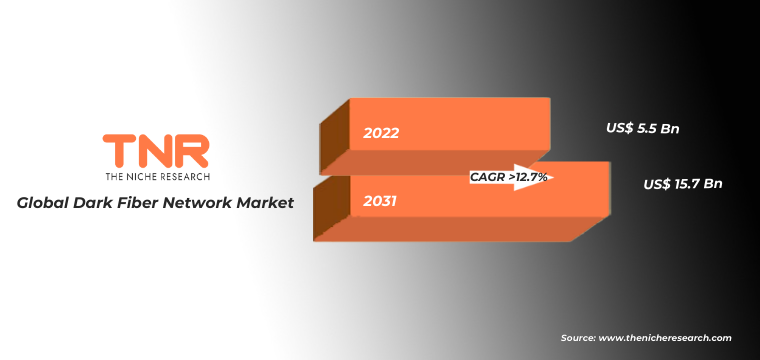
Global Dark Fiber Network Market Valued USD 5.5 Bn in 2022, with an Estimated CAGR of 12.7% (2023 – 2031) 

“Dark fiber” refers to the increasingly prevalent practice of leasing fiber optic cables from a network provider/service provider, or out to the Fiber installation/fiber infrastructure that isn’t held by ordinary carriers. Even if it has been used by a fiber lessee rather than the cable’s owner, black fiber might still be referred to as such. Many organizations overestimate the entire number of supplies and cables required to complete the work while installing fiber optic lines. The rationale for this overestimation is to guarantee that the corporation can keep its dark fiber network from becoming overburdened with data. As the demand for high-speed, low-latency, and highly customizable connectivity solutions continues to rise across various industries for dark fiber network market will rise during the forecast period.

Global Dark Fiber Network Market Revenue & Forecast, (US$ Million), 2015 – 2031

Factors Supporting the Growth of the Global Dark Fiber Network Market

  • The increasing demand for high-speed internet, streaming services, cloud computing, and data-intensive applications has led to a surge in data consumption. Dark fiber networks provide the necessary infrastructure to accommodate this growing data traffic.
  • Additionally the deployment of 5G networks is driving the need for high-capacity backhaul and fronthaul connections. Dark fiber networks offer the bandwidth and low latency required to support 5G’s high-speed, low-latency communication.
  • With the growth of cloud services and the establishment of data centers, dark fiber networks are essential for connecting these facilities and ensuring fast and reliable data transmission.

Based on the end users segment, IT and telecommunications segment had the highest share in the dark fiber network market in 2022. The demand for data transmission and internet services is constantly growing which has led to the rise in demand for dark fiber network market. As dark fiber networks offer unparalleled scalability, allowing organizations to expand their network capacity quickly and cost-effectively by activating additional strands of fiber. Moreover the IT and telecommunications companies often require tailored network solutions to meet their specific bandwidth and latency requirements. Dark fiber allows them to configure and light up the optical fibers as needed, providing full control over network management and capacity. Thus dark fiber networks are proving to be a strategic asset for IT and telecommunications industries, offering the flexibility, performance, and control needed to support the ever-increasing demand for high-speed data transmission, connectivity, and digital services.

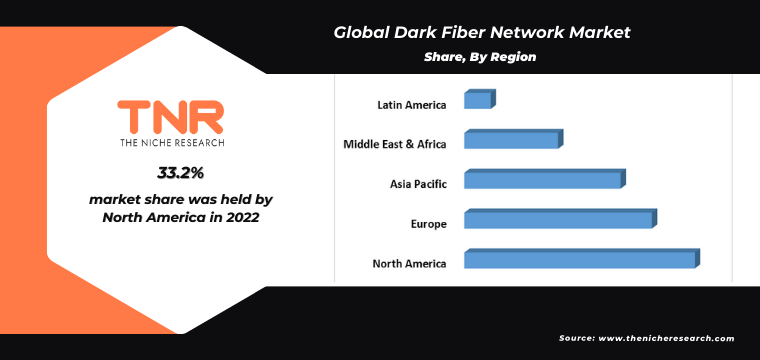
Asia is experiencing rapid digital transformation across industries, including finance, healthcare, education, and manufacturing. This transformation requires robust and scalable network infrastructure, making dark fiber an attractive option due to its high bandwidth and customization capabilities. Furthermore the development of smart cities and IoT applications in Asia has led to the rise in dark fiber networks as it requires extensive and low-latency connectivity and the real-time data exchange needed for smart city initiatives. In the forthcoming years Asia Pacific region is anticipated to be the fastest growing region in the dark fiber network market.

Competitive Landscape

The report provides a comprehensive analysis of the leading market participants operating in the dark fiber network market, as well as a comparative assessment based on their product offering, business overviews, regional presence, enterprise strategies, segment market share, and SWOT analysis. The report analyzes the market competition which is influenced by factors such as geographic coverage, network quality, pricing, and the ability to offer customized solutions to diverse industries and use cases.

List of leading players in global dark fiber network market are:

  • Airtel India.
  • AT&T
  • Bandwidth IG.
  • Colt Technology Services Group Limited
  • Crown Castle
  • Dobson Fiber.
  • euNetworks Group Limited
  • EXA Infrastructure
  • GAS&COM AG
  • Lumen Technologies
  • Neos Networks
  • Telecom Italia Sparkle S.p.A.
  • UFINET
  • Verizon Partner Solutions
  • Zayo Group, LLC.
  • Other market participants

Global Dark Fiber Network Market Report Coverage

Report Specifications Details
Market Revenue in 2022 US$ 5.5 Billion
Market Size Forecast by 2031 US$ 15.7 Billion
Growth Rate (CAGR) 12.7%
Historic Data 2015 – 2021
Base Year for Estimation 2022
Forecast Period 2023 – 2031
Report Inclusions Market Size & Estimates, Market Dynamics, Competitive Scenario, Trends, Growth Factors, Market Determinants, Key Investment Segmentation, Product/Service/Solutions Benchmarking
Segments Covered By Type, By Configuration, By Organization Size, By End Users
Regions Covered North America, Europe, Asia Pacific, Middle East & Africa, Latin America
Countries Covered U.S., Canada, Mexico, Rest of North America,  France, The UK, Spain, Germany, Italy, Nordic Countries (Denmark, Finland, Iceland, Sweden, Norway), Benelux Union (Belgium, The Netherlands, Luxembourg), Rest of Europe,  China, Japan, India, New Zealand, Australia, South Korea, Southeast Asia (Indonesia, Thailand, Malaysia, Singapore, Rest of Southeast Asia), Rest of Asia Pacific,  Saudi Arabia, UAE, Egypt, Kuwait, South Africa, Rest of Middle East & Africa,  Brazil, Argentina, Rest of Latin America
Key Players Airtel India., AT&T, Bandwidth IG., Colt Technology Services Group Limited, Crown Castle, Dobson Fiber., euNetworks Group Limited, EXA Infrastructure, GAS&COM AG, Lumen Technologies, Neos Networks, Telecom Italia Sparkle S.p.A., UFINET, Verizon Partner Solutions, Zayo Group, LLC., Other Industry Participants
Customization Scope Customization allows for the inclusion/modification of content pertaining to geographical regions, countries, and specific market segments.
Pricing & Procurement Options Explore purchase options tailored to your specific research requirements
Contact Details Consult With Our Expert

Japan (Toll-Free): – +81 663-386-8111

South Korea (Toll-Free): – +82-808- 703-126

Saudi Arabia (Toll-Free): – +966 800 850 1643

United States: +1 302-232-5106

United Kingdom: +447537105080

E-mail:  askanexpert@thenicheresearch.com


Global Dark Fiber Network Market

By Type

  • Metro
  • Long haul

By Configuration

  • Point to point
  • Ring

By Organization Size

  • Small and Medium Size Organizations
  • Large Organizations

By End Users

  • IT and Telecommunication
  • Government
  • School
  • Hotels and Hospitality
  • Financial Institutions
  • E-commerce and retail
  • Manufacturing
  • Logistics
  • Others

By Region

  • North America (U.S., Canada, Mexico, Rest of North America)
  • Europe (France, The UK, Spain, Germany, Italy, Nordic Countries (Denmark, Finland, Iceland, Sweden, Norway), Benelux Union (Belgium, The Netherlands, Luxembourg), Rest of Europe)
  • Asia Pacific (China, Japan, India, New Zealand, Australia, South Korea, Southeast Asia (Indonesia, Thailand, Malaysia, Singapore, Rest of Southeast Asia), Rest of Asia Pacific)
  • Middle East & Africa (Saudi Arabia, UAE, Egypt, Kuwait, South Africa, Rest of Middle East & Africa)
  • Latin America (Brazil, Argentina, Rest of Latin America)

Report Coverage and Deliverables: 

Table of Contents

.

1.Market Scope
1.1.Market Segmentation
1.2.Years Considered
1.2.1.Historic Years: 2015 - 2021
1.2.2.Base Year: 2022
1.2.3.Forecast Years: 2023 – 2031
2.Key Target Audiences
3.Research Methodology
3.1.Primary Research
3.1.1.Research Questionnaire
3.1.2.Global Percentage Breakdown
3.1.3.Primary Interviews: Key Opinion Leaders (KOLs)
3.2.Secondary Research
3.2.1.Paid Databases
3.2.2.Secondary Sources
3.3.Market Size Estimates
3.3.1.Top-Down Approach
3.3.2.Bottom-Up Approach
3.4.Data Triangulation Methodology
3.5.Research Assumptions
4.Recommendations and Insights from TNR’S Perspective**
5.Holistic Overview of Dark Fiber Network Market
6.Market Synopsis: Dark Fiber Network Market
7.Dark Fiber Network Market Analysis: Qualitative Perspective
7.1.Introduction
7.1.1.Product Definition
7.1.2.Industry Development
7.2.Market Dynamics
7.2.1.Drivers
7.2.2.Restraints
7.2.3.Opportunities
7.3.Trends in Dark Fiber Network Market
7.4.Market Determinants Radar Chart
7.5.Macro-Economic and Micro-Economic Indicators: Dark Fiber Network Market
7.6.Porter’s Five Force Analysis
7.7.Impact of Covid-19 on Dark Fiber Network Market
8.Global Dark Fiber Network Market Analysis and Forecasts, 2023 – 2031
8.1.Overview
8.1.1.Global Dark Fiber Network Market Revenue (US$ Mn)
8.2.Global Dark Fiber Network Market Revenue (US$ Mn) and Forecasts, By Type
8.2.1.Metro
8.2.1.1.Definition
8.2.1.2.Market Estimation and Penetration, 2015 - 2022
8.2.1.3.Market Forecast, 2023 - 2031
8.2.1.4.Compound Annual Growth Rate (CAGR)
8.2.1.5.Regional Bifurcation
8.2.1.5.1.North America
8.2.1.5.1.1.Market Estimation, 2015 - 2022
8.2.1.5.1.2.Market Forecast, 2023 - 2031
8.2.1.5.2.Europe
8.2.1.5.2.1.Market Estimation, 2015 - 2022
8.2.1.5.2.2.Market Forecast, 2023 - 2031
8.2.1.5.3.Asia Pacific
8.2.1.5.3.1.Market Estimation, 2015 - 2022
8.2.1.5.3.2.Market Forecast, 2023 - 2031
8.2.1.5.4.Middle East and Africa
8.2.1.5.4.1.Market Estimation, 2015 - 2022
8.2.1.5.4.2.Market Forecast, 2023 - 2031
8.2.1.5.5.Latin America
8.2.1.5.5.1.Market Estimation, 2015 - 2022
8.2.1.5.5.2.Market Forecast, 2023 - 2031
8.2.2.Long haul
8.2.2.1.Definition
8.2.2.2.Market Estimation and Penetration, 2015 - 2022
8.2.2.3.Market Forecast, 2023 - 2031
8.2.2.4.Compound Annual Growth Rate (CAGR)
8.2.2.5.Regional Bifurcation
8.2.2.5.1.North America
8.2.2.5.1.1.Market Estimation, 2015 - 2022
8.2.2.5.1.2.Market Forecast, 2023 - 2031
8.2.2.5.2.Europe
8.2.2.5.2.1.Market Estimation, 2015 - 2022
8.2.2.5.2.2.Market Forecast, 2023 - 2031
8.2.2.5.3.Asia Pacific
8.2.2.5.3.1.Market Estimation, 2015 - 2022
8.2.2.5.3.2.Market Forecast, 2023 - 2031
8.2.2.5.4.Middle East and Africa
8.2.2.5.4.1.Market Estimation, 2015 - 2022
8.2.2.5.4.2.Market Forecast, 2023 - 2031
8.2.2.5.5.Latin America
8.2.2.5.5.1.Market Estimation, 2015 - 2022
8.2.2.5.5.2.Market Forecast, 2023 - 2031
8.3.Key Segment for Channeling Investments
8.3.1.By Type
9.Global Dark Fiber Network Market Analysis and Forecasts, 2023 – 2031
9.1.Overview
9.2.Global Dark Fiber Network Market Revenue (US$ Mn) and Forecasts, By Configuration
9.2.1.Point to point
9.2.1.1.Definition
9.2.1.2.Market Estimation and Penetration, 2015 - 2022
9.2.1.3.Market Forecast, 2023 - 2031
9.2.1.4.Compound Annual Growth Rate (CAGR)
9.2.1.5.Regional Bifurcation
9.2.1.5.1.North America
9.2.1.5.1.1.Market Estimation, 2015 - 2022
9.2.1.5.1.2.Market Forecast, 2023 - 2031
9.2.1.5.2.Europe
9.2.1.5.2.1.Market Estimation, 2015 - 2022
9.2.1.5.2.2.Market Forecast, 2023 - 2031
9.2.1.5.3.Asia Pacific
9.2.1.5.3.1.Market Estimation, 2015 - 2022
9.2.1.5.3.2.Market Forecast, 2023 - 2031
9.2.1.5.4.Middle East and Africa
9.2.1.5.4.1.Market Estimation, 2015 - 2022
9.2.1.5.4.2.Market Forecast, 2023 - 2031
9.2.1.5.5.Latin America
9.2.1.5.5.1.Market Estimation, 2015 - 2022
9.2.1.5.5.2.Market Forecast, 2023 - 2031
9.2.2.Ring
9.2.2.1.Definition
9.2.2.2.Market Estimation and Penetration, 2015 - 2022
9.2.2.3.Market Forecast, 2023 - 2031
9.2.2.4.Compound Annual Growth Rate (CAGR)
9.2.2.5.Regional Bifurcation
9.2.2.5.1.North America
9.2.2.5.1.1.Market Estimation, 2015 - 2022
9.2.2.5.1.2.Market Forecast, 2023 - 2031
9.2.2.5.2.Europe
9.2.2.5.2.1.Market Estimation, 2015 - 2022
9.2.2.5.2.2.Market Forecast, 2023 - 2031
9.2.2.5.3.Asia Pacific
9.2.2.5.3.1.Market Estimation, 2015 - 2022
9.2.2.5.3.2.Market Forecast, 2023 - 2031
9.2.2.5.4.Middle East and Africa
9.2.2.5.4.1.Market Estimation, 2015 - 2022
9.2.2.5.4.2.Market Forecast, 2023 - 2031
9.2.2.5.5.Latin America
9.2.2.5.5.1.Market Estimation, 2015 - 2022
9.2.2.5.5.2.Market Forecast, 2023 - 2031
9.3.Key Segment for Channeling Investments
9.3.1.By Configuration
10.Global Dark Fiber Network Market Analysis and Forecasts, 2023 – 2031
10.1.Overview
10.2.Global Dark Fiber Network Market Revenue (US$ Mn) and Forecasts, By Organization Size
10.2.1.Small and Medium Size Organizations
10.2.1.1.Definition
10.2.1.2.Market Estimation and Penetration, 2015 - 2022
10.2.1.3.Market Forecast, 2023 - 2031
10.2.1.4.Compound Annual Growth Rate (CAGR)
10.2.1.5.Regional Bifurcation
10.2.1.5.1.North America
10.2.1.5.1.1.Market Estimation, 2015 - 2022
10.2.1.5.1.2.Market Forecast, 2023 - 2031
10.2.1.5.2.Europe
10.2.1.5.2.1.Market Estimation, 2015 - 2022
10.2.1.5.2.2.Market Forecast, 2023 - 2031
10.2.1.5.3.Asia Pacific
10.2.1.5.3.1.Market Estimation, 2015 - 2022
10.2.1.5.3.2.Market Forecast, 2023 - 2031
10.2.1.5.4.Middle East and Africa
10.2.1.5.4.1.Market Estimation, 2015 - 2022
10.2.1.5.4.2.Market Forecast, 2023 - 2031
10.2.1.5.5.Latin America
10.2.1.5.5.1.Market Estimation, 2015 - 2022
10.2.1.5.5.2.Market Forecast, 2023 - 2031
10.2.2. Large Organizations
10.2.2.1.Definition
10.2.2.2.Market Estimation and Penetration, 2015 - 2022
10.2.2.3.Market Forecast, 2023 - 2031
10.2.2.4.Compound Annual Growth Rate (CAGR)
10.2.2.5.Regional Bifurcation
10.2.2.5.1.North America
10.2.2.5.1.1.Market Estimation, 2015 - 2022
10.2.2.5.1.2.Market Forecast, 2023 - 2031
10.2.2.5.2.Europe
10.2.2.5.2.1.Market Estimation, 2015 - 2022
10.2.2.5.2.2.Market Forecast, 2023 - 2031
10.2.2.5.3.Asia Pacific
10.2.2.5.3.1.Market Estimation, 2015 - 2022
10.2.2.5.3.2.Market Forecast, 2023 - 2031
10.2.2.5.4.Middle East and Africa
10.2.2.5.4.1.Market Estimation, 2015 - 2022
10.2.2.5.4.2.Market Forecast, 2023 - 2031
10.2.2.5.5.Latin America
10.2.2.5.5.1.Market Estimation, 2015 - 2022
10.2.2.5.5.2.Market Forecast, 2023 - 2031
10.3.Key Segment for Channeling Investments
10.3.1.By Organization Size
11.Global Dark Fiber Network Market Analysis and Forecasts, 2023 – 2031
11.1.Overview
11.2.Global Dark Fiber Network Market Revenue (US$ Mn) and Forecasts, By End Users
11.2.1.IT and Telecommunication
11.2.1.1.Definition
11.2.1.2.Market Estimation and Penetration, 2015 - 2022
11.2.1.3.Market Forecast, 2023 - 2031
11.2.1.4.Compound Annual Growth Rate (CAGR)
11.2.1.5.Regional Bifurcation
11.2.1.5.1.North America
11.2.1.5.1.1.Market Estimation, 2015 - 2022
11.2.1.5.1.2.Market Forecast, 2023 - 2031
11.2.1.5.2.Europe
11.2.1.5.2.1.Market Estimation, 2015 - 2022
11.2.1.5.2.2.Market Forecast, 2023 - 2031
11.2.1.5.3.Asia Pacific
11.2.1.5.3.1.Market Estimation, 2015 - 2022
11.2.1.5.3.2.Market Forecast, 2023 - 2031
11.2.1.5.4.Middle East and Africa
11.2.1.5.4.1.Market Estimation, 2015 - 2022
11.2.1.5.4.2.Market Forecast, 2023 - 2031
11.2.1.5.5.Latin America
11.2.1.5.5.1.Market Estimation, 2015 - 2022
11.2.1.5.5.2.Market Forecast, 2023 - 2031
11.2.2.Government
11.2.2.1.Definition
11.2.2.2.Market Estimation and Penetration, 2015 - 2022
11.2.2.3.Market Forecast, 2023 - 2031
11.2.2.4.Compound Annual Growth Rate (CAGR)
11.2.2.5.Regional Bifurcation
11.2.2.5.1.North America
11.2.2.5.1.1.Market Estimation, 2015 - 2022
11.2.2.5.1.2.Market Forecast, 2023 - 2031
11.2.2.5.2.Europe
11.2.2.5.2.1.Market Estimation, 2015 - 2022
11.2.2.5.2.2.Market Forecast, 2023 - 2031
11.2.2.5.3.Asia Pacific
11.2.2.5.3.1.Market Estimation, 2015 - 2022
11.2.2.5.3.2.Market Forecast, 2023 - 2031
11.2.2.5.4.Middle East and Africa
11.2.2.5.4.1.Market Estimation, 2015 - 2022
11.2.2.5.4.2.Market Forecast, 2023 - 2031
11.2.2.5.5.Latin America
11.2.2.5.5.1.Market Estimation, 2015 - 2022
11.2.2.5.5.2.Market Forecast, 2023 - 2031
11.2.3.School
11.2.3.1.Definition
11.2.3.2.Market Estimation and Penetration, 2015 - 2022
11.2.3.3.Market Forecast, 2023 - 2031
11.2.3.4.Compound Annual Growth Rate (CAGR)
11.2.3.5.Regional Bifurcation
11.2.3.5.1.North America
11.2.3.5.1.1.Market Estimation, 2015 - 2022
11.2.3.5.1.2.Market Forecast, 2023 - 2031
11.2.3.5.2.Europe
11.2.3.5.2.1.Market Estimation, 2015 - 2022
11.2.3.5.2.2.Market Forecast, 2023 - 2031
11.2.3.5.3.Asia Pacific
11.2.3.5.3.1.Market Estimation, 2015 - 2022
11.2.3.5.3.2.Market Forecast, 2023 - 2031
11.2.3.5.4.Middle East and Africa
11.2.3.5.4.1.Market Estimation, 2015 - 2022
11.2.3.5.4.2.Market Forecast, 2023 - 2031
11.2.3.5.5.Latin America
11.2.3.5.5.1.Market Estimation, 2015 - 2022
11.2.3.5.5.2.Market Forecast, 2023 - 2031
11.2.4.Hotels and Hospitality
11.2.4.1.Definition
11.2.4.2.Market Estimation and Penetration, 2015 - 2022
11.2.4.3.Market Forecast, 2023 - 2031
11.2.4.4.Compound Annual Growth Rate (CAGR)
11.2.4.5.Regional Bifurcation
11.2.4.5.1.North America
11.2.4.5.1.1.Market Estimation, 2015 - 2022
11.2.4.5.1.2.Market Forecast, 2023 - 2031
11.2.4.5.2.Europe
11.2.4.5.2.1.Market Estimation, 2015 - 2022
11.2.4.5.2.2.Market Forecast, 2023 - 2031
11.2.4.5.3.Asia Pacific
11.2.4.5.3.1.Market Estimation, 2015 - 2022
11.2.4.5.3.2.Market Forecast, 2023 - 2031
11.2.4.5.4.Middle East and Africa
11.2.4.5.4.1.Market Estimation, 2015 - 2022
11.2.4.5.4.2.Market Forecast, 2023 - 2031
11.2.4.5.5.Latin America
11.2.4.5.5.1.Market Estimation, 2015 - 2022
11.2.4.5.5.2.Market Forecast, 2023 - 2031
11.2.5.Financial Institutions
11.2.5.1.Definition
11.2.5.2.Market Estimation and Penetration, 2015 - 2022
11.2.5.3.Market Forecast, 2023 - 2031
11.2.5.4.Compound Annual Growth Rate (CAGR)
11.2.5.5.Regional Bifurcation
11.2.5.5.1.North America
11.2.5.5.1.1.Market Estimation, 2015 - 2022
11.2.5.5.1.2.Market Forecast, 2023 - 2031
11.2.5.5.2.Europe
11.2.5.5.2.1.Market Estimation, 2015 - 2022
11.2.5.5.2.2.Market Forecast, 2023 - 2031
11.2.5.5.3.Asia Pacific
11.2.5.5.3.1.Market Estimation, 2015 - 2022
11.2.5.5.3.2.Market Forecast, 2023 - 2031
11.2.5.5.4.Middle East and Africa
11.2.5.5.4.1.Market Estimation, 2015 - 2022
11.2.5.5.4.2.Market Forecast, 2023 - 2031
11.2.5.5.5.Latin America
11.2.5.5.5.1.Market Estimation, 2015 - 2022
11.2.5.5.5.2.Market Forecast, 2023 - 2031
11.2.6.E-commerce and retail
11.2.6.1.Definition
11.2.6.2.Market Estimation and Penetration, 2015 - 2022
11.2.6.3.Market Forecast, 2023 - 2031
11.2.6.4.Compound Annual Growth Rate (CAGR)
11.2.6.5.Regional Bifurcation
11.2.6.5.1.North America
11.2.6.5.1.1.Market Estimation, 2015 - 2022
11.2.6.5.1.2.Market Forecast, 2023 - 2031
11.2.6.5.2.Europe
11.2.6.5.2.1.Market Estimation, 2015 - 2022
11.2.6.5.2.2.Market Forecast, 2023 - 2031
11.2.6.5.3.Asia Pacific
11.2.6.5.3.1.Market Estimation, 2015 - 2022
11.2.6.5.3.2.Market Forecast, 2023 - 2031
11.2.6.5.4.Middle East and Africa
11.2.6.5.4.1.Market Estimation, 2015 - 2022
11.2.6.5.4.2.Market Forecast, 2023 - 2031
11.2.6.5.5.Latin America
11.2.6.5.5.1.Market Estimation, 2015 - 2022
11.2.6.5.5.2.Market Forecast, 2023 - 2031
11.2.7.Manufacturing
11.2.7.1.Definition
11.2.7.2.Market Estimation and Penetration, 2015 - 2022
11.2.7.3.Market Forecast, 2023 - 2031
11.2.7.4.Compound Annual Growth Rate (CAGR)
11.2.7.5.Regional Bifurcation
11.2.7.5.1.North America
11.2.7.5.1.1.Market Estimation, 2015 - 2022
11.2.7.5.1.2.Market Forecast, 2023 - 2031
11.2.7.5.2.Europe
11.2.7.5.2.1.Market Estimation, 2015 - 2022
11.2.7.5.2.2.Market Forecast, 2023 - 2031
11.2.7.5.3.Asia Pacific
11.2.7.5.3.1.Market Estimation, 2015 - 2022
11.2.7.5.3.2.Market Forecast, 2023 - 2031
11.2.7.5.4.Middle East and Africa
11.2.7.5.4.1.Market Estimation, 2015 - 2022
11.2.7.5.4.2.Market Forecast, 2023 - 2031
11.2.7.5.5.Latin America
11.2.7.5.5.1.Market Estimation, 2015 - 2022
11.2.7.5.5.2.Market Forecast, 2023 - 2031
11.2.8.Logistics
11.2.8.1.Definition
11.2.8.2.Market Estimation and Penetration, 2015 - 2022
11.2.8.3.Market Forecast, 2023 - 2031
11.2.8.4.Compound Annual Growth Rate (CAGR)
11.2.8.5.Regional Bifurcation
11.2.8.5.1.North America
11.2.8.5.1.1.Market Estimation, 2015 - 2022
11.2.8.5.1.2.Market Forecast, 2023 - 2031
11.2.8.5.2.Europe
11.2.8.5.2.1.Market Estimation, 2015 - 2022
11.2.8.5.2.2.Market Forecast, 2023 - 2031
11.2.8.5.3.Asia Pacific
11.2.8.5.3.1.Market Estimation, 2015 - 2022
11.2.8.5.3.2.Market Forecast, 2023 - 2031
11.2.8.5.4.Middle East and Africa
11.2.8.5.4.1.Market Estimation, 2015 - 2022
11.2.8.5.4.2.Market Forecast, 2023 - 2031
11.2.8.5.5.Latin America
11.2.8.5.5.1.Market Estimation, 2015 - 2022
11.2.8.5.5.2.Market Forecast, 2023 - 2031
11.2.9.Others
11.2.9.1.Definition
11.2.9.2.Market Estimation and Penetration, 2015 - 2022
11.2.9.3.Market Forecast, 2023 - 2031
11.2.9.4.Compound Annual Growth Rate (CAGR)
11.2.9.5.Regional Bifurcation
11.2.9.5.1.North America
11.2.9.5.1.1.Market Estimation, 2015 - 2022
11.2.9.5.1.2.Market Forecast, 2023 - 2031
11.2.9.5.2.Europe
11.2.9.5.2.1.Market Estimation, 2015 - 2022
11.2.9.5.2.2.Market Forecast, 2023 - 2031
11.2.9.5.3.Asia Pacific
11.2.9.5.3.1.Market Estimation, 2015 - 2022
11.2.9.5.3.2.Market Forecast, 2023 - 2031
11.2.9.5.4.Middle East and Africa
11.2.9.5.4.1.Market Estimation, 2015 - 2022
11.2.9.5.4.2.Market Forecast, 2023 - 2031
11.2.9.5.5.Latin America
11.2.9.5.5.1.Market Estimation, 2015 - 2022
11.2.9.5.5.2.Market Forecast, 2023 - 2031
11.3.Key Segment for Channeling Investments
11.3.1.By End Users
12.North America Dark Fiber Network Market Analysis and Forecasts, 2023 – 2031
12.1.Overview
12.1.1.North America Dark Fiber Network Market Revenue (US$ Mn)
12.2.North America Dark Fiber Network Market Revenue (US$ Mn) and Forecasts, By Type
12.2.1.Metro
12.2.2.Long haul
12.3.North America Dark Fiber Network Market Revenue (US$ Mn) and Forecasts, By Configuration
12.3.1.Point to point
12.3.2.Ring
12.4.North America Dark Fiber Network Market Revenue (US$ Mn) and Forecasts, By Organization Size
12.4.1.Small and Medium Size Organizations
12.4.2. Large Organizations
12.5.North America Dark Fiber Network Market Revenue (US$ Mn) and Forecasts, By End Users
12.5.1.IT and Telecommunication
12.5.2.Government
12.5.3.School
12.5.4.Hotels and Hospitality
12.5.5.Financial Institutions
12.5.6.E-commerce and retail
12.5.7.Manufacturing
12.5.8.Logistics
12.5.9.Others
12.6.North America Dark Fiber Network Market Revenue (US$ Mn) and Forecasts, By Country
12.6.1.U.S
12.6.1.1.U.S Dark Fiber Network Market Revenue (US$ Mn) and Forecasts, By Type
12.6.1.1.1.Metro
12.6.1.1.2.Long haul
12.6.1.2.U.S Dark Fiber Network Market Revenue (US$ Mn) and Forecasts, By Configuration
12.6.1.2.1.Point to point
12.6.1.2.2.Ring
12.6.1.3.U.S Dark Fiber Network Market Revenue (US$ Mn) and Forecasts, By Organization Size
12.6.1.3.1.Small and Medium Size Organizations
12.6.1.3.2. Large Organizations
12.6.1.4.U.S Dark Fiber Network Market Revenue (US$ Mn) and Forecasts, By End Users
12.6.1.4.1.IT and Telecommunication
12.6.1.4.2.Government
12.6.1.4.3.School
12.6.1.4.4.Hotels and Hospitality
12.6.1.4.5.Financial Institutions
12.6.1.4.6.E-commerce and retail
12.6.1.4.7.Manufacturing
12.6.1.4.8.Logistics
12.6.1.4.9.Others
12.6.2.Canada
12.6.2.1.Canada Dark Fiber Network Market Revenue (US$ Mn) and Forecasts, By Type
12.6.2.1.1.Metro
12.6.2.1.2.Long haul
12.6.2.2.Canada Dark Fiber Network Market Revenue (US$ Mn) and Forecasts, By Configuration
12.6.2.2.1.Point to point
12.6.2.2.2.Ring
12.6.2.3.Canada Dark Fiber Network Market Revenue (US$ Mn) and Forecasts, By Organization Size
12.6.2.3.1.Small and Medium Size Organizations
12.6.2.3.2. Large Organizations
12.6.2.4.Canada Dark Fiber Network Market Revenue (US$ Mn) and Forecasts, By End Users
12.6.2.4.1.IT and Telecommunication
12.6.2.4.2.Government
12.6.2.4.3.School
12.6.2.4.4.Hotels and Hospitality
12.6.2.4.5.Financial Institutions
12.6.2.4.6.E-commerce and retail
12.6.2.4.7.Manufacturing
12.6.2.4.8.Logistics
12.6.2.4.9.Others
12.6.3.Mexico
12.6.3.1.Mexico Dark Fiber Network Market Revenue (US$ Mn) and Forecasts, By Type
12.6.3.1.1.Metro
12.6.3.1.2.Long haul
12.6.3.2.Mexico Dark Fiber Network Market Revenue (US$ Mn) and Forecasts, By Configuration
12.6.3.2.1.Point to point
12.6.3.2.2.Ring
12.6.3.3.Mexico Dark Fiber Network Market Revenue (US$ Mn) and Forecasts, By Organization Size
12.6.3.3.1.Small and Medium Size Organizations
12.6.3.3.2. Large Organizations
12.6.3.4.Mexico Dark Fiber Network Market Revenue (US$ Mn) and Forecasts, By End Users
12.6.3.4.1.IT and Telecommunication
12.6.3.4.2.Government
12.6.3.4.3.School
12.6.3.4.4.Hotels and Hospitality
12.6.3.4.5.Financial Institutions
12.6.3.4.6.E-commerce and retail
12.6.3.4.7.Manufacturing
12.6.3.4.8.Logistics
12.6.3.4.9.Others
12.6.4.Rest of North America
12.6.4.1.Rest of North America Dark Fiber Network Market Revenue (US$ Mn) and Forecasts, By Type
12.6.4.1.1.Metro
12.6.4.1.2.Long haul
12.6.4.2.Rest of North America Dark Fiber Network Market Revenue (US$ Mn) and Forecasts, By Configuration
12.6.4.2.1.Point to point
12.6.4.2.2.Ring
12.6.4.3.Rest of North America Dark Fiber Network Market Revenue (US$ Mn) and Forecasts, By Organization Size
12.6.4.3.1.Small and Medium Size Organizations
12.6.4.3.2. Large Organizations
12.6.4.4.Rest of North America Dark Fiber Network Market Revenue (US$ Mn) and Forecasts, By End Users
12.6.4.4.1.IT and Telecommunication
12.6.4.4.2.Government
12.6.4.4.3.School
12.6.4.4.4.Hotels and Hospitality
12.6.4.4.5.Financial Institutions
12.6.4.4.6.E-commerce and retail
12.6.4.4.7.Manufacturing
12.6.4.4.8.Logistics
12.6.4.4.9.Others
12.7.Key Segment for Channeling Investments
12.7.1.By Country
12.7.2.By Type
12.7.3.By Configuration
12.7.4.By Organization Size
12.7.5.By End Users
13.Europe Dark Fiber Network Market Analysis and Forecasts, 2023 – 2031
13.1.Overview
13.1.1.Europe Dark Fiber Network Market Revenue (US$ Mn)
13.2.Europe Dark Fiber Network Market Revenue (US$ Mn) and Forecasts, By Type
13.2.1.Metro
13.2.2.Long haul
13.3.Europe Dark Fiber Network Market Revenue (US$ Mn) and Forecasts, By Configuration
13.3.1.Point to point
13.3.2.Ring
13.4.Europe Dark Fiber Network Market Revenue (US$ Mn) and Forecasts, By Organization Size
13.4.1.Small and Medium Size Organizations
13.4.2. Large Organizations
13.5.Europe Dark Fiber Network Market Revenue (US$ Mn) and Forecasts, By End Users
13.5.1.IT and Telecommunication
13.5.2.Government
13.5.3.School
13.5.4.Hotels and Hospitality
13.5.5.Financial Institutions
13.5.6.E-commerce and retail
13.5.7.Manufacturing
13.5.8.Logistics
13.5.9.Others
13.6.Europe Dark Fiber Network Market Revenue (US$ Mn) and Forecasts, By Country
13.6.1.France
13.6.1.1.France Dark Fiber Network Market Revenue (US$ Mn) and Forecasts, By Type
13.6.1.1.1.Metro
13.6.1.1.2.Long haul
13.6.1.2.France Dark Fiber Network Market Revenue (US$ Mn) and Forecasts, By Configuration
13.6.1.2.1.Point to point
13.6.1.2.2.Ring
13.6.1.3.France Dark Fiber Network Market Revenue (US$ Mn) and Forecasts, By Organization Size
13.6.1.3.1.Small and Medium Size Organizations
13.6.1.3.2. Large Organizations
13.6.1.4.France Dark Fiber Network Market Revenue (US$ Mn) and Forecasts, By End Users
13.6.1.4.1.IT and Telecommunication
13.6.1.4.2.Government
13.6.1.4.3.School
13.6.1.4.4.Hotels and Hospitality
13.6.1.4.5.Financial Institutions
13.6.1.4.6.E-commerce and retail
13.6.1.4.7.Manufacturing
13.6.1.4.8.Logistics
13.6.1.4.9.Others
13.6.2.The UK
13.6.2.1.The UK Dark Fiber Network Market Revenue (US$ Mn) and Forecasts, By Type
13.6.2.1.1.Metro
13.6.2.1.2.Long haul
13.6.2.2.The UK Dark Fiber Network Market Revenue (US$ Mn) and Forecasts, By Configuration
13.6.2.2.1.Point to point
13.6.2.2.2.Ring
13.6.2.3.The UK Dark Fiber Network Market Revenue (US$ Mn) and Forecasts, By Organization Size
13.6.2.3.1.Small and Medium Size Organizations
13.6.2.3.2. Large Organizations
13.6.2.4.The UK Dark Fiber Network Market Revenue (US$ Mn) and Forecasts, By End Users
13.6.2.4.1.IT and Telecommunication
13.6.2.4.2.Government
13.6.2.4.3.School
13.6.2.4.4.Hotels and Hospitality
13.6.2.4.5.Financial Institutions
13.6.2.4.6.E-commerce and retail
13.6.2.4.7.Manufacturing
13.6.2.4.8.Logistics
13.6.2.4.9.Others
13.6.3.Spain
13.6.3.1.Spain Dark Fiber Network Market Revenue (US$ Mn) and Forecasts, By Type
13.6.3.1.1.Metro
13.6.3.1.2.Long haul
13.6.3.2.Spain Dark Fiber Network Market Revenue (US$ Mn) and Forecasts, By Configuration
13.6.3.2.1.Point to point
13.6.3.2.2.Ring
13.6.3.3.Spain Dark Fiber Network Market Revenue (US$ Mn) and Forecasts, By Organization Size
13.6.3.3.1.Small and Medium Size Organizations
13.6.3.3.2. Large Organizations
13.6.3.4.Spain Dark Fiber Network Market Revenue (US$ Mn) and Forecasts, By End Users
13.6.3.4.1.IT and Telecommunication
13.6.3.4.2.Government
13.6.3.4.3.School
13.6.3.4.4.Hotels and Hospitality
13.6.3.4.5.Financial Institutions
13.6.3.4.6.E-commerce and retail
13.6.3.4.7.Manufacturing
13.6.3.4.8.Logistics
13.6.3.4.9.Others
13.6.4.Germany
13.6.4.1.Germany Dark Fiber Network Market Revenue (US$ Mn) and Forecasts, By Type
13.6.4.1.1.Metro
13.6.4.1.2.Long haul
13.6.4.2.Germany Dark Fiber Network Market Revenue (US$ Mn) and Forecasts, By Configuration
13.6.4.2.1.Point to point
13.6.4.2.2.Ring
13.6.4.3.Germany Dark Fiber Network Market Revenue (US$ Mn) and Forecasts, By Organization Size
13.6.4.3.1.Small and Medium Size Organizations
13.6.4.3.2. Large Organizations
13.6.4.4.Germany Dark Fiber Network Market Revenue (US$ Mn) and Forecasts, By End Users
13.6.4.4.1.IT and Telecommunication
13.6.4.4.2.Government
13.6.4.4.3.School
13.6.4.4.4.Hotels and Hospitality
13.6.4.4.5.Financial Institutions
13.6.4.4.6.E-commerce and retail
13.6.4.4.7.Manufacturing
13.6.4.4.8.Logistics
13.6.4.4.9.Others
13.6.5.Italy
13.6.5.1.Italy Dark Fiber Network Market Revenue (US$ Mn) and Forecasts, By Type
13.6.5.1.1.Metro
13.6.5.1.2.Long haul
13.6.5.2.Italy Dark Fiber Network Market Revenue (US$ Mn) and Forecasts, By Configuration
13.6.5.2.1.Point to point
13.6.5.2.2.Ring
13.6.5.3.Italy Dark Fiber Network Market Revenue (US$ Mn) and Forecasts, By Organization Size
13.6.5.3.1.Small and Medium Size Organizations
13.6.5.3.2. Large Organizations
13.6.5.4.Italy Dark Fiber Network Market Revenue (US$ Mn) and Forecasts, By End Users
13.6.5.4.1.IT and Telecommunication
13.6.5.4.2.Government
13.6.5.4.3.School
13.6.5.4.4.Hotels and Hospitality
13.6.5.4.5.Financial Institutions
13.6.5.4.6.E-commerce and retail
13.6.5.4.7.Manufacturing
13.6.5.4.8.Logistics
13.6.5.4.9.Others
13.6.6.Nordic Countries
13.6.6.1.Nordic Countries Dark Fiber Network Market Revenue (US$ Mn) and Forecasts, By Type
13.6.6.1.1.Metro
13.6.6.1.2.Long haul
13.6.6.2.Nordic Countries Dark Fiber Network Market Revenue (US$ Mn) and Forecasts, By Configuration
13.6.6.2.1.Point to point
13.6.6.2.2.Ring
13.6.6.3.Nordic Countries Dark Fiber Network Market Revenue (US$ Mn) and Forecasts, By Organization Size
13.6.6.3.1.Small and Medium Size Organizations
13.6.6.3.2. Large Organizations
13.6.6.4.Nordic Countries Dark Fiber Network Market Revenue (US$ Mn) and Forecasts, By End Users
13.6.6.4.1.IT and Telecommunication
13.6.6.4.2.Government
13.6.6.4.3.School
13.6.6.4.4.Hotels and Hospitality
13.6.6.4.5.Financial Institutions
13.6.6.4.6.E-commerce and retail
13.6.6.4.7.Manufacturing
13.6.6.4.8.Logistics
13.6.6.4.9.Others
13.6.6.5.Nordic Countries Dark Fiber Network Market Revenue (US$ Mn) and Forecasts, By Country
13.6.6.5.1.Denmark
13.6.6.5.2.Finland
13.6.6.5.3.Iceland
13.6.6.5.4.Sweden
13.6.6.5.5.Norway
13.6.7.Benelux Union
13.6.7.1.Benelux Union Dark Fiber Network Market Revenue (US$ Mn) and Forecasts, By Type
13.6.7.1.1.Metro
13.6.7.1.2.Long haul
13.6.7.2.Benelux Union Dark Fiber Network Market Revenue (US$ Mn) and Forecasts, By Configuration
13.6.7.2.1.Point to point
13.6.7.2.2.Ring
13.6.7.3.Benelux Union Dark Fiber Network Market Revenue (US$ Mn) and Forecasts, By Organization Size
13.6.7.3.1.Small and Medium Size Organizations
13.6.7.3.2. Large Organizations
13.6.7.4.Benelux Union Dark Fiber Network Market Revenue (US$ Mn) and Forecasts, By End Users
13.6.7.4.1.IT and Telecommunication
13.6.7.4.2.Government
13.6.7.4.3.School
13.6.7.4.4.Hotels and Hospitality
13.6.7.4.5.Financial Institutions
13.6.7.4.6.E-commerce and retail
13.6.7.4.7.Manufacturing
13.6.7.4.8.Logistics
13.6.7.4.9.Others
13.6.7.5.Benelux Union Dark Fiber Network Market Revenue (US$ Mn) and Forecasts, By Country
13.6.7.5.1.Belgium
13.6.7.5.2.The Netherlands
13.6.7.5.3.Luxembourg
13.6.8.Rest of Europe
13.6.8.1.Rest of Europe Dark Fiber Network Market Revenue (US$ Mn) and Forecasts, By Type
13.6.8.1.1.Metro
13.6.8.1.2.Long haul
13.6.8.2.Rest of Europe Dark Fiber Network Market Revenue (US$ Mn) and Forecasts, By Configuration
13.6.8.2.1.Point to point
13.6.8.2.2.Ring
13.6.8.3.Rest of Europe Dark Fiber Network Market Revenue (US$ Mn) and Forecasts, By Organization Size
13.6.8.3.1.Small and Medium Size Organizations
13.6.8.3.2. Large Organizations
13.6.8.4.Rest of Europe Dark Fiber Network Market Revenue (US$ Mn) and Forecasts, By End Users
13.6.8.4.1.IT and Telecommunication
13.6.8.4.2.Government
13.6.8.4.3.School
13.6.8.4.4.Hotels and Hospitality
13.6.8.4.5.Financial Institutions
13.6.8.4.6.E-commerce and retail
13.6.8.4.7.Manufacturing
13.6.8.4.8.Logistics
13.6.8.4.9.Others
13.7.Key Segment for Channeling Investments
13.7.1.By Country
13.7.2.By Type
13.7.3.By Configuration
13.7.4.By Organization Size
13.7.5.By End Users
14.Asia Pacific Dark Fiber Network Market Analysis and Forecasts, 2023 – 2031
14.1.Overview
14.1.1.Asia Pacific Dark Fiber Network Market Revenue (US$ Mn)
14.2.Asia Pacific Dark Fiber Network Market Revenue (US$ Mn) and Forecasts, By Type
14.2.1.Metro
14.2.2.Long haul
14.3.Asia Pacific Dark Fiber Network Market Revenue (US$ Mn) and Forecasts, By Configuration
14.3.1.Point to point
14.3.2.Ring
14.4.Asia Pacific Dark Fiber Network Market Revenue (US$ Mn) and Forecasts, By Organization Size
14.4.1.Small and Medium Size Organizations
14.4.2. Large Organizations
14.5.Asia Pacific Dark Fiber Network Market Revenue (US$ Mn) and Forecasts, By End Users
14.5.1.IT and Telecommunication
14.5.2.Government
14.5.3.School
14.5.4.Hotels and Hospitality
14.5.5.Financial Institutions
14.5.6.E-commerce and retail
14.5.7.Manufacturing
14.5.8.Logistics
14.5.9.Others
14.6.Asia Pacific Dark Fiber Network Market Revenue (US$ Mn) and Forecasts, By Country
14.6.1.China
14.6.1.1.China Dark Fiber Network Market Revenue (US$ Mn) and Forecasts, By Type
14.6.1.1.1.Metro
14.6.1.1.2.Long haul
14.6.1.2.China Dark Fiber Network Market Revenue (US$ Mn) and Forecasts, By Configuration
14.6.1.2.1.Point to point
14.6.1.2.2.Ring
14.6.1.3.China Dark Fiber Network Market Revenue (US$ Mn) and Forecasts, By Organization Size
14.6.1.3.1.Small and Medium Size Organizations
14.6.1.3.2. Large Organizations
14.6.1.4.China Dark Fiber Network Market Revenue (US$ Mn) and Forecasts, By End Users
14.6.1.4.1.IT and Telecommunication
14.6.1.4.2.Government
14.6.1.4.3.School
14.6.1.4.4.Hotels and Hospitality
14.6.1.4.5.Financial Institutions
14.6.1.4.6.E-commerce and retail
14.6.1.4.7.Manufacturing
14.6.1.4.8.Logistics
14.6.1.4.9.Others
14.6.2.Japan
14.6.2.1.Japan Dark Fiber Network Market Revenue (US$ Mn) and Forecasts, By Type
14.6.2.1.1.Metro
14.6.2.1.2.Long haul
14.6.2.2.Japan Dark Fiber Network Market Revenue (US$ Mn) and Forecasts, By Configuration
14.6.2.2.1.Point to point
14.6.2.2.2.Ring
14.6.2.3.Japan Dark Fiber Network Market Revenue (US$ Mn) and Forecasts, By Organization Size
14.6.2.3.1.Small and Medium Size Organizations
14.6.2.3.2. Large Organizations
14.6.2.4.Japan Dark Fiber Network Market Revenue (US$ Mn) and Forecasts, By End Users
14.6.2.4.1.IT and Telecommunication
14.6.2.4.2.Government
14.6.2.4.3.School
14.6.2.4.4.Hotels and Hospitality
14.6.2.4.5.Financial Institutions
14.6.2.4.6.E-commerce and retail
14.6.2.4.7.Manufacturing
14.6.2.4.8.Logistics
14.6.2.4.9.Others
14.6.3.India
14.6.3.1.India Dark Fiber Network Market Revenue (US$ Mn) and Forecasts, By Type
14.6.3.1.1.Metro
14.6.3.1.2.Long haul
14.6.3.2.India Dark Fiber Network Market Revenue (US$ Mn) and Forecasts, By Configuration
14.6.3.2.1.Point to point
14.6.3.2.2.Ring
14.6.3.3.India Dark Fiber Network Market Revenue (US$ Mn) and Forecasts, By Organization Size
14.6.3.3.1.Small and Medium Size Organizations
14.6.3.3.2. Large Organizations
14.6.3.4.India Dark Fiber Network Market Revenue (US$ Mn) and Forecasts, By End Users
14.6.3.4.1.IT and Telecommunication
14.6.3.4.2.Government
14.6.3.4.3.School
14.6.3.4.4.Hotels and Hospitality
14.6.3.4.5.Financial Institutions
14.6.3.4.6.E-commerce and retail
14.6.3.4.7.Manufacturing
14.6.3.4.8.Logistics
14.6.3.4.9.Others
14.6.4.New Zealand
14.6.4.1.New Zealand Dark Fiber Network Market Revenue (US$ Mn) and Forecasts, By Type
14.6.4.1.1.Metro
14.6.4.1.2.Long haul
14.6.4.2.New Zealand Dark Fiber Network Market Revenue (US$ Mn) and Forecasts, By Configuration
14.6.4.2.1.Point to point
14.6.4.2.2.Ring
14.6.4.3.New Zealand Dark Fiber Network Market Revenue (US$ Mn) and Forecasts, By Organization Size
14.6.4.3.1.Small and Medium Size Organizations
14.6.4.3.2. Large Organizations
14.6.4.4.New Zealand Dark Fiber Network Market Revenue (US$ Mn) and Forecasts, By End Users
14.6.4.4.1.IT and Telecommunication
14.6.4.4.2.Government
14.6.4.4.3.School
14.6.4.4.4.Hotels and Hospitality
14.6.4.4.5.Financial Institutions
14.6.4.4.6.E-commerce and retail
14.6.4.4.7.Manufacturing
14.6.4.4.8.Logistics
14.6.4.4.9.Others
14.6.5.Australia
14.6.5.1.Australia Dark Fiber Network Market Revenue (US$ Mn) and Forecasts, By Type
14.6.5.1.1.Metro
14.6.5.1.2.Long haul
14.6.5.2.Australia Dark Fiber Network Market Revenue (US$ Mn) and Forecasts, By Configuration
14.6.5.2.1.Point to point
14.6.5.2.2.Ring
14.6.5.3.Australia Dark Fiber Network Market Revenue (US$ Mn) and Forecasts, By Organization Size
14.6.5.3.1.Small and Medium Size Organizations
14.6.5.3.2. Large Organizations
14.6.5.4.Australia Dark Fiber Network Market Revenue (US$ Mn) and Forecasts, By End Users
14.6.5.4.1.IT and Telecommunication
14.6.5.4.2.Government
14.6.5.4.3.School
14.6.5.4.4.Hotels and Hospitality
14.6.5.4.5.Financial Institutions
14.6.5.4.6.E-commerce and retail
14.6.5.4.7.Manufacturing
14.6.5.4.8.Logistics
14.6.5.4.9.Others
14.6.6.South Korea
14.6.6.1.South Korea Dark Fiber Network Market Revenue (US$ Mn) and Forecasts, By Type
14.6.6.1.1.Metro
14.6.6.1.2.Long haul
14.6.6.2.South Korea Dark Fiber Network Market Revenue (US$ Mn) and Forecasts, By Configuration
14.6.6.2.1.Point to point
14.6.6.2.2.Ring
14.6.6.3.South Korea Dark Fiber Network Market Revenue (US$ Mn) and Forecasts, By Organization Size
14.6.6.3.1.Small and Medium Size Organizations
14.6.6.3.2. Large Organizations
14.6.6.4.South Korea Dark Fiber Network Market Revenue (US$ Mn) and Forecasts, By End Users
14.6.6.4.1.IT and Telecommunication
14.6.6.4.2.Government
14.6.6.4.3.School
14.6.6.4.4.Hotels and Hospitality
14.6.6.4.5.Financial Institutions
14.6.6.4.6.E-commerce and retail
14.6.6.4.7.Manufacturing
14.6.6.4.8.Logistics
14.6.6.4.9.Others
14.6.7.Southeast Asia
14.6.7.1.Southeast Asia Dark Fiber Network Market Revenue (US$ Mn) and Forecasts, By Type
14.6.7.1.1.Metro
14.6.7.1.2.Long haul
14.6.7.2.Southeast Asia Dark Fiber Network Market Revenue (US$ Mn) and Forecasts, By Configuration
14.6.7.2.1.Point to point
14.6.7.2.2.Ring
14.6.7.3.Southeast Asia Dark Fiber Network Market Revenue (US$ Mn) and Forecasts, By Organization Size
14.6.7.3.1.Small and Medium Size Organizations
14.6.7.3.2. Large Organizations
14.6.7.4.Southeast Asia Dark Fiber Network Market Revenue (US$ Mn) and Forecasts, By End Users
14.6.7.4.1.IT and Telecommunication
14.6.7.4.2.Government
14.6.7.4.3.School
14.6.7.4.4.Hotels and Hospitality
14.6.7.4.5.Financial Institutions
14.6.7.4.6.E-commerce and retail
14.6.7.4.7.Manufacturing
14.6.7.4.8.Logistics
14.6.7.4.9.Others
14.6.7.5.Southeast Asia Dark Fiber Network Market Revenue (US$ Mn) and Forecasts, By Country
14.6.7.5.1.Indonesia
14.6.7.5.2.Thailand
14.6.7.5.3.Malaysia
14.6.7.5.4.Singapore
14.6.7.5.5.Rest of Southeast Asia
14.6.8.Rest of Asia Pacific
14.6.8.1.Rest of Asia Pacific Dark Fiber Network Market Revenue (US$ Mn) and Forecasts, By Type
14.6.8.1.1.Metro
14.6.8.1.2.Long haul
14.6.8.2.Rest of Asia Pacific Dark Fiber Network Market Revenue (US$ Mn) and Forecasts, By Configuration
14.6.8.2.1.Point to point
14.6.8.2.2.Ring
14.6.8.3.Rest of Asia Pacific Dark Fiber Network Market Revenue (US$ Mn) and Forecasts, By Organization Size
14.6.8.3.1.Small and Medium Size Organizations
14.6.8.3.2. Large Organizations
14.6.8.4.Rest of Asia Pacific Dark Fiber Network Market Revenue (US$ Mn) and Forecasts, By End Users
14.6.8.4.1.IT and Telecommunication
14.6.8.4.2.Government
14.6.8.4.3.School
14.6.8.4.4.Hotels and Hospitality
14.6.8.4.5.Financial Institutions
14.6.8.4.6.E-commerce and retail
14.6.8.4.7.Manufacturing
14.6.8.4.8.Logistics
14.6.8.4.9.Others
14.7.Key Segment for Channeling Investments
14.7.1.By Country
14.7.2.By Type
14.7.3.By Configuration
14.7.4.By Organization Size
14.7.5.By End Users
15.Middle East and Africa Dark Fiber Network Market Analysis and Forecasts, 2023 – 2031
15.1.Overview
15.1.1.Middle East and Africa Dark Fiber Network Market Revenue (US$ Mn)
15.2.Middle East and Africa Dark Fiber Network Market Revenue (US$ Mn) and Forecasts, By Type
15.2.1.Metro
15.2.2.Long haul
15.3.Middle East and Africa Dark Fiber Network Market Revenue (US$ Mn) and Forecasts, By Configuration
15.3.1.Point to point
15.3.2.Ring
15.4.Middle East and Africa Dark Fiber Network Market Revenue (US$ Mn) and Forecasts, By Organization Size
15.4.1.Small and Medium Size Organizations
15.4.2. Large Organizations
15.5.Middle East and Africa Dark Fiber Network Market Revenue (US$ Mn) and Forecasts, By End Users
15.5.1.IT and Telecommunication
15.5.2.Government
15.5.3.School
15.5.4.Hotels and Hospitality
15.5.5.Financial Institutions
15.5.6.E-commerce and retail
15.5.7.Manufacturing
15.5.8.Logistics
15.5.9.Others
15.6.Middle East and Africa Dark Fiber Network Market Revenue (US$ Mn) and Forecasts, By Country
15.6.1.Saudi Arabia
15.6.1.1.Saudi Arabia Dark Fiber Network Market Revenue (US$ Mn) and Forecasts, By Type
15.6.1.1.1.Metro
15.6.1.1.2.Long haul
15.6.1.2.Saudi Arabia Dark Fiber Network Market Revenue (US$ Mn) and Forecasts, By Configuration
15.6.1.2.1.Point to point
15.6.1.2.2.Ring
15.6.1.3.Saudi Arabia Dark Fiber Network Market Revenue (US$ Mn) and Forecasts, By Organization Size
15.6.1.3.1.Small and Medium Size Organizations
15.6.1.3.2. Large Organizations
15.6.1.4.Saudi Arabia Dark Fiber Network Market Revenue (US$ Mn) and Forecasts, By End Users
15.6.1.4.1.IT and Telecommunication
15.6.1.4.2.Government
15.6.1.4.3.School
15.6.1.4.4.Hotels and Hospitality
15.6.1.4.5.Financial Institutions
15.6.1.4.6.E-commerce and retail
15.6.1.4.7.Manufacturing
15.6.1.4.8.Logistics
15.6.1.4.9.Others
15.6.2.UAE
15.6.2.1.UAE Dark Fiber Network Market Revenue (US$ Mn) and Forecasts, By Type
15.6.2.1.1.Metro
15.6.2.1.2.Long haul
15.6.2.2.UAE Dark Fiber Network Market Revenue (US$ Mn) and Forecasts, By Configuration
15.6.2.2.1.Point to point
15.6.2.2.2.Ring
15.6.2.3.UAE Dark Fiber Network Market Revenue (US$ Mn) and Forecasts, By Organization Size
15.6.2.3.1.Small and Medium Size Organizations
15.6.2.3.2. Large Organizations
15.6.2.4.UAE Dark Fiber Network Market Revenue (US$ Mn) and Forecasts, By End Users
15.6.2.4.1.IT and Telecommunication
15.6.2.4.2.Government
15.6.2.4.3.School
15.6.2.4.4.Hotels and Hospitality
15.6.2.4.5.Financial Institutions
15.6.2.4.6.E-commerce and retail
15.6.2.4.7.Manufacturing
15.6.2.4.8.Logistics
15.6.2.4.9.Others
15.6.3.Egypt
15.6.3.1.Egypt Dark Fiber Network Market Revenue (US$ Mn) and Forecasts, By Type
15.6.3.1.1.Metro
15.6.3.1.2.Long haul
15.6.3.2.Egypt Dark Fiber Network Market Revenue (US$ Mn) and Forecasts, By Configuration
15.6.3.2.1.Point to point
15.6.3.2.2.Ring
15.6.3.3.Egypt Dark Fiber Network Market Revenue (US$ Mn) and Forecasts, By Organization Size
15.6.3.3.1.Small and Medium Size Organizations
15.6.3.3.2. Large Organizations
15.6.3.4.Egypt Dark Fiber Network Market Revenue (US$ Mn) and Forecasts, By End Users
15.6.3.4.1.IT and Telecommunication
15.6.3.4.2.Government
15.6.3.4.3.School
15.6.3.4.4.Hotels and Hospitality
15.6.3.4.5.Financial Institutions
15.6.3.4.6.E-commerce and retail
15.6.3.4.7.Manufacturing
15.6.3.4.8.Logistics
15.6.3.4.9.Others
15.6.4.Kuwait
15.6.4.1.Kuwait Dark Fiber Network Market Revenue (US$ Mn) and Forecasts, By Type
15.6.4.1.1.Metro
15.6.4.1.2.Long haul
15.6.4.2.Kuwait Dark Fiber Network Market Revenue (US$ Mn) and Forecasts, By Configuration
15.6.4.2.1.Point to point
15.6.4.2.2.Ring
15.6.4.3.Kuwait Dark Fiber Network Market Revenue (US$ Mn) and Forecasts, By Organization Size
15.6.4.3.1.Small and Medium Size Organizations
15.6.4.3.2. Large Organizations
15.6.4.4.Kuwait Dark Fiber Network Market Revenue (US$ Mn) and Forecasts, By End Users
15.6.4.4.1.IT and Telecommunication
15.6.4.4.2.Government
15.6.4.4.3.School
15.6.4.4.4.Hotels and Hospitality
15.6.4.4.5.Financial Institutions
15.6.4.4.6.E-commerce and retail
15.6.4.4.7.Manufacturing
15.6.4.4.8.Logistics
15.6.4.4.9.Others
15.6.5.South Africa
15.6.5.1.South Africa Dark Fiber Network Market Revenue (US$ Mn) and Forecasts, By Type
15.6.5.1.1.Metro
15.6.5.1.2.Long haul
15.6.5.2.South Africa Dark Fiber Network Market Revenue (US$ Mn) and Forecasts, By Configuration
15.6.5.2.1.Point to point
15.6.5.2.2.Ring
15.6.5.3.South Africa Dark Fiber Network Market Revenue (US$ Mn) and Forecasts, By Organization Size
15.6.5.3.1.Small and Medium Size Organizations
15.6.5.3.2. Large Organizations
15.6.5.4.South Africa Dark Fiber Network Market Revenue (US$ Mn) and Forecasts, By End Users
15.6.5.4.1.IT and Telecommunication
15.6.5.4.2.Government
15.6.5.4.3.School
15.6.5.4.4.Hotels and Hospitality
15.6.5.4.5.Financial Institutions
15.6.5.4.6.E-commerce and retail
15.6.5.4.7.Manufacturing
15.6.5.4.8.Logistics
15.6.5.4.9.Others
15.6.6.Rest of Middle East & Africa
15.6.6.1.Rest of Middle East & Africa Dark Fiber Network Market Revenue (US$ Mn) and Forecasts, By Type
15.6.6.1.1.Metro
15.6.6.1.2.Long haul
15.6.6.2.Rest of Middle East & Africa Dark Fiber Network Market Revenue (US$ Mn) and Forecasts, By Configuration
15.6.6.2.1.Point to point
15.6.6.2.2.Ring
15.6.6.3.Rest of Middle East & Africa Dark Fiber Network Market Revenue (US$ Mn) and Forecasts, By Organization Size
15.6.6.3.1.Small and Medium Size Organizations
15.6.6.3.2. Large Organizations
15.6.6.4.Rest of Middle East & Africa Dark Fiber Network Market Revenue (US$ Mn) and Forecasts, By End Users
15.6.6.4.1.IT and Telecommunication
15.6.6.4.2.Government
15.6.6.4.3.School
15.6.6.4.4.Hotels and Hospitality
15.6.6.4.5.Financial Institutions
15.6.6.4.6.E-commerce and retail
15.6.6.4.7.Manufacturing
15.6.6.4.8.Logistics
15.6.6.4.9.Others
15.7.Key Segment for Channeling Investments
15.7.1.By Country
15.7.2.By Type
15.7.3.By Configuration
15.7.4.By Organization Size
15.7.5.By End Users
16.Latin America Dark Fiber Network Market Analysis and Forecasts, 2023 – 2031
16.1.Overview
16.1.1.Latin America Dark Fiber Network Market Revenue (US$ Mn)
16.2.Latin America Dark Fiber Network Market Revenue (US$ Mn) and Forecasts, By Type
16.2.1.Metro
16.2.2.Long haul
16.3.Latin America Dark Fiber Network Market Revenue (US$ Mn) and Forecasts, By Configuration
16.3.1.Point to point
16.3.2.Ring
16.4.Latin America Dark Fiber Network Market Revenue (US$ Mn) and Forecasts, By Organization Size
16.4.1.Small and Medium Size Organizations
16.4.2. Large Organizations
16.5.Latin America Dark Fiber Network Market Revenue (US$ Mn) and Forecasts, By End Users
16.5.1.IT and Telecommunication
16.5.2.Government
16.5.3.School
16.5.4.Hotels and Hospitality
16.5.5.Financial Institutions
16.5.6.E-commerce and retail
16.5.7.Manufacturing
16.5.8.Logistics
16.5.9.Others
16.6.Latin America Dark Fiber Network Market Revenue (US$ Mn) and Forecasts, By Country
16.6.1.Brazil
16.6.1.1.Brazil Dark Fiber Network Market Revenue (US$ Mn) and Forecasts, By Type
16.6.1.1.1.Metro
16.6.1.1.2.Long haul
16.6.1.2.Brazil Dark Fiber Network Market Revenue (US$ Mn) and Forecasts, By Configuration
16.6.1.2.1.Point to point
16.6.1.2.2.Ring
16.6.1.3.Brazil Dark Fiber Network Market Revenue (US$ Mn) and Forecasts, By Organization Size
16.6.1.3.1.Small and Medium Size Organizations
16.6.1.3.2. Large Organizations
16.6.1.4.Brazil Dark Fiber Network Market Revenue (US$ Mn) and Forecasts, By End Users
16.6.1.4.1.IT and Telecommunication
16.6.1.4.2.Government
16.6.1.4.3.School
16.6.1.4.4.Hotels and Hospitality
16.6.1.4.5.Financial Institutions
16.6.1.4.6.E-commerce and retail
16.6.1.4.7.Manufacturing
16.6.1.4.8.Logistics
16.6.1.4.9.Others
16.6.2.Argentina
16.6.2.1.Argentina Dark Fiber Network Market Revenue (US$ Mn) and Forecasts, By Type
16.6.2.1.1.Metro
16.6.2.1.2.Long haul
16.6.2.2.Argentina Dark Fiber Network Market Revenue (US$ Mn) and Forecasts, By Configuration
16.6.2.2.1.Point to point
16.6.2.2.2.Ring
16.6.2.3.Argentina Dark Fiber Network Market Revenue (US$ Mn) and Forecasts, By Organization Size
16.6.2.3.1.Small and Medium Size Organizations
16.6.2.3.2. Large Organizations
16.6.2.4.Argentina Dark Fiber Network Market Revenue (US$ Mn) and Forecasts, By End Users
16.6.2.4.1.IT and Telecommunication
16.6.2.4.2.Government
16.6.2.4.3.School
16.6.2.4.4.Hotels and Hospitality
16.6.2.4.5.Financial Institutions
16.6.2.4.6.E-commerce and retail
16.6.2.4.7.Manufacturing
16.6.2.4.8.Logistics
16.6.2.4.9.Others
16.6.3.Rest of Latin America
16.6.3.1.Rest of Latin America Dark Fiber Network Market Revenue (US$ Mn) and Forecasts, By Type
16.6.3.1.1.Metro
16.6.3.1.2.Long haul
16.6.3.2.Rest of Latin America Dark Fiber Network Market Revenue (US$ Mn) and Forecasts, By Configuration
16.6.3.2.1.Point to point
16.6.3.2.2.Ring
16.6.3.3.Rest of Latin America Dark Fiber Network Market Revenue (US$ Mn) and Forecasts, By Organization Size
16.6.3.3.1.Small and Medium Size Organizations
16.6.3.3.2. Large Organizations
16.6.3.4.Rest of Latin America Dark Fiber Network Market Revenue (US$ Mn) and Forecasts, By End Users
16.6.3.4.1.IT and Telecommunication
16.6.3.4.2.Government
16.6.3.4.3.School
16.6.3.4.4.Hotels and Hospitality
16.6.3.4.5.Financial Institutions
16.6.3.4.6.E-commerce and retail
16.6.3.4.7.Manufacturing
16.6.3.4.8.Logistics
16.6.3.4.9.Others
16.7.Key Segment for Channeling Investments
16.7.1.By Country
16.7.2.By Type
16.7.3.By Configuration
16.7.4.By Organization Size
16.7.5.By End Users
17.Competitive Benchmarking
17.1.Market Share Analysis, 2022
17.2.Global Presence and Growth Strategies
17.2.1.Mergers and Acquisitions
17.2.2.Product Launches
17.2.3.Investments Trends
17.2.4.R&D Initiatives
18.Player Profiles
18.1.Airtel India.
18.1.1.Company Details
18.1.2.Company Overview
18.1.3.Product Offerings
18.1.4.Key Developments
18.1.5.Financial Analysis
18.1.6.SWOT Analysis
18.1.7.Business Strategies
18.2.AT&T
18.2.1.Company Details
18.2.2.Company Overview
18.2.3.Product Offerings
18.2.4.Key Developments
18.2.5.Financial Analysis
18.2.6.SWOT Analysis
18.2.7.Business Strategies
18.3.Bandwidth IG.
18.3.1.Company Details
18.3.2.Company Overview
18.3.3.Product Offerings
18.3.4.Key Developments
18.3.5.Financial Analysis
18.3.6.SWOT Analysis
18.3.7.Business Strategies
18.4.Colt Technology Services Group Limited
18.4.1.Company Details
18.4.2.Company Overview
18.4.3.Product Offerings
18.4.4.Key Developments
18.4.5.Financial Analysis
18.4.6.SWOT Analysis
18.4.7.Business Strategies
18.5.Crown Castle
18.5.1.Company Details
18.5.2.Company Overview
18.5.3.Product Offerings
18.5.4.Key Developments
18.5.5.Financial Analysis
18.5.6.SWOT Analysis
18.5.7.Business Strategies
18.6.Dobson Fiber.
18.6.1.Company Details
18.6.2.Company Overview
18.6.3.Product Offerings
18.6.4.Key Developments
18.6.5.Financial Analysis
18.6.6.SWOT Analysis
18.6.7.Business Strategies
18.7.euNetworks Group Limited
18.7.1.Company Details
18.7.2.Company Overview
18.7.3.Product Offerings
18.7.4.Key Developments
18.7.5.Financial Analysis
18.7.6.SWOT Analysis
18.7.7.Business Strategies
18.8.EXA Infrastructure
18.8.1.Company Details
18.8.2.Company Overview
18.8.3.Product Offerings
18.8.4.Key Developments
18.8.5.Financial Analysis
18.8.6.SWOT Analysis
18.8.7.Business Strategies
18.9.GAS&COM AG
18.9.1.Company Details
18.9.2.Company Overview
18.9.3.Product Offerings
18.9.4.Key Developments
18.9.5.Financial Analysis
18.9.6.SWOT Analysis
18.9.7.Business Strategies
18.10.Lumen Technologies
18.10.1.Company Details
18.10.2.Company Overview
18.10.3.Product Offerings
18.10.4.Key Developments
18.10.5.Financial Analysis
18.10.6.SWOT Analysis
18.10.7.Business Strategies
18.11.Neos Networks
18.11.1.Company Details
18.11.2.Company Overview
18.11.3.Product Offerings
18.11.4.Key Developments
18.11.5.Financial Analysis
18.11.6.SWOT Analysis
18.11.7.Business Strategies
18.12.Telecom Italia Sparkle S.p.A.
18.12.1.Company Details
18.12.2.Company Overview
18.12.3.Product Offerings
18.12.4.Key Developments
18.12.5.Financial Analysis
18.12.6.SWOT Analysis
18.12.7.Business Strategies
18.13.UFINET
18.13.1.Company Details
18.13.2.Company Overview
18.13.3.Product Offerings
18.13.4.Key Developments
18.13.5.Financial Analysis
18.13.6.SWOT Analysis
18.13.7.Business Strategies
18.14.Verizon Partner Solutions
18.14.1.Company Details
18.14.2.Company Overview
18.14.3.Product Offerings
18.14.4.Key Developments
18.14.5.Financial Analysis
18.14.6.SWOT Analysis
18.14.7.Business Strategies
18.15.Zayo Group, LLC.
18.15.1.Company Details
18.15.2.Company Overview
18.15.3.Product Offerings
18.15.4.Key Developments
18.15.5.Financial Analysis
18.15.6.SWOT Analysis
18.15.7.Business Strategies
18.16.Other market participants
19.Key Findings

.

Note: This ToC is tentative and can be changed according to the research study conducted during the course of report completion.

.

**Exclusive for Multi-User and Enterprise User.

.

Global Dark Fiber Network Market Segmentation

By Type

 Metro
 Long haul

By Configuration

 Point to point
 Ring

By Organization Size

 Small and Medium Size Organizations
 Large Organizations

By End Users

 IT and Telecommunication
 Government
 School
 Hotels and Hospitality
 Financial Institutions
 E-commerce and retail
 Manufacturing
 Logistics
 Others

By Region

 North America (U.S., Canada, Mexico, Rest of North America)
 Europe (France, The UK, Spain, Germany, Italy, Nordic Countries (Denmark, Finland, Iceland, Sweden, Norway), Benelux Union (Belgium, The Netherlands, Luxembourg), Rest of Europe)
 Asia Pacific (China, Japan, India, New Zealand, Australia, South Korea, Southeast Asia (Indonesia, Thailand, Malaysia, Singapore, Rest of Southeast Asia), Rest of Asia Pacific)
 Middle East & Africa (Saudi Arabia, UAE, Egypt, Kuwait, South Africa, Rest of Middle East & Africa)
 Latin America (Brazil, Argentina, Rest of Latin America)

**Note: The report covers cross-segmentation analysis by region further into countries

.

The Niche Research approach encompasses both primary and secondary research methods to provide comprehensive insights. While primary research is the cornerstone of our studies, we also incorporate secondary research sources such as company annual reports, premium industry databases, press releases, industry journals, and white papers. Within our primary research, we actively engage with various industry stakeholders, conducting paid interviews and surveys. Our meticulous analysis extends to every market participant in major countries, allowing us to thoroughly examine their portfolios, calculate market shares, and segment revenues. Our data collection primarily focuses on individual countries within our research scope, enabling us to estimate regional market sizes. Typically, we employ a bottom-up approach, meticulously tracking trends in different countries. We analyze growth drivers, constraints, technological innovations, and opportunities for each country, ultimately arriving at regional figures.Our process begins by examining the growth prospects of each country. Building upon these insights, we project growth and trends for the entire region. Finally, we utilize our proprietary model to refine estimations and forecasts. Our data validation standards are integral to ensuring the reliability and accuracy of our research findings. Here's a breakdown of our data validation processes and the stakeholders we engage with during our primary research:
  • Supply Side Analysis: We initiate a supply side analysis by directly contacting market participants, through telephonic interviews and questionnaires containing both open-ended and close-ended questions. We gather information on their portfolios, segment revenues, developments, and growth strategies.
  • Demand Side Analysis: To gain insights into adoption trends and consumer preferences, we reach out to target customers and users (non-vendors). This information forms a vital part of the qualitative analysis section of our reports, covering market dynamics, adoption trends, consumer behavior, spending patterns, and other related aspects.
  • Consultant Insights: We tap into the expertise of our partner consultants from around the world to obtain their unique viewpoints and perspectives. Their insights contribute to a well-rounded understanding of the markets under investigation.
  • In-House Validation: To ensure data accuracy and reliability, we conduct cross-validation of data points and information through our in-house team of consultants and utilize advanced data modeling tools for thorough verification.
The forecasts we provide are based on a comprehensive assessment of various factors, including:
  • Market Trends and Past Performance (Last Five Years): We accurately analyze market trends and performance data from preceding five years to identify historical patterns and understand the market's evolution.
  • Historical Performance and Growth of Market Participants: We assess the historical performance and growth trajectories of key market participants. This analysis provides insights into the competitive landscape and individual company strategies.
  • Market Determinants Impact Analysis (Next Eight Years): We conduct a rigorous analysis of the factors that are projected to influence the market over the next eight years. This includes assessing both internal and external determinants that can shape market dynamics.
  • Drivers and Challenges for the Forecast Period:Identify the factors expected to drive market growth during the forecast period, as well as the challenges that the industry may face. This analysis aids in deriving an accurate growth rate projection.
  • New Acquisitions, Collaborations, or Partnerships: We keep a close watch on any new acquisitions, collaborations, or partnerships within the industry. These developments can have a significant impact on market dynamics and competitiveness.
  • Macro and Micro Factors Analysis:A thorough examination of both macro-level factors (e.g., economic trends, regulatory changes) and micro-level factors (e.g., technological advancements, consumer preferences) that may influence the market during the forecast period.
  • End-User Sentiment Analysis: To understand the market from the end-user perspective, we conduct sentiment analysis. This involves assessing the sentiment, preferences, and feedback of the end-users, which can provide valuable insights into market trends.
  • Perspective of Primary Participants: Insights gathered directly from primary research participants play a crucial role in shaping our forecasts. Their perspectives and experiences provide valuable qualitative data.
  • Year-on-Year Growth Trend: We utilize a year-on-year growth trend based on historical market growth and expected future trends. This helps in formulating our growth projections, aligning them with the market's historical performance.
Research process adopted by TNR involves multiple stages, including data collection, validation, quality checks, and presentation. It's crucial that the data and information we provide add value to your existing market understanding and expertise. We have also established partnerships with business consulting, research, and survey organizations across regions and globally to collaborate on regional analysis and data validation, ensuring the highest level of accuracy and reliability in our reports.    

Procure Comprehensive Study of

Global Dark Fiber Network Market

Online Only

  • Online Access
  • Read Only File
  • Validity 3 Months
  • Print, Copy, Paste & Download
  • PPT, Excel
  • Cost-Free Report in the Next Update
$3300
Buy Now

Single User

  • Access to One User on One System
  • Read Only File
  • Validity 6 Months
  • Limited Print,Copy, Paste
  • PPT, Excel
  • Cost-Free Report in the Next Update
$4200
Buy Now

Multi User

  • Access to Fiver Users
  • PDF File
  • Validity 1 Year
  • Upto FivePrints
  • Cost-Free Report in the Next Update
  • PPT, Excel
$6000
Buy Now

Enterprise User

  • Access to Unlimited Users
  • PDF, PPT, Excel
  • Unlimited Validity, Prints&Downloads
  • 1 Hour Cost-Free & Dedicated Analyst Support
  • 10% Cost-Free Customization
  • Cost-Free Report Update Twice in a Year
  • Recommendations for Business Strategies
  • Authorization to Quote TNR, The Niche Research
$7300
Buy Now

Library Access

  • Online Access to Content Publications
  • Access Player Profiles Online
  • Get Immediate Access to Newly Added Content
  • Acquire 12 PDF Downloads
  • Acquire 5 Excel Data Sets
  • Gain Access to 290+ PDFs of Company Profiles
  • Round-the-clock Email and Phone Assistance
  • Dashboard Usage and Trends
  • Renewal & Upgrade Assistance
  • Assessing Customization Options and Alerts for New Reports
$10788
Buy Now
*Taxes/Fees, if applicable will be added during checkout. All prices in USD

Why TNR The Niche Research?

  • Unwavering Commitment to Excellence

  • Veteran Team of Researchers

  • Accurate and Timely Insights

  • Ethical Practices and Customized Service

  • Uninterrupted Availability Around the Clock

Scroll to Top