Global Device as a Service Market By Offering, By Device Type, By Organization Size, By End User, By Region: Global Insights, Trends and Forecast, 2023 – 2031

  • Industry: Technology
  • Report ID: TNR-110-928
  • Number of Pages: 420
  • Table/Charts : Yes
  • November, 2023
  • Base Year : 2024
  • No. of Companies : 9+
  • No. of Countries : 29
  • Views : 10179
  • Covid Impact Covered: Yes
  • War Impact Covered: Yes
  • Formats : PDF, Excel, PPT

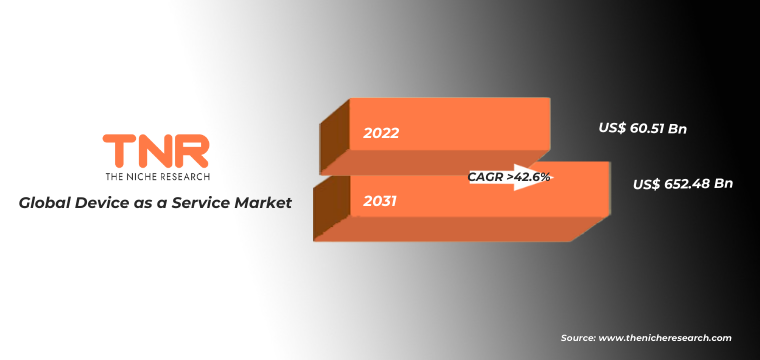
Global Device as a Service Market was Valued at US$ 60.51 Billion in 2022, Growing at an Estimated CAGR of 42.6% from 2023-2031.

Device as a Service is a subscription-based model where businesses or individuals lease hardware devices, such as computers or smartphones, along with associated services like maintenance, upgrades, and support, rather than purchasing them outright. Device as a Service offers cost-efficiency, flexibility, and simplified device management, making it a popular choice for modern tech solutions.

The services segment within the device as a service market is currently dominating, with a significant share of the market. This is primarily because Device as a Service is not just about providing hardware and software but also includes services such as device setup, maintenance, tech support, and end-of-life disposal. These services add substantial value to Device as a Service offerings, making it an attractive choice for businesses looking to offload device management responsibilities. Companies prefer comprehensive Device as a Service solutions that encompass these services.

Global Device as a Service Market Revenue & Forecast, (US$ Million), 2015 – 2031

COVID-19 Impact Analysis on Global Device as a Service Market

Pre-COVID-19, the device as a service market was steadily growing, driven by cost-efficiency and scalable device solutions. Post-COVID-19, remote work’s surge accelerated Device as a Service adoption, highlighting its role in ensuring remote-ready devices. Device as a Service continues to expand, playing a pivotal role in accessible and efficient device management in the post-pandemic era.

Report Coverage and Deliverables

One key driver for the device as a service market is the surging demand for remote work solutions, notably due to the COVID-19 pandemic. This study found that over 85% of organizations worldwide encouraged or required their employees to work from home during the pandemic. This necessitated accessible, remote-ready devices, which Device as a Service providers offer. This demand is expected to persist even in the post-pandemic era, driving the growth of Device as a Service solutions as businesses seek flexible, manageable, and secure device options to support remote workforces.

A significant restraint in the device as a service market is data security concerns. A survey by Cybersecurity Insiders revealed that 61% of organizations listed data security as their top concern when adopting device as a service solutions. Entrusting sensitive data and applications to third-party providers raises apprehensions about data breaches and unauthorized access. To overcome this restraint, Device as a Service providers must invest heavily in robust security measures, compliance certifications, and transparent data handling practices to gain and maintain the trust of their clients.

Smartphones held a significant share in the device as a service market in 2022 due to their ubiquitous use in both personal and professional contexts. According to the study, in 2022, there were nearly 4 billion smartphone users worldwide. The demand for Device as a Service for smartphones was driven by businesses equipping their workforce with mobile devices for remote work and productivity, contributing to its dominance.

North America recorded for highest market share in the global device as a service market in 2022. This was driven by the region’s advanced technological infrastructure, a large number of enterprises, and a strong emphasis on digital transformation. According to a survey by CompTIA, in 2020, 63% of US organizations reported increased spending on remote work solutions, including Device as a Service. This indicated a robust demand for Device as a Service services, solidifying North America’s leadership.

Competitive Landscape

A few of the key players operating in the global device as a service market are

  • Atea Global Services Ltd.
  • CHG-MERIDIAN
  • Cisco Systems, Inc.
  • CompuCom Systems, Inc.
  • Computacenter plc
  • CSI Leasing, Inc.
  • Dell Inc.
  • Econocom
  • HP Development Company, L.P.
  • Lenovo
  • Microsoft
  • Telia Company AB
  • Other Industry Participants

Report Summary of Global Device as a Service Market

Report Specifications Details
Market Revenue in 2022 US$ 60.51 Billion
Market Size Forecast by 2031 US$ 652.48 Billion
Growth Rate (CAGR) 42.6 %
Historic Data 2015 – 2021
Base Year for Estimation 2022
Forecast Period 2023 – 2031
Report Inclusions Market Size & Estimates, Market Dynamics, Competitive Scenario, Trends, Growth Factors, Market Determinants, Key Investment Segmentation, Product/Service/Solutions Benchmarking
Segments Covered By Offering, By Device Type, By Organization Size, By End User
Regions Covered North America, Europe, Asia Pacific, Middle East & Africa, Latin America
Countries Covered U.S., Canada, Mexico, Rest of North America,  France, The UK, Spain, Germany, Italy, Nordic Countries (Denmark, Finland, Iceland, Sweden, Norway), Benelux Union (Belgium, The Netherlands, Luxembourg), Rest of Europe,  China, Japan, India, New Zealand, Australia, South Korea, Southeast Asia (Indonesia, Thailand, Malaysia, Singapore, Rest of Southeast Asia), Rest of Asia Pacific,  Saudi Arabia, UAE, Egypt, Kuwait, South Africa, Rest of Middle East & Africa,  Brazil, Argentina, Rest of Latin America
Key Players Atea Global Services Ltd., CHG-MERIDIAN, Cisco Systems, Inc., CompuCom Systems, Inc., Computacenter plc, CSI Leasing, Inc., Dell Inc., Econocom, HP Development Company, L.P., Lenovo, Microsoft, Telia Company AB, Other Industry Participants
Customization Scope Customization allows for the inclusion/modification of content pertaining to geographical regions, countries, and specific market segments.
Pricing & Procurement Options Explore purchase options tailored to your specific research requirements
Contact Details Consult With Our Expert

Japan (Toll-Free): – +81 663-386-8111

South Korea (Toll-Free): – +82-808- 703-126

Saudi Arabia (Toll-Free): – +966 800 850 1643

United States: +1 302-232-5106

United Kingdom: +447537105080

E-mail:  askanexpert@thenicheresearch.com


Global Device as a Service Market:

By Offering

  • Hardware
  • Software
  • Services

By Device Type

  • Desktops
  • Smartphones and Peripherals
  • Laptop, Notebook and Tablet

By Organization Size

  • Small and Medium-Sized Enterprises
  • Large Enterprises

By End User

  • IT & Telecommunications
  • Healthcare & Life Sciences
  • Educational Institutions
  • Banking, Financial Services and Insurance (BFSI)
  • Public Sector and Government Offices
  • Others

By Region

  • North America (U.S., Canada, Mexico, Rest of North America)
  • Europe (France, The UK, Spain, Germany, Italy, Nordic Countries (Denmark, Finland, Iceland, Sweden, Norway), Benelux Union (Belgium, The Netherlands, Luxembourg), Rest of Europe)
  • Asia Pacific (China, Japan, India, New Zealand, Australia, South Korea, Southeast Asia (Indonesia, Thailand, Malaysia, Singapore, Rest of Southeast Asia), Rest of Asia Pacific)
  • Middle East & Africa (Saudi Arabia, UAE, Egypt, Kuwait, South Africa, Rest of Middle East & Africa)
  • Latin America (Brazil, Argentina, Rest of Latin America)

Table of Contents

.

1.Market Scope
1.1.Market Segmentation
1.2.Years Considered
1.2.1.Historic Years: 2015 – 2021
1.2.2.Base Year: 2022
1.2.3.Forecast Years: 2023 – 2031
2.Key Target Audiences
3.Research Methodology
3.1.Primary Research
3.1.1.Research Questionnaire
3.1.2.Global Percentage Breakdown
3.1.3.Primary Interviews: Key Opinion Leaders (KOLs)
3.2.Secondary Research
3.2.1.Paid Databases
3.2.2.Secondary Sources
3.3.Market Size Estimates
3.3.1.Top-Down Approach
3.3.2.Bottom-Up Approach
3.4.Data Triangulation Methodology
3.5.Research Assumptions
4.Recommendations and Insights from TNR’s Perspective**
5.Holistic Overview of Device as a Service Market
6.Market Synopsis: Device as a Service Market
7.Device as a Service Market Analysis: Qualitative Perspective
7.1.Introduction
7.1.1.Product Definition
7.1.2.Industry Development
7.2.Market Dynamics
7.2.1.Drivers
7.2.2.Restraints
7.2.3.Opportunities
7.2.4.Challenges
7.3.Trends in Device as a Service Market
7.4.Market Determinants Radar Chart
7.5.Macro-Economic and Micro-Economic Indicators: Device as a Service Market
7.6.Porter’s Five Force Analysis
7.7.Impact of Covid-19 on Device as a Service Market
7.8.PESTEL Analysis
8.Global Device as a Service Market Analysis and Forecasts, 2023 – 2031
8.1.Overview
8.1.1.Global Device as a Service Market Revenue (US$ Mn)
8.2.Global Device as a Service Market Revenue (US$ Mn) and Forecasts, By Offering
8.2.1.Hardware
8.2.1.1.Definition
8.2.1.2.Market Estimation and Penetration, 2015 – 2022
8.2.1.3.Market Forecast, 2023 – 2031
8.2.1.4.Compound Annual Growth Rate (CAGR)
8.2.1.5.Regional Bifurcation
8.2.1.5.1.North America
8.2.1.5.1.1.Market Estimation, 2015 – 2022
8.2.1.5.1.2.Market Forecast, 2023 – 2031
8.2.1.5.2.Europe
8.2.1.5.2.1.Market Estimation, 2015 – 2022
8.2.1.5.2.2.Market Forecast, 2023 – 2031
8.2.1.5.3.Asia Pacific
8.2.1.5.3.1.Market Estimation, 2015 – 2022
8.2.1.5.3.2.Market Forecast, 2023 – 2031
8.2.1.5.4.Middle East and Africa
8.2.1.5.4.1.Market Estimation, 2015 – 2022
8.2.1.5.4.2.Market Forecast, 2023 – 2031
8.2.1.5.5.Latin America
8.2.1.5.5.1.Market Estimation, 2015 – 2022
8.2.1.5.5.2.Market Forecast, 2023 – 2031
8.2.2.Software
8.2.2.1.Definition
8.2.2.2.Market Estimation and Penetration, 2015 – 2022
8.2.2.3.Market Forecast, 2023 – 2031
8.2.2.4.Compound Annual Growth Rate (CAGR)
8.2.2.5.Regional Bifurcation
8.2.2.5.1.North America
8.2.2.5.1.1.Market Estimation, 2015 – 2022
8.2.2.5.1.2.Market Forecast, 2023 – 2031
8.2.2.5.2.Europe
8.2.2.5.2.1.Market Estimation, 2015 – 2022
8.2.2.5.2.2.Market Forecast, 2023 – 2031
8.2.2.5.3.Asia Pacific
8.2.2.5.3.1.Market Estimation, 2015 – 2022
8.2.2.5.3.2.Market Forecast, 2023 – 2031
8.2.2.5.4.Middle East and Africa
8.2.2.5.4.1.Market Estimation, 2015 – 2022
8.2.2.5.4.2.Market Forecast, 2023 – 2031
8.2.2.5.5.Latin America
8.2.2.5.5.1.Market Estimation, 2015 – 2022
8.2.2.5.5.2.Market Forecast, 2023 – 2031
8.2.3.Services
8.2.3.1.Definition
8.2.3.2.Market Estimation and Penetration, 2015 – 2022
8.2.3.3.Market Forecast, 2023 – 2031
8.2.3.4.Compound Annual Growth Rate (CAGR)
8.2.3.5.Regional Bifurcation
8.2.3.5.1.North America
8.2.3.5.1.1.Market Estimation, 2015 – 2022
8.2.3.5.1.2.Market Forecast, 2023 – 2031
8.2.3.5.2.Europe
8.2.3.5.2.1.Market Estimation, 2015 – 2022
8.2.3.5.2.2.Market Forecast, 2023 – 2031
8.2.3.5.3.Asia Pacific
8.2.3.5.3.1.Market Estimation, 2015 – 2022
8.2.3.5.3.2.Market Forecast, 2023 – 2031
8.2.3.5.4.Middle East and Africa
8.2.3.5.4.1.Market Estimation, 2015 – 2022
8.2.3.5.4.2.Market Forecast, 2023 – 2031
8.2.3.5.5.Latin America
8.2.3.5.5.1.Market Estimation, 2015 – 2022
8.2.3.5.5.2.Market Forecast, 2023 – 2031
8.3.Key Segment for Channeling Investments
8.3.1.By Offering
9.Global Device as a Service Market Analysis and Forecasts, 2023 – 2031
9.1.Overview
9.2.Global Device as a Service Market Revenue (US$ Mn) and Forecasts, By Device Type
9.2.1.Desktops
9.2.1.1.Definition
9.2.1.2.Market Estimation and Penetration, 2015 – 2022
9.2.1.3.Market Forecast, 2023 – 2031
9.2.1.4.Compound Annual Growth Rate (CAGR)
9.2.1.5.Regional Bifurcation
9.2.1.5.1.North America
9.2.1.5.1.1.Market Estimation, 2015 – 2022
9.2.1.5.1.2.Market Forecast, 2023 – 2031
9.2.1.5.2.Europe
9.2.1.5.2.1.Market Estimation, 2015 – 2022
9.2.1.5.2.2.Market Forecast, 2023 – 2031
9.2.1.5.3.Asia Pacific
9.2.1.5.3.1.Market Estimation, 2015 – 2022
9.2.1.5.3.2.Market Forecast, 2023 – 2031
9.2.1.5.4.Middle East and Africa
9.2.1.5.4.1.Market Estimation, 2015 – 2022
9.2.1.5.4.2.Market Forecast, 2023 – 2031
9.2.1.5.5.Latin America
9.2.1.5.5.1.Market Estimation, 2015 – 2022
9.2.1.5.5.2.Market Forecast, 2023 – 2031
9.2.2.Smartphones and Peripherals
9.2.2.1.Definition
9.2.2.2.Market Estimation and Penetration, 2015 – 2022
9.2.2.3.Market Forecast, 2023 – 2031
9.2.2.4.Compound Annual Growth Rate (CAGR)
9.2.2.5.Regional Bifurcation
9.2.2.5.1.North America
9.2.2.5.1.1.Market Estimation, 2015 – 2022
9.2.2.5.1.2.Market Forecast, 2023 – 2031
9.2.2.5.2.Europe
9.2.2.5.2.1.Market Estimation, 2015 – 2022
9.2.2.5.2.2.Market Forecast, 2023 – 2031
9.2.2.5.3.Asia Pacific
9.2.2.5.3.1.Market Estimation, 2015 – 2022
9.2.2.5.3.2.Market Forecast, 2023 – 2031
9.2.2.5.4.Middle East and Africa
9.2.2.5.4.1.Market Estimation, 2015 – 2022
9.2.2.5.4.2.Market Forecast, 2023 – 2031
9.2.2.5.5.Latin America
9.2.2.5.5.1.Market Estimation, 2015 – 2022
9.2.2.5.5.2.Market Forecast, 2023 – 2031
9.2.3.Laptop, Notebook and Tablet
9.2.3.1.Definition
9.2.3.2.Market Estimation and Penetration, 2015 – 2022
9.2.3.3.Market Forecast, 2023 – 2031
9.2.3.4.Compound Annual Growth Rate (CAGR)
9.2.3.5.Regional Bifurcation
9.2.3.5.1.North America
9.2.3.5.1.1.Market Estimation, 2015 – 2022
9.2.3.5.1.2.Market Forecast, 2023 – 2031
9.2.3.5.2.Europe
9.2.3.5.2.1.Market Estimation, 2015 – 2022
9.2.3.5.2.2.Market Forecast, 2023 – 2031
9.2.3.5.3.Asia Pacific
9.2.3.5.3.1.Market Estimation, 2015 – 2022
9.2.3.5.3.2.Market Forecast, 2023 – 2031
9.2.3.5.4.Middle East and Africa
9.2.3.5.4.1.Market Estimation, 2015 – 2022
9.2.3.5.4.2.Market Forecast, 2023 – 2031
9.2.3.5.5.Latin America
9.2.3.5.5.1.Market Estimation, 2015 – 2022
9.2.3.5.5.2.Market Forecast, 2023 – 2031
9.3.Key Segment for Channeling Investments
9.3.1.By Device Type
10.Global Device as a Service Market Analysis and Forecasts, 2023 – 2031
10.1.Overview
10.2.Global Device as a Service Market Revenue (US$ Mn) and Forecasts, By Organization Size
10.2.1.Small and Medium-Sized Enterprises
10.2.1.1.Definition
10.2.1.2.Market Estimation and Penetration, 2015 – 2022
10.2.1.3.Market Forecast, 2023 – 2031
10.2.1.4.Compound Annual Growth Rate (CAGR)
10.2.1.5.Regional Bifurcation
10.2.1.5.1.North America
10.2.1.5.1.1.Market Estimation, 2015 – 2022
10.2.1.5.1.2.Market Forecast, 2023 – 2031
10.2.1.5.2.Europe
10.2.1.5.2.1.Market Estimation, 2015 – 2022
10.2.1.5.2.2.Market Forecast, 2023 – 2031
10.2.1.5.3.Asia Pacific
10.2.1.5.3.1.Market Estimation, 2015 – 2022
10.2.1.5.3.2.Market Forecast, 2023 – 2031
10.2.1.5.4.Middle East and Africa
10.2.1.5.4.1.Market Estimation, 2015 – 2022
10.2.1.5.4.2.Market Forecast, 2023 – 2031
10.2.1.5.5.Latin America
10.2.1.5.5.1.Market Estimation, 2015 – 2022
10.2.1.5.5.2.Market Forecast, 2023 – 2031
10.2.2.Large Enterprises
10.2.2.1.Definition
10.2.2.2.Market Estimation and Penetration, 2015 – 2022
10.2.2.3.Market Forecast, 2023 – 2031
10.2.2.4.Compound Annual Growth Rate (CAGR)
10.2.2.5.Regional Bifurcation
10.2.2.5.1.North America
10.2.2.5.1.1.Market Estimation, 2015 – 2022
10.2.2.5.1.2.Market Forecast, 2023 – 2031
10.2.2.5.2.Europe
10.2.2.5.2.1.Market Estimation, 2015 – 2022
10.2.2.5.2.2.Market Forecast, 2023 – 2031
10.2.2.5.3.Asia Pacific
10.2.2.5.3.1.Market Estimation, 2015 – 2022
10.2.2.5.3.2.Market Forecast, 2023 – 2031
10.2.2.5.4.Middle East and Africa
10.2.2.5.4.1.Market Estimation, 2015 – 2022
10.2.2.5.4.2.Market Forecast, 2023 – 2031
10.2.2.5.5.Latin America
10.2.2.5.5.1.Market Estimation, 2015 – 2022
10.2.2.5.5.2.Market Forecast, 2023 – 2031
10.3.Key Segment for Channeling Investments
10.3.1.By Organization Size
11.Global Device as a Service Market Analysis and Forecasts, 2023 – 2031
11.1.Overview
11.2.Global Device as a Service Market Revenue (US$ Mn) and Forecasts, By End User
11.2.1.IT and Telecommunications
11.2.1.1.Definition
11.2.1.2.Market Estimation and Penetration, 2015 – 2022
11.2.1.3.Market Forecast, 2023 – 2031
11.2.1.4.Compound Annual Growth Rate (CAGR)
11.2.1.5.Regional Bifurcation
11.2.1.5.1.North America
11.2.1.5.1.1.Market Estimation, 2015 – 2022
11.2.1.5.1.2.Market Forecast, 2023 – 2031
11.2.1.5.2.Europe
11.2.1.5.2.1.Market Estimation, 2015 – 2022
11.2.1.5.2.2.Market Forecast, 2023 – 2031
11.2.1.5.3.Asia Pacific
11.2.1.5.3.1.Market Estimation, 2015 – 2022
11.2.1.5.3.2.Market Forecast, 2023 – 2031
11.2.1.5.4.Middle East and Africa
11.2.1.5.4.1.Market Estimation, 2015 – 2022
11.2.1.5.4.2.Market Forecast, 2023 – 2031
11.2.1.5.5.Latin America
11.2.1.5.5.1.Market Estimation, 2015 – 2022
11.2.1.5.5.2.Market Forecast, 2023 – 2031
11.2.2.Healthcare and Life Sciences
11.2.2.1.Definition
11.2.2.2.Market Estimation and Penetration, 2015 – 2022
11.2.2.3.Market Forecast, 2023 – 2031
11.2.2.4.Compound Annual Growth Rate (CAGR)
11.2.2.5.Regional Bifurcation
11.2.2.5.1.North America
11.2.2.5.1.1.Market Estimation, 2015 – 2022
11.2.2.5.1.2.Market Forecast, 2023 – 2031
11.2.2.5.2.Europe
11.2.2.5.2.1.Market Estimation, 2015 – 2022
11.2.2.5.2.2.Market Forecast, 2023 – 2031
11.2.2.5.3.Asia Pacific
11.2.2.5.3.1.Market Estimation, 2015 – 2022
11.2.2.5.3.2.Market Forecast, 2023 – 2031
11.2.2.5.4.Middle East and Africa
11.2.2.5.4.1.Market Estimation, 2015 – 2022
11.2.2.5.4.2.Market Forecast, 2023 – 2031
11.2.2.5.5.Latin America
11.2.2.5.5.1.Market Estimation, 2015 – 2022
11.2.2.5.5.2.Market Forecast, 2023 – 2031
11.2.3.Educational Institutions
11.2.3.1.Definition
11.2.3.2.Market Estimation and Penetration, 2015 – 2022
11.2.3.3.Market Forecast, 2023 – 2031
11.2.3.4.Compound Annual Growth Rate (CAGR)
11.2.3.5.Regional Bifurcation
11.2.3.5.1.North America
11.2.3.5.1.1.Market Estimation, 2015 – 2022
11.2.3.5.1.2.Market Forecast, 2023 – 2031
11.2.3.5.2.Europe
11.2.3.5.2.1.Market Estimation, 2015 – 2022
11.2.3.5.2.2.Market Forecast, 2023 – 2031
11.2.3.5.3.Asia Pacific
11.2.3.5.3.1.Market Estimation, 2015 – 2022
11.2.3.5.3.2.Market Forecast, 2023 – 2031
11.2.3.5.4.Middle East and Africa
11.2.3.5.4.1.Market Estimation, 2015 – 2022
11.2.3.5.4.2.Market Forecast, 2023 – 2031
11.2.3.5.5.Latin America
11.2.3.5.5.1.Market Estimation, 2015 – 2022
11.2.3.5.5.2.Market Forecast, 2023 – 2031
11.2.4.Banking, Financial Services and Insurance (BFSI)
11.2.4.1.Definition
11.2.4.2.Market Estimation and Penetration, 2015 – 2022
11.2.4.3.Market Forecast, 2023 – 2031
11.2.4.4.Compound Annual Growth Rate (CAGR)
11.2.4.5.Regional Bifurcation
11.2.4.5.1.North America
11.2.4.5.1.1.Market Estimation, 2015 – 2022
11.2.4.5.1.2.Market Forecast, 2023 – 2031
11.2.4.5.2.Europe
11.2.4.5.2.1.Market Estimation, 2015 – 2022
11.2.4.5.2.2.Market Forecast, 2023 – 2031
11.2.4.5.3.Asia Pacific
11.2.4.5.3.1.Market Estimation, 2015 – 2022
11.2.4.5.3.2.Market Forecast, 2023 – 2031
11.2.4.5.4.Middle East and Africa
11.2.4.5.4.1.Market Estimation, 2015 – 2022
11.2.4.5.4.2.Market Forecast, 2023 – 2031
11.2.4.5.5.Latin America
11.2.4.5.5.1.Market Estimation, 2015 – 2022
11.2.4.5.5.2.Market Forecast, 2023 – 2031
11.2.5.Public Sector and Government Offices
11.2.5.1.Definition
11.2.5.2.Market Estimation and Penetration, 2015 – 2022
11.2.5.3.Market Forecast, 2023 – 2031
11.2.5.4.Compound Annual Growth Rate (CAGR)
11.2.5.5.Regional Bifurcation
11.2.5.5.1.North America
11.2.5.5.1.1.Market Estimation, 2015 – 2022
11.2.5.5.1.2.Market Forecast, 2023 – 2031
11.2.5.5.2.Europe
11.2.5.5.2.1.Market Estimation, 2015 – 2022
11.2.5.5.2.2.Market Forecast, 2023 – 2031
11.2.5.5.3.Asia Pacific
11.2.5.5.3.1.Market Estimation, 2015 – 2022
11.2.5.5.3.2.Market Forecast, 2023 – 2031
11.2.5.5.4.Middle East and Africa
11.2.5.5.4.1.Market Estimation, 2015 – 2022
11.2.5.5.4.2.Market Forecast, 2023 – 2031
11.2.5.5.5.Latin America
11.2.5.5.5.1.Market Estimation, 2015 – 2022
11.2.5.5.5.2.Market Forecast, 2023 – 2031
11.2.6.Others
11.2.6.1.Definition
11.2.6.2.Market Estimation and Penetration, 2015 – 2022
11.2.6.3.Market Forecast, 2023 – 2031
11.2.6.4.Compound Annual Growth Rate (CAGR)
11.2.6.5.Regional Bifurcation
11.2.6.5.1.North America
11.2.6.5.1.1.Market Estimation, 2015 – 2022
11.2.6.5.1.2.Market Forecast, 2023 – 2031
11.2.6.5.2.Europe
11.2.6.5.2.1.Market Estimation, 2015 – 2022
11.2.6.5.2.2.Market Forecast, 2023 – 2031
11.2.6.5.3.Asia Pacific
11.2.6.5.3.1.Market Estimation, 2015 – 2022
11.2.6.5.3.2.Market Forecast, 2023 – 2031
11.2.6.5.4.Middle East and Africa
11.2.6.5.4.1.Market Estimation, 2015 – 2022
11.2.6.5.4.2.Market Forecast, 2023 – 2031
11.2.6.5.5.Latin America
11.2.6.5.5.1.Market Estimation, 2015 – 2022
11.2.6.5.5.2.Market Forecast, 2023 – 2031
11.3.Key Segment for Channeling Investments
11.3.1.By End User
12.North America Device as a Service Market Analysis and Forecasts, 2023 – 2031
12.1.Overview
12.1.1.North America Device as a Service Market Revenue (US$ Mn)
12.2.North America Device as a Service Market Revenue (US$ Mn) and Forecasts, By Offering
12.2.1.Hardware
12.2.2.Software
12.2.3.Services
12.3.North America Device as a Service Market Revenue (US$ Mn) and Forecasts, By Device Type
12.3.1.Desktops
12.3.2.Smartphones and Peripherals
12.3.3.Laptop, Notebook and Tablet
12.4.North America Device as a Service Market Revenue (US$ Mn) and Forecasts, By Organization Size
12.4.1.Small and Medium-Sized Enterprises
12.4.2.Large Enterprises
12.5.North America Device as a Service Market Revenue (US$ Mn) and Forecasts, By End User
12.5.1.IT and Telecommunications
12.5.2.Healthcare and Life Sciences
12.5.3.Educational Institutions
12.5.4.Banking, Financial Services and Insurance (BFSI)
12.5.5.Public Sector and Government Offices
12.5.6.Others
12.6.North America Device as a Service Market Revenue (US$ Mn) and Forecasts, By Country
12.6.1.U.S
12.6.1.1.U.S Device as a Service Market Revenue (US$ Mn) and Forecasts, By Offering
12.6.1.1.1.Hardware
12.6.1.1.2.Software
12.6.1.1.3.Services
12.6.1.2.U.S Device as a Service Market Revenue (US$ Mn) and Forecasts, By Device Type
12.6.1.2.1.Desktops
12.6.1.2.2.Smartphones and Peripherals
12.6.1.2.3.Laptop, Notebook and Tablet
12.6.1.3.U.S Device as a Service Market Revenue (US$ Mn) and Forecasts, By Organization Size
12.6.1.3.1.Small and Medium-Sized Enterprises
12.6.1.3.2.Large Enterprises
12.6.1.4.U.S Device as a Service Market Revenue (US$ Mn) and Forecasts, By End User
12.6.1.4.1.IT and Telecommunications
12.6.1.4.2.Healthcare and Life Sciences
12.6.1.4.3.Educational Institutions
12.6.1.4.4.Banking, Financial Services and Insurance (BFSI)
12.6.1.4.5.Public Sector and Government Offices
12.6.1.4.6.Others
12.6.2.Canada
12.6.2.1.Canada Device as a Service Market Revenue (US$ Mn) and Forecasts, By Offering
12.6.2.1.1.Hardware
12.6.2.1.2.Software
12.6.2.1.3.Services
12.6.2.2.Canada Device as a Service Market Revenue (US$ Mn) and Forecasts, By Device Type
12.6.2.2.1.Desktops
12.6.2.2.2.Smartphones and Peripherals
12.6.2.2.3.Laptop, Notebook and Tablet
12.6.2.3.Canada Device as a Service Market Revenue (US$ Mn) and Forecasts, By Organization Size
12.6.2.3.1.Small and Medium-Sized Enterprises
12.6.2.3.2.Large Enterprises
12.6.2.4.Canada Device as a Service Market Revenue (US$ Mn) and Forecasts, By End User
12.6.2.4.1.IT and Telecommunications
12.6.2.4.2.Healthcare and Life Sciences
12.6.2.4.3.Educational Institutions
12.6.2.4.4.Banking, Financial Services and Insurance (BFSI)
12.6.2.4.5.Public Sector and Government Offices
12.6.2.4.6.Others
12.6.3.Mexico
12.6.3.1.Mexico Device as a Service Market Revenue (US$ Mn) and Forecasts, By Offering
12.6.3.1.1.Hardware
12.6.3.1.2.Software
12.6.3.1.3.Services
12.6.3.2.Mexico Device as a Service Market Revenue (US$ Mn) and Forecasts, By Device Type
12.6.3.2.1.Desktops
12.6.3.2.2.Smartphones and Peripherals
12.6.3.2.3.Laptop, Notebook and Tablet
12.6.3.3.Mexico Device as a Service Market Revenue (US$ Mn) and Forecasts, By Organization Size
12.6.3.3.1.Small and Medium-Sized Enterprises
12.6.3.3.2.Large Enterprises
12.6.3.4.Mexico Device as a Service Market Revenue (US$ Mn) and Forecasts, By End User
12.6.3.4.1.IT and Telecommunications
12.6.3.4.2.Healthcare and Life Sciences
12.6.3.4.3.Educational Institutions
12.6.3.4.4.Banking, Financial Services and Insurance (BFSI)
12.6.3.4.5.Public Sector and Government Offices
12.6.3.4.6.Others
12.6.4.Rest of North America
12.6.4.1.Rest of North America Device as a Service Market Revenue (US$ Mn) and Forecasts, By Offering
12.6.4.1.1.Hardware
12.6.4.1.2.Software
12.6.4.1.3.Services
12.6.4.2.Rest of North America Device as a Service Market Revenue (US$ Mn) and Forecasts, By Device Type
12.6.4.2.1.Desktops
12.6.4.2.2.Smartphones and Peripherals
12.6.4.2.3.Laptop, Notebook and Tablet
12.6.4.3.Rest of North America Device as a Service Market Revenue (US$ Mn) and Forecasts, By Organization Size
12.6.4.3.1.Small and Medium-Sized Enterprises
12.6.4.3.2.Large Enterprises
12.6.4.4.Rest of North America Device as a Service Market Revenue (US$ Mn) and Forecasts, By End User
12.6.4.4.1.IT and Telecommunications
12.6.4.4.2.Healthcare and Life Sciences
12.6.4.4.3.Educational Institutions
12.6.4.4.4.Banking, Financial Services and Insurance (BFSI)
12.6.4.4.5.Public Sector and Government Offices
12.6.4.4.6.Others
12.7.Key Segment for Channeling Investments
12.7.1.By Country
12.7.2.By Offering
12.7.3.By Device Type
12.7.4.By Organization Size
12.7.5.By End User
13.Europe Device as a Service Market Analysis and Forecasts, 2023 – 2031
13.1.Overview
13.1.1.Europe Device as a Service Market Revenue (US$ Mn)
13.2.Europe Device as a Service Market Revenue (US$ Mn) and Forecasts, By Offering
13.2.1.Hardware
13.2.2.Software
13.2.3.Services
13.3.Europe Device as a Service Market Revenue (US$ Mn) and Forecasts, By Device Type
13.3.1.Desktops
13.3.2.Smartphones and Peripherals
13.3.3.Laptop, Notebook and Tablet
13.4.Europe Device as a Service Market Revenue (US$ Mn) and Forecasts, By Organization Size
13.4.1.Small and Medium-Sized Enterprises
13.4.2.Large Enterprises
13.5.Europe Device as a Service Market Revenue (US$ Mn) and Forecasts, By End User
13.5.1.IT and Telecommunications
13.5.2.Healthcare and Life Sciences
13.5.3.Educational Institutions
13.5.4.Banking, Financial Services and Insurance (BFSI)
13.5.5.Public Sector and Government Offices
13.5.6.Others
13.6.Europe Device as a Service Market Revenue (US$ Mn) and Forecasts, By Country
13.6.1.France
13.6.1.1.France Device as a Service Market Revenue (US$ Mn) and Forecasts, By Offering
13.6.1.1.1.Hardware
13.6.1.1.2.Software
13.6.1.1.3.Services
13.6.1.2.France Device as a Service Market Revenue (US$ Mn) and Forecasts, By Device Type
13.6.1.2.1.Desktops
13.6.1.2.2.Smartphones and Peripherals
13.6.1.2.3.Laptop, Notebook and Tablet
13.6.1.3.France Device as a Service Market Revenue (US$ Mn) and Forecasts, By Organization Size
13.6.1.3.1.Small and Medium-Sized Enterprises
13.6.1.3.2.Large Enterprises
13.6.1.4.France Device as a Service Market Revenue (US$ Mn) and Forecasts, By End User
13.6.1.4.1.IT and Telecommunications
13.6.1.4.2.Healthcare and Life Sciences
13.6.1.4.3.Educational Institutions
13.6.1.4.4.Banking, Financial Services and Insurance (BFSI)
13.6.1.4.5.Public Sector and Government Offices
13.6.1.4.6.Others
13.6.2.The UK
13.6.2.1.The UK Device as a Service Market Revenue (US$ Mn) and Forecasts, By Offering
13.6.2.1.1.Hardware
13.6.2.1.2.Software
13.6.2.1.3.Services
13.6.2.2.The UK Device as a Service Market Revenue (US$ Mn) and Forecasts, By Device Type
13.6.2.2.1.Desktops
13.6.2.2.2.Smartphones and Peripherals
13.6.2.2.3.Laptop, Notebook and Tablet
13.6.2.3.The UK Device as a Service Market Revenue (US$ Mn) and Forecasts, By Organization Size
13.6.2.3.1.Small and Medium-Sized Enterprises
13.6.2.3.2.Large Enterprises
13.6.2.4.The UK Device as a Service Market Revenue (US$ Mn) and Forecasts, By End User
13.6.2.4.1.IT and Telecommunications
13.6.2.4.2.Healthcare and Life Sciences
13.6.2.4.3.Educational Institutions
13.6.2.4.4.Banking, Financial Services and Insurance (BFSI)
13.6.2.4.5.Public Sector and Government Offices
13.6.2.4.6.Others
13.6.3.Spain
13.6.3.1.Spain Device as a Service Market Revenue (US$ Mn) and Forecasts, By Offering
13.6.3.1.1.Hardware
13.6.3.1.2.Software
13.6.3.1.3.Services
13.6.3.2.Spain Device as a Service Market Revenue (US$ Mn) and Forecasts, By Device Type
13.6.3.2.1.Desktops
13.6.3.2.2.Smartphones and Peripherals
13.6.3.2.3.Laptop, Notebook and Tablet
13.6.3.3.Spain Device as a Service Market Revenue (US$ Mn) and Forecasts, By Organization Size
13.6.3.3.1.Small and Medium-Sized Enterprises
13.6.3.3.2.Large Enterprises
13.6.3.4.Spain Device as a Service Market Revenue (US$ Mn) and Forecasts, By End User
13.6.3.4.1.IT and Telecommunications
13.6.3.4.2.Healthcare and Life Sciences
13.6.3.4.3.Educational Institutions
13.6.3.4.4.Banking, Financial Services and Insurance (BFSI)
13.6.3.4.5.Public Sector and Government Offices
13.6.3.4.6.Others
13.6.4.Germany
13.6.4.1.Germany Device as a Service Market Revenue (US$ Mn) and Forecasts, By Offering
13.6.4.1.1.Hardware
13.6.4.1.2.Software
13.6.4.1.3.Services
13.6.4.2.Germany Device as a Service Market Revenue (US$ Mn) and Forecasts, By Device Type
13.6.4.2.1.Desktops
13.6.4.2.2.Smartphones and Peripherals
13.6.4.2.3.Laptop, Notebook and Tablet
13.6.4.3.Germany Device as a Service Market Revenue (US$ Mn) and Forecasts, By Organization Size
13.6.4.3.1.Small and Medium-Sized Enterprises
13.6.4.3.2.Large Enterprises
13.6.4.4.Germany Device as a Service Market Revenue (US$ Mn) and Forecasts, By End User
13.6.4.4.1.IT and Telecommunications
13.6.4.4.2.Healthcare and Life Sciences
13.6.4.4.3.Educational Institutions
13.6.4.4.4.Banking, Financial Services and Insurance (BFSI)
13.6.4.4.5.Public Sector and Government Offices
13.6.4.4.6.Others
13.6.5.Italy
13.6.5.1.Italy Device as a Service Market Revenue (US$ Mn) and Forecasts, By Offering
13.6.5.1.1.Hardware
13.6.5.1.2.Software
13.6.5.1.3.Services
13.6.5.2.Italy Device as a Service Market Revenue (US$ Mn) and Forecasts, By Device Type
13.6.5.2.1.Desktops
13.6.5.2.2.Smartphones and Peripherals
13.6.5.2.3.Laptop, Notebook and Tablet
13.6.5.3.Italy Device as a Service Market Revenue (US$ Mn) and Forecasts, By Organization Size
13.6.5.3.1.Small and Medium-Sized Enterprises
13.6.5.3.2.Large Enterprises
13.6.5.4.Italy Device as a Service Market Revenue (US$ Mn) and Forecasts, By End User
13.6.5.4.1.IT and Telecommunications
13.6.5.4.2.Healthcare and Life Sciences
13.6.5.4.3.Educational Institutions
13.6.5.4.4.Banking, Financial Services and Insurance (BFSI)
13.6.5.4.5.Public Sector and Government Offices
13.6.5.4.6.Others
13.6.6.Nordic Countries
13.6.6.1.Nordic Countries Device as a Service Market Revenue (US$ Mn) and Forecasts, By Offering
13.6.6.1.1.Hardware
13.6.6.1.2.Software
13.6.6.1.3.Services
13.6.6.2.Nordic Countries Device as a Service Market Revenue (US$ Mn) and Forecasts, By Device Type
13.6.6.2.1.Desktops
13.6.6.2.2.Smartphones and Peripherals
13.6.6.2.3.Laptop, Notebook and Tablet
13.6.6.3.Nordic Countries Device as a Service Market Revenue (US$ Mn) and Forecasts, By Organization Size
13.6.6.3.1.Small and Medium-Sized Enterprises
13.6.6.3.2.Large Enterprises
13.6.6.4.Nordic Countries Device as a Service Market Revenue (US$ Mn) and Forecasts, By End User
13.6.6.4.1.IT and Telecommunications
13.6.6.4.2.Healthcare and Life Sciences
13.6.6.4.3.Educational Institutions
13.6.6.4.4.Banking, Financial Services and Insurance (BFSI)
13.6.6.4.5.Public Sector and Government Offices
13.6.6.4.6.Others
13.6.6.5.Nordic Countries Device as a Service Market Revenue (US$ Mn) and Forecasts, By Country
13.6.6.5.1.Denmark
13.6.6.5.2.Finland
13.6.6.5.3.Iceland
13.6.6.5.4.Sweden
13.6.6.5.5.Norway
13.6.7.Benelux Union
13.6.7.1.Benelux Union Device as a Service Market Revenue (US$ Mn) and Forecasts, By Offering
13.6.7.1.1.Hardware
13.6.7.1.2.Software
13.6.7.1.3.Services
13.6.7.2.Benelux Union Device as a Service Market Revenue (US$ Mn) and Forecasts, By Device Type
13.6.7.2.1.Desktops
13.6.7.2.2.Smartphones and Peripherals
13.6.7.2.3.Laptop, Notebook and Tablet
13.6.7.3.Benelux Union Device as a Service Market Revenue (US$ Mn) and Forecasts, By Organization Size
13.6.7.3.1.Small and Medium-Sized Enterprises
13.6.7.3.2.Large Enterprises
13.6.7.4.Benelux Union Device as a Service Market Revenue (US$ Mn) and Forecasts, By End User
13.6.7.4.1.IT and Telecommunications
13.6.7.4.2.Healthcare and Life Sciences
13.6.7.4.3.Educational Institutions
13.6.7.4.4.Banking, Financial Services and Insurance (BFSI)
13.6.7.4.5.Public Sector and Government Offices
13.6.7.4.6.Others
13.6.7.5.Benelux Union Device as a Service Market Revenue (US$ Mn) and Forecasts, By Country
13.6.7.5.1.Belgium
13.6.7.5.2.The Netherlands
13.6.7.5.3.Luxembourg
13.6.8.Rest of Europe
13.6.8.1.Rest of Europe Device as a Service Market Revenue (US$ Mn) and Forecasts, By Offering
13.6.8.1.1.Hardware
13.6.8.1.2.Software
13.6.8.1.3.Services
13.6.8.2.Rest of Europe Device as a Service Market Revenue (US$ Mn) and Forecasts, By Device Type
13.6.8.2.1.Desktops
13.6.8.2.2.Smartphones and Peripherals
13.6.8.2.3.Laptop, Notebook and Tablet
13.6.8.3.Rest of Europe Device as a Service Market Revenue (US$ Mn) and Forecasts, By Organization Size
13.6.8.3.1.Small and Medium-Sized Enterprises
13.6.8.3.2.Large Enterprises
13.6.8.4.Rest of Europe Device as a Service Market Revenue (US$ Mn) and Forecasts, By End User
13.6.8.4.1.IT and Telecommunications
13.6.8.4.2.Healthcare and Life Sciences
13.6.8.4.3.Educational Institutions
13.6.8.4.4.Banking, Financial Services and Insurance (BFSI)
13.6.8.4.5.Public Sector and Government Offices
13.6.8.4.6.Others
13.7.Key Segment for Channeling Investments
13.7.1.By Country
13.7.2.By Offering
13.7.3.By Device Type
13.7.4.By Organization Size
13.7.5.By End User
14.Asia Pacific Device as a Service Market Analysis and Forecasts, 2023 – 2031
14.1.Overview
14.1.1.Asia Pacific Device as a Service Market Revenue (US$ Mn)
14.2.Asia Pacific Device as a Service Market Revenue (US$ Mn) and Forecasts, By Offering
14.2.1.Hardware
14.2.2.Software
14.2.3.Services
14.3.Asia Pacific Device as a Service Market Revenue (US$ Mn) and Forecasts, By Device Type
14.3.1.Desktops
14.3.2.Smartphones and Peripherals
14.3.3.Laptop, Notebook and Tablet
14.4.Asia Pacific Device as a Service Market Revenue (US$ Mn) and Forecasts, By Organization Size
14.4.1.Small and Medium-Sized Enterprises
14.4.2.Large Enterprises
14.5.Asia Pacific Device as a Service Market Revenue (US$ Mn) and Forecasts, By End User
14.5.1.IT and Telecommunications
14.5.2.Healthcare and Life Sciences
14.5.3.Educational Institutions
14.5.4.Banking, Financial Services and Insurance (BFSI)
14.5.5.Public Sector and Government Offices
14.5.6.Others
14.6.Asia Pacific Device as a Service Market Revenue (US$ Mn) and Forecasts, By Country
14.6.1.China
14.6.1.1.China Device as a Service Market Revenue (US$ Mn) and Forecasts, By Offering
14.6.1.1.1.Hardware
14.6.1.1.2.Software
14.6.1.1.3.Services
14.6.1.2.China Device as a Service Market Revenue (US$ Mn) and Forecasts, By Device Type
14.6.1.2.1.Desktops
14.6.1.2.2.Smartphones and Peripherals
14.6.1.2.3.Laptop, Notebook and Tablet
14.6.1.3.China Device as a Service Market Revenue (US$ Mn) and Forecasts, By Organization Size
14.6.1.3.1.Small and Medium-Sized Enterprises
14.6.1.3.2.Large Enterprises
14.6.1.4.China Device as a Service Market Revenue (US$ Mn) and Forecasts, By End User
14.6.1.4.1.IT and Telecommunications
14.6.1.4.2.Healthcare and Life Sciences
14.6.1.4.3.Educational Institutions
14.6.1.4.4.Banking, Financial Services and Insurance (BFSI)
14.6.1.4.5.Public Sector and Government Offices
14.6.1.4.6.Others
14.6.2.Japan
14.6.2.1.Japan Device as a Service Market Revenue (US$ Mn) and Forecasts, By Offering
14.6.2.1.1.Hardware
14.6.2.1.2.Software
14.6.2.1.3.Services
14.6.2.2.Japan Device as a Service Market Revenue (US$ Mn) and Forecasts, By Device Type
14.6.2.2.1.Desktops
14.6.2.2.2.Smartphones and Peripherals
14.6.2.2.3.Laptop, Notebook and Tablet
14.6.2.3.Japan Device as a Service Market Revenue (US$ Mn) and Forecasts, By Organization Size
14.6.2.3.1.Small and Medium-Sized Enterprises
14.6.2.3.2.Large Enterprises
14.6.2.4.Japan Device as a Service Market Revenue (US$ Mn) and Forecasts, By End User
14.6.2.4.1.IT and Telecommunications
14.6.2.4.2.Healthcare and Life Sciences
14.6.2.4.3.Educational Institutions
14.6.2.4.4.Banking, Financial Services and Insurance (BFSI)
14.6.2.4.5.Public Sector and Government Offices
14.6.2.4.6.Others
14.6.3.India
14.6.3.1.India Device as a Service Market Revenue (US$ Mn) and Forecasts, By Offering
14.6.3.1.1.Hardware
14.6.3.1.2.Software
14.6.3.1.3.Services
14.6.3.2.India Device as a Service Market Revenue (US$ Mn) and Forecasts, By Device Type
14.6.3.2.1.Desktops
14.6.3.2.2.Smartphones and Peripherals
14.6.3.2.3.Laptop, Notebook and Tablet
14.6.3.3.India Device as a Service Market Revenue (US$ Mn) and Forecasts, By Organization Size
14.6.3.3.1.Small and Medium-Sized Enterprises
14.6.3.3.2.Large Enterprises
14.6.3.4.India Device as a Service Market Revenue (US$ Mn) and Forecasts, By End User
14.6.3.4.1.IT and Telecommunications
14.6.3.4.2.Healthcare and Life Sciences
14.6.3.4.3.Educational Institutions
14.6.3.4.4.Banking, Financial Services and Insurance (BFSI)
14.6.3.4.5.Public Sector and Government Offices
14.6.3.4.6.Others
14.6.4.New Zealand
14.6.4.1.New Zealand Device as a Service Market Revenue (US$ Mn) and Forecasts, By Offering
14.6.4.1.1.Hardware
14.6.4.1.2.Software
14.6.4.1.3.Services
14.6.4.2.New Zealand Device as a Service Market Revenue (US$ Mn) and Forecasts, By Device Type
14.6.4.2.1.Desktops
14.6.4.2.2.Smartphones and Peripherals
14.6.4.2.3.Laptop, Notebook and Tablet
14.6.4.3.New Zealand Device as a Service Market Revenue (US$ Mn) and Forecasts, By Organization Size
14.6.4.3.1.Small and Medium-Sized Enterprises
14.6.4.3.2.Large Enterprises
14.6.4.4.New Zealand Device as a Service Market Revenue (US$ Mn) and Forecasts, By End User
14.6.4.4.1.IT and Telecommunications
14.6.4.4.2.Healthcare and Life Sciences
14.6.4.4.3.Educational Institutions
14.6.4.4.4.Banking, Financial Services and Insurance (BFSI)
14.6.4.4.5.Public Sector and Government Offices
14.6.4.4.6.Others
14.6.5.Australia
14.6.5.1.Australia Device as a Service Market Revenue (US$ Mn) and Forecasts, By Offering
14.6.5.1.1.Hardware
14.6.5.1.2.Software
14.6.5.1.3.Services
14.6.5.2.Australia Device as a Service Market Revenue (US$ Mn) and Forecasts, By Device Type
14.6.5.2.1.Desktops
14.6.5.2.2.Smartphones and Peripherals
14.6.5.2.3.Laptop, Notebook and Tablet
14.6.5.3.Australia Device as a Service Market Revenue (US$ Mn) and Forecasts, By Organization Size
14.6.5.3.1.Small and Medium-Sized Enterprises
14.6.5.3.2.Large Enterprises
14.6.5.4.Australia Device as a Service Market Revenue (US$ Mn) and Forecasts, By End User
14.6.5.4.1.IT and Telecommunications
14.6.5.4.2.Healthcare and Life Sciences
14.6.5.4.3.Educational Institutions
14.6.5.4.4.Banking, Financial Services and Insurance (BFSI)
14.6.5.4.5.Public Sector and Government Offices
14.6.5.4.6.Others
14.6.6.South Korea
14.6.6.1.South Korea Device as a Service Market Revenue (US$ Mn) and Forecasts, By Offering
14.6.6.1.1.Hardware
14.6.6.1.2.Software
14.6.6.1.3.Services
14.6.6.2.South Korea Device as a Service Market Revenue (US$ Mn) and Forecasts, By Device Type
14.6.6.2.1.Desktops
14.6.6.2.2.Smartphones and Peripherals
14.6.6.2.3.Laptop, Notebook and Tablet
14.6.6.3.South Korea Device as a Service Market Revenue (US$ Mn) and Forecasts, By Organization Size
14.6.6.3.1.Small and Medium-Sized Enterprises
14.6.6.3.2.Large Enterprises
14.6.6.4.South Korea Device as a Service Market Revenue (US$ Mn) and Forecasts, By End User
14.6.6.4.1.IT and Telecommunications
14.6.6.4.2.Healthcare and Life Sciences
14.6.6.4.3.Educational Institutions
14.6.6.4.4.Banking, Financial Services and Insurance (BFSI)
14.6.6.4.5.Public Sector and Government Offices
14.6.6.4.6.Others
14.6.7.Southeast Asia
14.6.7.1.Southeast Asia Device as a Service Market Revenue (US$ Mn) and Forecasts, By Offering
14.6.7.1.1.Hardware
14.6.7.1.2.Software
14.6.7.1.3.Services
14.6.7.2.Southeast Asia Device as a Service Market Revenue (US$ Mn) and Forecasts, By Device Type
14.6.7.2.1.Desktops
14.6.7.2.2.Smartphones and Peripherals
14.6.7.2.3.Laptop, Notebook and Tablet
14.6.7.3.Southeast Asia Device as a Service Market Revenue (US$ Mn) and Forecasts, By Organization Size
14.6.7.3.1.Small and Medium-Sized Enterprises
14.6.7.3.2.Large Enterprises
14.6.7.4.Southeast Asia Device as a Service Market Revenue (US$ Mn) and Forecasts, By End User
14.6.7.4.1.IT and Telecommunications
14.6.7.4.2.Healthcare and Life Sciences
14.6.7.4.3.Educational Institutions
14.6.7.4.4.Banking, Financial Services and Insurance (BFSI)
14.6.7.4.5.Public Sector and Government Offices
14.6.7.4.6.Others
14.6.7.5.Southeast Asia Device as a Service Market Revenue (US$ Mn) and Forecasts, By Country
14.6.7.5.1.Indonesia
14.6.7.5.2.Thailand
14.6.7.5.3.Malaysia
14.6.7.5.4.Singapore
14.6.7.5.5.Rest of Southeast Asia
14.6.8.Rest of Asia Pacific
14.6.8.1.Rest of Asia Pacific Device as a Service Market Revenue (US$ Mn) and Forecasts, By Offering
14.6.8.1.1.Hardware
14.6.8.1.2.Software
14.6.8.1.3.Services
14.6.8.2.Rest of Asia Pacific Device as a Service Market Revenue (US$ Mn) and Forecasts, By Device Type
14.6.8.2.1.Desktops
14.6.8.2.2.Smartphones and Peripherals
14.6.8.2.3.Laptop, Notebook and Tablet
14.6.8.3.Rest of Asia Pacific Device as a Service Market Revenue (US$ Mn) and Forecasts, By Organization Size
14.6.8.3.1.Small and Medium-Sized Enterprises
14.6.8.3.2.Large Enterprises
14.6.8.4.Rest of Asia Pacific Device as a Service Market Revenue (US$ Mn) and Forecasts, By End User
14.6.8.4.1.IT and Telecommunications
14.6.8.4.2.Healthcare and Life Sciences
14.6.8.4.3.Educational Institutions
14.6.8.4.4.Banking, Financial Services and Insurance (BFSI)
14.6.8.4.5.Public Sector and Government Offices
14.6.8.4.6.Others
14.7.Key Segment for Channeling Investments
14.7.1.By Country
14.7.2.By Offering
14.7.3.By Device Type
14.7.4.By Organization Size
14.7.5.By End User
15.Middle East and Africa Device as a Service Market Analysis and Forecasts, 2023 – 2031
15.1.Overview
15.1.1.Middle East and Africa Device as a Service Market Revenue (US$ Mn)
15.2.Middle East and Africa Device as a Service Market Revenue (US$ Mn) and Forecasts, By Offering
15.2.1.Hardware
15.2.2.Software
15.2.3.Services
15.3.Middle East and Africa Device as a Service Market Revenue (US$ Mn) and Forecasts, By Device Type
15.3.1.Desktops
15.3.2.Smartphones and Peripherals
15.3.3.Laptop, Notebook and Tablet
15.4.Middle East and Africa Device as a Service Market Revenue (US$ Mn) and Forecasts, By Organization Size
15.4.1.Small and Medium-Sized Enterprises
15.4.2.Large Enterprises
15.5.Middle East and Africa Device as a Service Market Revenue (US$ Mn) and Forecasts, By End User
15.5.1.IT and Telecommunications
15.5.2.Healthcare and Life Sciences
15.5.3.Educational Institutions
15.5.4.Banking, Financial Services and Insurance (BFSI)
15.5.5.Public Sector and Government Offices
15.5.6.Others
15.6.Middle East and Africa Device as a Service Market Revenue (US$ Mn) and Forecasts, By Country
15.6.1.Saudi Arabia
15.6.1.1.Saudi Arabia Device as a Service Market Revenue (US$ Mn) and Forecasts, By Offering
15.6.1.1.1.Hardware
15.6.1.1.2.Software
15.6.1.1.3.Services
15.6.1.2.Saudi Arabia Device as a Service Market Revenue (US$ Mn) and Forecasts, By Device Type
15.6.1.2.1.Desktops
15.6.1.2.2.Smartphones and Peripherals
15.6.1.2.3.Laptop, Notebook and Tablet
15.6.1.3.Saudi Arabia Device as a Service Market Revenue (US$ Mn) and Forecasts, By Organization Size
15.6.1.3.1.Small and Medium-Sized Enterprises
15.6.1.3.2.Large Enterprises
15.6.1.4.Saudi Arabia Device as a Service Market Revenue (US$ Mn) and Forecasts, By End User
15.6.1.4.1.IT and Telecommunications
15.6.1.4.2.Healthcare and Life Sciences
15.6.1.4.3.Educational Institutions
15.6.1.4.4.Banking, Financial Services and Insurance (BFSI)
15.6.1.4.5.Public Sector and Government Offices
15.6.1.4.6.Others
15.6.2.UAE
15.6.2.1.UAE Device as a Service Market Revenue (US$ Mn) and Forecasts, By Offering
15.6.2.1.1.Hardware
15.6.2.1.2.Software
15.6.2.1.3.Services
15.6.2.2.UAE Device as a Service Market Revenue (US$ Mn) and Forecasts, By Device Type
15.6.2.2.1.Desktops
15.6.2.2.2.Smartphones and Peripherals
15.6.2.2.3.Laptop, Notebook and Tablet
15.6.2.3.UAE Device as a Service Market Revenue (US$ Mn) and Forecasts, By Organization Size
15.6.2.3.1.Small and Medium-Sized Enterprises
15.6.2.3.2.Large Enterprises
15.6.2.4.UAE Device as a Service Market Revenue (US$ Mn) and Forecasts, By End User
15.6.2.4.1.IT and Telecommunications
15.6.2.4.2.Healthcare and Life Sciences
15.6.2.4.3.Educational Institutions
15.6.2.4.4.Banking, Financial Services and Insurance (BFSI)
15.6.2.4.5.Public Sector and Government Offices
15.6.2.4.6.Others
15.6.3.Egypt
15.6.3.1.Egypt Device as a Service Market Revenue (US$ Mn) and Forecasts, By Offering
15.6.3.1.1.Hardware
15.6.3.1.2.Software
15.6.3.1.3.Services
15.6.3.2.Egypt Device as a Service Market Revenue (US$ Mn) and Forecasts, By Device Type
15.6.3.2.1.Desktops
15.6.3.2.2.Smartphones and Peripherals
15.6.3.2.3.Laptop, Notebook and Tablet
15.6.3.3.Egypt Device as a Service Market Revenue (US$ Mn) and Forecasts, By Organization Size
15.6.3.3.1.Small and Medium-Sized Enterprises
15.6.3.3.2.Large Enterprises
15.6.3.4.Egypt Device as a Service Market Revenue (US$ Mn) and Forecasts, By End User
15.6.3.4.1.IT and Telecommunications
15.6.3.4.2.Healthcare and Life Sciences
15.6.3.4.3.Educational Institutions
15.6.3.4.4.Banking, Financial Services and Insurance (BFSI)
15.6.3.4.5.Public Sector and Government Offices
15.6.3.4.6.Others
15.6.4.Kuwait
15.6.4.1.Kuwait Device as a Service Market Revenue (US$ Mn) and Forecasts, By Offering
15.6.4.1.1.Hardware
15.6.4.1.2.Software
15.6.4.1.3.Services
15.6.4.2.Kuwait Device as a Service Market Revenue (US$ Mn) and Forecasts, By Device Type
15.6.4.2.1.Desktops
15.6.4.2.2.Smartphones and Peripherals
15.6.4.2.3.Laptop, Notebook and Tablet
15.6.4.3.Kuwait Device as a Service Market Revenue (US$ Mn) and Forecasts, By Organization Size
15.6.4.3.1.Small and Medium-Sized Enterprises
15.6.4.3.2.Large Enterprises
15.6.4.4.Kuwait Device as a Service Market Revenue (US$ Mn) and Forecasts, By End User
15.6.4.4.1.IT and Telecommunications
15.6.4.4.2.Healthcare and Life Sciences
15.6.4.4.3.Educational Institutions
15.6.4.4.4.Banking, Financial Services and Insurance (BFSI)
15.6.4.4.5.Public Sector and Government Offices
15.6.4.4.6.Others
15.6.5.South Africa
15.6.5.1.South Africa Device as a Service Market Revenue (US$ Mn) and Forecasts, By Offering
15.6.5.1.1.Hardware
15.6.5.1.2.Software
15.6.5.1.3.Services
15.6.5.2.South Africa Device as a Service Market Revenue (US$ Mn) and Forecasts, By Device Type
15.6.5.2.1.Desktops
15.6.5.2.2.Smartphones and Peripherals
15.6.5.2.3.Laptop, Notebook and Tablet
15.6.5.3.South Africa Device as a Service Market Revenue (US$ Mn) and Forecasts, By Organization Size
15.6.5.3.1.Small and Medium-Sized Enterprises
15.6.5.3.2.Large Enterprises
15.6.5.4.South Africa Device as a Service Market Revenue (US$ Mn) and Forecasts, By End User
15.6.5.4.1.IT and Telecommunications
15.6.5.4.2.Healthcare and Life Sciences
15.6.5.4.3.Educational Institutions
15.6.5.4.4.Banking, Financial Services and Insurance (BFSI)
15.6.5.4.5.Public Sector and Government Offices
15.6.5.4.6.Others
15.6.6.Rest of Middle East & Africa
15.6.6.1.Rest of Middle East & Africa Device as a Service Market Revenue (US$ Mn) and Forecasts, By Offering
15.6.6.1.1.Hardware
15.6.6.1.2.Software
15.6.6.1.3.Services
15.6.6.2.Rest of Middle East & Africa Device as a Service Market Revenue (US$ Mn) and Forecasts, By Device Type
15.6.6.2.1.Desktops
15.6.6.2.2.Smartphones and Peripherals
15.6.6.2.3.Laptop, Notebook and Tablet
15.6.6.3.Rest of Middle East & Africa Device as a Service Market Revenue (US$ Mn) and Forecasts, By Organization Size
15.6.6.3.1.Small and Medium-Sized Enterprises
15.6.6.3.2.Large Enterprises
15.6.6.4.Rest of Middle East & Africa Device as a Service Market Revenue (US$ Mn) and Forecasts, By End User
15.6.6.4.1.IT and Telecommunications
15.6.6.4.2.Healthcare and Life Sciences
15.6.6.4.3.Educational Institutions
15.6.6.4.4.Banking, Financial Services and Insurance (BFSI)
15.6.6.4.5.Public Sector and Government Offices
15.6.6.4.6.Others
15.7.Key Segment for Channeling Investments
15.7.1.By Country
15.7.2.By Offering
15.7.3.By Device Type
15.7.4.By Organization Size
15.7.5.By End User
16.Latin America Device as a Service Market Analysis and Forecasts, 2023 – 2031
16.1.Overview
16.1.1.Latin America Device as a Service Market Revenue (US$ Mn)
16.2.Latin America Device as a Service Market Revenue (US$ Mn) and Forecasts, By Offering
16.2.1.Hardware
16.2.2.Software
16.2.3.Services
16.3.Latin America Device as a Service Market Revenue (US$ Mn) and Forecasts, By Device Type
16.3.1.Desktops
16.3.2.Smartphones and Peripherals
16.3.3.Laptop, Notebook and Tablet
16.4.Latin America Device as a Service Market Revenue (US$ Mn) and Forecasts, By Organization Size
16.4.1.Small and Medium-Sized Enterprises
16.4.2.Large Enterprises
16.5.Latin America Device as a Service Market Revenue (US$ Mn) and Forecasts, By End User
16.5.1.IT and Telecommunications
16.5.2.Healthcare and Life Sciences
16.5.3.Educational Institutions
16.5.4.Banking, Financial Services and Insurance (BFSI)
16.5.5.Public Sector and Government Offices
16.5.6.Others
16.6.Latin America Device as a Service Market Revenue (US$ Mn) and Forecasts, By Country
16.6.1.Brazil
16.6.1.1.Brazil Device as a Service Market Revenue (US$ Mn) and Forecasts, By Offering
16.6.1.1.1.Hardware
16.6.1.1.2.Software
16.6.1.1.3.Services
16.6.1.2.Brazil Device as a Service Market Revenue (US$ Mn) and Forecasts, By Device Type
16.6.1.2.1.Desktops
16.6.1.2.2.Smartphones and Peripherals
16.6.1.2.3.Laptop, Notebook and Tablet
16.6.1.3.Brazil Device as a Service Market Revenue (US$ Mn) and Forecasts, By Organization Size
16.6.1.3.1.Small and Medium-Sized Enterprises
16.6.1.3.2.Large Enterprises
16.6.1.4.Brazil Device as a Service Market Revenue (US$ Mn) and Forecasts, By End User
16.6.1.4.1.IT and Telecommunications
16.6.1.4.2.Healthcare and Life Sciences
16.6.1.4.3.Educational Institutions
16.6.1.4.4.Banking, Financial Services and Insurance (BFSI)
16.6.1.4.5.Public Sector and Government Offices
16.6.1.4.6.Others
16.6.2.Argentina
16.6.2.1.Argentina Device as a Service Market Revenue (US$ Mn) and Forecasts, By Offering
16.6.2.1.1.Hardware
16.6.2.1.2.Software
16.6.2.1.3.Services
16.6.2.2.Argentina Device as a Service Market Revenue (US$ Mn) and Forecasts, By Device Type
16.6.2.2.1.Desktops
16.6.2.2.2.Smartphones and Peripherals
16.6.2.2.3.Laptop, Notebook and Tablet
16.6.2.3.Argentina Device as a Service Market Revenue (US$ Mn) and Forecasts, By Organization Size
16.6.2.3.1.Small and Medium-Sized Enterprises
16.6.2.3.2.Large Enterprises
16.6.2.4.Argentina Device as a Service Market Revenue (US$ Mn) and Forecasts, By End User
16.6.2.4.1.IT and Telecommunications
16.6.2.4.2.Healthcare and Life Sciences
16.6.2.4.3.Educational Institutions
16.6.2.4.4.Banking, Financial Services and Insurance (BFSI)
16.6.2.4.5.Public Sector and Government Offices
16.6.2.4.6.Others
16.6.3.Rest of Latin America
16.6.3.1.Rest of Latin America Device as a Service Market Revenue (US$ Mn) and Forecasts, By Offering
16.6.3.1.1.Hardware
16.6.3.1.2.Software
16.6.3.1.3.Services
16.6.3.2.Rest of Latin America Device as a Service Market Revenue (US$ Mn) and Forecasts, By Device Type
16.6.3.2.1.Desktops
16.6.3.2.2.Smartphones and Peripherals
16.6.3.2.3.Laptop, Notebook and Tablet
16.6.3.3.Rest of Latin America Device as a Service Market Revenue (US$ Mn) and Forecasts, By Organization Size
16.6.3.3.1.Small and Medium-Sized Enterprises
16.6.3.3.2.Large Enterprises
16.6.3.4.Rest of Latin America Device as a Service Market Revenue (US$ Mn) and Forecasts, By End User
16.6.3.4.1.IT and Telecommunications
16.6.3.4.2.Healthcare and Life Sciences
16.6.3.4.3.Educational Institutions
16.6.3.4.4.Banking, Financial Services and Insurance (BFSI)
16.6.3.4.5.Public Sector and Government Offices
16.6.3.4.6.Others
16.7.Key Segment for Channeling Investments
16.7.1.By Country
16.7.2.By Offering
16.7.3.By Device Type
16.7.4.By Organization Size
16.7.5.By End User
17.Competitive Benchmarking
17.1.Brand Benchmarking
17.2.Market Share Analysis, 2022
17.3.Global Presence and Growth Strategies
17.3.1.Mergers and Acquisitions
17.3.2.Product Launches
17.3.3.Investments Trends
17.3.4.R&D Initiatives
18.Player Profiles
18.1.Atea Global Services Ltd.
18.1.1.Company Details
18.1.2.Company Overview
18.1.3.Product Offerings
18.1.4.Key Developments
18.1.5.Financial Analysis
18.1.6.SWOT Analysis
18.1.7.Business Strategies
18.2.CHG-MERIDIAN
18.2.1.Company Details
18.2.2.Company Overview
18.2.3.Product Offerings
18.2.4.Key Developments
18.2.5.Financial Analysis
18.2.6.SWOT Analysis
18.2.7.Business Strategies
18.3.Cisco Systems, Inc.
18.3.1.Company Details
18.3.2.Company Overview
18.3.3.Product Offerings
18.3.4.Key Developments
18.3.5.Financial Analysis
18.3.6.SWOT Analysis
18.3.7.Business Strategies
18.4.CompuCom Systems, Inc.
18.4.1.Company Details
18.4.2.Company Overview
18.4.3.Product Offerings
18.4.4.Key Developments
18.4.5.Financial Analysis
18.4.6.SWOT Analysis
18.4.7.Business Strategies
18.5.Computacenter plc
18.5.1.Company Details
18.5.2.Company Overview
18.5.3.Product Offerings
18.5.4.Key Developments
18.5.5.Financial Analysis
18.5.6.SWOT Analysis
18.5.7.Business Strategies
18.6.CSI Leasing, Inc.
18.7.Dell Inc.
18.7.1.Company Details
18.7.2.Company Overview
18.7.3.Product Offerings
18.7.4.Key Developments
18.7.5.Financial Analysis
18.7.6.SWOT Analysis
18.7.7.Business Strategies
18.8.Econocom
18.8.1.Company Details
18.8.2.Company Overview
18.8.3.Product Offerings
18.8.4.Key Developments
18.8.5.Financial Analysis
18.8.6.SWOT Analysis
18.8.7.Business Strategies
18.9.HP Development Company, L.P.
18.9.1.Company Details
18.9.2.Company Overview
18.9.3.Product Offerings
18.9.4.Key Developments
18.9.5.Financial Analysis
18.9.6.SWOT Analysis
18.9.7.Business Strategies
18.10.Lenovo
18.10.1.Company Details
18.10.2.Company Overview
18.10.3.Product Offerings
18.10.4.Key Developments
18.10.5.Financial Analysis
18.10.6.SWOT Analysis
18.10.7.Business Strategies
18.11.Microsoft
18.11.1.Company Details
18.11.2.Company Overview
18.11.3.Product Offerings
18.11.4.Key Developments
18.11.5.Financial Analysis
18.11.6.SWOT Analysis
18.11.7.Business Strategies
18.12.Telia Company AB
18.12.1.Company Details
18.12.2.Company Overview
18.12.3.Product Offerings
18.12.4.Key Developments
18.12.5.Financial Analysis
18.12.6.SWOT Analysis
18.12.7.Business Strategies
18.13.Other Market Participants
19.Key Findings

.

**Exclusive for Multi-User and Enterprise User.

Global Device as a Service Market Segmentation

By Offering

 Hardware
 Software
 Services

By Device Type

 Desktops
 Smartphones and Peripherals
 Laptop, Notebook and Tablet

By Organization Size

 Small and Medium-Sized Enterprises
 Large Enterprises

By End User

 IT & Telecommunications
 Healthcare & Life Sciences
 Educational Institutions
 Banking, Financial Services and Insurance (BFSI)
 Public Sector and Government Offices
 Others

By Region

 North America (U.S., Canada, Mexico, Rest of North America)
 Europe (France, The UK, Spain, Germany, Italy, Nordic Countries (Denmark, Finland, Iceland, Sweden, Norway), Benelux Union (Belgium, The Netherlands, Luxembourg), Rest of Europe)
 Asia Pacific (China, Japan, India, New Zealand, Australia, South Korea, Southeast Asia (Indonesia, Thailand, Malaysia, Singapore, Rest of Southeast Asia), Rest of Asia Pacific)
 Middle East & Africa (Saudi Arabia, UAE, Egypt, Kuwait, South Africa, Rest of Middle East & Africa)
 Latin America (Brazil, Argentina, Rest of Latin America)

**Note: The report covers cross-segmentation analysis by region further into countries

.

The Niche Research approach encompasses both primary and secondary research methods to provide comprehensive insights. While primary research is the cornerstone of our studies, we also incorporate secondary research sources such as company annual reports, premium industry databases, press releases, industry journals, and white papers.

Within our primary research, we actively engage with various industry stakeholders, conducting paid interviews and surveys. Our meticulous analysis extends to every market participant in major countries, allowing us to thoroughly examine their portfolios, calculate market shares, and segment revenues.

Our data collection primarily focuses on individual countries within our research scope, enabling us to estimate regional market sizes. Typically, we employ a bottom-up approach, meticulously tracking trends in different countries. We analyze growth drivers, constraints, technological innovations, and opportunities for each country, ultimately arriving at regional figures.Our process begins by examining the growth prospects of each country. Building upon these insights, we project growth and trends for the entire region. Finally, we utilize our proprietary model to refine estimations and forecasts.

Our data validation standards are integral to ensuring the reliability and accuracy of our research findings. Here’s a breakdown of our data validation processes and the stakeholders we engage with during our primary research:

  • Supply Side Analysis: We initiate a supply side analysis by directly contacting market participants, through telephonic interviews and questionnaires containing both open-ended and close-ended questions. We gather information on their portfolios, segment revenues, developments, and growth strategies.
  • Demand Side Analysis: To gain insights into adoption trends and consumer preferences, we reach out to target customers and users (non-vendors). This information forms a vital part of the qualitative analysis section of our reports, covering market dynamics, adoption trends, consumer behavior, spending patterns, and other related aspects.
  • Consultant Insights: We tap into the expertise of our partner consultants from around the world to obtain their unique viewpoints and perspectives. Their insights contribute to a well-rounded understanding of the markets under investigation.
  • In-House Validation: To ensure data accuracy and reliability, we conduct cross-validation of data points and information through our in-house team of consultants and utilize advanced data modeling tools for thorough verification.

The forecasts we provide are based on a comprehensive assessment of various factors, including:

  • Market Trends and Past Performance (Last Five Years): We accurately analyze market trends and performance data from preceding five years to identify historical patterns and understand the market’s evolution.
  • Historical Performance and Growth of Market Participants: We assess the historical performance and growth trajectories of key market participants. This analysis provides insights into the competitive landscape and individual company strategies.
  • Market Determinants Impact Analysis (Next Eight Years): We conduct a rigorous analysis of the factors that are projected to influence the market over the next eight years. This includes assessing both internal and external determinants that can shape market dynamics.
  • Drivers and Challenges for the Forecast Period:Identify the factors expected to drive market growth during the forecast period, as well as the challenges that the industry may face. This analysis aids in deriving an accurate growth rate projection.
  • New Acquisitions, Collaborations, or Partnerships: We keep a close watch on any new acquisitions, collaborations, or partnerships within the industry. These developments can have a significant impact on market dynamics and competitiveness.
  • Macro and Micro Factors Analysis:A thorough examination of both macro-level factors (e.g., economic trends, regulatory changes) and micro-level factors (e.g., technological advancements, consumer preferences) that may influence the market during the forecast period.
  • End-User Sentiment Analysis: To understand the market from the end-user perspective, we conduct sentiment analysis. This involves assessing the sentiment, preferences, and feedback of the end-users, which can provide valuable insights into market trends.
  • Perspective of Primary Participants: Insights gathered directly from primary research participants play a crucial role in shaping our forecasts. Their perspectives and experiences provide valuable qualitative data.
  • Year-on-Year Growth Trend: We utilize a year-on-year growth trend based on historical market growth and expected future trends. This helps in formulating our growth projections, aligning them with the market’s historical performance.

Research process adopted by TNR involves multiple stages, including data collection, validation, quality checks, and presentation. It’s crucial that the data and information we provide add value to your existing market understanding and expertise. We have also established partnerships with business consulting, research, and survey organizations across regions and globally to collaborate on regional analysis and data validation, ensuring the highest level of accuracy and reliability in our reports.


Procure Comprehensive Study of

Global Device as a Service Market

Online Only

  • Online Access
  • Read Only File
  • Validity 3 Months
  • Print, Copy, Paste & Download
  • PPT, Excel
  • Cost-Free Report in the Next Update
$3300
Buy Now

Single User

  • Access to One User on One System
  • Read Only File
  • Validity 6 Months
  • Limited Print,Copy, Paste
  • PPT, Excel
  • Cost-Free Report in the Next Update
$4200
Buy Now

Multi User

  • Access to Fiver Users
  • PDF File
  • Validity 1 Year
  • Upto FivePrints
  • Cost-Free Report in the Next Update
  • PPT, Excel
$6000
Buy Now

Enterprise User

  • Access to Unlimited Users
  • PDF, PPT, Excel
  • Unlimited Validity, Prints&Downloads
  • 1 Hour Cost-Free & Dedicated Analyst Support
  • 10% Cost-Free Customization
  • Cost-Free Report Update Twice in a Year
  • Recommendations for Business Strategies
  • Authorization to Quote TNR, The Niche Research
$7300
Buy Now

Library Access

  • Online Access to Content Publications
  • Access Player Profiles Online
  • Get Immediate Access to Newly Added Content
  • Acquire 12 PDF Downloads
  • Acquire 5 Excel Data Sets
  • Gain Access to 290+ PDFs of Company Profiles
  • Round-the-clock Email and Phone Assistance
  • Dashboard Usage and Trends
  • Renewal & Upgrade Assistance
  • Assessing Customization Options and Alerts for New Reports
*Taxes/Fees, if applicable will be added during checkout. All prices in USD

Why TNR The Niche Research?

  • Unwavering Commitment to Excellence

  • Veteran Team of Researchers

  • Accurate and Timely Insights

  • Ethical Practices and Customized Service

  • Uninterrupted Availability Around the Clock

Scroll to Top