Global Drilling Fluids Market By Product, By Application & By Region: Segmental Insights, Market Revenue (US$ Mn) and Forecasts (2015 – 2031)

  • Industry: Construction & Manufacturing
  • Report ID: TNR-110-1014
  • Number of Pages: 420
  • Table/Charts : Yes
  • November, 2023
  • Base Year : 2024
  • No. of Companies : 12+
  • No. of Countries : 29
  • Views : 10113
  • Covid Impact Covered: Yes
  • War Impact Covered: Yes
  • Formats : PDF, Excel, PPT

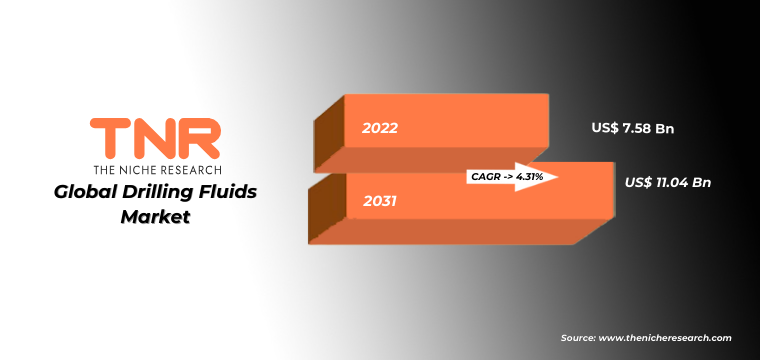
Global Drilling Fluids Market was Valued at US$ 7.58 Billion in 2022, Growing at An Estimated CAGR of 4.31% from 2023-2031.

Drilling fluids, also known as drilling mud, are essential fluids used in drilling operations within the oil and gas industry. They serve multiple purposes, including cooling the drill bit, carrying cuttings to the surface, and maintaining pressure to prevent formation damage. These fluids are designed to optimize drilling efficiency and ensure well stability.

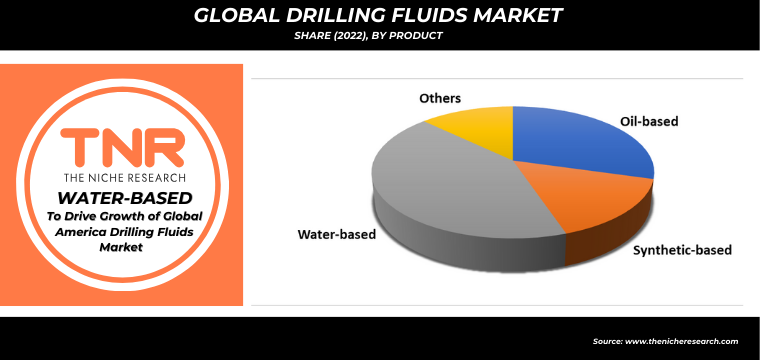
Water-based drilling fluids are dominant in the market due to their environmental friendliness and cost-effectiveness. Their aqueous nature reduces environmental impact, aligning with regulatory trends. This segment enjoys substantial usage owing to its balanced performance in various drilling scenarios.

COVID-19 Impact Analysis on Global Drilling Fluids Market

Pre-COVID-19, the drilling fluids market grew steadily due to rising energy demand, with water-based fluids dominating. Post-COVID-19, disruptions in oil demand and project delays hampered growth. Water-based fluids remained resilient, synthetic-based fluids saw modest growth, while oil-based fluids faced environmental scrutiny, impacting their prospects.

Global Drilling Fluids Market Revenue & Forecast, (US$ Million), 2015 – 2031

The drilling fluids market is propelled by continuous technological innovations, enhancing operational efficiency and environmental sustainability. Advanced formulations of water-based fluids, integrating nanotechnology, have gained traction for their improved lubrication and reduced friction. Such advancements lead to cost savings of up to 25% in drilling operations. This driver addresses industry demands for higher performance while aligning with regulatory pressures for greener practices. Stricter environmental regulations significantly impede the growth of oil-based drilling fluids. The need for minimizing ecological impact and the adoption of more sustainable alternatives challenge the expansion of oil-based fluids. As the industry shifts toward eco-friendly solutions, the market faces hurdles in meeting both operational and environmental requirements.

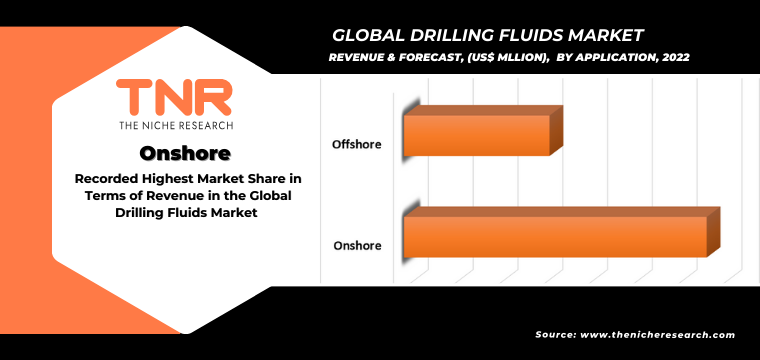
Onshore drilling activities dominated the drilling fluids market due to their accessibility and lower operational complexities. Onshore drilling accounts for around 70% of global drilling activities. Its dominance is attributed to cost-effectiveness, ease of logistics, and reduced regulatory challenges compared to offshore operations.

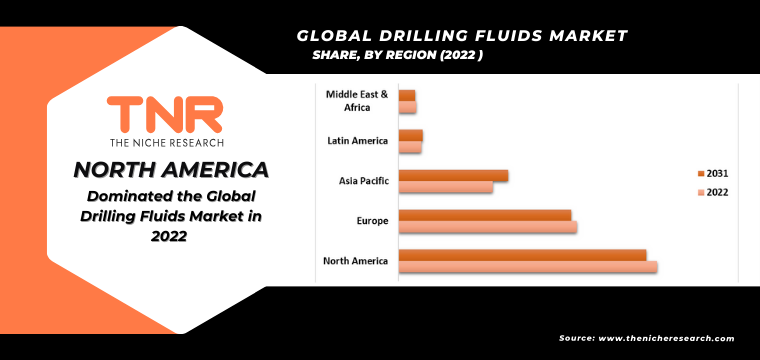
North America dominated the global drilling fluids market in 2022. The US is a key contributor to the region’s dominance, driven by shale gas and tight oil production. The region’s technological advancements, coupled with extensive drilling activities, reinforce its leadership position.

Competitive Landscape

The report analyzes the competitiveness of the key players in the drilling fluids market. This analysis could involve evaluating factors such as market share, product offerings, pricing strategies, and market positioning. For each company, the report examines their service offerings and specifications. This involves detailing the types of drilling fluids they provide, their features, and any unique selling points. A few of the players operating in the global drilling fluids market are

  • Baker Hughes Company
  • CES Energy Solutions Corp.
  • Halliburton Energy Services, Inc.
  • Newpark Resources Inc.
  • NOV Inc.
  • Petrochem Performance Chemicals LLC
  • SLB
  • TETRA Technologies, Inc.
  • Weatherford
  • Other Industry Participants

Global Drilling Fluids Market Key Takeaways


Report Specifications Details
Market Revenue in 2022 US$ 7.58 Bn
Market Size Forecast by 2031 US$ 11.04 Bn
Growth Rate (CAGR) 4.31%
Historic Data 2015 – 2021
Base Year for Estimation 2022
Forecast Period 2023 – 2031
Report Inclusions Market Size & Estimates, Market Dynamics, Competitive Scenario, Trends, Growth Factors, Market Determinants, Key Investment Segmentation, Product/Service/Solutions Benchmarking
Segments Covered By Product, By Application
Regions Covered North America, Europe, Asia Pacific, Middle East & Africa, Latin America
Countries Covered U.S., Canada, Mexico, Rest of North America,  France, The UK, Spain, Germany, Italy, Nordic Countries (Denmark, Finland, Iceland, Sweden, Norway), Benelux Union (Belgium, The Netherlands, Luxembourg), Rest of Europe,  China, Japan, India, New Zealand, Australia, South Korea, Southeast Asia (Indonesia, Thailand, Malaysia, Singapore, Rest of Southeast Asia), Rest of Asia Pacific,  Saudi Arabia, UAE, Egypt, Kuwait, South Africa, Rest of Middle East & Africa,  Brazil, Argentina, Rest of Latin America
Key Players Baker Hughes Company, CES Energy Solutions Corp., Halliburton Energy Services, Inc., Newpark Resources Inc., NOV Inc., Petrochem Performance Chemicals LLC, SLB, TETRA Technologies, Inc., Weatherford, Other Industry Participants
Customization Scope Customization allows for the inclusion/modification of content pertaining to geographical regions, countries, and specific market segments.
Pricing & Procurement Options Explore purchase options tailored to your specific research requirements
Contact Details Consult With Our Expert

Japan (Toll-Free):  +81 663-386-8111

South Korea (Toll-Free):  +82-808- 703-126

Saudi Arabia (Toll-Free):  +966 800-850-1643

United Kingdom: +44 753-710-5080

United States: +1 302-232-5106

E-mail:  askanexpert@thenicheresearch.com 

Report Coverage & Deliverables

Global Drilling Fluids Market

By Product

  • Oil-based
  • Synthetic-based
  • Water-based
  • Others

By Application

  • Onshore
  • Offshore

By Region

  • North America (U.S., Canada, Mexico, Rest of North America)
  • Europe (France, The UK, Spain, Germany, Italy, Nordic Countries (Denmark, Finland, Iceland, Sweden, Norway), Benelux Union (Belgium, The Netherlands, Luxembourg), Rest of Europe)
  • Asia Pacific (China, Japan, India, New Zealand, Australia, South Korea, Southeast Asia (Indonesia, Thailand, Malaysia, Singapore, Rest of Southeast Asia), Rest of Asia Pacific)
  • Middle East & Africa (Saudi Arabia, UAE, Egypt, Kuwait, South Africa, Rest of Middle East & Africa)
  • Latin America (Brazil, Argentina, Rest of Latin America)

.

Table of Contents

.

1.Market Scope
1.1.Market Segmentation
1.2.Years Considered
1.2.1.Historic Years: 2015 – 2021
1.2.2.Base Year: 2022
1.2.3.Forecast Years: 2023 – 2031
2.Key Target Audiences
3.Research Methodology
3.1.Primary Research
3.1.1.Research Questionnaire
3.1.2.Global Percentage Breakdown
3.1.3.Primary Interviews: Key Opinion Leaders (KOLs)
3.2.Secondary Research
3.2.1.Paid Databases
3.2.2.Secondary Sources
3.3.Market Size Estimates
3.3.1.Top-Down Approach
3.3.2.Bottom-Up Approach
3.4.Data Triangulation Methodology
3.5.Research Assumptions
4.Recommendations and Insights from TNR’s Perspective**
5.Holistic Overview of Drilling Fluids Market
6.Market Synopsis: Drilling Fluids Market
7.Drilling Fluids Market Analysis: Qualitative Perspective
7.1.Introduction
7.1.1.Product Definition
7.1.2.Industry Development
7.2.Market Dynamics
7.2.1.Drivers
7.2.2.Restraints
7.2.3.Opportunities
7.2.4.Challenges
7.3.Trends in Drilling Fluids Market
7.4.Market Determinants Radar Chart
7.5.Macro-Economic and Micro-Economic Indicators: Drilling Fluids Market
7.6.Porter’s Five Force Analysis
7.7.Impact of Covid-19 on Drilling Fluids Market
8.Global Drilling Fluids Market Analysis and Forecasts, 2023 – 2031
8.1.Overview
8.1.1.Global Drilling Fluids Market Revenue (US$ Mn)
8.2.Global Drilling Fluids Market Revenue (US$ Mn) and Forecasts, By Product
8.2.1.Oil-based
8.2.1.1.Definition
8.2.1.2.Market Estimation and Penetration, 2015 – 2022
8.2.1.3.Market Forecast, 2023 – 2031
8.2.1.4.Compound Annual Growth Rate (CAGR)
8.2.1.5.Regional Bifurcation
8.2.1.5.1.North America
8.2.1.5.1.1.Market Estimation, 2015 – 2022
8.2.1.5.1.2.Market Forecast, 2023 – 2031
8.2.1.5.2.Europe
8.2.1.5.2.1.Market Estimation, 2015 – 2022
8.2.1.5.2.2.Market Forecast, 2023 – 2031
8.2.1.5.3.Asia Pacific
8.2.1.5.3.1.Market Estimation, 2015 – 2022
8.2.1.5.3.2.Market Forecast, 2023 – 2031
8.2.1.5.4.Middle East and Africa
8.2.1.5.4.1.Market Estimation, 2015 – 2022
8.2.1.5.4.2.Market Forecast, 2023 – 2031
8.2.1.5.5.Latin America
8.2.1.5.5.1.Market Estimation, 2015 – 2022
8.2.1.5.5.2.Market Forecast, 2023 – 2031
8.2.2.Synthetic-based
8.2.2.1.Definition
8.2.2.2.Market Estimation and Penetration, 2015 – 2022
8.2.2.3.Market Forecast, 2023 – 2031
8.2.2.4.Compound Annual Growth Rate (CAGR)
8.2.2.5.Regional Bifurcation
8.2.2.5.1.North America
8.2.2.5.1.1.Market Estimation, 2015 – 2022
8.2.2.5.1.2.Market Forecast, 2023 – 2031
8.2.2.5.2.Europe
8.2.2.5.2.1.Market Estimation, 2015 – 2022
8.2.2.5.2.2.Market Forecast, 2023 – 2031
8.2.2.5.3.Asia Pacific
8.2.2.5.3.1.Market Estimation, 2015 – 2022
8.2.2.5.3.2.Market Forecast, 2023 – 2031
8.2.2.5.4.Middle East and Africa
8.2.2.5.4.1.Market Estimation, 2015 – 2022
8.2.2.5.4.2.Market Forecast, 2023 – 2031
8.2.2.5.5.Latin America
8.2.2.5.5.1.Market Estimation, 2015 – 2022
8.2.2.5.5.2.Market Forecast, 2023 – 2031
8.2.3.Water-based
8.2.3.1.Definition
8.2.3.2.Market Estimation and Penetration, 2015 – 2022
8.2.3.3.Market Forecast, 2023 – 2031
8.2.3.4.Compound Annual Growth Rate (CAGR)
8.2.3.5.Regional Bifurcation
8.2.3.5.1.North America
8.2.3.5.1.1.Market Estimation, 2015 – 2022
8.2.3.5.1.2.Market Forecast, 2023 – 2031
8.2.3.5.2.Europe
8.2.3.5.2.1.Market Estimation, 2015 – 2022
8.2.3.5.2.2.Market Forecast, 2023 – 2031
8.2.3.5.3.Asia Pacific
8.2.3.5.3.1.Market Estimation, 2015 – 2022
8.2.3.5.3.2.Market Forecast, 2023 – 2031
8.2.3.5.4.Middle East and Africa
8.2.3.5.4.1.Market Estimation, 2015 – 2022
8.2.3.5.4.2.Market Forecast, 2023 – 2031
8.2.3.5.5.Latin America
8.2.3.5.5.1.Market Estimation, 2015 – 2022
8.2.3.5.5.2.Market Forecast, 2023 – 2031
8.2.4.Others
8.2.4.1.Definition
8.2.4.2.Market Estimation and Penetration, 2015 – 2022
8.2.4.3.Market Forecast, 2023 – 2031
8.2.4.4.Compound Annual Growth Rate (CAGR)
8.2.4.5.Regional Bifurcation
8.2.4.5.1.North America
8.2.4.5.1.1.Market Estimation, 2015 – 2022
8.2.4.5.1.2.Market Forecast, 2023 – 2031
8.2.4.5.2.Europe
8.2.4.5.2.1.Market Estimation, 2015 – 2022
8.2.4.5.2.2.Market Forecast, 2023 – 2031
8.2.4.5.3.Asia Pacific
8.2.4.5.3.1.Market Estimation, 2015 – 2022
8.2.4.5.3.2.Market Forecast, 2023 – 2031
8.2.4.5.4.Middle East and Africa
8.2.4.5.4.1.Market Estimation, 2015 – 2022
8.2.4.5.4.2.Market Forecast, 2023 – 2031
8.2.4.5.5.Latin America
8.2.4.5.5.1.Market Estimation, 2015 – 2022
8.2.4.5.5.2.Market Forecast, 2023 – 2031
8.3.Key Segment for Channeling Investments
8.3.1.By Product
9.Global Drilling Fluids Market Analysis and Forecasts, 2023 – 2031
9.1.Overview
9.2.Global Drilling Fluids Market Revenue (US$ Mn) and Forecasts, By Application
9.2.1.Onshore
9.2.1.1.Definition
9.2.1.2.Market Estimation and Penetration, 2015 – 2022
9.2.1.3.Market Forecast, 2023 – 2031
9.2.1.4.Compound Annual Growth Rate (CAGR)
9.2.1.5.Regional Bifurcation
9.2.1.5.1.North America
9.2.1.5.1.1.Market Estimation, 2015 – 2022
9.2.1.5.1.2.Market Forecast, 2023 – 2031
9.2.1.5.2.Europe
9.2.1.5.2.1.Market Estimation, 2015 – 2022
9.2.1.5.2.2.Market Forecast, 2023 – 2031
9.2.1.5.3.Asia Pacific
9.2.1.5.3.1.Market Estimation, 2015 – 2022
9.2.1.5.3.2.Market Forecast, 2023 – 2031
9.2.1.5.4.Middle East and Africa
9.2.1.5.4.1.Market Estimation, 2015 – 2022
9.2.1.5.4.2.Market Forecast, 2023 – 2031
9.2.1.5.5.Latin America
9.2.1.5.5.1.Market Estimation, 2015 – 2022
9.2.1.5.5.2.Market Forecast, 2023 – 2031
9.2.2.Offshore
9.2.2.1.Definition
9.2.2.2.Market Estimation and Penetration, 2015 – 2022
9.2.2.3.Market Forecast, 2023 – 2031
9.2.2.4.Compound Annual Growth Rate (CAGR)
9.2.2.5.Regional Bifurcation
9.2.2.5.1.North America
9.2.2.5.1.1.Market Estimation, 2015 – 2022
9.2.2.5.1.2.Market Forecast, 2023 – 2031
9.2.2.5.2.Europe
9.2.2.5.2.1.Market Estimation, 2015 – 2022
9.2.2.5.2.2.Market Forecast, 2023 – 2031
9.2.2.5.3.Asia Pacific
9.2.2.5.3.1.Market Estimation, 2015 – 2022
9.2.2.5.3.2.Market Forecast, 2023 – 2031
9.2.2.5.4.Middle East and Africa
9.2.2.5.4.1.Market Estimation, 2015 – 2022
9.2.2.5.4.2.Market Forecast, 2023 – 2031
9.2.2.5.5.Latin America
9.2.2.5.5.1.Market Estimation, 2015 – 2022
9.2.2.5.5.2.Market Forecast, 2023 – 2031
9.3.Key Segment for Channeling Investments
9.3.1.By Application
10.North America Drilling Fluids Market Analysis and Forecasts, 2023 – 2031
10.1.Overview
10.1.1.North America Drilling Fluids Market Revenue (US$ Mn)
10.2.North America Drilling Fluids Market Revenue (US$ Mn) and Forecasts, By Product
10.2.1.Oil-based
10.2.2.Synthetic-based
10.2.3.Water-based
10.2.4.Others
10.3.North America Drilling Fluids Market Revenue (US$ Mn) and Forecasts, By Application
10.3.1.Onshore
10.3.2.Offshore
10.4.North America Drilling Fluids Market Revenue (US$ Mn) and Forecasts, By Country
10.4.1.U.S
10.4.1.1.U.S Drilling Fluids Market Revenue (US$ Mn) and Forecasts, By Product
10.4.1.1.1.Oil-based
10.4.1.1.2.Synthetic-based
10.4.1.1.3.Water-based
10.4.1.1.4.Others
10.4.1.2.U.S Drilling Fluids Market Revenue (US$ Mn) and Forecasts, By Application
10.4.1.2.1.Onshore
10.4.1.2.2.Offshore
10.4.2.Canada
10.4.2.1.Canada Drilling Fluids Market Revenue (US$ Mn) and Forecasts, By Product
10.4.2.1.1.Oil-based
10.4.2.1.2.Synthetic-based
10.4.2.1.3.Water-based
10.4.2.1.4.Others
10.4.2.2.Canada Drilling Fluids Market Revenue (US$ Mn) and Forecasts, By Application
10.4.2.2.1.Onshore
10.4.2.2.2.Offshore
10.4.3.Mexico
10.4.3.1.Mexico Drilling Fluids Market Revenue (US$ Mn) and Forecasts, By Product
10.4.3.1.1.Oil-based
10.4.3.1.2.Synthetic-based
10.4.3.1.3.Water-based
10.4.3.1.4.Others
10.4.3.2.Mexico Drilling Fluids Market Revenue (US$ Mn) and Forecasts, By Application
10.4.3.2.1.Onshore
10.4.3.2.2.Offshore
10.4.4.Rest of North America
10.4.4.1.Rest of North America Drilling Fluids Market Revenue (US$ Mn) and Forecasts, By Product
10.4.4.1.1.Oil-based
10.4.4.1.2.Synthetic-based
10.4.4.1.3.Water-based
10.4.4.1.4.Others
10.4.4.2.Rest of North America Drilling Fluids Market Revenue (US$ Mn) and Forecasts, By Application
10.4.4.2.1.Onshore
10.4.4.2.2.Offshore
10.5.Key Segment for Channeling Investments
10.5.1.By Country
10.5.2.By Product
10.5.3.By Application
11.Europe Drilling Fluids Market Analysis and Forecasts, 2023 – 2031
11.1.Overview
11.1.1.Europe Drilling Fluids Market Revenue (US$ Mn)
11.2.Europe Drilling Fluids Market Revenue (US$ Mn) and Forecasts, By Product
11.2.1.Oil-based
11.2.2.Synthetic-based
11.2.3.Water-based
11.2.4.Others
11.3.Europe Drilling Fluids Market Revenue (US$ Mn) and Forecasts, By Application
11.3.1.Onshore
11.3.2.Offshore
11.4.Europe Drilling Fluids Market Revenue (US$ Mn) and Forecasts, By Country
11.4.1.France
11.4.1.1.France Drilling Fluids Market Revenue (US$ Mn) and Forecasts, By Product
11.4.1.1.1.Oil-based
11.4.1.1.2.Synthetic-based
11.4.1.1.3.Water-based
11.4.1.1.4.Others
11.4.1.2.France Drilling Fluids Market Revenue (US$ Mn) and Forecasts, By Application
11.4.1.2.1.Onshore
11.4.1.2.2.Offshore
11.4.2.The UK
11.4.2.1.The UK Drilling Fluids Market Revenue (US$ Mn) and Forecasts, By Product
11.4.2.1.1.Oil-based
11.4.2.1.2.Synthetic-based
11.4.2.1.3.Water-based
11.4.2.1.4.Others
11.4.2.2.The UK Drilling Fluids Market Revenue (US$ Mn) and Forecasts, By Application
11.4.2.2.1.Onshore
11.4.2.2.2.Offshore
11.4.3.Spain
11.4.3.1.Spain Drilling Fluids Market Revenue (US$ Mn) and Forecasts, By Product
11.4.3.1.1.Oil-based
11.4.3.1.2.Synthetic-based
11.4.3.1.3.Water-based
11.4.3.1.4.Others
11.4.3.2.Spain Drilling Fluids Market Revenue (US$ Mn) and Forecasts, By Application
11.4.3.2.1.Onshore
11.4.3.2.2.Offshore
11.4.4.Germany
11.4.4.1.Germany Drilling Fluids Market Revenue (US$ Mn) and Forecasts, By Product
11.4.4.1.1.Oil-based
11.4.4.1.2.Synthetic-based
11.4.4.1.3.Water-based
11.4.4.1.4.Others
11.4.4.2.Germany Drilling Fluids Market Revenue (US$ Mn) and Forecasts, By Application
11.4.4.2.1.Onshore
11.4.4.2.2.Offshore
11.4.5.Italy
11.4.5.1.Italy Drilling Fluids Market Revenue (US$ Mn) and Forecasts, By Product
11.4.5.1.1.Oil-based
11.4.5.1.2.Synthetic-based
11.4.5.1.3.Water-based
11.4.5.1.4.Others
11.4.5.2.Italy Drilling Fluids Market Revenue (US$ Mn) and Forecasts, By Application
11.4.5.2.1.Onshore
11.4.5.2.2.Offshore
11.4.6.Nordic Countries
11.4.6.1.Nordic Countries Drilling Fluids Market Revenue (US$ Mn) and Forecasts, By Product
11.4.6.1.1.Oil-based
11.4.6.1.2.Synthetic-based
11.4.6.1.3.Water-based
11.4.6.1.4.Others
11.4.6.2.Nordic Countries Drilling Fluids Market Revenue (US$ Mn) and Forecasts, By Application
11.4.6.2.1.Onshore
11.4.6.2.2.Offshore
11.4.6.3.Nordic Countries Drilling Fluids Market Revenue (US$ Mn) and Forecasts, By Country
11.4.6.3.1.Denmark
11.4.6.3.2.Finland
11.4.6.3.3.Iceland
11.4.6.3.4.Sweden
11.4.6.3.5.Norway
11.4.7.Benelux Union
11.4.7.1.Benelux Union Drilling Fluids Market Revenue (US$ Mn) and Forecasts, By Product
11.4.7.1.1.Oil-based
11.4.7.1.2.Synthetic-based
11.4.7.1.3.Water-based
11.4.7.1.4.Others
11.4.7.2.Benelux Union Drilling Fluids Market Revenue (US$ Mn) and Forecasts, By Application
11.4.7.2.1.Onshore
11.4.7.2.2.Offshore
11.4.7.3.Benelux Union Drilling Fluids Market Revenue (US$ Mn) and Forecasts, By Country
11.4.7.3.1.Belgium
11.4.7.3.2.The Netherlands
11.4.7.3.3.Luxembourg
11.4.8.Rest of Europe
11.4.8.1.Rest of Europe Drilling Fluids Market Revenue (US$ Mn) and Forecasts, By Product
11.4.8.1.1.Oil-based
11.4.8.1.2.Synthetic-based
11.4.8.1.3.Water-based
11.4.8.1.4.Others
11.4.8.2.Rest of Europe Drilling Fluids Market Revenue (US$ Mn) and Forecasts, By Application
11.4.8.2.1.Onshore
11.4.8.2.2.Offshore
11.5.Key Segment for Channeling Investments
11.5.1.By Country
11.5.2.By Product
11.5.3.By Application
12.Asia Pacific Drilling Fluids Market Analysis and Forecasts, 2023 – 2031
12.1.Overview
12.1.1.Asia Pacific Drilling Fluids Market Revenue (US$ Mn)
12.2.Asia Pacific Drilling Fluids Market Revenue (US$ Mn) and Forecasts, By Product
12.2.1.Oil-based
12.2.2.Synthetic-based
12.2.3.Water-based
12.2.4.Others
12.3.Asia Pacific Drilling Fluids Market Revenue (US$ Mn) and Forecasts, By Application
12.3.1.Onshore
12.3.2.Offshore
12.4.Asia Pacific Drilling Fluids Market Revenue (US$ Mn) and Forecasts, By Country
12.4.1.China
12.4.1.1.China Drilling Fluids Market Revenue (US$ Mn) and Forecasts, By Product
12.4.1.1.1.Oil-based
12.4.1.1.2.Synthetic-based
12.4.1.1.3.Water-based
12.4.1.1.4.Others
12.4.1.2.China Drilling Fluids Market Revenue (US$ Mn) and Forecasts, By Application
12.4.1.2.1.Onshore
12.4.1.2.2.Offshore
12.4.2.Japan
12.4.2.1.Japan Drilling Fluids Market Revenue (US$ Mn) and Forecasts, By Product
12.4.2.1.1.Oil-based
12.4.2.1.2.Synthetic-based
12.4.2.1.3.Water-based
12.4.2.1.4.Others
12.4.2.2.Japan Drilling Fluids Market Revenue (US$ Mn) and Forecasts, By Application
12.4.2.2.1.Onshore
12.4.2.2.2.Offshore
12.4.3.India
12.4.3.1.India Drilling Fluids Market Revenue (US$ Mn) and Forecasts, By Product
12.4.3.1.1.Oil-based
12.4.3.1.2.Synthetic-based
12.4.3.1.3.Water-based
12.4.3.1.4.Others
12.4.3.2.India Drilling Fluids Market Revenue (US$ Mn) and Forecasts, By Application
12.4.3.2.1.Onshore
12.4.3.2.2.Offshore
12.4.4.New Zealand
12.4.4.1.New Zealand Drilling Fluids Market Revenue (US$ Mn) and Forecasts, By Product
12.4.4.1.1.Oil-based
12.4.4.1.2.Synthetic-based
12.4.4.1.3.Water-based
12.4.4.1.4.Others
12.4.4.2.New Zealand Drilling Fluids Market Revenue (US$ Mn) and Forecasts, By Application
12.4.4.2.1.Onshore
12.4.4.2.2.Offshore
12.4.5.Australia
12.4.5.1.Australia Drilling Fluids Market Revenue (US$ Mn) and Forecasts, By Product
12.4.5.1.1.Oil-based
12.4.5.1.2.Synthetic-based
12.4.5.1.3.Water-based
12.4.5.1.4.Others
12.4.5.2.Australia Drilling Fluids Market Revenue (US$ Mn) and Forecasts, By Application
12.4.5.2.1.Onshore
12.4.5.2.2.Offshore
12.4.6.South Korea
12.4.6.1.South Korea Drilling Fluids Market Revenue (US$ Mn) and Forecasts, By Product
12.4.6.1.1.Oil-based
12.4.6.1.2.Synthetic-based
12.4.6.1.3.Water-based
12.4.6.1.4.Others
12.4.6.2.South Korea Drilling Fluids Market Revenue (US$ Mn) and Forecasts, By Application
12.4.6.2.1.Onshore
12.4.6.2.2.Offshore
12.4.7.Southeast Asia
12.4.7.1.Southeast Asia Drilling Fluids Market Revenue (US$ Mn) and Forecasts, By Product
12.4.7.1.1.Oil-based
12.4.7.1.2.Synthetic-based
12.4.7.1.3.Water-based
12.4.7.1.4.Others
12.4.7.2.Southeast Asia Drilling Fluids Market Revenue (US$ Mn) and Forecasts, By Application
12.4.7.2.1.Onshore
12.4.7.2.2.Offshore
12.4.7.3.Southeast Asia Drilling Fluids Market Revenue (US$ Mn) and Forecasts, By Country
12.4.7.3.1.Indonesia
12.4.7.3.2.Thailand
12.4.7.3.3.Malaysia
12.4.7.3.4.Singapore
12.4.7.3.5.Rest of Southeast Asia
12.4.8.Rest of Asia Pacific
12.4.8.1.Rest of Asia Pacific Drilling Fluids Market Revenue (US$ Mn) and Forecasts, By Product
12.4.8.1.1.Oil-based
12.4.8.1.2.Synthetic-based
12.4.8.1.3.Water-based
12.4.8.1.4.Others
12.4.8.2.Rest of Asia Pacific Drilling Fluids Market Revenue (US$ Mn) and Forecasts, By Application
12.4.8.2.1.Onshore
12.4.8.2.2.Offshore
12.5.Key Segment for Channeling Investments
12.5.1.By Country
12.5.2.By Product
12.5.3.By Application
13.Middle East and Africa Drilling Fluids Market Analysis and Forecasts, 2023 – 2031
13.1.Overview
13.1.1.Middle East and Africa Drilling Fluids Market Revenue (US$ Mn)
13.2.Middle East and Africa Drilling Fluids Market Revenue (US$ Mn) and Forecasts, By Product
13.2.1.Oil-based
13.2.2.Synthetic-based
13.2.3.Water-based
13.2.4.Others
13.3.Middle East and Africa Drilling Fluids Market Revenue (US$ Mn) and Forecasts, By Application
13.3.1.Onshore
13.3.2.Offshore
13.4.Middle East and Africa Drilling Fluids Market Revenue (US$ Mn) and Forecasts, By Country
13.4.1.Saudi Arabia
13.4.1.1.Saudi Arabia Drilling Fluids Market Revenue (US$ Mn) and Forecasts, By Product
13.4.1.1.1.Oil-based
13.4.1.1.2.Synthetic-based
13.4.1.1.3.Water-based
13.4.1.1.4.Others
13.4.1.2.Saudi Arabia Drilling Fluids Market Revenue (US$ Mn) and Forecasts, By Application
13.4.1.2.1.Onshore
13.4.1.2.2.Offshore
13.4.2.UAE
13.4.2.1.UAE Drilling Fluids Market Revenue (US$ Mn) and Forecasts, By Product
13.4.2.1.1.Oil-based
13.4.2.1.2.Synthetic-based
13.4.2.1.3.Water-based
13.4.2.1.4.Others
13.4.2.2.UAE Drilling Fluids Market Revenue (US$ Mn) and Forecasts, By Application
13.4.2.2.1.Onshore
13.4.2.2.2.Offshore
13.4.3.Egypt
13.4.3.1.Egypt Drilling Fluids Market Revenue (US$ Mn) and Forecasts, By Product
13.4.3.1.1.Oil-based
13.4.3.1.2.Synthetic-based
13.4.3.1.3.Water-based
13.4.3.1.4.Others
13.4.3.2.Egypt Drilling Fluids Market Revenue (US$ Mn) and Forecasts, By Application
13.4.3.2.1.Onshore
13.4.3.2.2.Offshore
13.4.4.Kuwait
13.4.4.1.Kuwait Drilling Fluids Market Revenue (US$ Mn) and Forecasts, By Product
13.4.4.1.1.Oil-based
13.4.4.1.2.Synthetic-based
13.4.4.1.3.Water-based
13.4.4.1.4.Others
13.4.4.2.Kuwait Drilling Fluids Market Revenue (US$ Mn) and Forecasts, By Application
13.4.4.2.1.Onshore
13.4.4.2.2.Offshore
13.4.5.South Africa
13.4.5.1.South Africa Drilling Fluids Market Revenue (US$ Mn) and Forecasts, By Product
13.4.5.1.1.Oil-based
13.4.5.1.2.Synthetic-based
13.4.5.1.3.Water-based
13.4.5.1.4.Others
13.4.5.2.South Africa Drilling Fluids Market Revenue (US$ Mn) and Forecasts, By Application
13.4.5.2.1.Onshore
13.4.5.2.2.Offshore
13.4.6.Rest of Middle East & Africa
13.4.6.1.Rest of Middle East & Africa Drilling Fluids Market Revenue (US$ Mn) and Forecasts, By Product
13.4.6.1.1.Oil-based
13.4.6.1.2.Synthetic-based
13.4.6.1.3.Water-based
13.4.6.1.4.Others
13.4.6.2.Rest of Middle East & Africa Drilling Fluids Market Revenue (US$ Mn) and Forecasts, By Application
13.4.6.2.1.Onshore
13.4.6.2.2.Offshore
13.5.Key Segment for Channeling Investments
13.5.1.By Country
13.5.2.By Product
13.5.3.By Application
14.Latin America Drilling Fluids Market Analysis and Forecasts, 2023 – 2031
14.1.Overview
14.1.1.Latin America Drilling Fluids Market Revenue (US$ Mn)
14.2.Latin America Drilling Fluids Market Revenue (US$ Mn) and Forecasts, By Product
14.2.1.Oil-based
14.2.2.Synthetic-based
14.2.3.Water-based
14.2.4.Others
14.3.Latin America Drilling Fluids Market Revenue (US$ Mn) and Forecasts, By Application
14.3.1.Onshore
14.3.2.Offshore
14.4.Latin America Drilling Fluids Market Revenue (US$ Mn) and Forecasts, By Country
14.4.1.Brazil
14.4.1.1.Brazil Drilling Fluids Market Revenue (US$ Mn) and Forecasts, By Product
14.4.1.1.1.Oil-based
14.4.1.1.2.Synthetic-based
14.4.1.1.3.Water-based
14.4.1.1.4.Others
14.4.1.2.Brazil Drilling Fluids Market Revenue (US$ Mn) and Forecasts, By Application
14.4.1.2.1.Onshore
14.4.1.2.2.Offshore
14.4.2.Argentina
14.4.2.1.Argentina Drilling Fluids Market Revenue (US$ Mn) and Forecasts, By Product
14.4.2.1.1.Oil-based
14.4.2.1.2.Synthetic-based
14.4.2.1.3.Water-based
14.4.2.1.4.Others
14.4.2.2.Argentina Drilling Fluids Market Revenue (US$ Mn) and Forecasts, By Application
14.4.2.2.1.Onshore
14.4.2.2.2.Offshore
14.4.3.Rest of Latin America
14.4.3.1.Rest of Latin America Drilling Fluids Market Revenue (US$ Mn) and Forecasts, By Product
14.4.3.1.1.Oil-based
14.4.3.1.2.Synthetic-based
14.4.3.1.3.Water-based
14.4.3.1.4.Others
14.4.3.2.Rest of Latin America Drilling Fluids Market Revenue (US$ Mn) and Forecasts, By Application
14.4.3.2.1.Onshore
14.4.3.2.2.Offshore
14.5.Key Segment for Channeling Investments
14.5.1.By Country
14.5.2.By Product
14.5.3.By Application
15.Competitive Benchmarking
15.1.Brand Benchmarking
15.2.Market Share Analysis, 2022
15.3.Global Presence and Growth Strategies
15.3.1.Mergers and Acquisitions
15.3.2.Product Launches
15.3.3.Investments Trends
15.3.4.R&D Initiatives
16.Player Profiles
16.1.Baker Hughes Company
16.1.1.Company Details
16.1.2.Company Overview
16.1.3.Product Offerings
16.1.4.Key Developments
16.1.5.Financial Analysis
16.1.6.SWOT Analysis
16.1.7.Business Strategies
16.2.Other Market Participants
17.Key Findings

.

**Exclusive for Multi-User and Enterprise User.

Global Drilling Fluids Market

By Product

 Oil-based
 Synthetic-based
 Water-based
 Others

By Application

 Onshore
 Offshore

By Region

 North America (U.S., Canada, Mexico, Rest of North America)
 Europe (France, The UK, Spain, Germany, Italy, Nordic Countries (Denmark, Finland, Iceland, Sweden, Norway), Benelux Union (Belgium, The Netherlands, Luxembourg), Rest of Europe)
 Asia Pacific (China, Japan, India, New Zealand, Australia, South Korea, Southeast Asia (Indonesia, Thailand, Malaysia, Singapore, Rest of Southeast Asia), Rest of Asia Pacific)
 Middle East & Africa (Saudi Arabia, UAE, Egypt, Kuwait, South Africa, Rest of Middle East & Africa)
 Latin America (Brazil, Argentina, Rest of Latin America)

**Note: The report covers cross-segmentation analysis by region further into countries

.

The Niche Research approach encompasses both primary and secondary research methods to provide comprehensive insights. While primary research is the cornerstone of our studies, we also incorporate secondary research sources such as company annual reports, premium industry databases, press releases, industry journals, and white papers.

Within our primary research, we actively engage with various industry stakeholders, conducting paid interviews and surveys. Our meticulous analysis extends to every market participant in major countries, allowing us to thoroughly examine their portfolios, calculate market shares, and segment revenues.

Our data collection primarily focuses on individual countries within our research scope, enabling us to estimate regional market sizes. Typically, we employ a bottom-up approach, meticulously tracking trends in different countries. We analyze growth drivers, constraints, technological innovations, and opportunities for each country, ultimately arriving at regional figures.Our process begins by examining the growth prospects of each country. Building upon these insights, we project growth and trends for the entire region. Finally, we utilize our proprietary model to refine estimations and forecasts.

Our data validation standards are integral to ensuring the reliability and accuracy of our research findings. Here’s a breakdown of our data validation processes and the stakeholders we engage with during our primary research:

  • Supply Side Analysis: We initiate a supply side analysis by directly contacting market participants, through telephonic interviews and questionnaires containing both open-ended and close-ended questions. We gather information on their portfolios, segment revenues, developments, and growth strategies.
  • Demand Side Analysis: To gain insights into adoption trends and consumer preferences, we reach out to target customers and users (non-vendors). This information forms a vital part of the qualitative analysis section of our reports, covering market dynamics, adoption trends, consumer behavior, spending patterns, and other related aspects.
  • Consultant Insights: We tap into the expertise of our partner consultants from around the world to obtain their unique viewpoints and perspectives. Their insights contribute to a well-rounded understanding of the markets under investigation.
  • In-House Validation: To ensure data accuracy and reliability, we conduct cross-validation of data points and information through our in-house team of consultants and utilize advanced data modeling tools for thorough verification.

The forecasts we provide are based on a comprehensive assessment of various factors, including:

  • Market Trends and Past Performance (Last Five Years): We accurately analyze market trends and performance data from preceding five years to identify historical patterns and understand the market’s evolution.
  • Historical Performance and Growth of Market Participants: We assess the historical performance and growth trajectories of key market participants. This analysis provides insights into the competitive landscape and individual company strategies.
  • Market Determinants Impact Analysis (Next Eight Years): We conduct a rigorous analysis of the factors that are projected to influence the market over the next eight years. This includes assessing both internal and external determinants that can shape market dynamics.
  • Drivers and Challenges for the Forecast Period:Identify the factors expected to drive market growth during the forecast period, as well as the challenges that the industry may face. This analysis aids in deriving an accurate growth rate projection.
  • New Acquisitions, Collaborations, or Partnerships: We keep a close watch on any new acquisitions, collaborations, or partnerships within the industry. These developments can have a significant impact on market dynamics and competitiveness.
  • Macro and Micro Factors Analysis:A thorough examination of both macro-level factors (e.g., economic trends, regulatory changes) and micro-level factors (e.g., technological advancements, consumer preferences) that may influence the market during the forecast period.
  • End-User Sentiment Analysis: To understand the market from the end-user perspective, we conduct sentiment analysis. This involves assessing the sentiment, preferences, and feedback of the end-users, which can provide valuable insights into market trends.
  • Perspective of Primary Participants: Insights gathered directly from primary research participants play a crucial role in shaping our forecasts. Their perspectives and experiences provide valuable qualitative data.
  • Year-on-Year Growth Trend: We utilize a year-on-year growth trend based on historical market growth and expected future trends. This helps in formulating our growth projections, aligning them with the market’s historical performance.

Research process adopted by TNR involves multiple stages, including data collection, validation, quality checks, and presentation. It’s crucial that the data and information we provide add value to your existing market understanding and expertise. We have also established partnerships with business consulting, research, and survey organizations across regions and globally to collaborate on regional analysis and data validation, ensuring the highest level of accuracy and reliability in our reports.


Procure Comprehensive Study of

Global Drilling Fluids Market

Online Only

  • Online Access
  • Read Only File
  • Validity 3 Months
  • Print, Copy, Paste & Download
  • PPT, Excel
  • Cost-Free Report in the Next Update
$3300
Buy Now

Single User

  • Access to One User on One System
  • Read Only File
  • Validity 6 Months
  • Limited Print,Copy, Paste
  • PPT, Excel
  • Cost-Free Report in the Next Update
$4200
Buy Now

Multi User

  • Access to Fiver Users
  • PDF File
  • Validity 1 Year
  • Upto FivePrints
  • Cost-Free Report in the Next Update
  • PPT, Excel
$6000
Buy Now

Enterprise User

  • Access to Unlimited Users
  • PDF, PPT, Excel
  • Unlimited Validity, Prints&Downloads
  • 1 Hour Cost-Free & Dedicated Analyst Support
  • 10% Cost-Free Customization
  • Cost-Free Report Update Twice in a Year
  • Recommendations for Business Strategies
  • Authorization to Quote TNR, The Niche Research
$7300
Buy Now

Library Access

  • Online Access to Content Publications
  • Access Player Profiles Online
  • Get Immediate Access to Newly Added Content
  • Acquire 12 PDF Downloads
  • Acquire 5 Excel Data Sets
  • Gain Access to 290+ PDFs of Company Profiles
  • Round-the-clock Email and Phone Assistance
  • Dashboard Usage and Trends
  • Renewal & Upgrade Assistance
  • Assessing Customization Options and Alerts for New Reports
$10788
Buy Now
*Taxes/Fees, if applicable will be added during checkout. All prices in USD

Why TNR The Niche Research?

  • Unwavering Commitment to Excellence

  • Veteran Team of Researchers

  • Accurate and Timely Insights

  • Ethical Practices and Customized Service

  • Uninterrupted Availability Around the Clock

Scroll to Top