Global Eco-Friendly Water Bottle Market By Material Type, By Application, By Distribution Channel, By Region & Segmental Insights Trends and Forecast, 2024 – 2034

  • Industry: Consumer Goods
  • Report ID: TNR-110-1186
  • Number of Pages: 420
  • Table/Charts : Yes
  • June, 2024
  • Base Year : 2024
  • No. of Companies : 10+
  • No. of Countries : 29
  • Views : 10019
  • Covid Impact Covered: Yes
  • War Impact Covered: Yes
  • Formats : PDF, Excel, PPT

Eco-friendly water bottles are sustainable alternatives to traditional plastic bottles, typically made from materials like stainless steel, glass, or BPA-free plastics. They aim to reduce single-use plastic waste, promoting environmental conservation and personal health. The eco-friendly water bottle market is expanding rapidly due to growing environmental awareness and regulatory efforts to reduce plastic pollution. Consumers increasingly prioritize eco-friendly products, boosting demand for durable, reusable bottles. Trends include innovations in lightweight materials, ergonomic designs, and personalized customization options. Key opportunities lie in catering to niche markets like fitness enthusiasts, travellers, and environmentally-conscious consumers seeking stylish yet sustainable hydration solutions.

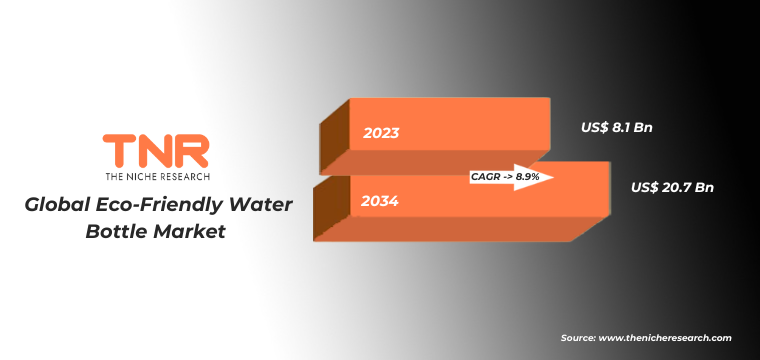
Heightened consumer consciousness about environmental impact, supported by initiatives promoting recycling and sustainability are some of the growth drivers accelerating the market growth. Additionally, technological advancements in materials and manufacturing processes enhance product durability and functionality. Market expansion is further fuelled by collaborations between industry players and environmental organizations, aiming to educate consumers and drive adoption of eco-friendly alternatives. Overall, the eco-friendly water bottle market presents robust growth prospects driven by sustainability trends and consumer preferences for eco-conscious products. In terms of revenue, the global eco-friendly water bottle market was worth US$ 8.1 Bn in 2023, anticipated to witness a CAGR of 8.9% during 2024 – 2034.

Trends in the Global Eco-Friendly Water Bottle Market 

Innovation in Materials and Design- The global eco-friendly water bottle market is witnessing a significant trend towards innovation in materials and design. Manufacturers are increasingly focusing on developing bottles from sustainable materials such as biodegradable plastics, and plant-based polymers. For instance, In June 2021, Takeya Originals introduced a line of insulated water bottles crafted from recycled plastics, designed to maintain beverages cold for up to 24 hours. These materials offer enhanced durability and eco-friendly credentials, appealing to environmentally-conscious consumers. Design innovation plays a crucial role, with emphasis on ergonomic shapes, leak-proof mechanisms, and aesthetic appeal. Customization options, including personalized prints and modular components, cater to diverse consumer preferences. This trend not only addresses environmental concerns by reducing plastic waste but also enhances product functionality and attractiveness in the market.

Rising Adoption in Corporate and Promotional Sectors- Businesses are increasingly incorporating eco-friendly initiatives into their corporate social responsibility (CSR) strategies, including replacing disposable plastic bottles with reusable alternatives. Promotional campaigns and corporate gifting programs often feature customized eco-friendly water bottles, promoting sustainability while enhancing brand image. This trend is driven by heightened awareness among businesses and consumers regarding environmental impact, coupled with regulatory pressures to minimize plastic waste. As a result, manufacturers are expanding their product offerings to cater specifically to corporate clients, offering bulk discounts, branding opportunities, and customization options. This trend not only supports sustainability goals but also opens up new avenues for market growth and product innovation in the eco-friendly sector.

Global Eco-Friendly Water Bottle Market Revenue & Forecast, (US$ Million), 2016 – 2034

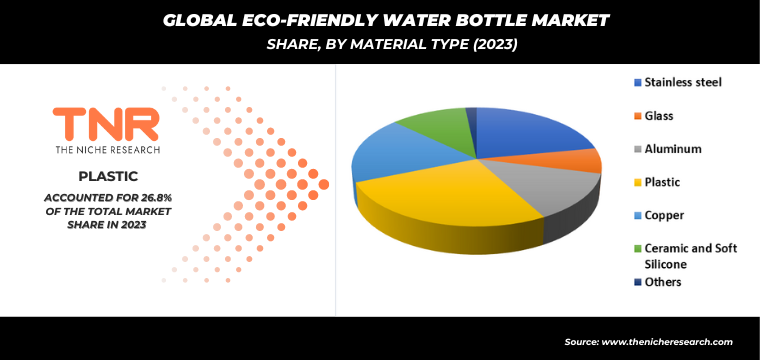
Ceramic and soft silicone segment by material type have seen a surge in popularity recently, emerging as the fastest-growing segment in the global eco-friendly water bottle market. Ceramic bottles appeal to consumers seeking sustainable alternatives with a unique aesthetic appeal and robust durability. They are valued for their heat retention properties and inert nature, which ensures the purity of beverages without imparting flavors or odors. On the other hand, soft silicone bottles are gaining traction due to their flexibility, lightweight nature, and resistance to breakage. These bottles often feature collapsible designs, making them highly portable and convenient for travellers and outdoor enthusiasts. The growing preference for these materials reflects a broader trend towards diversifying eco-friendly options in response to consumer demand for both functionality and sustainability in hydration solutions. As these segments continue to innovate and expand their product offerings, they are poised to play a significant role in shaping the future of eco-friendly water bottle choices globally.

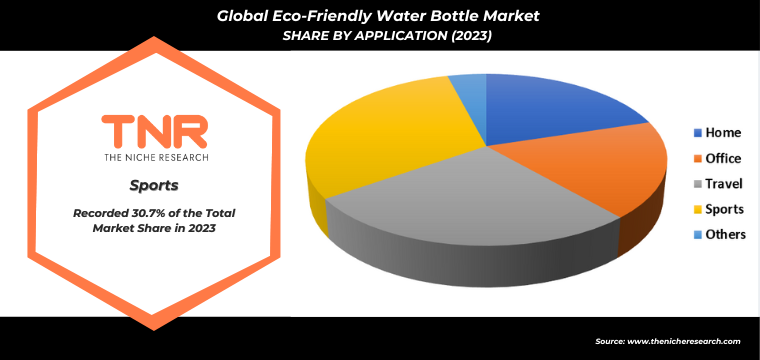
In 2023, travel segment by application led the global eco-friendly water bottle market, commanding a significant revenue share of 26.8%. This dominance underscores a growing trend among travellers to opt for sustainable hydration solutions that reduce environmental impact while providing convenience and durability on the go. Travelers increasingly prioritize eco-friendly water bottles due to their portability, leak-proof designs, and ability to keep beverages at desirable temperatures. These bottles are often made from materials like stainless steel, BPA-free plastics, or glass, ensuring they meet both safety and sustainability standards. Factors driving this segment’s growth include heightened environmental awareness, regulatory initiatives promoting sustainable practices, and a shift towards eco-conscious consumer behaviour worldwide. As the travel industry continues to recover and expand post-pandemic, the demand for eco-friendly water bottles is expected to remain robust, prompting manufacturers to innovate further in materials, designs, and functionality to cater to this evolving market segment.

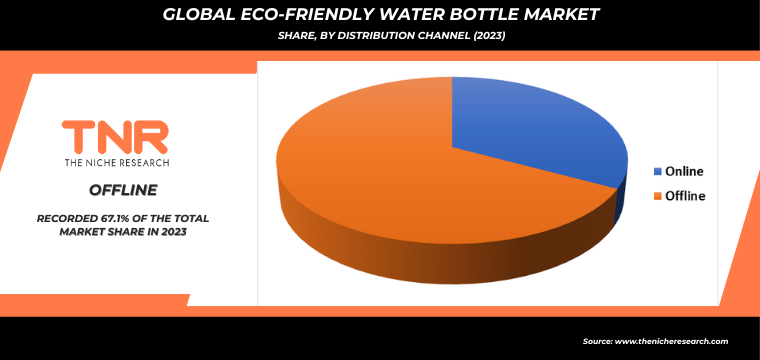
In 2023, offline segment by distribution channel achieved the highest share in the global eco-friendly water bottle market. Offline channels offer advantages such as tactile experiences, immediate availability, and personalized customer service, which are particularly appealing to consumers when choosing reusable water bottles. These outlets often feature a diverse range of products, allowing consumers to compare materials, sizes, and designs before making a purchase decision. Moreover, offline channels facilitate brand visibility through strategic placement and promotional activities, enhancing consumer trust and brand loyalty. While online sales have also grown significantly, especially driven by convenience and e-commerce platforms, the offline segment’s leadership underscores the enduring preference for hands-on shopping experiences and the importance of physical retail in shaping consumer behaviour in the eco-friendly product market.

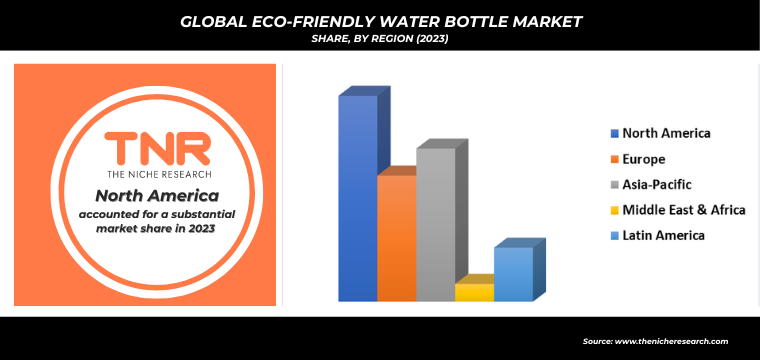
Asia Pacific is anticipated as the fastest growing region during the forecast timeline capturing a substantial revenue share of 27.5% in 2023. This growth is driven by increasing awareness of environmental issues, rising disposable incomes, and shifting consumer preferences towards sustainable products across countries like China, India, Japan, and Southeast Asia. Factors contributing to this expansion include government initiatives promoting eco-friendly practices, stringent regulations against single-use plastics, and a growing urban population seeking convenient yet sustainable hydration solutions. Manufacturers are increasingly focusing on this region to capitalize on the expanding consumer base and favourable market conditions. Moreover, innovations in materials, designs, and distribution strategies tailored to local preferences and lifestyles are fuelling market penetration. As Asia Pacific continues to urbanize and adopt sustainable lifestyles, the demand for eco-friendly water bottles is expected to grow, positioning the region as a pivotal market driver in the global landscape.

Competitive Landscape

The competitive landscape of the eco-friendly water bottle market is dynamic, driven by sustainability trends and consumer demand for reusable alternatives. Key players emphasize innovation in materials, design, and eco-friendly credentials to capture market share. Challenges include pricing pressures and regulatory compliance, shaping a competitive yet evolving market environment.

Some of the players operating in the eco-friendly water bottle market are

  • AquaAF
  • BOTTLE UP
  • Bluewater
  • CanO Water Ltd
  • Chilly’s
  • Ello Products
  • frank green
  • Hydro Flask
  • JUST Goods, Inc.
  • Rockay
  • Soma
  • SOURCE Global, PBC
  • Other Industry Participants

Global Eco-Friendly Water Bottle Market Scope

Report Specifications Details
Market Revenue in 2023 US$ 8.1 Bn
Market Size Forecast by 2034 US$ 20.7 Bn
Growth Rate (CAGR) 8.9%
Historic Data 2016 – 2022
Base Year for Estimation 2023
Forecast Period 2024 – 2034
Report Inclusions Market Size & Estimates, Market Dynamics, Competitive Scenario, Trends, Growth Factors, Market Determinants, Key Investment Segmentation, Product/Service/Solutions Benchmarking
Segments Covered By Material Type, By Application, By Distribution Channel, By Region
Regions Covered North America, Europe, Asia Pacific, Middle East & Africa, Latin America
Countries Covered U.S., Canada, Mexico, Rest of North America,  France, The UK, Spain, Germany, Italy, Nordic Countries (Denmark, Finland, Iceland, Sweden, Norway), Benelux Union (Belgium, The Netherlands, Luxembourg), Rest of Europe,  China, Japan, India, New Zealand, Australia, South Korea, Southeast Asia (Indonesia, Thailand, Malaysia, Singapore, Rest of Southeast Asia), Rest of Asia Pacific,  Saudi Arabia, UAE, Egypt, Kuwait, South Africa, Rest of Middle East & Africa,  Brazil, Argentina, Rest of Latin America
Key Players AquaAF, BOTTLE UP, Bluewater, CanO Water Ltd, Chilly’s, Ello Products, frank green, Hydro Flask, JUST Goods, Inc., Rockay, Soma, SOURCE Global, PBC
Customization Scope Customization allows for the inclusion/modification of content pertaining to geographical regions, countries, and specific market segments.
Pricing & Procurement Options Explore purchase options tailored to your specific research requirements
Contact Details Consult With Our Expert

Japan (Toll-Free):  +81 663-386-8111

South Korea (Toll-Free):  +82-808- 703-126

Saudi Arabia (Toll-Free):  +966 800-850-1643

United Kingdom: +44 753-710-5080

United States: +1 302-232-5106

E-mail:  askanexpert@thenicheresearch.com


Global Eco-Friendly Water Bottle Market

By Material Type

  • Stainless steel
  • Glass
  • Aluminum
  • Plastic
  • Copper
  • Ceramic and Soft Silicone
  • Others

By Application

  • Home
  • Office
  • Travel
  • Sports
  • Others

By Distribution Channel

  • Online
  • Offline
    • Supermarkets And Hypermarkets
    • Specialty Stores
    • Others

By Region

  • North America (U.S., Canada, Mexico, Rest of North America)
  • Europe (France, The UK, Spain, Germany, Italy, Nordic Countries (Denmark, Finland, Iceland, Sweden, Norway), Benelux Union (Belgium, The Netherlands, Luxembourg), Rest of Europe)
  • Asia Pacific (China, Japan, India, New Zealand, Australia, South Korea, Southeast Asia (Indonesia, Thailand, Malaysia, Singapore, Rest of Southeast Asia), Rest of Asia Pacific)
  • Middle East & Africa (Saudi Arabia, UAE, Egypt, Kuwait, South Africa, Rest of Middle East & Africa)
  • Latin America (Brazil, Argentina, Rest of Latin America)

Report Layout:

Table of Contents

.

1.Market Scope
1.1.Market Segmentation
1.2.Years Considered
1.2.1.Historic Years: 2016 – 2022
1.2.2.Base Year: 2023
1.2.3.Forecast Years: 2024 – 2034
2.Key Target Audiences
3.Research Methodology
3.1.Primary Research
3.1.1.Research Questionnaire
3.1.2.Global Percentage Breakdown
3.1.3.Primary Interviews: Key Opinion Leaders (KOLs)
3.2.Secondary Research
3.2.1.Paid Databases
3.2.2.Secondary Sources
3.3.Market Size Estimates
3.3.1.Top-Down Approach
3.3.2.Bottom-Up Approach
3.4.Data Triangulation Methodology
3.5.Research Assumptions
4.Recommendations and Insights from TNR’s Perspective**
5.Holistic Overview of Eco-Friendly Water Bottle Market
6.Market Synopsis: Eco-Friendly Water Bottle Market
7.Eco-Friendly Water Bottle Market Analysis: Qualitative Perspective
7.1.Introduction
7.1.1.Product Definition
7.1.2.Industry Development
7.2.Market Dynamics
7.2.1.Drivers
7.2.2.Restraints
7.2.3.Opportunities
7.2.4.Challenges
7.3.Trends in Eco-Friendly Water Bottle Market
7.4.Market Determinants Radar Chart
7.5.Macro-Economic and Micro-Economic Indicators: Eco-Friendly Water Bottle Market
7.6.Industry Gross Margin Overview
7.7.Porter’s Five Force Analysis
7.8.Impact of Covid-19 on Eco-Friendly Water Bottle Market
7.9.PESTEL Analysis
7.10.Value Chain Analysis
7.11.Pricing Analysis, By Region (2023)
7.11.1.North America
7.11.2.Europe
7.11.3.Asia Pacific
7.11.4.Middle East and Africa
7.11.5.Latin America
8.Global Eco-Friendly Water Bottle Market Analysis and Forecasts, 2024 – 2034
8.1.Overview
8.1.1.Global Eco-Friendly Water Bottle Market Revenue (US$ Mn)
8.2.Global Eco-Friendly Water Bottle Market Revenue (US$ Mn) and Forecasts, By Material Type
8.2.1.Stainless steel
8.2.1.1.Definition
8.2.1.2.Market Estimation and Penetration, 2016 – 2023
8.2.1.3.Market Forecast, 2024 – 2034
8.2.1.4.Compound Annual Growth Rate (CAGR)
8.2.1.5.Regional Bifurcation
8.2.1.5.1.North America
8.2.1.5.1.1.Market Estimation, 2016 – 2023
8.2.1.5.1.2.Market Forecast, 2024 – 2034
8.2.1.5.2.Europe
8.2.1.5.2.1.Market Estimation, 2016 – 2023
8.2.1.5.2.2.Market Forecast, 2024 – 2034
8.2.1.5.3.Asia Pacific
8.2.1.5.3.1.Market Estimation, 2016 – 2023
8.2.1.5.3.2.Market Forecast, 2024 – 2034
8.2.1.5.4.Middle East and Africa
8.2.1.5.4.1.Market Estimation, 2016 – 2023
8.2.1.5.4.2.Market Forecast, 2024 – 2034
8.2.1.5.5.Latin America
8.2.1.5.5.1.Market Estimation, 2016 – 2023
8.2.1.5.5.2.Market Forecast, 2024 – 2034
8.2.2.Glass
8.2.2.1.Definition
8.2.2.2.Market Estimation and Penetration, 2016 – 2023
8.2.2.3.Market Forecast, 2024 – 2034
8.2.2.4.Compound Annual Growth Rate (CAGR)
8.2.2.5.Regional Bifurcation
8.2.2.5.1.North America
8.2.2.5.1.1.Market Estimation, 2016 – 2023
8.2.2.5.1.2.Market Forecast, 2024 – 2034
8.2.2.5.2.Europe
8.2.2.5.2.1.Market Estimation, 2016 – 2023
8.2.2.5.2.2.Market Forecast, 2024 – 2034
8.2.2.5.3.Asia Pacific
8.2.2.5.3.1.Market Estimation, 2016 – 2023
8.2.2.5.3.2.Market Forecast, 2024 – 2034
8.2.2.5.4.Middle East and Africa
8.2.2.5.4.1.Market Estimation, 2016 – 2023
8.2.2.5.4.2.Market Forecast, 2024 – 2034
8.2.2.5.5.Latin America
8.2.2.5.5.1.Market Estimation, 2016 – 2023
8.2.2.5.5.2.Market Forecast, 2024 – 2034
8.2.3.Aluminum
8.2.3.1.Definition
8.2.3.2.Market Estimation and Penetration, 2016 – 2023
8.2.3.3.Market Forecast, 2024 – 2034
8.2.3.4.Compound Annual Growth Rate (CAGR)
8.2.3.5.Regional Bifurcation
8.2.3.5.1.North America
8.2.3.5.1.1.Market Estimation, 2016 – 2023
8.2.3.5.1.2.Market Forecast, 2024 – 2034
8.2.3.5.2.Europe
8.2.3.5.2.1.Market Estimation, 2016 – 2023
8.2.3.5.2.2.Market Forecast, 2024 – 2034
8.2.3.5.3.Asia Pacific
8.2.3.5.3.1.Market Estimation, 2016 – 2023
8.2.3.5.3.2.Market Forecast, 2024 – 2034
8.2.3.5.4.Middle East and Africa
8.2.3.5.4.1.Market Estimation, 2016 – 2023
8.2.3.5.4.2.Market Forecast, 2024 – 2034
8.2.3.5.5.Latin America
8.2.3.5.5.1.Market Estimation, 2016 – 2023
8.2.3.5.5.2.Market Forecast, 2024 – 2034
8.2.4.Plastic
8.2.4.1.Definition
8.2.4.2.Market Estimation and Penetration, 2016 – 2023
8.2.4.3.Market Forecast, 2024 – 2034
8.2.4.4.Compound Annual Growth Rate (CAGR)
8.2.4.5.Regional Bifurcation
8.2.4.5.1.North America
8.2.4.5.1.1.Market Estimation, 2016 – 2023
8.2.4.5.1.2.Market Forecast, 2024 – 2034
8.2.4.5.2.Europe
8.2.4.5.2.1.Market Estimation, 2016 – 2023
8.2.4.5.2.2.Market Forecast, 2024 – 2034
8.2.4.5.3.Asia Pacific
8.2.4.5.3.1.Market Estimation, 2016 – 2023
8.2.4.5.3.2.Market Forecast, 2024 – 2034
8.2.4.5.4.Middle East and Africa
8.2.4.5.4.1.Market Estimation, 2016 – 2023
8.2.4.5.4.2.Market Forecast, 2024 – 2034
8.2.4.5.5.Latin America
8.2.4.5.5.1.Market Estimation, 2016 – 2023
8.2.4.5.5.2.Market Forecast, 2024 – 2034
8.2.5.Copper
8.2.5.1.Definition
8.2.5.2.Market Estimation and Penetration, 2016 – 2023
8.2.5.3.Market Forecast, 2024 – 2034
8.2.5.4.Compound Annual Growth Rate (CAGR)
8.2.5.5.Regional Bifurcation
8.2.5.5.1.North America
8.2.5.5.1.1.Market Estimation, 2016 – 2023
8.2.5.5.1.2.Market Forecast, 2024 – 2034
8.2.5.5.2.Europe
8.2.5.5.2.1.Market Estimation, 2016 – 2023
8.2.5.5.2.2.Market Forecast, 2024 – 2034
8.2.5.5.3.Asia Pacific
8.2.5.5.3.1.Market Estimation, 2016 – 2023
8.2.5.5.3.2.Market Forecast, 2024 – 2034
8.2.5.5.4.Middle East and Africa
8.2.5.5.4.1.Market Estimation, 2016 – 2023
8.2.5.5.4.2.Market Forecast, 2024 – 2034
8.2.5.5.5.Latin America
8.2.5.5.5.1.Market Estimation, 2016 – 2023
8.2.5.5.5.2.Market Forecast, 2024 – 2034
8.2.6.Ceramic and Soft Silicone
8.2.6.1.Definition
8.2.6.2.Market Estimation and Penetration, 2016 – 2023
8.2.6.3.Market Forecast, 2024 – 2034
8.2.6.4.Compound Annual Growth Rate (CAGR)
8.2.6.5.Regional Bifurcation
8.2.6.5.1.North America
8.2.6.5.1.1.Market Estimation, 2016 – 2023
8.2.6.5.1.2.Market Forecast, 2024 – 2034
8.2.6.5.2.Europe
8.2.6.5.2.1.Market Estimation, 2016 – 2023
8.2.6.5.2.2.Market Forecast, 2024 – 2034
8.2.6.5.3.Asia Pacific
8.2.6.5.3.1.Market Estimation, 2016 – 2023
8.2.6.5.3.2.Market Forecast, 2024 – 2034
8.2.6.5.4.Middle East and Africa
8.2.6.5.4.1.Market Estimation, 2016 – 2023
8.2.6.5.4.2.Market Forecast, 2024 – 2034
8.2.6.5.5.Latin America
8.2.6.5.5.1.Market Estimation, 2016 – 2023
8.2.6.5.5.2.Market Forecast, 2024 – 2034
8.2.7.Others
8.2.7.1.Definition
8.2.7.2.Market Estimation and Penetration, 2016 – 2023
8.2.7.3.Market Forecast, 2024 – 2034
8.2.7.4.Compound Annual Growth Rate (CAGR)
8.2.7.5.Regional Bifurcation
8.2.7.5.1.North America
8.2.7.5.1.1.Market Estimation, 2016 – 2023
8.2.7.5.1.2.Market Forecast, 2024 – 2034
8.2.7.5.2.Europe
8.2.7.5.2.1.Market Estimation, 2016 – 2023
8.2.7.5.2.2.Market Forecast, 2024 – 2034
8.2.7.5.3.Asia Pacific
8.2.7.5.3.1.Market Estimation, 2016 – 2023
8.2.7.5.3.2.Market Forecast, 2024 – 2034
8.2.7.5.4.Middle East and Africa
8.2.7.5.4.1.Market Estimation, 2016 – 2023
8.2.7.5.4.2.Market Forecast, 2024 – 2034
8.2.7.5.5.Latin America
8.2.7.5.5.1.Market Estimation, 2016 – 2023
8.2.7.5.5.2.Market Forecast, 2024 – 2034
8.3.Key Segment for Channeling Investments
8.3.1.By Material Type
9.Global Eco-Friendly Water Bottle Market Analysis and Forecasts, 2024 – 2034
9.1.Overview
9.2.Global Eco-Friendly Water Bottle Market Revenue (US$ Mn) and Forecasts, By Application
9.2.1.Home
9.2.1.1.Definition
9.2.1.2.Market Estimation and Penetration, 2016 – 2023
9.2.1.3.Market Forecast, 2024 – 2034
9.2.1.4.Compound Annual Growth Rate (CAGR)
9.2.1.5.Regional Bifurcation
9.2.1.5.1.North America
9.2.1.5.1.1.Market Estimation, 2016 – 2023
9.2.1.5.1.2.Market Forecast, 2024 – 2034
9.2.1.5.2.Europe
9.2.1.5.2.1.Market Estimation, 2016 – 2023
9.2.1.5.2.2.Market Forecast, 2024 – 2034
9.2.1.5.3.Asia Pacific
9.2.1.5.3.1.Market Estimation, 2016 – 2023
9.2.1.5.3.2.Market Forecast, 2024 – 2034
9.2.1.5.4.Middle East and Africa
9.2.1.5.4.1.Market Estimation, 2016 – 2023
9.2.1.5.4.2.Market Forecast, 2024 – 2034
9.2.1.5.5.Latin America
9.2.1.5.5.1.Market Estimation, 2016 – 2023
9.2.1.5.5.2.Market Forecast, 2024 – 2034
9.2.2.Office
9.2.2.1.Definition
9.2.2.2.Market Estimation and Penetration, 2016 – 2023
9.2.2.3.Market Forecast, 2024 – 2034
9.2.2.4.Compound Annual Growth Rate (CAGR)
9.2.2.5.Regional Bifurcation
9.2.2.5.1.North America
9.2.2.5.1.1.Market Estimation, 2016 – 2023
9.2.2.5.1.2.Market Forecast, 2024 – 2034
9.2.2.5.2.Europe
9.2.2.5.2.1.Market Estimation, 2016 – 2023
9.2.2.5.2.2.Market Forecast, 2024 – 2034
9.2.2.5.3.Asia Pacific
9.2.2.5.3.1.Market Estimation, 2016 – 2023
9.2.2.5.3.2.Market Forecast, 2024 – 2034
9.2.2.5.4.Middle East and Africa
9.2.2.5.4.1.Market Estimation, 2016 – 2023
9.2.2.5.4.2.Market Forecast, 2024 – 2034
9.2.2.5.5.Latin America
9.2.2.5.5.1.Market Estimation, 2016 – 2023
9.2.2.5.5.2.Market Forecast, 2024 – 2034
9.2.3.Travel
9.2.3.1.Definition
9.2.3.2.Market Estimation and Penetration, 2016 – 2023
9.2.3.3.Market Forecast, 2024 – 2034
9.2.3.4.Compound Annual Growth Rate (CAGR)
9.2.3.5.Regional Bifurcation
9.2.3.5.1.North America
9.2.3.5.1.1.Market Estimation, 2016 – 2023
9.2.3.5.1.2.Market Forecast, 2024 – 2034
9.2.3.5.2.Europe
9.2.3.5.2.1.Market Estimation, 2016 – 2023
9.2.3.5.2.2.Market Forecast, 2024 – 2034
9.2.3.5.3.Asia Pacific
9.2.3.5.3.1.Market Estimation, 2016 – 2023
9.2.3.5.3.2.Market Forecast, 2024 – 2034
9.2.3.5.4.Middle East and Africa
9.2.3.5.4.1.Market Estimation, 2016 – 2023
9.2.3.5.4.2.Market Forecast, 2024 – 2034
9.2.3.5.5.Latin America
9.2.3.5.5.1.Market Estimation, 2016 – 2023
9.2.3.5.5.2.Market Forecast, 2024 – 2034
9.2.4.Sports
9.2.4.1.Definition
9.2.4.2.Market Estimation and Penetration, 2016 – 2023
9.2.4.3.Market Forecast, 2024 – 2034
9.2.4.4.Compound Annual Growth Rate (CAGR)
9.2.4.5.Regional Bifurcation
9.2.4.5.1.North America
9.2.4.5.1.1.Market Estimation, 2016 – 2023
9.2.4.5.1.2.Market Forecast, 2024 – 2034
9.2.4.5.2.Europe
9.2.4.5.2.1.Market Estimation, 2016 – 2023
9.2.4.5.2.2.Market Forecast, 2024 – 2034
9.2.4.5.3.Asia Pacific
9.2.4.5.3.1.Market Estimation, 2016 – 2023
9.2.4.5.3.2.Market Forecast, 2024 – 2034
9.2.4.5.4.Middle East and Africa
9.2.4.5.4.1.Market Estimation, 2016 – 2023
9.2.4.5.4.2.Market Forecast, 2024 – 2034
9.2.4.5.5.Latin America
9.2.4.5.5.1.Market Estimation, 2016 – 2023
9.2.4.5.5.2.Market Forecast, 2024 – 2034
9.2.5.Others
9.2.5.1.Definition
9.2.5.2.Market Estimation and Penetration, 2016 – 2023
9.2.5.3.Market Forecast, 2024 – 2034
9.2.5.4.Compound Annual Growth Rate (CAGR)
9.2.5.5.Regional Bifurcation
9.2.5.5.1.North America
9.2.5.5.1.1.Market Estimation, 2016 – 2023
9.2.5.5.1.2.Market Forecast, 2024 – 2034
9.2.5.5.2.Europe
9.2.5.5.2.1.Market Estimation, 2016 – 2023
9.2.5.5.2.2.Market Forecast, 2024 – 2034
9.2.5.5.3.Asia Pacific
9.2.5.5.3.1.Market Estimation, 2016 – 2023
9.2.5.5.3.2.Market Forecast, 2024 – 2034
9.2.5.5.4.Middle East and Africa
9.2.5.5.4.1.Market Estimation, 2016 – 2023
9.2.5.5.4.2.Market Forecast, 2024 – 2034
9.2.5.5.5.Latin America
9.2.5.5.5.1.Market Estimation, 2016 – 2023
9.2.5.5.5.2.Market Forecast, 2024 – 2034
9.3.Key Segment for Channeling Investments
9.3.1.By Application
10.Global Eco-Friendly Water Bottle Market Analysis and Forecasts, 2024 – 2034
10.1.Overview
10.2.Global Eco-Friendly Water Bottle Market Revenue (US$ Mn) and Forecasts, By Distribution Channel
10.2.1.Online
10.2.1.1.Definition
10.2.1.2.Market Estimation and Penetration, 2016 – 2023
10.2.1.3.Market Forecast, 2024 – 2034
10.2.1.4.Compound Annual Growth Rate (CAGR)
10.2.1.5.Regional Bifurcation
10.2.1.5.1.North America
10.2.1.5.1.1.Market Estimation, 2016 – 2023
10.2.1.5.1.2.Market Forecast, 2024 – 2034
10.2.1.5.2.Europe
10.2.1.5.2.1.Market Estimation, 2016 – 2023
10.2.1.5.2.2.Market Forecast, 2024 – 2034
10.2.1.5.3.Asia Pacific
10.2.1.5.3.1.Market Estimation, 2016 – 2023
10.2.1.5.3.2.Market Forecast, 2024 – 2034
10.2.1.5.4.Middle East and Africa
10.2.1.5.4.1.Market Estimation, 2016 – 2023
10.2.1.5.4.2.Market Forecast, 2024 – 2034
10.2.1.5.5.Latin America
10.2.1.5.5.1.Market Estimation, 2016 – 2023
10.2.1.5.5.2.Market Forecast, 2024 – 2034
10.2.2.Offline
10.2.2.1.Definition
10.2.2.2.Market Estimation and Penetration, 2016 – 2023
10.2.2.3.Market Forecast, 2024 – 2034
10.2.2.4.Compound Annual Growth Rate (CAGR)
10.2.2.5.Regional Bifurcation
10.2.2.5.1.North America
10.2.2.5.1.1.Market Estimation, 2016 – 2023
10.2.2.5.1.2.Market Forecast, 2024 – 2034
10.2.2.5.2.Europe
10.2.2.5.2.1.Market Estimation, 2016 – 2023
10.2.2.5.2.2.Market Forecast, 2024 – 2034
10.2.2.5.3.Asia Pacific
10.2.2.5.3.1.Market Estimation, 2016 – 2023
10.2.2.5.3.2.Market Forecast, 2024 – 2034
10.2.2.5.4.Middle East and Africa
10.2.2.5.4.1.Market Estimation, 2016 – 2023
10.2.2.5.4.2.Market Forecast, 2024 – 2034
10.2.2.5.5.Latin America
10.2.2.5.5.1.Market Estimation, 2016 – 2023
10.2.2.5.5.2.Market Forecast, 2024 – 2034
10.3.Key Segment for Channeling Investments
10.3.1.By Distribution Channel
11.North America Eco-Friendly Water Bottle Market Analysis and Forecasts, 2024 – 2034
11.1.Overview
11.1.1.North America Eco-Friendly Water Bottle Market Revenue (US$ Mn)
11.2.North America Eco-Friendly Water Bottle Market Revenue (US$ Mn) and Forecasts, By Material Type
11.2.1.Stainless steel
11.2.2.Glass
11.2.3.Aluminum
11.2.4.Plastic
11.2.5.Copper
11.2.6.Ceramic and Soft Silicone
11.2.7.Others
11.3.North America Eco-Friendly Water Bottle Market Revenue (US$ Mn) and Forecasts, By Application
11.3.1.Home
11.3.2.Office
11.3.3.Travel
11.3.4.Sports
11.3.5.Others
11.4.North America Eco-Friendly Water Bottle Market Revenue (US$ Mn) and Forecasts, By Distribution Channel
11.4.1.Online
11.4.2.Offline
11.5.North America Eco-Friendly Water Bottle Market Revenue (US$ Mn) and Forecasts, By Country
11.5.1.U.S
11.5.1.1.U.S Eco-Friendly Water Bottle Market Revenue (US$ Mn) and Forecasts, By Material Type
11.5.1.1.1.Stainless steel
11.5.1.1.2.Glass
11.5.1.1.3.Aluminum
11.5.1.1.4.Plastic
11.5.1.1.5.Copper
11.5.1.1.6.Ceramic and Soft Silicone
11.5.1.1.7.Others
11.5.1.2.U.S Eco-Friendly Water Bottle Market Revenue (US$ Mn) and Forecasts, By Application
11.5.1.2.1.Home
11.5.1.2.2.Office
11.5.1.2.3.Travel
11.5.1.2.4.Sports
11.5.1.2.5.Others
11.5.1.3.U.S Eco-Friendly Water Bottle Market Revenue (US$ Mn) and Forecasts, By Distribution Channel
11.5.1.3.1.Online
11.5.1.3.2.Offline
11.5.2.Canada
11.5.2.1.Canada Eco-Friendly Water Bottle Market Revenue (US$ Mn) and Forecasts, By Material Type
11.5.2.1.1.Stainless steel
11.5.2.1.2.Glass
11.5.2.1.3.Aluminum
11.5.2.1.4.Plastic
11.5.2.1.5.Copper
11.5.2.1.6.Ceramic and Soft Silicone
11.5.2.1.7.Others
11.5.2.2.Canada Eco-Friendly Water Bottle Market Revenue (US$ Mn) and Forecasts, By Application
11.5.2.2.1.Home
11.5.2.2.2.Office
11.5.2.2.3.Travel
11.5.2.2.4.Sports
11.5.2.2.5.Others
11.5.2.3.Canada Eco-Friendly Water Bottle Market Revenue (US$ Mn) and Forecasts, By Distribution Channel
11.5.2.3.1.Online
11.5.2.3.2.Offline
11.5.3.Mexico
11.5.3.1.Mexico Eco-Friendly Water Bottle Market Revenue (US$ Mn) and Forecasts, By Material Type
11.5.3.1.1.Stainless steel
11.5.3.1.2.Glass
11.5.3.1.3.Aluminum
11.5.3.1.4.Plastic
11.5.3.1.5.Copper
11.5.3.1.6.Ceramic and Soft Silicone
11.5.3.1.7.Others
11.5.3.2.Mexico Eco-Friendly Water Bottle Market Revenue (US$ Mn) and Forecasts, By Application
11.5.3.2.1.Home
11.5.3.2.2.Office
11.5.3.2.3.Travel
11.5.3.2.4.Sports
11.5.3.2.5.Others
11.5.3.3.Mexico Eco-Friendly Water Bottle Market Revenue (US$ Mn) and Forecasts, By Distribution Channel
11.5.3.3.1.Online
11.5.3.3.2.Offline
11.5.4.Rest of North America
11.5.4.1.Rest of North America Eco-Friendly Water Bottle Market Revenue (US$ Mn) and Forecasts, By Material Type
11.5.4.1.1.Stainless steel
11.5.4.1.2.Glass
11.5.4.1.3.Aluminum
11.5.4.1.4.Plastic
11.5.4.1.5.Copper
11.5.4.1.6.Ceramic and Soft Silicone
11.5.4.1.7.Others
11.5.4.2.Rest of North America Eco-Friendly Water Bottle Market Revenue (US$ Mn) and Forecasts, By Application
11.5.4.2.1.Home
11.5.4.2.2.Office
11.5.4.2.3.Travel
11.5.4.2.4.Sports
11.5.4.2.5.Others
11.5.4.3.Rest of North America Eco-Friendly Water Bottle Market Revenue (US$ Mn) and Forecasts, By Distribution Channel
11.5.4.3.1.Online
11.5.4.3.2.Offline
11.6.Key Segment for Channeling Investments
11.6.1.By Country
11.6.2.By Material Type
11.6.3.By Application
11.6.4.By Distribution Channel
12.Europe Eco-Friendly Water Bottle Market Analysis and Forecasts, 2024 – 2034
12.1.Overview
12.1.1.Europe Eco-Friendly Water Bottle Market Revenue (US$ Mn)
12.2.Europe Eco-Friendly Water Bottle Market Revenue (US$ Mn) and Forecasts, By Material Type
12.2.1.Stainless steel
12.2.2.Glass
12.2.3.Aluminum
12.2.4.Plastic
12.2.5.Copper
12.2.6.Ceramic and Soft Silicone
12.2.7.Others
12.3.Europe Eco-Friendly Water Bottle Market Revenue (US$ Mn) and Forecasts, By Application
12.3.1.Home
12.3.2.Office
12.3.3.Travel
12.3.4.Sports
12.3.5.Others
12.4.Europe Eco-Friendly Water Bottle Market Revenue (US$ Mn) and Forecasts, By Distribution Channel
12.4.1.Online
12.4.2.Offline
12.5.Europe Eco-Friendly Water Bottle Market Revenue (US$ Mn) and Forecasts, By Country
12.5.1.France
12.5.1.1.France Eco-Friendly Water Bottle Market Revenue (US$ Mn) and Forecasts, By Material Type
12.5.1.1.1.Stainless steel
12.5.1.1.2.Glass
12.5.1.1.3.Aluminum
12.5.1.1.4.Plastic
12.5.1.1.5.Copper
12.5.1.1.6.Ceramic and Soft Silicone
12.5.1.1.7.Others
12.5.1.2.France Eco-Friendly Water Bottle Market Revenue (US$ Mn) and Forecasts, By Application
12.5.1.2.1.Home
12.5.1.2.2.Office
12.5.1.2.3.Travel
12.5.1.2.4.Sports
12.5.1.2.5.Others
12.5.1.3.France Eco-Friendly Water Bottle Market Revenue (US$ Mn) and Forecasts, By Distribution Channel
12.5.1.3.1.Online
12.5.1.3.2.Offline
12.5.2.The UK
12.5.2.1.The UK Eco-Friendly Water Bottle Market Revenue (US$ Mn) and Forecasts, By Material Type
12.5.2.1.1.Stainless steel
12.5.2.1.2.Glass
12.5.2.1.3.Aluminum
12.5.2.1.4.Plastic
12.5.2.1.5.Copper
12.5.2.1.6.Ceramic and Soft Silicone
12.5.2.1.7.Others
12.5.2.2.The UK Eco-Friendly Water Bottle Market Revenue (US$ Mn) and Forecasts, By Application
12.5.2.2.1.Home
12.5.2.2.2.Office
12.5.2.2.3.Travel
12.5.2.2.4.Sports
12.5.2.2.5.Others
12.5.2.3.The UK Eco-Friendly Water Bottle Market Revenue (US$ Mn) and Forecasts, By Distribution Channel
12.5.2.3.1.Online
12.5.2.3.2.Offline
12.5.3.Spain
12.5.3.1.Spain Eco-Friendly Water Bottle Market Revenue (US$ Mn) and Forecasts, By Material Type
12.5.3.1.1.Stainless steel
12.5.3.1.2.Glass
12.5.3.1.3.Aluminum
12.5.3.1.4.Plastic
12.5.3.1.5.Copper
12.5.3.1.6.Ceramic and Soft Silicone
12.5.3.1.7.Others
12.5.3.2.Spain Eco-Friendly Water Bottle Market Revenue (US$ Mn) and Forecasts, By Application
12.5.3.2.1.Home
12.5.3.2.2.Office
12.5.3.2.3.Travel
12.5.3.2.4.Sports
12.5.3.2.5.Others
12.5.3.3.Spain Eco-Friendly Water Bottle Market Revenue (US$ Mn) and Forecasts, By Distribution Channel
12.5.3.3.1.Online
12.5.3.3.2.Offline
12.5.4.Germany
12.5.4.1.Germany Eco-Friendly Water Bottle Market Revenue (US$ Mn) and Forecasts, By Material Type
12.5.4.1.1.Stainless steel
12.5.4.1.2.Glass
12.5.4.1.3.Aluminum
12.5.4.1.4.Plastic
12.5.4.1.5.Copper
12.5.4.1.6.Ceramic and Soft Silicone
12.5.4.1.7.Others
12.5.4.2.Germany Eco-Friendly Water Bottle Market Revenue (US$ Mn) and Forecasts, By Application
12.5.4.2.1.Home
12.5.4.2.2.Office
12.5.4.2.3.Travel
12.5.4.2.4.Sports
12.5.4.2.5.Others
12.5.4.3.Germany Eco-Friendly Water Bottle Market Revenue (US$ Mn) and Forecasts, By Distribution Channel
12.5.4.3.1.Online
12.5.4.3.2.Offline
12.5.5.Italy
12.5.5.1.Italy Eco-Friendly Water Bottle Market Revenue (US$ Mn) and Forecasts, By Material Type
12.5.5.1.1.Stainless steel
12.5.5.1.2.Glass
12.5.5.1.3.Aluminum
12.5.5.1.4.Plastic
12.5.5.1.5.Copper
12.5.5.1.6.Ceramic and Soft Silicone
12.5.5.1.7.Others
12.5.5.2.Italy Eco-Friendly Water Bottle Market Revenue (US$ Mn) and Forecasts, By Application
12.5.5.2.1.Home
12.5.5.2.2.Office
12.5.5.2.3.Travel
12.5.5.2.4.Sports
12.5.5.2.5.Others
12.5.5.3.Italy Eco-Friendly Water Bottle Market Revenue (US$ Mn) and Forecasts, By Distribution Channel
12.5.5.3.1.Online
12.5.5.3.2.Offline
12.5.6.Nordic Countries
12.5.6.1.Nordic Countries Eco-Friendly Water Bottle Market Revenue (US$ Mn) and Forecasts, By Material Type
12.5.6.1.1.Stainless steel
12.5.6.1.2.Glass
12.5.6.1.3.Aluminum
12.5.6.1.4.Plastic
12.5.6.1.5.Copper
12.5.6.1.6.Ceramic and Soft Silicone
12.5.6.1.7.Others
12.5.6.2.Nordic Countries Eco-Friendly Water Bottle Market Revenue (US$ Mn) and Forecasts, By Application
12.5.6.2.1.Home
12.5.6.2.2.Office
12.5.6.2.3.Travel
12.5.6.2.4.Sports
12.5.6.2.5.Others
12.5.6.3.Nordic Countries Eco-Friendly Water Bottle Market Revenue (US$ Mn) and Forecasts, By Distribution Channel
12.5.6.3.1.Online
12.5.6.3.2.Offline
12.5.6.4.Nordic Countries Eco-Friendly Water Bottle Market Revenue (US$ Mn) and Forecasts, By Country
12.5.6.4.1.Denmark
12.5.6.4.2.Finland
12.5.6.4.3.Iceland
12.5.6.4.4.Sweden
12.5.6.4.5.Norway
12.5.7.Benelux Union
12.5.7.1.Benelux Union Eco-Friendly Water Bottle Market Revenue (US$ Mn) and Forecasts, By Material Type
12.5.7.1.1.Stainless steel
12.5.7.1.2.Glass
12.5.7.1.3.Aluminum
12.5.7.1.4.Plastic
12.5.7.1.5.Copper
12.5.7.1.6.Ceramic and Soft Silicone
12.5.7.1.7.Others
12.5.7.2.Benelux Union Eco-Friendly Water Bottle Market Revenue (US$ Mn) and Forecasts, By Application
12.5.7.2.1.Home
12.5.7.2.2.Office
12.5.7.2.3.Travel
12.5.7.2.4.Sports
12.5.7.2.5.Others
12.5.7.3.Benelux Union Eco-Friendly Water Bottle Market Revenue (US$ Mn) and Forecasts, By Distribution Channel
12.5.7.3.1.Online
12.5.7.3.2.Offline
12.5.7.4.Benelux Union Eco-Friendly Water Bottle Market Revenue (US$ Mn) and Forecasts, By Country
12.5.7.4.1.Belgium
12.5.7.4.2.The Netherlands
12.5.7.4.3.Luxembourg
12.5.8.Rest of Europe
12.5.8.1.Rest of Europe Eco-Friendly Water Bottle Market Revenue (US$ Mn) and Forecasts, By Material Type
12.5.8.1.1.Stainless steel
12.5.8.1.2.Glass
12.5.8.1.3.Aluminum
12.5.8.1.4.Plastic
12.5.8.1.5.Copper
12.5.8.1.6.Ceramic and Soft Silicone
12.5.8.1.7.Others
12.5.8.2.Rest of Europe Eco-Friendly Water Bottle Market Revenue (US$ Mn) and Forecasts, By Application
12.5.8.2.1.Home
12.5.8.2.2.Office
12.5.8.2.3.Travel
12.5.8.2.4.Sports
12.5.8.2.5.Others
12.5.8.3.Rest of Europe Eco-Friendly Water Bottle Market Revenue (US$ Mn) and Forecasts, By Distribution Channel
12.5.8.3.1.Online
12.5.8.3.2.Offline
12.6.Key Segment for Channeling Investments
12.6.1.By Country
12.6.2.By Material Type
12.6.3.By Application
12.6.4.By Distribution Channel
13.Asia Pacific Eco-Friendly Water Bottle Market Analysis and Forecasts, 2024 – 2034
13.1.Overview
13.1.1.Asia Pacific Eco-Friendly Water Bottle Market Revenue (US$ Mn)
13.2.Asia Pacific Eco-Friendly Water Bottle Market Revenue (US$ Mn) and Forecasts, By Material Type
13.2.1.Stainless steel
13.2.2.Glass
13.2.3.Aluminum
13.2.4.Plastic
13.2.5.Copper
13.2.6.Ceramic and Soft Silicone
13.2.7.Others
13.3.Asia Pacific Eco-Friendly Water Bottle Market Revenue (US$ Mn) and Forecasts, By Application
13.3.1.Home
13.3.2.Office
13.3.3.Travel
13.3.4.Sports
13.3.5.Others
13.4.Asia Pacific Eco-Friendly Water Bottle Market Revenue (US$ Mn) and Forecasts, By Distribution Channel
13.4.1.Online
13.4.2.Offline
13.5.Asia Pacific Eco-Friendly Water Bottle Market Revenue (US$ Mn) and Forecasts, By Country
13.5.1.China
13.5.1.1.China Eco-Friendly Water Bottle Market Revenue (US$ Mn) and Forecasts, By Material Type
13.5.1.1.1.Stainless steel
13.5.1.1.2.Glass
13.5.1.1.3.Aluminum
13.5.1.1.4.Plastic
13.5.1.1.5.Copper
13.5.1.1.6.Ceramic and Soft Silicone
13.5.1.1.7.Others
13.5.1.2.China Eco-Friendly Water Bottle Market Revenue (US$ Mn) and Forecasts, By Application
13.5.1.2.1.Home
13.5.1.2.2.Office
13.5.1.2.3.Travel
13.5.1.2.4.Sports
13.5.1.2.5.Others
13.5.1.3.China Eco-Friendly Water Bottle Market Revenue (US$ Mn) and Forecasts, By Distribution Channel
13.5.1.3.1.Online
13.5.1.3.2.Offline
13.5.2.Japan
13.5.2.1.Japan Eco-Friendly Water Bottle Market Revenue (US$ Mn) and Forecasts, By Material Type
13.5.2.1.1.Stainless steel
13.5.2.1.2.Glass
13.5.2.1.3.Aluminum
13.5.2.1.4.Plastic
13.5.2.1.5.Copper
13.5.2.1.6.Ceramic and Soft Silicone
13.5.2.1.7.Others
13.5.2.2.Japan Eco-Friendly Water Bottle Market Revenue (US$ Mn) and Forecasts, By Application
13.5.2.2.1.Home
13.5.2.2.2.Office
13.5.2.2.3.Travel
13.5.2.2.4.Sports
13.5.2.2.5.Others
13.5.2.3.Japan Eco-Friendly Water Bottle Market Revenue (US$ Mn) and Forecasts, By Distribution Channel
13.5.2.3.1.Online
13.5.2.3.2.Offline
13.5.3.India
13.5.3.1.India Eco-Friendly Water Bottle Market Revenue (US$ Mn) and Forecasts, By Material Type
13.5.3.1.1.Stainless steel
13.5.3.1.2.Glass
13.5.3.1.3.Aluminum
13.5.3.1.4.Plastic
13.5.3.1.5.Copper
13.5.3.1.6.Ceramic and Soft Silicone
13.5.3.1.7.Others
13.5.3.2.India Eco-Friendly Water Bottle Market Revenue (US$ Mn) and Forecasts, By Application
13.5.3.2.1.Home
13.5.3.2.2.Office
13.5.3.2.3.Travel
13.5.3.2.4.Sports
13.5.3.2.5.Others
13.5.3.3.India Eco-Friendly Water Bottle Market Revenue (US$ Mn) and Forecasts, By Distribution Channel
13.5.3.3.1.Online
13.5.3.3.2.Offline
13.5.4.New Zealand
13.5.4.1.New Zealand Eco-Friendly Water Bottle Market Revenue (US$ Mn) and Forecasts, By Material Type
13.5.4.1.1.Stainless steel
13.5.4.1.2.Glass
13.5.4.1.3.Aluminum
13.5.4.1.4.Plastic
13.5.4.1.5.Copper
13.5.4.1.6.Ceramic and Soft Silicone
13.5.4.1.7.Others
13.5.4.2.New Zealand Eco-Friendly Water Bottle Market Revenue (US$ Mn) and Forecasts, By Application
13.5.4.2.1.Home
13.5.4.2.2.Office
13.5.4.2.3.Travel
13.5.4.2.4.Sports
13.5.4.2.5.Others
13.5.4.3.New Zealand Eco-Friendly Water Bottle Market Revenue (US$ Mn) and Forecasts, By Distribution Channel
13.5.4.3.1.Online
13.5.4.3.2.Offline
13.5.5.Australia
13.5.5.1.Australia Eco-Friendly Water Bottle Market Revenue (US$ Mn) and Forecasts, By Material Type
13.5.5.1.1.Stainless steel
13.5.5.1.2.Glass
13.5.5.1.3.Aluminum
13.5.5.1.4.Plastic
13.5.5.1.5.Copper
13.5.5.1.6.Ceramic and Soft Silicone
13.5.5.1.7.Others
13.5.5.2.Australia Eco-Friendly Water Bottle Market Revenue (US$ Mn) and Forecasts, By Application
13.5.5.2.1.Home
13.5.5.2.2.Office
13.5.5.2.3.Travel
13.5.5.2.4.Sports
13.5.5.2.5.Others
13.5.5.3.Australia Eco-Friendly Water Bottle Market Revenue (US$ Mn) and Forecasts, By Distribution Channel
13.5.5.3.1.Online
13.5.5.3.2.Offline
13.5.6.South Korea
13.5.6.1.South Korea Eco-Friendly Water Bottle Market Revenue (US$ Mn) and Forecasts, By Material Type
13.5.6.1.1.Stainless steel
13.5.6.1.2.Glass
13.5.6.1.3.Aluminum
13.5.6.1.4.Plastic
13.5.6.1.5.Copper
13.5.6.1.6.Ceramic and Soft Silicone
13.5.6.1.7.Others
13.5.6.2.South Korea Eco-Friendly Water Bottle Market Revenue (US$ Mn) and Forecasts, By Application
13.5.6.2.1.Home
13.5.6.2.2.Office
13.5.6.2.3.Travel
13.5.6.2.4.Sports
13.5.6.2.5.Others
13.5.6.3.South Korea Eco-Friendly Water Bottle Market Revenue (US$ Mn) and Forecasts, By Distribution Channel
13.5.6.3.1.Online
13.5.6.3.2.Offline
13.5.7.Southeast Asia
13.5.7.1.Southeast Asia Eco-Friendly Water Bottle Market Revenue (US$ Mn) and Forecasts, By Material Type
13.5.7.1.1.Stainless steel
13.5.7.1.2.Glass
13.5.7.1.3.Aluminum
13.5.7.1.4.Plastic
13.5.7.1.5.Copper
13.5.7.1.6.Ceramic and Soft Silicone
13.5.7.1.7.Others
13.5.7.2.Southeast Asia Eco-Friendly Water Bottle Market Revenue (US$ Mn) and Forecasts, By Application
13.5.7.2.1.Home
13.5.7.2.2.Office
13.5.7.2.3.Travel
13.5.7.2.4.Sports
13.5.7.2.5.Others
13.5.7.3.Southeast Asia Eco-Friendly Water Bottle Market Revenue (US$ Mn) and Forecasts, By Distribution Channel
13.5.7.3.1.Online
13.5.7.3.2.Offline
13.5.7.4.Southeast Asia Eco-Friendly Water Bottle Market Revenue (US$ Mn) and Forecasts, By Country
13.5.7.4.1.Indonesia
13.5.7.4.2.Thailand
13.5.7.4.3.Malaysia
13.5.7.4.4.Singapore
13.5.7.4.5.Rest of Southeast Asia
13.5.8.Rest of Asia Pacific
13.5.8.1.Rest of Asia Pacific Eco-Friendly Water Bottle Market Revenue (US$ Mn) and Forecasts, By Material Type
13.5.8.1.1.Stainless steel
13.5.8.1.2.Glass
13.5.8.1.3.Aluminum
13.5.8.1.4.Plastic
13.5.8.1.5.Copper
13.5.8.1.6.Ceramic and Soft Silicone
13.5.8.1.7.Others
13.5.8.2.Rest of Asia Pacific Eco-Friendly Water Bottle Market Revenue (US$ Mn) and Forecasts, By Application
13.5.8.2.1.Home
13.5.8.2.2.Office
13.5.8.2.3.Travel
13.5.8.2.4.Sports
13.5.8.2.5.Others
13.5.8.3.Rest of Asia Pacific Eco-Friendly Water Bottle Market Revenue (US$ Mn) and Forecasts, By Distribution Channel
13.5.8.3.1.Online
13.5.8.3.2.Offline
13.6.Key Segment for Channeling Investments
13.6.1.By Country
13.6.2.By Material Type
13.6.3.By Application
13.6.4.By Distribution Channel
14.Middle East and Africa Eco-Friendly Water Bottle Market Analysis and Forecasts, 2024 – 2034
14.1.Overview
14.1.1.Middle East and Africa Eco-Friendly Water Bottle Market Revenue (US$ Mn)
14.2.Middle East and Africa Eco-Friendly Water Bottle Market Revenue (US$ Mn) and Forecasts, By Material Type
14.2.1.Stainless steel
14.2.2.Glass
14.2.3.Aluminum
14.2.4.Plastic
14.2.5.Copper
14.2.6.Ceramic and Soft Silicone
14.2.7.Others
14.3.Middle East and Africa Eco-Friendly Water Bottle Market Revenue (US$ Mn) and Forecasts, By Application
14.3.1.Home
14.3.2.Office
14.3.3.Travel
14.3.4.Sports
14.3.5.Others
14.4.Middle East and Africa Eco-Friendly Water Bottle Market Revenue (US$ Mn) and Forecasts, By Distribution Channel
14.4.1.Online
14.4.2.Offline
14.5.Middle East and Africa Eco-Friendly Water Bottle Market Revenue (US$ Mn) and Forecasts, By Country
14.5.1.Saudi Arabia
14.5.1.1.Saudi Arabia Eco-Friendly Water Bottle Market Revenue (US$ Mn) and Forecasts, By Material Type
14.5.1.1.1.Stainless steel
14.5.1.1.2.Glass
14.5.1.1.3.Aluminum
14.5.1.1.4.Plastic
14.5.1.1.5.Copper
14.5.1.1.6.Ceramic and Soft Silicone
14.5.1.1.7.Others
14.5.1.2.Saudi Arabia Eco-Friendly Water Bottle Market Revenue (US$ Mn) and Forecasts, By Application
14.5.1.2.1.Home
14.5.1.2.2.Office
14.5.1.2.3.Travel
14.5.1.2.4.Sports
14.5.1.2.5.Others
14.5.1.3.Saudi Arabia Eco-Friendly Water Bottle Market Revenue (US$ Mn) and Forecasts, By Distribution Channel
14.5.1.3.1.Online
14.5.1.3.2.Offline
14.5.2.UAE
14.5.2.1.UAE Eco-Friendly Water Bottle Market Revenue (US$ Mn) and Forecasts, By Material Type
14.5.2.1.1.Stainless steel
14.5.2.1.2.Glass
14.5.2.1.3.Aluminum
14.5.2.1.4.Plastic
14.5.2.1.5.Copper
14.5.2.1.6.Ceramic and Soft Silicone
14.5.2.1.7.Others
14.5.2.2.UAE Eco-Friendly Water Bottle Market Revenue (US$ Mn) and Forecasts, By Application
14.5.2.2.1.Home
14.5.2.2.2.Office
14.5.2.2.3.Travel
14.5.2.2.4.Sports
14.5.2.2.5.Others
14.5.2.3.UAE Eco-Friendly Water Bottle Market Revenue (US$ Mn) and Forecasts, By Distribution Channel
14.5.2.3.1.Online
14.5.2.3.2.Offline
14.5.3.Egypt
14.5.3.1.Egypt Eco-Friendly Water Bottle Market Revenue (US$ Mn) and Forecasts, By Material Type
14.5.3.1.1.Stainless steel
14.5.3.1.2.Glass
14.5.3.1.3.Aluminum
14.5.3.1.4.Plastic
14.5.3.1.5.Copper
14.5.3.1.6.Ceramic and Soft Silicone
14.5.3.1.7.Others
14.5.3.2.Egypt Eco-Friendly Water Bottle Market Revenue (US$ Mn) and Forecasts, By Application
14.5.3.2.1.Home
14.5.3.2.2.Office
14.5.3.2.3.Travel
14.5.3.2.4.Sports
14.5.3.2.5.Others
14.5.3.3.Egypt Eco-Friendly Water Bottle Market Revenue (US$ Mn) and Forecasts, By Distribution Channel
14.5.3.3.1.Online
14.5.3.3.2.Offline
14.5.4.Kuwait
14.5.4.1.Kuwait Eco-Friendly Water Bottle Market Revenue (US$ Mn) and Forecasts, By Material Type
14.5.4.1.1.Stainless steel
14.5.4.1.2.Glass
14.5.4.1.3.Aluminum
14.5.4.1.4.Plastic
14.5.4.1.5.Copper
14.5.4.1.6.Ceramic and Soft Silicone
14.5.4.1.7.Others
14.5.4.2.Kuwait Eco-Friendly Water Bottle Market Revenue (US$ Mn) and Forecasts, By Application
14.5.4.2.1.Home
14.5.4.2.2.Office
14.5.4.2.3.Travel
14.5.4.2.4.Sports
14.5.4.2.5.Others
14.5.4.3.Kuwait Eco-Friendly Water Bottle Market Revenue (US$ Mn) and Forecasts, By Distribution Channel
14.5.4.3.1.Online
14.5.4.3.2.Offline
14.5.5.South Africa
14.5.5.1.South Africa Eco-Friendly Water Bottle Market Revenue (US$ Mn) and Forecasts, By Material Type
14.5.5.1.1.Stainless steel
14.5.5.1.2.Glass
14.5.5.1.3.Aluminum
14.5.5.1.4.Plastic
14.5.5.1.5.Copper
14.5.5.1.6.Ceramic and Soft Silicone
14.5.5.1.7.Others
14.5.5.2.South Africa Eco-Friendly Water Bottle Market Revenue (US$ Mn) and Forecasts, By Application
14.5.5.2.1.Home
14.5.5.2.2.Office
14.5.5.2.3.Travel
14.5.5.2.4.Sports
14.5.5.2.5.Others
14.5.5.3.South Africa Eco-Friendly Water Bottle Market Revenue (US$ Mn) and Forecasts, By Distribution Channel
14.5.5.3.1.Online
14.5.5.3.2.Offline
14.5.6.Rest of Middle East & Africa
14.5.6.1.Rest of Middle East & Africa Eco-Friendly Water Bottle Market Revenue (US$ Mn) and Forecasts, By Material Type
14.5.6.1.1.Stainless steel
14.5.6.1.2.Glass
14.5.6.1.3.Aluminum
14.5.6.1.4.Plastic
14.5.6.1.5.Copper
14.5.6.1.6.Ceramic and Soft Silicone
14.5.6.1.7.Others
14.5.6.2.Rest of Middle East & Africa Eco-Friendly Water Bottle Market Revenue (US$ Mn) and Forecasts, By Application
14.5.6.2.1.Home
14.5.6.2.2.Office
14.5.6.2.3.Travel
14.5.6.2.4.Sports
14.5.6.2.5.Others
14.5.6.3.Rest of Middle East & Africa Eco-Friendly Water Bottle Market Revenue (US$ Mn) and Forecasts, By Distribution Channel
14.5.6.3.1.Online
14.5.6.3.2.Offline
14.6.Key Segment for Channeling Investments
14.6.1.By Country
14.6.2.By Material Type
14.6.3.By Application
14.6.4.By Distribution Channel
15.Latin America Eco-Friendly Water Bottle Market Analysis and Forecasts, 2024 – 2034
15.1.Overview
15.1.1.Latin America Eco-Friendly Water Bottle Market Revenue (US$ Mn)
15.2.Latin America Eco-Friendly Water Bottle Market Revenue (US$ Mn) and Forecasts, By Material Type
15.2.1.Stainless steel
15.2.2.Glass
15.2.3.Aluminum
15.2.4.Plastic
15.2.5.Copper
15.2.6.Ceramic and Soft Silicone
15.2.7.Others
15.3.Latin America Eco-Friendly Water Bottle Market Revenue (US$ Mn) and Forecasts, By Application
15.3.1.Home
15.3.2.Office
15.3.3.Travel
15.3.4.Sports
15.3.5.Others
15.4.Latin America Eco-Friendly Water Bottle Market Revenue (US$ Mn) and Forecasts, By Distribution Channel
15.4.1.Online
15.4.2.Offline
15.5.Latin America Eco-Friendly Water Bottle Market Revenue (US$ Mn) and Forecasts, By Country
15.5.1.Brazil
15.5.1.1.Brazil Eco-Friendly Water Bottle Market Revenue (US$ Mn) and Forecasts, By Material Type
15.5.1.1.1.Stainless steel
15.5.1.1.2.Glass
15.5.1.1.3.Aluminum
15.5.1.1.4.Plastic
15.5.1.1.5.Copper
15.5.1.1.6.Ceramic and Soft Silicone
15.5.1.1.7.Others
15.5.1.2.Brazil Eco-Friendly Water Bottle Market Revenue (US$ Mn) and Forecasts, By Application
15.5.1.2.1.Home
15.5.1.2.2.Office
15.5.1.2.3.Travel
15.5.1.2.4.Sports
15.5.1.2.5.Others
15.5.1.3.Brazil Eco-Friendly Water Bottle Market Revenue (US$ Mn) and Forecasts, By Distribution Channel
15.5.1.3.1.Online
15.5.1.3.2.Offline
15.5.2.Argentina
15.5.2.1.Argentina Eco-Friendly Water Bottle Market Revenue (US$ Mn) and Forecasts, By Material Type
15.5.2.1.1.Stainless steel
15.5.2.1.2.Glass
15.5.2.1.3.Aluminum
15.5.2.1.4.Plastic
15.5.2.1.5.Copper
15.5.2.1.6.Ceramic and Soft Silicone
15.5.2.1.7.Others
15.5.2.2.Argentina Eco-Friendly Water Bottle Market Revenue (US$ Mn) and Forecasts, By Application
15.5.2.2.1.Home
15.5.2.2.2.Office
15.5.2.2.3.Travel
15.5.2.2.4.Sports
15.5.2.2.5.Others
15.5.2.3.Argentina Eco-Friendly Water Bottle Market Revenue (US$ Mn) and Forecasts, By Distribution Channel
15.5.2.3.1.Online
15.5.2.3.2.Offline
15.5.3.Rest of Latin America
15.5.3.1.Rest of Latin America Eco-Friendly Water Bottle Market Revenue (US$ Mn) and Forecasts, By Material Type
15.5.3.1.1.Stainless steel
15.5.3.1.2.Glass
15.5.3.1.3.Aluminum
15.5.3.1.4.Plastic
15.5.3.1.5.Copper
15.5.3.1.6.Ceramic and Soft Silicone
15.5.3.1.7.Others
15.5.3.2.Rest of Latin America Eco-Friendly Water Bottle Market Revenue (US$ Mn) and Forecasts, By Application
15.5.3.2.1.Home
15.5.3.2.2.Office
15.5.3.2.3.Travel
15.5.3.2.4.Sports
15.5.3.2.5.Others
15.5.3.3.Rest of Latin America Eco-Friendly Water Bottle Market Revenue (US$ Mn) and Forecasts, By Distribution Channel
15.5.3.3.1.Online
15.5.3.3.2.Offline
15.6.Key Segment for Channeling Investments
15.6.1.By Country
15.6.2.By Material Type
15.6.3.By Application
15.6.4.By Distribution Channel
16.Competitive Benchmarking
16.1.Brand Benchmarking
16.2.Market Share Analysis, 2023
16.3.Global Presence and Growth Strategies
16.3.1.Mergers and Acquisitions
16.3.2.Product Launches
16.3.3.Investments Trends
16.3.4.R&D Initiatives
17.Player Profiles
17.1.AquaAF
17.1.1.Company Details
17.1.2.Company Overview
17.1.3.Product Offerings
17.1.4.Key Developments
17.1.5.Financial Analysis
17.1.6.SWOT Analysis
17.1.7.Business Strategies
17.2.BOTTLE UP
17.2.1.Company Details
17.2.2.Company Overview
17.2.3.Product Offerings
17.2.4.Key Developments
17.2.5.Financial Analysis
17.2.6.SWOT Analysis
17.2.7.Business Strategies
17.3.Bluewater
17.3.1.Company Details
17.3.2.Company Overview
17.3.3.Product Offerings
17.3.4.Key Developments
17.3.5.Financial Analysis
17.3.6.SWOT Analysis
17.3.7.Business Strategies
17.4.CanO Water Ltd
17.4.1.Company Details
17.4.2.Company Overview
17.4.3.Product Offerings
17.4.4.Key Developments
17.4.5.Financial Analysis
17.4.6.SWOT Analysis
17.4.7.Business Strategies
17.5.Chilly’s
17.5.1.Company Details
17.5.2.Company Overview
17.5.3.Product Offerings
17.5.4.Key Developments
17.5.5.Financial Analysis
17.5.6.SWOT Analysis
17.5.7.Business Strategies
17.6.Ello Products
17.6.1.Company Details
17.6.2.Company Overview
17.6.3.Product Offerings
17.6.4.Key Developments
17.6.5.Financial Analysis
17.6.6.SWOT Analysis
17.6.7.Business Strategies
17.7.frank green
17.7.1.Company Details
17.7.2.Company Overview
17.7.3.Product Offerings
17.7.4.Key Developments
17.7.5.Financial Analysis
17.7.6.SWOT Analysis
17.7.7.Business Strategies
17.8.Hydro Flask
17.8.1.Company Details
17.8.2.Company Overview
17.8.3.Product Offerings
17.8.4.Key Developments
17.8.5.Financial Analysis
17.8.6.SWOT Analysis
17.8.7.Business Strategies
17.9.JUST Goods, Inc.
17.9.1.Company Details
17.9.2.Company Overview
17.9.3.Product Offerings
17.9.4.Key Developments
17.9.5.Financial Analysis
17.9.6.SWOT Analysis
17.9.7.Business Strategies
17.10.Rockay
17.10.1.Company Details
17.10.2.Company Overview
17.10.3.Product Offerings
17.10.4.Key Developments
17.10.5.Financial Analysis
17.10.6.SWOT Analysis
17.10.7.Business Strategies
17.11.Soma
17.11.1.Company Details
17.11.2.Company Overview
17.11.3.Product Offerings
17.11.4.Key Developments
17.11.5.Financial Analysis
17.11.6.SWOT Analysis
17.11.7.Business Strategies
17.12.SOURCE Global, PBC
17.12.1.Company Details
17.12.2.Company Overview
17.12.3.Product Offerings
17.12.4.Key Developments
17.12.5.Financial Analysis
17.12.6.SWOT Analysis
17.12.7.Business Strategies
17.13.Other Industry Participants
18.Key Findings

.

Note: This ToC is tentative and can be changed according to the research study conducted during the course of report completion.

.

**Exclusive for Multi-User and Enterprise User.

.

Global Eco-Friendly Water Bottle Market

By Material Type

  • Stainless steel
  • Glass
  • Aluminum
  • Plastic
  • Copper
  • Ceramic and Soft Silicone
  • Others

By Application

  • Home
  • Office
  • Travel
  • Sports
  • Others

By Distribution Channel

  • Online
  • Offline
    • Supermarkets And Hypermarkets
    • Specialty Stores
    • Others

By Region

  • North America (U.S., Canada, Mexico, Rest of North America)
  • Europe (France, The UK, Spain, Germany, Italy, Nordic Countries (Denmark, Finland, Iceland, Sweden, Norway), Benelux Union (Belgium, The Netherlands, Luxembourg), Rest of Europe)
  • Asia Pacific (China, Japan, India, New Zealand, Australia, South Korea, Southeast Asia (Indonesia, Thailand, Malaysia, Singapore, Rest of Southeast Asia), Rest of Asia Pacific)
  • Middle East & Africa (Saudi Arabia, UAE, Egypt, Kuwait, South Africa, Rest of Middle East & Africa)
  • Latin America (Brazil, Argentina, Rest of Latin America)

.

The Niche Research approach encompasses both primary and secondary research methods to provide comprehensive insights. While primary research is the cornerstone of our studies, we also incorporate secondary research sources such as company annual reports, premium industry databases, press releases, industry journals, and white papers.

Within our primary research, we actively engage with various industry stakeholders, conducting paid interviews and surveys. Our meticulous analysis extends to every market participant in major countries, allowing us to thoroughly examine their portfolios, calculate market shares, and segment revenues.

Our data collection primarily focuses on individual countries within our research scope, enabling us to estimate regional market sizes. Typically, we employ a bottom-up approach, meticulously tracking trends in different countries. We analyze growth drivers, constraints, technological innovations, and opportunities for each country, ultimately arriving at regional figures.Our process begins by examining the growth prospects of each country. Building upon these insights, we project growth and trends for the entire region. Finally, we utilize our proprietary model to refine estimations and forecasts.

Our data validation standards are integral to ensuring the reliability and accuracy of our research findings. Here’s a breakdown of our data validation processes and the stakeholders we engage with during our primary research:

  • Supply Side Analysis: We initiate a supply side analysis by directly contacting market participants, through telephonic interviews and questionnaires containing both open-ended and close-ended questions. We gather information on their portfolios, segment revenues, developments, and growth strategies.
  • Demand Side Analysis: To gain insights into adoption trends and consumer preferences, we reach out to target customers and users (non-vendors). This information forms a vital part of the qualitative analysis section of our reports, covering market dynamics, adoption trends, consumer behavior, spending patterns, and other related aspects.
  • Consultant Insights: We tap into the expertise of our partner consultants from around the world to obtain their unique viewpoints and perspectives. Their insights contribute to a well-rounded understanding of the markets under investigation.
  • In-House Validation: To ensure data accuracy and reliability, we conduct cross-validation of data points and information through our in-house team of consultants and utilize advanced data modeling tools for thorough verification.

The forecasts we provide are based on a comprehensive assessment of various factors, including:

  • Market Trends and Past Performance (Last Five Years): We accurately analyze market trends and performance data from preceding five years to identify historical patterns and understand the market’s evolution.
  • Historical Performance and Growth of Market Participants: We assess the historical performance and growth trajectories of key market participants. This analysis provides insights into the competitive landscape and individual company strategies.
  • Market Determinants Impact Analysis (Next Eight Years): We conduct a rigorous analysis of the factors that are projected to influence the market over the next eight years. This includes assessing both internal and external determinants that can shape market dynamics.
  • Drivers and Challenges for the Forecast Period:Identify the factors expected to drive market growth during the forecast period, as well as the challenges that the industry may face. This analysis aids in deriving an accurate growth rate projection.
  • New Acquisitions, Collaborations, or Partnerships: We keep a close watch on any new acquisitions, collaborations, or partnerships within the industry. These developments can have a significant impact on market dynamics and competitiveness.
  • Macro and Micro Factors Analysis:A thorough examination of both macro-level factors (e.g., economic trends, regulatory changes) and micro-level factors (e.g., technological advancements, consumer preferences) that may influence the market during the forecast period.
  • End-User Sentiment Analysis: To understand the market from the end-user perspective, we conduct sentiment analysis. This involves assessing the sentiment, preferences, and feedback of the end-users, which can provide valuable insights into market trends.
  • Perspective of Primary Participants: Insights gathered directly from primary research participants play a crucial role in shaping our forecasts. Their perspectives and experiences provide valuable qualitative data.
  • Year-on-Year Growth Trend: We utilize a year-on-year growth trend based on historical market growth and expected future trends. This helps in formulating our growth projections, aligning them with the market’s historical performance.

Research process adopted by TNR involves multiple stages, including data collection, validation, quality checks, and presentation. It’s crucial that the data and information we provide add value to your existing market understanding and expertise. We have also established partnerships with business consulting, research, and survey organizations across regions and globally to collaborate on regional analysis and data validation, ensuring the highest level of accuracy and reliability in our reports.


Procure Comprehensive Study of

Global Eco-Friendly Water Bottle Market

Online Only

  • Online Access
  • Read Only File
  • Validity 3 Months
  • Print, Copy, Paste & Download
  • PPT, Excel
  • Cost-Free Report in the Next Update
$3300
Buy Now

Single User

  • Access to One User on One System
  • Read Only File
  • Validity 6 Months
  • Limited Print,Copy, Paste
  • PPT, Excel
  • Cost-Free Report in the Next Update
$4200
Buy Now

Multi User

  • Access to Fiver Users
  • PDF File
  • Validity 1 Year
  • Upto FivePrints
  • Cost-Free Report in the Next Update
  • PPT, Excel
$6000
Buy Now

Enterprise User

  • Access to Unlimited Users
  • PDF, PPT, Excel
  • Unlimited Validity, Prints&Downloads
  • 1 Hour Cost-Free & Dedicated Analyst Support
  • 10% Cost-Free Customization
  • Cost-Free Report Update Twice in a Year
  • Recommendations for Business Strategies
  • Authorization to Quote TNR, The Niche Research
$7300
Buy Now

Library Access

  • Online Access to Content Publications
  • Access Player Profiles Online
  • Get Immediate Access to Newly Added Content
  • Acquire 12 PDF Downloads
  • Acquire 5 Excel Data Sets
  • Gain Access to 290+ PDFs of Company Profiles
  • Round-the-clock Email and Phone Assistance
  • Dashboard Usage and Trends
  • Renewal & Upgrade Assistance
  • Assessing Customization Options and Alerts for New Reports
$10788
Buy Now
*Taxes/Fees, if applicable will be added during checkout. All prices in USD

Why TNR The Niche Research?

  • Unwavering Commitment to Excellence

  • Veteran Team of Researchers

  • Accurate and Timely Insights

  • Ethical Practices and Customized Service

  • Uninterrupted Availability Around the Clock

Scroll to Top