Global Energy Drinks Market By Nature, By Product Type, By Packaging, By Flavour Type, By Distribution Channel, By Region & Segmental Insights Trends and Forecast, 2024 – 2034

  • Industry: Food & Beverages
  • Report ID: TNR-110-1086
  • Number of Pages: 420
  • Table/Charts : Yes
  • May, 2024
  • Base Year : 2024
  • No. of Companies : 10+
  • No. of Countries : 29
  • Views : 10068
  • Covid Impact Covered: Yes
  • War Impact Covered: Yes
  • Formats : PDF, Excel, PPT

The energy drinks market is witnessing rapid growth, driven by rising consumer demand for quick energy boosts and enhanced performance. Dominated by major brands like Red Bull, Monster, and PepsiCo Inc., the market is characterized by continuous innovation in flavours and ingredients to meet diverse consumer preferences. The increasing focus on health and wellness has spurred the popularity of low-sugar and organic energy drinks. Additionally, the growing participation in sports and fitness activities further propels market expansion. However, concerns over the health effects of high caffeine and sugar content, along with stringent regulations, present challenges. Despite this, the market’s dynamic nature and evolving consumer trends indicate sustained growth opportunities. In terms of revenue, the global energy drinks market was worth US$ 89.7 Bn in 2023 and is anticipated to witness a CAGR of 9.4% during 2024 – 2034.

Trends in the Global Energy Drinks Market

  • A significant trend in the energy drinks market is the increasing focus on health and wellness. As consumers become more health-conscious, there’s a growing demand for beverages that provide an energy boost without the high sugar content and artificial ingredients commonly found in traditional energy drinks. This has led to the rise of low-sugar, sugar-free, and naturally sweetened options. Additionally, many brands are incorporating functional ingredients such as vitamins, minerals, amino acids, and adaptogens that offer additional health benefits beyond just energy. These ingredients are marketed to improve mental clarity, reduce stress, and support overall well-being. The trend towards healthier options reflects a broader consumer shift towards maintaining a balanced lifestyle, where energy drinks are not only a source of immediate energy but also contribute to long-term health goals.
  • Sustainability and ethical sourcing are becoming increasingly important trends in the energy drinks market. Consumers today are more environmentally conscious and are seeking products that align with their values. This has driven energy drink companies to adopt more sustainable practices, such as using eco-friendly packaging materials like recycled aluminum cans and biodegradable plastics. Additionally, brands are focusing on the ethical sourcing of ingredients, ensuring that their supply chains are transparent and that ingredients are sourced in a way that supports fair trade and reduces environmental impact. For instance, sourcing natural caffeine from sustainably managed coffee plantations or using organically grown herbs and fruits. These efforts not only help in reducing the ecological footprint but also enhance brand image and loyalty among environmentally conscious consumers. As sustainability becomes a key purchasing criterion, it is likely to shape the future strategies of energy drink companies.

Global Energy Drinks Market Revenue & Forecast, (US$ Million), 2016 – 2034

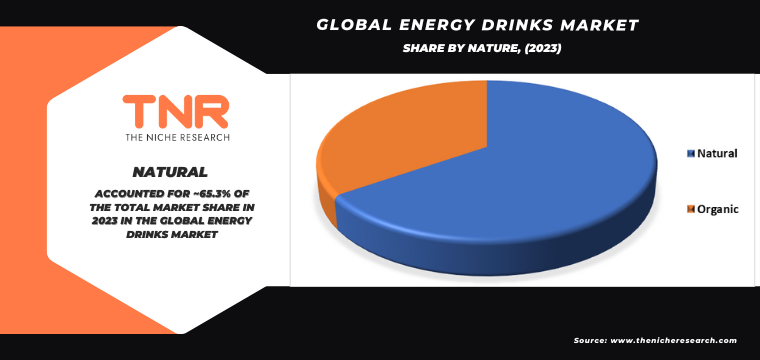
Natural energy drinks dominated the global energy drinks market during the forecast period. People are increasingly wary of artificial ingredients and high sugar content in traditional energy drinks, leading to a preference for natural alternatives. These drinks often contain ingredients like green tea extract, guarana, and natural fruit juices, which are perceived as healthier. Additionally, the trend towards organic and clean-label products has boosted the popularity of natural energy drinks. Consumers are also driven by the desire for functional benefits, with natural ingredients offering additional advantages like antioxidants and vitamins. This shift towards healthier lifestyles and sustainable consumption patterns has significantly contributed to the dominance of natural energy drinks in the market.

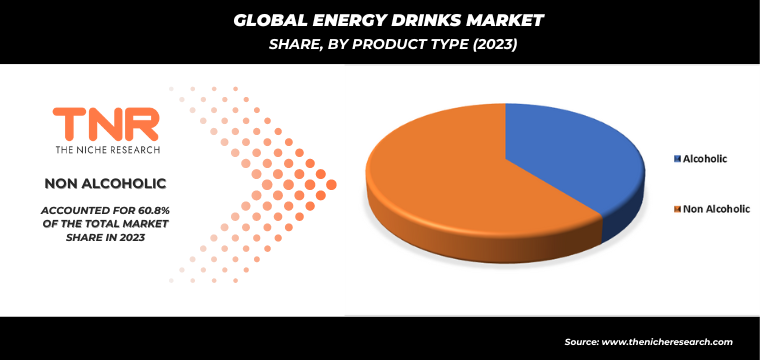
Alcoholic energy drinks segment gained popularity in recent years and is anticipated to grow the fastest over the forecast timeline. Unique combination of alcohol and energy-boosting ingredients appeals to young adults seeking new and exciting beverage options for socializing and nightlife. These drinks offer a dual effect, providing the stimulating benefits of energy drinks with the relaxing effects of alcohol. Additionally, innovative marketing and product development by key players have introduced a variety of flavours and formulations, making these drinks more attractive to a broad audience. The convenience of ready-to-drink options also caters to on-the-go lifestyles. Furthermore, increasing trend of premiumization in the beverage industry has led to the introduction of high-quality, artisanal alcoholic energy drinks, driving further interest and growth.

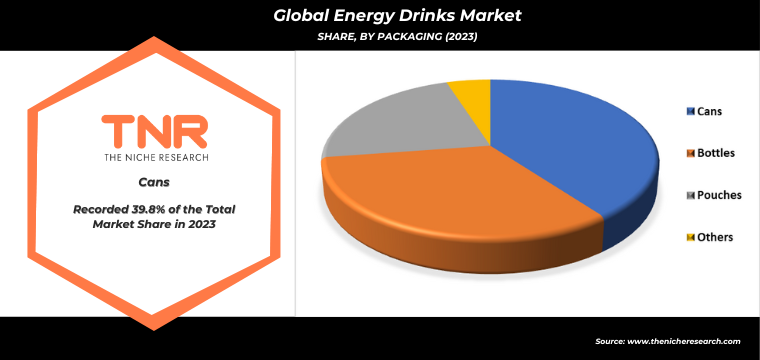
Cans accounted for the largest revenue share in 2023 in the global market with a revenue share of 39.8%. Cans offer convenience and portability, making them popular among consumers for on-the-go consumption. Additionally, cans provide better preservation of the drink’s freshness and flavours, ensuring a consistent quality experience for consumers. The rise of single-serve packaging formats also contributes to the increased popularity of cans. Furthermore, their recyclability and environmental friendliness align with growing sustainability concerns among consumers, further solidifying cans’ position as the preferred packaging choice in the energy drinks market.

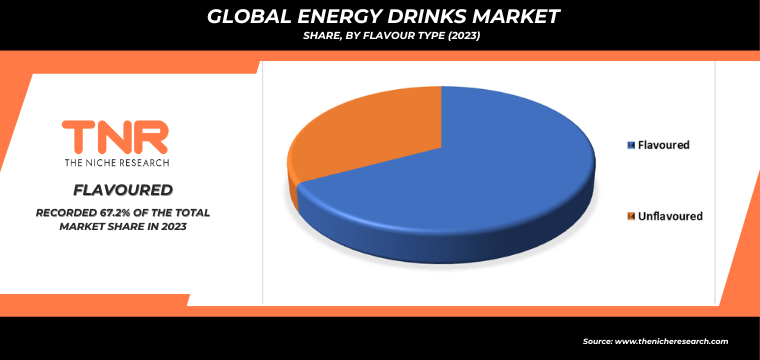
Flavoured energy drinks dominated the energy drinks market and is anticipated to continue its dominance through the forecast timeline. Flavoured options offer consumers a diverse and enjoyable drinking experience, catering to various taste preferences and appealing to a wider audience. Secondly, the introduction of innovative and exotic flavours profiles has spurred consumer interest, driving demand for flavoured energy drinks. Additionally, flavoured variants often provide a refreshing alternative to traditional energy drinks, making them more appealing for consumption in different settings and occasions. Moreover, the continuous product innovation by manufacturers, introducing new and exciting flavours combinations, further solidifies the dominance of flavoured energy drinks in the market landscape, ensuring sustained growth and consumer engagement.

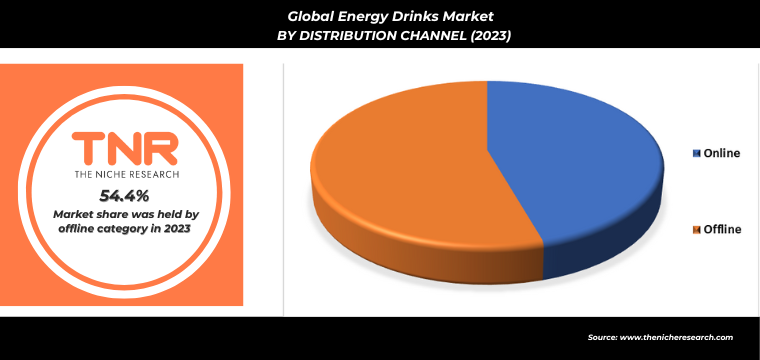
Online segment is anticipated to grow fastest over the forecast period. Increasing digitalization of retail has led to a surge in online shopping for convenience and accessibility. Consumers now prefer the ease of browsing and purchasing energy drinks from the comfort of their homes or on mobile devices. Additionally, the COVID-19 pandemic has accelerated the shift towards e-commerce as consumers prioritize contactless shopping experiences. Furthermore, the online channel offers a wider selection of products and often provides exclusive deals and promotions, enticing consumers to buy energy drinks online. As a result, the online distribution channel is expected to see exponential growth, catering to evolving consumer preferences and shopping behaviours.

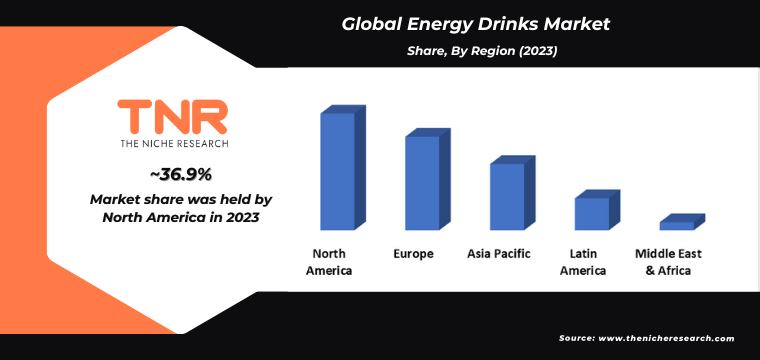
Asia Pacific is expected to emerge as the second-leading region in the energy drinks market, following North America. The region’s large and rapidly expanding population, particularly in countries like China and India, presents a vast consumer base with increasing disposable incomes and changing lifestyles. As urbanization progresses, there’s a growing demand for convenient energy-boosting beverages to support hectic urban lifestyles and long work hours. Additionally, the influence of Western culture and the adoption of more active lifestyles are driving the popularity of energy drinks across Asia Pacific. Furthermore, aggressive marketing campaigns by leading brands and expanding distribution networks are boosting accessibility and awareness of energy drinks, contributing to the region’s expected emergence as a significant player in the global energy drinks market.

Competitive Landscape

The energy drinks market is highly competitive, with dominating key players like Red Bull, Monster, and Coca-Cola. These brands continually innovate with new flavours and formulations. Emerging players focus on niche markets with unique offerings, while regulatory scrutiny and health concerns shape industry dynamics, fostering competition and innovation.

Some of the players operating in the energy drinks market are

  • Asia Brewery Incorporated
  • Carlsberg A/S
  • Coca-Cola Co.
  • Dali foods group
  • Kabisa B.V.
  • Kraft Foods Inc.
  • LT Group Inc.
  • Monster Beverage Corp.
  • NEALKO ORAVAN, spol s.r.o
  • Nestlé S.A.
  • Otsuka Pharmaceutical Co.
  • PepsiCo Inc.
  • Red Bull GmbH
  • Shenzhen Eastroc Beverage Co. Ltd.
  • Suntory Holdings Ltd.
  • The Gatorade Company, Inc.
  • Other Industry Participants

Global Energy Drinks Market Scope

Report Specifications Details
Market Revenue in 2023 US$ 89.7 Bn
Market Size Forecast by 2034 US$ 240.9 Bn
Growth Rate (CAGR) 9.4%
Historic Data 2016 – 2022
Base Year for Estimation 2023
Forecast Period 2024 – 2034
Report Inclusions Market Size & Estimates, Market Dynamics, Competitive Scenario, Trends, Growth Factors, Market Determinants, Key Investment Segmentation, Product/Service/Solutions Benchmarking
Segments Covered By Nature, By Product Type, By Packaging, By Flavour Type, By Distribution Channel, By Region
Regions Covered North America, Europe, Asia Pacific, Middle East & Africa, Latin America
Countries Covered U.S., Canada, Mexico, Rest of North America,  France, The UK, Spain, Germany, Italy, Nordic Countries (Denmark, Finland, Iceland, Sweden, Norway), Benelux Union (Belgium, The Netherlands, Luxembourg), Rest of Europe,  China, Japan, India, New Zealand, Australia, South Korea, Southeast Asia (Indonesia, Thailand, Malaysia, Singapore, Rest of Southeast Asia), Rest of Asia Pacific,  Saudi Arabia, UAE, Egypt, Kuwait, South Africa, Rest of Middle East & Africa,  Brazil, Argentina, Rest of Latin America
Key Players Asia Brewery Incorporated, Carlsberg A/S, Coca-Cola Co., Dali foods group, Kabisa B.V., Kraft Foods Inc., LT Group Inc., Monster Beverage Corp., NEALKO ORAVAN, spol s.r.o, Nestlé S.A., Otsuka Pharmaceutical Co., PepsiCo Inc., Red Bull GmbH, Shenzhen Eastroc Beverage Co. Ltd., Suntory Holdings Ltd., The Gatorade Company, Inc.
Customization Scope Customization allows for the inclusion/modification of content pertaining to geographical regions, countries, and specific market segments.
Pricing & Procurement Options Explore purchase options tailored to your specific research requirements
Contact Details Consult With Our Expert

Japan (Toll-Free):  +81 663-386-8111

South Korea (Toll-Free):  +82-808- 703-126

Saudi Arabia (Toll-Free):  +966 800-850-1643

United Kingdom: +44 753-710-5080

United States: +1 302-232-5106

E-mail:  askanexpert@thenicheresearch.com


Global Energy Drinks Market

By Nature

  • Natural
  • Organic

By Product Type

  • Alcoholic
  • Non Alcoholic

By Packaging

  • Cans
  • Bottles
  • Pouches
  • Others

By Flavour Type

  • Flavoured
  • Unflavoured

By Distribution Channel

  • Online
  • Offline
    • Supermarkets/Hypermarkets
    • Specialty Stores
    • Others

By Region

  • North America (U.S., Canada, Mexico, Rest of North America)
  • Europe (France, The UK, Spain, Germany, Italy, Nordic Countries (Denmark, Finland, Iceland, Sweden, Norway), Benelux Union (Belgium, The Netherlands, Luxembourg), Rest of Europe)
  • Asia Pacific (China, Japan, India, New Zealand, Australia, South Korea, Southeast Asia (Indonesia, Thailand, Malaysia, Singapore, Rest of Southeast Asia), Rest of Asia Pacific)
  • Middle East & Africa (Saudi Arabia, UAE, Egypt, Kuwait, South Africa, Rest of Middle East & Africa)
  • Latin America (Brazil, Argentina, Rest of Latin America)

Report Layout

Table of Contents

.

1.Market Scope
1.1.Market Segmentation
1.2.Years Considered
1.2.1.Historic Years: 2016 – 2022
1.2.2.Base Year: 2023
1.2.3.Forecast Years: 2024 – 2034
2.Key Target Audiences
3.Research Methodology
3.1.Primary Research
3.1.1.Research Questionnaire
3.1.2.Global Percentage Breakdown
3.1.3.Primary Interviews: Key Opinion Leaders (KOLs)
3.2.Secondary Research
3.2.1.Paid Databases
3.2.2.Secondary Sources
3.3.Market Size Estimates
3.3.1.Top-Down Approach
3.3.2.Bottom-Up Approach
3.4.Data Triangulation Methodology
3.5.Research Assumptions
4.Recommendations and Insights from TNR’s Perspective**
5.Holistic Overview of Energy Drinks Market
6.Market Synopsis: Energy Drinks Market
7.Energy Drinks Market Analysis: Qualitative Perspective
7.1.Introduction
7.1.1.Product Definition
7.1.2.Industry Development
7.2.Market Dynamics
7.2.1.Drivers
7.2.2.Restraints
7.2.3.Opportunities
7.2.4.Challenges
7.3.Trends in Energy Drinks Market
7.4.Market Determinants Radar Chart
7.5.Macro-Economic and Micro-Economic Indicators: Energy Drinks Market
7.6.Industry Gross Margin Overview
7.7.Porter’s Five Force Analysis
7.8.Impact of Covid-19 on Energy Drinks Market
7.9.PESTEL Analysis
7.10.Value Chain Analysis
7.11.Pricing Analysis, By Region (2023)
7.11.1.North America
7.11.2.Europe
7.11.3.Asia Pacific
7.11.4.Middle East and Africa
7.11.5.Latin America
8.Global Energy Drinks Market Analysis and Forecasts, 2024 – 2034
8.1.Overview
8.1.1.Global Energy Drinks Market Revenue (US$ Mn)
8.2.Global Energy Drinks Market Revenue (US$ Mn) and Forecasts, By Nature
8.2.1.Natural
8.2.1.1.Definition
8.2.1.2.Market Estimation and Penetration, 2016 – 2023
8.2.1.3.Market Forecast, 2024 – 2034
8.2.1.4.Compound Annual Growth Rate (CAGR)
8.2.1.5.Regional Bifurcation
8.2.1.5.1.North America
8.2.1.5.1.1.Market Estimation, 2016 – 2023
8.2.1.5.1.2.Market Forecast, 2024 – 2034
8.2.1.5.2.Europe
8.2.1.5.2.1.Market Estimation, 2016 – 2023
8.2.1.5.2.2.Market Forecast, 2024 – 2034
8.2.1.5.3.Asia Pacific
8.2.1.5.3.1.Market Estimation, 2016 – 2023
8.2.1.5.3.2.Market Forecast, 2024 – 2034
8.2.1.5.4.Middle East and Africa
8.2.1.5.4.1.Market Estimation, 2016 – 2023
8.2.1.5.4.2.Market Forecast, 2024 – 2034
8.2.1.5.5.Latin America
8.2.1.5.5.1.Market Estimation, 2016 – 2023
8.2.1.5.5.2.Market Forecast, 2024 – 2034
8.2.2.Organic
8.2.2.1.Definition
8.2.2.2.Market Estimation and Penetration, 2016 – 2023
8.2.2.3.Market Forecast, 2024 – 2034
8.2.2.4.Compound Annual Growth Rate (CAGR)
8.2.2.5.Regional Bifurcation
8.2.2.5.1.North America
8.2.2.5.1.1.Market Estimation, 2016 – 2023
8.2.2.5.1.2.Market Forecast, 2024 – 2034
8.2.2.5.2.Europe
8.2.2.5.2.1.Market Estimation, 2016 – 2023
8.2.2.5.2.2.Market Forecast, 2024 – 2034
8.2.2.5.3.Asia Pacific
8.2.2.5.3.1.Market Estimation, 2016 – 2023
8.2.2.5.3.2.Market Forecast, 2024 – 2034
8.2.2.5.4.Middle East and Africa
8.2.2.5.4.1.Market Estimation, 2016 – 2023
8.2.2.5.4.2.Market Forecast, 2024 – 2034
8.2.2.5.5.Latin America
8.2.2.5.5.1.Market Estimation, 2016 – 2023
8.2.2.5.5.2.Market Forecast, 2024 – 2034
8.3.Key Segment for Channeling Investments
8.3.1.By Nature
9.Global Energy Drinks Market Analysis and Forecasts, 2024 – 2034
9.1.Overview
9.2.Global Energy Drinks Market Revenue (US$ Mn) and Forecasts, By Product Type
9.2.1.Alcoholic
9.2.1.1.Definition
9.2.1.2.Market Estimation and Penetration, 2016 – 2023
9.2.1.3.Market Forecast, 2024 – 2034
9.2.1.4.Compound Annual Growth Rate (CAGR)
9.2.1.5.Regional Bifurcation
9.2.1.5.1.North America
9.2.1.5.1.1.Market Estimation, 2016 – 2023
9.2.1.5.1.2.Market Forecast, 2024 – 2034
9.2.1.5.2.Europe
9.2.1.5.2.1.Market Estimation, 2016 – 2023
9.2.1.5.2.2.Market Forecast, 2024 – 2034
9.2.1.5.3.Asia Pacific
9.2.1.5.3.1.Market Estimation, 2016 – 2023
9.2.1.5.3.2.Market Forecast, 2024 – 2034
9.2.1.5.4.Middle East and Africa
9.2.1.5.4.1.Market Estimation, 2016 – 2023
9.2.1.5.4.2.Market Forecast, 2024 – 2034
9.2.1.5.5.Latin America
9.2.1.5.5.1.Market Estimation, 2016 – 2023
9.2.1.5.5.2.Market Forecast, 2024 – 2034
9.2.2.Non Alcoholic
9.2.2.1.Definition
9.2.2.2.Market Estimation and Penetration, 2016 – 2023
9.2.2.3.Market Forecast, 2024 – 2034
9.2.2.4.Compound Annual Growth Rate (CAGR)
9.2.2.5.Regional Bifurcation
9.2.2.5.1.North America
9.2.2.5.1.1.Market Estimation, 2016 – 2023
9.2.2.5.1.2.Market Forecast, 2024 – 2034
9.2.2.5.2.Europe
9.2.2.5.2.1.Market Estimation, 2016 – 2023
9.2.2.5.2.2.Market Forecast, 2024 – 2034
9.2.2.5.3.Asia Pacific
9.2.2.5.3.1.Market Estimation, 2016 – 2023
9.2.2.5.3.2.Market Forecast, 2024 – 2034
9.2.2.5.4.Middle East and Africa
9.2.2.5.4.1.Market Estimation, 2016 – 2023
9.2.2.5.4.2.Market Forecast, 2024 – 2034
9.2.2.5.5.Latin America
9.2.2.5.5.1.Market Estimation, 2016 – 2023
9.2.2.5.5.2.Market Forecast, 2024 – 2034
9.3.Key Segment for Channeling Investments
9.3.1.By Product Type
10.Global Energy Drinks Market Analysis and Forecasts, 2024 – 2034
10.1.Overview
10.2.Global Energy Drinks Market Revenue (US$ Mn) and Forecasts, By Packaging
10.2.1.Cans
10.2.1.1.Definition
10.2.1.2.Market Estimation and Penetration, 2016 – 2023
10.2.1.3.Market Forecast, 2024 – 2034
10.2.1.4.Compound Annual Growth Rate (CAGR)
10.2.1.5.Regional Bifurcation
10.2.1.5.1.North America
10.2.1.5.1.1.Market Estimation, 2016 – 2023
10.2.1.5.1.2.Market Forecast, 2024 – 2034
10.2.1.5.2.Europe
10.2.1.5.2.1.Market Estimation, 2016 – 2023
10.2.1.5.2.2.Market Forecast, 2024 – 2034
10.2.1.5.3.Asia Pacific
10.2.1.5.3.1.Market Estimation, 2016 – 2023
10.2.1.5.3.2.Market Forecast, 2024 – 2034
10.2.1.5.4.Middle East and Africa
10.2.1.5.4.1.Market Estimation, 2016 – 2023
10.2.1.5.4.2.Market Forecast, 2024 – 2034
10.2.1.5.5.Latin America
10.2.1.5.5.1.Market Estimation, 2016 – 2023
10.2.1.5.5.2.Market Forecast, 2024 – 2034
10.2.2.Bottles
10.2.2.1.Definition
10.2.2.2.Market Estimation and Penetration, 2016 – 2023
10.2.2.3.Market Forecast, 2024 – 2034
10.2.2.4.Compound Annual Growth Rate (CAGR)
10.2.2.5.Regional Bifurcation
10.2.2.5.1.North America
10.2.2.5.1.1.Market Estimation, 2016 – 2023
10.2.2.5.1.2.Market Forecast, 2024 – 2034
10.2.2.5.2.Europe
10.2.2.5.2.1.Market Estimation, 2016 – 2023
10.2.2.5.2.2.Market Forecast, 2024 – 2034
10.2.2.5.3.Asia Pacific
10.2.2.5.3.1.Market Estimation, 2016 – 2023
10.2.2.5.3.2.Market Forecast, 2024 – 2034
10.2.2.5.4.Middle East and Africa
10.2.2.5.4.1.Market Estimation, 2016 – 2023
10.2.2.5.4.2.Market Forecast, 2024 – 2034
10.2.2.5.5.Latin America
10.2.2.5.5.1.Market Estimation, 2016 – 2023
10.2.2.5.5.2.Market Forecast, 2024 – 2034
10.2.3.Pouches
10.2.3.1.Definition
10.2.3.2.Market Estimation and Penetration, 2016 – 2023
10.2.3.3.Market Forecast, 2024 – 2034
10.2.3.4.Compound Annual Growth Rate (CAGR)
10.2.3.5.Regional Bifurcation
10.2.3.5.1.North America
10.2.3.5.1.1.Market Estimation, 2016 – 2023
10.2.3.5.1.2.Market Forecast, 2024 – 2034
10.2.3.5.2.Europe
10.2.3.5.2.1.Market Estimation, 2016 – 2023
10.2.3.5.2.2.Market Forecast, 2024 – 2034
10.2.3.5.3.Asia Pacific
10.2.3.5.3.1.Market Estimation, 2016 – 2023
10.2.3.5.3.2.Market Forecast, 2024 – 2034
10.2.3.5.4.Middle East and Africa
10.2.3.5.4.1.Market Estimation, 2016 – 2023
10.2.3.5.4.2.Market Forecast, 2024 – 2034
10.2.3.5.5.Latin America
10.2.3.5.5.1.Market Estimation, 2016 – 2023
10.2.3.5.5.2.Market Forecast, 2024 – 2034
10.2.4.Others
10.2.4.1.Definition
10.2.4.2.Market Estimation and Penetration, 2016 – 2023
10.2.4.3.Market Forecast, 2024 – 2034
10.2.4.4.Compound Annual Growth Rate (CAGR)
10.2.4.5.Regional Bifurcation
10.2.4.5.1.North America
10.2.4.5.1.1.Market Estimation, 2016 – 2023
10.2.4.5.1.2.Market Forecast, 2024 – 2034
10.2.4.5.2.Europe
10.2.4.5.2.1.Market Estimation, 2016 – 2023
10.2.4.5.2.2.Market Forecast, 2024 – 2034
10.2.4.5.3.Asia Pacific
10.2.4.5.3.1.Market Estimation, 2016 – 2023
10.2.4.5.3.2.Market Forecast, 2024 – 2034
10.2.4.5.4.Middle East and Africa
10.2.4.5.4.1.Market Estimation, 2016 – 2023
10.2.4.5.4.2.Market Forecast, 2024 – 2034
10.2.4.5.5.Latin America
10.2.4.5.5.1.Market Estimation, 2016 – 2023
10.2.4.5.5.2.Market Forecast, 2024 – 2034
10.3.Key Segment for Channeling Investments
10.3.1.By Packaging
11.Global Energy Drinks Market Analysis and Forecasts, 2024 – 2034
11.1.Overview
11.2.Global Energy Drinks Market Revenue (US$ Mn) and Forecasts, By Flavour Type
11.2.1.Flavoured
11.2.1.1.Definition
11.2.1.2.Market Estimation and Penetration, 2016 – 2023
11.2.1.3.Market Forecast, 2024 – 2034
11.2.1.4.Compound Annual Growth Rate (CAGR)
11.2.1.5.Regional Bifurcation
11.2.1.5.1.North America
11.2.1.5.1.1.Market Estimation, 2016 – 2023
11.2.1.5.1.2.Market Forecast, 2024 – 2034
11.2.1.5.2.Europe
11.2.1.5.2.1.Market Estimation, 2016 – 2023
11.2.1.5.2.2.Market Forecast, 2024 – 2034
11.2.1.5.3.Asia Pacific
11.2.1.5.3.1.Market Estimation, 2016 – 2023
11.2.1.5.3.2.Market Forecast, 2024 – 2034
11.2.1.5.4.Middle East and Africa
11.2.1.5.4.1.Market Estimation, 2016 – 2023
11.2.1.5.4.2.Market Forecast, 2024 – 2034
11.2.1.5.5.Latin America
11.2.1.5.5.1.Market Estimation, 2016 – 2023
11.2.1.5.5.2.Market Forecast, 2024 – 2034
11.2.2.Unflavoured
11.2.2.1.Definition
11.2.2.2.Market Estimation and Penetration, 2016 – 2023
11.2.2.3.Market Forecast, 2024 – 2034
11.2.2.4.Compound Annual Growth Rate (CAGR)
11.2.2.5.Regional Bifurcation
11.2.2.5.1.North America
11.2.2.5.1.1.Market Estimation, 2016 – 2023
11.2.2.5.1.2.Market Forecast, 2024 – 2034
11.2.2.5.2.Europe
11.2.2.5.2.1.Market Estimation, 2016 – 2023
11.2.2.5.2.2.Market Forecast, 2024 – 2034
11.2.2.5.3.Asia Pacific
11.2.2.5.3.1.Market Estimation, 2016 – 2023
11.2.2.5.3.2.Market Forecast, 2024 – 2034
11.2.2.5.4.Middle East and Africa
11.2.2.5.4.1.Market Estimation, 2016 – 2023
11.2.2.5.4.2.Market Forecast, 2024 – 2034
11.2.2.5.5.Latin America
11.2.2.5.5.1.Market Estimation, 2016 – 2023
11.2.2.5.5.2.Market Forecast, 2024 – 2034
11.3.Key Segment for Channeling Investments
11.3.1.By Flavour Type
12.Global Energy Drinks Market Analysis and Forecasts, 2024 – 2034
12.1.Overview
12.2.Global Energy Drinks Market Revenue (US$ Mn) and Forecasts, By Distribution Channel
12.2.1.Online
12.2.1.1.Definition
12.2.1.2.Market Estimation and Penetration, 2016 – 2023
12.2.1.3.Market Forecast, 2024 – 2034
12.2.1.4.Compound Annual Growth Rate (CAGR)
12.2.1.5.Regional Bifurcation
12.2.1.5.1.North America
12.2.1.5.1.1.Market Estimation, 2016 – 2023
12.2.1.5.1.2.Market Forecast, 2024 – 2034
12.2.1.5.2.Europe
12.2.1.5.2.1.Market Estimation, 2016 – 2023
12.2.1.5.2.2.Market Forecast, 2024 – 2034
12.2.1.5.3.Asia Pacific
12.2.1.5.3.1.Market Estimation, 2016 – 2023
12.2.1.5.3.2.Market Forecast, 2024 – 2034
12.2.1.5.4.Middle East and Africa
12.2.1.5.4.1.Market Estimation, 2016 – 2023
12.2.1.5.4.2.Market Forecast, 2024 – 2034
12.2.1.5.5.Latin America
12.2.1.5.5.1.Market Estimation, 2016 – 2023
12.2.1.5.5.2.Market Forecast, 2024 – 2034
12.2.2.Offline (Definition, Market Estimation and Penetration, 2016 – 2023, Market Estimation (2016 – 2023), Market Forecast (2024 – 2034), Compound Annual Growth Rate (CAGR), Regional Bifurcation (North America, Europe, Asia Pacific, Middle East and Africa, Latin America) and Information on Supermarkets/Hypermarkets, Specialty Stores, Others)
12.2.2.1.Supermarkets/Hypermarkets
12.2.2.2.Specialty Stores
12.2.2.3.Others
12.3.Key Segment for Channeling Investments
12.3.1.By Distribution Channel
13.North America Energy Drinks Market Analysis and Forecasts, 2024 – 2034
13.1.Overview
13.1.1.North America Energy Drinks Market Revenue (US$ Mn)
13.2.North America Energy Drinks Market Revenue (US$ Mn) and Forecasts, By Nature
13.2.1.Natural
13.2.2.Organic
13.3.North America Energy Drinks Market Revenue (US$ Mn) and Forecasts, By Product Type
13.3.1.Alcoholic
13.3.2.Non Alcoholic
13.4.North America Energy Drinks Market Revenue (US$ Mn) and Forecasts, By Packaging
13.4.1.Cans
13.4.2.Bottles
13.4.3.Pouches
13.4.4.Others
13.5.North America Energy Drinks Market Revenue (US$ Mn) and Forecasts, By Flavour Type
13.5.1.Flavoured
13.5.2.Unflavoured
13.6.North America Energy Drinks Market Revenue (US$ Mn) and Forecasts, By Distribution Channel
13.6.1.Online
13.6.2.Offline
13.6.2.1.Supermarkets/Hypermarkets
13.6.2.2.Specialty Stores
13.6.2.3.Others
13.7.North America Energy Drinks Market Revenue (US$ Mn) and Forecasts, By Country
13.7.1.U.S
13.7.1.1.U.S Energy Drinks Market Revenue (US$ Mn) and Forecasts, By Nature
13.7.1.1.1.Natural
13.7.1.1.2.Organic
13.7.1.2.U.S Energy Drinks Market Revenue (US$ Mn) and Forecasts, By Product Type
13.7.1.2.1.Alcoholic
13.7.1.2.2.Non Alcoholic
13.7.1.3.U.S Energy Drinks Market Revenue (US$ Mn) and Forecasts, By Packaging
13.7.1.3.1.Cans
13.7.1.3.2.Bottles
13.7.1.3.3.Pouches
13.7.1.3.4.Others
13.7.1.4.U.S Energy Drinks Market Revenue (US$ Mn) and Forecasts, By Flavour Type
13.7.1.4.1.Flavoured
13.7.1.4.2.Unflavoured
13.7.1.5.U.S Energy Drinks Market Revenue (US$ Mn) and Forecasts, By Distribution Channel
13.7.1.5.1.Online
13.7.1.5.2.Offline
13.7.1.5.2.1.Supermarkets/Hypermarkets
13.7.1.5.2.2.Specialty Stores
13.7.1.5.2.3.Others
13.7.2.Canada
13.7.2.1.Canada Energy Drinks Market Revenue (US$ Mn) and Forecasts, By Nature
13.7.2.1.1.Natural
13.7.2.1.2.Organic
13.7.2.2.Canada Energy Drinks Market Revenue (US$ Mn) and Forecasts, By Product Type
13.7.2.2.1.Alcoholic
13.7.2.2.2.Non Alcoholic
13.7.2.3.Canada Energy Drinks Market Revenue (US$ Mn) and Forecasts, By Packaging
13.7.2.3.1.Cans
13.7.2.3.2.Bottles
13.7.2.3.3.Pouches
13.7.2.3.4.Others
13.7.2.4.Canada Energy Drinks Market Revenue (US$ Mn) and Forecasts, By Flavour Type
13.7.2.4.1.Flavoured
13.7.2.4.2.Unflavoured
13.7.2.5.Canada Energy Drinks Market Revenue (US$ Mn) and Forecasts, By Distribution Channel
13.7.2.5.1.Online
13.7.2.5.2.Offline
13.7.2.5.2.1.Supermarkets/Hypermarkets
13.7.2.5.2.2.Specialty Stores
13.7.2.5.2.3.Others
13.7.3.Mexico
13.7.3.1.Mexico Energy Drinks Market Revenue (US$ Mn) and Forecasts, By Nature
13.7.3.1.1.Natural
13.7.3.1.2.Organic
13.7.3.2.Mexico Energy Drinks Market Revenue (US$ Mn) and Forecasts, By Product Type
13.7.3.2.1.Alcoholic
13.7.3.2.2.Non Alcoholic
13.7.3.3.Mexico Energy Drinks Market Revenue (US$ Mn) and Forecasts, By Packaging
13.7.3.3.1.Cans
13.7.3.3.2.Bottles
13.7.3.3.3.Pouches
13.7.3.3.4.Others
13.7.3.4.Mexico Energy Drinks Market Revenue (US$ Mn) and Forecasts, By Flavour Type
13.7.3.4.1.Flavoured
13.7.3.4.2.Unflavoured
13.7.3.5.Mexico Energy Drinks Market Revenue (US$ Mn) and Forecasts, By Distribution Channel
13.7.3.5.1.Online
13.7.3.5.2.Offline
13.7.3.5.2.1.Supermarkets/Hypermarkets
13.7.3.5.2.2.Specialty Stores
13.7.3.5.2.3.Others
13.7.4.Rest of North America
13.7.4.1.Rest of North America Energy Drinks Market Revenue (US$ Mn) and Forecasts, By Nature
13.7.4.1.1.Natural
13.7.4.1.2.Organic
13.7.4.2.Rest of North America Energy Drinks Market Revenue (US$ Mn) and Forecasts, By Product Type
13.7.4.2.1.Alcoholic
13.7.4.2.2.Non Alcoholic
13.7.4.3.Rest of North America Energy Drinks Market Revenue (US$ Mn) and Forecasts, By Packaging
13.7.4.3.1.Cans
13.7.4.3.2.Bottles
13.7.4.3.3.Pouches
13.7.4.3.4.Others
13.7.4.4.Rest of North America Energy Drinks Market Revenue (US$ Mn) and Forecasts, By Flavour Type
13.7.4.4.1.Flavoured
13.7.4.4.2.Unflavoured
13.7.4.5.Rest of North America Energy Drinks Market Revenue (US$ Mn) and Forecasts, By Distribution Channel
13.7.4.5.1.Online
13.7.4.5.2.Offline
13.7.4.5.2.1.Supermarkets/Hypermarkets
13.7.4.5.2.2.Specialty Stores
13.7.4.5.2.3.Others
13.8.Key Segment for Channeling Investments
13.8.1.By Country
13.8.2.By Nature
13.8.3.By Product Type
13.8.4.By Packaging
13.8.5.By Flavour Type
13.8.6.By Distribution Channel
14.Europe Energy Drinks Market Analysis and Forecasts, 2024 – 2034
14.1.Overview
14.1.1.Europe Energy Drinks Market Revenue (US$ Mn)
14.2.Europe Energy Drinks Market Revenue (US$ Mn) and Forecasts, By Nature
14.2.1.Natural
14.2.2.Organic
14.3.Europe Energy Drinks Market Revenue (US$ Mn) and Forecasts, By Product Type
14.3.1.Alcoholic
14.3.2.Non Alcoholic
14.4.Europe Energy Drinks Market Revenue (US$ Mn) and Forecasts, By Packaging
14.4.1.Cans
14.4.2.Bottles
14.4.3.Pouches
14.4.4.Others
14.5.Europe Energy Drinks Market Revenue (US$ Mn) and Forecasts, By Flavour Type
14.5.1.Flavoured
14.5.2.Unflavoured
14.6.Europe Energy Drinks Market Revenue (US$ Mn) and Forecasts, By Distribution Channel
14.6.1.Online
14.6.2.Offline
14.6.2.1.Supermarkets/Hypermarkets
14.6.2.2.Specialty Stores
14.6.2.3.Others
14.7.Europe Energy Drinks Market Revenue (US$ Mn) and Forecasts, By Country
14.7.1.France
14.7.1.1.France Energy Drinks Market Revenue (US$ Mn) and Forecasts, By Nature
14.7.1.1.1.Natural
14.7.1.1.2.Organic
14.7.1.2.France Energy Drinks Market Revenue (US$ Mn) and Forecasts, By Product Type
14.7.1.2.1.Alcoholic
14.7.1.2.2.Non Alcoholic
14.7.1.3.France Energy Drinks Market Revenue (US$ Mn) and Forecasts, By Packaging
14.7.1.3.1.Cans
14.7.1.3.2.Bottles
14.7.1.3.3.Pouches
14.7.1.3.4.Others
14.7.1.4.France Energy Drinks Market Revenue (US$ Mn) and Forecasts, By Flavour Type
14.7.1.4.1.Flavoured
14.7.1.4.2.Unflavoured
14.7.1.5.France Energy Drinks Market Revenue (US$ Mn) and Forecasts, By Distribution Channel
14.7.1.5.1.Online
14.7.1.5.2.Offline
14.7.1.5.2.1.Supermarkets/Hypermarkets
14.7.1.5.2.2.Specialty Stores
14.7.1.5.2.3.Others
14.7.2.The UK
14.7.2.1.The UK Energy Drinks Market Revenue (US$ Mn) and Forecasts, By Nature
14.7.2.1.1.Natural
14.7.2.1.2.Organic
14.7.2.2.The UK Energy Drinks Market Revenue (US$ Mn) and Forecasts, By Product Type
14.7.2.2.1.Alcoholic
14.7.2.2.2.Non Alcoholic
14.7.2.3.The UK Energy Drinks Market Revenue (US$ Mn) and Forecasts, By Packaging
14.7.2.3.1.Cans
14.7.2.3.2.Bottles
14.7.2.3.3.Pouches
14.7.2.3.4.Others
14.7.2.4.The UK Energy Drinks Market Revenue (US$ Mn) and Forecasts, By Flavour Type
14.7.2.4.1.Flavoured
14.7.2.4.2.Unflavoured
14.7.2.5.The UK Energy Drinks Market Revenue (US$ Mn) and Forecasts, By Distribution Channel
14.7.2.5.1.Online
14.7.2.5.2.Offline
14.7.2.5.2.1.Supermarkets/Hypermarkets
14.7.2.5.2.2.Specialty Stores
14.7.2.5.2.3.Others
14.7.3.Spain
14.7.3.1.Spain Energy Drinks Market Revenue (US$ Mn) and Forecasts, By Nature
14.7.3.1.1.Natural
14.7.3.1.2.Organic
14.7.3.2.Spain Energy Drinks Market Revenue (US$ Mn) and Forecasts, By Product Type
14.7.3.2.1.Alcoholic
14.7.3.2.2.Non Alcoholic
14.7.3.3.Spain Energy Drinks Market Revenue (US$ Mn) and Forecasts, By Packaging
14.7.3.3.1.Cans
14.7.3.3.2.Bottles
14.7.3.3.3.Pouches
14.7.3.3.4.Others
14.7.3.4.Spain Energy Drinks Market Revenue (US$ Mn) and Forecasts, By Flavour Type
14.7.3.4.1.Flavoured
14.7.3.4.2.Unflavoured
14.7.3.5.Spain Energy Drinks Market Revenue (US$ Mn) and Forecasts, By Distribution Channel
14.7.3.5.1.Online
14.7.3.5.2.Offline
14.7.3.5.2.1.Supermarkets/Hypermarkets
14.7.3.5.2.2.Specialty Stores
14.7.3.5.2.3.Others
14.7.4.Germany
14.7.4.1.Germany Energy Drinks Market Revenue (US$ Mn) and Forecasts, By Nature
14.7.4.1.1.Natural
14.7.4.1.2.Organic
14.7.4.2.Germany Energy Drinks Market Revenue (US$ Mn) and Forecasts, By Product Type
14.7.4.2.1.Alcoholic
14.7.4.2.2.Non Alcoholic
14.7.4.3.Germany Energy Drinks Market Revenue (US$ Mn) and Forecasts, By Packaging
14.7.4.3.1.Cans
14.7.4.3.2.Bottles
14.7.4.3.3.Pouches
14.7.4.3.4.Others
14.7.4.4.Germany Energy Drinks Market Revenue (US$ Mn) and Forecasts, By Flavour Type
14.7.4.4.1.Flavoured
14.7.4.4.2.Unflavoured
14.7.4.5.Germany Energy Drinks Market Revenue (US$ Mn) and Forecasts, By Distribution Channel
14.7.4.5.1.Online
14.7.4.5.2.Offline
14.7.4.5.2.1.Supermarkets/Hypermarkets
14.7.4.5.2.2.Specialty Stores
14.7.4.5.2.3.Others
14.7.5.Italy
14.7.5.1.Italy Energy Drinks Market Revenue (US$ Mn) and Forecasts, By Nature
14.7.5.1.1.Natural
14.7.5.1.2.Organic
14.7.5.2.Italy Energy Drinks Market Revenue (US$ Mn) and Forecasts, By Product Type
14.7.5.2.1.Alcoholic
14.7.5.2.2.Non Alcoholic
14.7.5.3.Italy Energy Drinks Market Revenue (US$ Mn) and Forecasts, By Packaging
14.7.5.3.1.Cans
14.7.5.3.2.Bottles
14.7.5.3.3.Pouches
14.7.5.3.4.Others
14.7.5.4.Italy Energy Drinks Market Revenue (US$ Mn) and Forecasts, By Flavour Type
14.7.5.4.1.Flavoured
14.7.5.4.2.Unflavoured
14.7.5.5.Italy Energy Drinks Market Revenue (US$ Mn) and Forecasts, By Distribution Channel
14.7.5.5.1.Online
14.7.5.5.2.Offline
14.7.5.5.2.1.Supermarkets/Hypermarkets
14.7.5.5.2.2.Specialty Stores
14.7.5.5.2.3.Others
14.7.6.Nordic Countries
14.7.6.1.Nordic Countries Energy Drinks Market Revenue (US$ Mn) and Forecasts, By Nature
14.7.6.1.1.Natural
14.7.6.1.2.Organic
14.7.6.2.Nordic Countries Energy Drinks Market Revenue (US$ Mn) and Forecasts, By Product Type
14.7.6.2.1.Alcoholic
14.7.6.2.2.Non Alcoholic
14.7.6.3.Nordic Countries Energy Drinks Market Revenue (US$ Mn) and Forecasts, By Packaging
14.7.6.3.1.Cans
14.7.6.3.2.Bottles
14.7.6.3.3.Pouches
14.7.6.3.4.Others
14.7.6.4.Nordic Countries Energy Drinks Market Revenue (US$ Mn) and Forecasts, By Flavour Type
14.7.6.4.1.Flavoured
14.7.6.4.2.Unflavoured
14.7.6.5.Nordic Countries Energy Drinks Market Revenue (US$ Mn) and Forecasts, By Distribution Channel
14.7.6.5.1.Online
14.7.6.5.2.Offline
14.7.6.5.2.1.Supermarkets/Hypermarkets
14.7.6.5.2.2.Specialty Stores
14.7.6.5.2.3.Others
14.7.6.6.Nordic Countries Energy Drinks Market Revenue (US$ Mn) and Forecasts, By Country
14.7.6.6.1.Denmark
14.7.6.6.2.Finland
14.7.6.6.3.Iceland
14.7.6.6.4.Sweden
14.7.6.6.5.Norway
14.7.7.Benelux Union
14.7.7.1.Benelux Union Energy Drinks Market Revenue (US$ Mn) and Forecasts, By Nature
14.7.7.1.1.Natural
14.7.7.1.2.Organic
14.7.7.2.Benelux Union Energy Drinks Market Revenue (US$ Mn) and Forecasts, By Product Type
14.7.7.2.1.Alcoholic
14.7.7.2.2.Non Alcoholic
14.7.7.3.Benelux Union Energy Drinks Market Revenue (US$ Mn) and Forecasts, By Packaging
14.7.7.3.1.Cans
14.7.7.3.2.Bottles
14.7.7.3.3.Pouches
14.7.7.3.4.Others
14.7.7.4.Benelux Union Energy Drinks Market Revenue (US$ Mn) and Forecasts, By Flavour Type
14.7.7.4.1.Flavoured
14.7.7.4.2.Unflavoured
14.7.7.5.Benelux Union Energy Drinks Market Revenue (US$ Mn) and Forecasts, By Distribution Channel
14.7.7.5.1.Online
14.7.7.5.2.Offline
14.7.7.5.2.1.Supermarkets/Hypermarkets
14.7.7.5.2.2.Specialty Stores
14.7.7.5.2.3.Others
14.7.7.6.Benelux Union Energy Drinks Market Revenue (US$ Mn) and Forecasts, By Country
14.7.7.6.1.Belgium
14.7.7.6.2.The Netherlands
14.7.7.6.3.Luxembourg
14.7.8.Rest of Europe
14.7.8.1.Rest of Europe Energy Drinks Market Revenue (US$ Mn) and Forecasts, By Nature
14.7.8.1.1.Natural
14.7.8.1.2.Organic
14.7.8.2.Rest of Europe Energy Drinks Market Revenue (US$ Mn) and Forecasts, By Product Type
14.7.8.2.1.Alcoholic
14.7.8.2.2.Non Alcoholic
14.7.8.3.Rest of Europe Energy Drinks Market Revenue (US$ Mn) and Forecasts, By Packaging
14.7.8.3.1.Cans
14.7.8.3.2.Bottles
14.7.8.3.3.Pouches
14.7.8.3.4.Others
14.7.8.4.Rest of Europe Energy Drinks Market Revenue (US$ Mn) and Forecasts, By Flavour Type
14.7.8.4.1.Flavoured
14.7.8.4.2.Unflavoured
14.7.8.5.Rest of Europe Energy Drinks Market Revenue (US$ Mn) and Forecasts, By Distribution Channel
14.7.8.5.1.Online
14.7.8.5.2.Offline
14.7.8.5.2.1.Supermarkets/Hypermarkets
14.7.8.5.2.2.Specialty Stores
14.7.8.5.2.3.Others
14.8.Key Segment for Channeling Investments
14.8.1.By Country
14.8.2.By Nature
14.8.3.By Product Type
14.8.4.By Packaging
14.8.5.By Flavour Type
14.8.6.By Distribution Channel
15.Asia Pacific Energy Drinks Market Analysis and Forecasts, 2024 – 2034
15.1.Overview
15.1.1.Asia Pacific Energy Drinks Market Revenue (US$ Mn)
15.2.Asia Pacific Energy Drinks Market Revenue (US$ Mn) and Forecasts, By Nature
15.2.1.Natural
15.2.2.Organic
15.3.Asia Pacific Energy Drinks Market Revenue (US$ Mn) and Forecasts, By Product Type
15.3.1.Alcoholic
15.3.2.Non Alcoholic
15.4.Asia Pacific Energy Drinks Market Revenue (US$ Mn) and Forecasts, By Packaging
15.4.1.Cans
15.4.2.Bottles
15.4.3.Pouches
15.4.4.Others
15.5.Asia Pacific Energy Drinks Market Revenue (US$ Mn) and Forecasts, By Flavour Type
15.5.1.Flavoured
15.5.2.Unflavoured
15.6.Asia Pacific Energy Drinks Market Revenue (US$ Mn) and Forecasts, By Distribution Channel
15.6.1.Online
15.6.2.Offline
15.6.2.1.Supermarkets/Hypermarkets
15.6.2.2.Specialty Stores
15.6.2.3.Others
15.7.Asia Pacific Energy Drinks Market Revenue (US$ Mn) and Forecasts, By Country
15.7.1.China
15.7.1.1.China Energy Drinks Market Revenue (US$ Mn) and Forecasts, By Nature
15.7.1.1.1.Natural
15.7.1.1.2.Organic
15.7.1.2.China Energy Drinks Market Revenue (US$ Mn) and Forecasts, By Product Type
15.7.1.2.1.Alcoholic
15.7.1.2.2.Non Alcoholic
15.7.1.3.China Energy Drinks Market Revenue (US$ Mn) and Forecasts, By Packaging
15.7.1.3.1.Cans
15.7.1.3.2.Bottles
15.7.1.3.3.Pouches
15.7.1.3.4.Others
15.7.1.4.China Energy Drinks Market Revenue (US$ Mn) and Forecasts, By Flavour Type
15.7.1.4.1.Flavoured
15.7.1.4.2.Unflavoured
15.7.1.5.China Energy Drinks Market Revenue (US$ Mn) and Forecasts, By Distribution Channel
15.7.1.5.1.Online
15.7.1.5.2.Offline
15.7.1.5.2.1.Supermarkets/Hypermarkets
15.7.1.5.2.2.Specialty Stores
15.7.1.5.2.3.Others
15.7.2.Japan
15.7.2.1.Japan Energy Drinks Market Revenue (US$ Mn) and Forecasts, By Nature
15.7.2.1.1.Natural
15.7.2.1.2.Organic
15.7.2.2.Japan Energy Drinks Market Revenue (US$ Mn) and Forecasts, By Product Type
15.7.2.2.1.Alcoholic
15.7.2.2.2.Non Alcoholic
15.7.2.3.Japan Energy Drinks Market Revenue (US$ Mn) and Forecasts, By Packaging
15.7.2.3.1.Cans
15.7.2.3.2.Bottles
15.7.2.3.3.Pouches
15.7.2.3.4.Others
15.7.2.4.Japan Energy Drinks Market Revenue (US$ Mn) and Forecasts, By Flavour Type
15.7.2.4.1.Flavoured
15.7.2.4.2.Unflavoured
15.7.2.5.Japan Energy Drinks Market Revenue (US$ Mn) and Forecasts, By Distribution Channel
15.7.2.5.1.Online
15.7.2.5.2.Offline
15.7.2.5.2.1.Supermarkets/Hypermarkets
15.7.2.5.2.2.Specialty Stores
15.7.2.5.2.3.Others
15.7.3.India
15.7.3.1.India Energy Drinks Market Revenue (US$ Mn) and Forecasts, By Nature
15.7.3.1.1.Natural
15.7.3.1.2.Organic
15.7.3.2.India Energy Drinks Market Revenue (US$ Mn) and Forecasts, By Product Type
15.7.3.2.1.Alcoholic
15.7.3.2.2.Non Alcoholic
15.7.3.3.India Energy Drinks Market Revenue (US$ Mn) and Forecasts, By Packaging
15.7.3.3.1.Cans
15.7.3.3.2.Bottles
15.7.3.3.3.Pouches
15.7.3.3.4.Others
15.7.3.4.India Energy Drinks Market Revenue (US$ Mn) and Forecasts, By Flavour Type
15.7.3.4.1.Flavoured
15.7.3.4.2.Unflavoured
15.7.3.5.India Energy Drinks Market Revenue (US$ Mn) and Forecasts, By Distribution Channel
15.7.3.5.1.Online
15.7.3.5.2.Offline
15.7.3.5.2.1.Supermarkets/Hypermarkets
15.7.3.5.2.2.Specialty Stores
15.7.3.5.2.3.Others
15.7.4.New Zealand
15.7.4.1.New Zealand Energy Drinks Market Revenue (US$ Mn) and Forecasts, By Nature
15.7.4.1.1.Natural
15.7.4.1.2.Organic
15.7.4.2.New Zealand Energy Drinks Market Revenue (US$ Mn) and Forecasts, By Product Type
15.7.4.2.1.Alcoholic
15.7.4.2.2.Non Alcoholic
15.7.4.3.New Zealand Energy Drinks Market Revenue (US$ Mn) and Forecasts, By Packaging
15.7.4.3.1.Cans
15.7.4.3.2.Bottles
15.7.4.3.3.Pouches
15.7.4.3.4.Others
15.7.4.4.New Zealand Energy Drinks Market Revenue (US$ Mn) and Forecasts, By Flavour Type
15.7.4.4.1.Flavoured
15.7.4.4.2.Unflavoured
15.7.4.5.New Zealand Energy Drinks Market Revenue (US$ Mn) and Forecasts, By Distribution Channel
15.7.4.5.1.Online
15.7.4.5.2.Offline
15.7.4.5.2.1.Supermarkets/Hypermarkets
15.7.4.5.2.2.Specialty Stores
15.7.4.5.2.3.Others
15.7.5.Australia
15.7.5.1.Australia Energy Drinks Market Revenue (US$ Mn) and Forecasts, By Nature
15.7.5.1.1.Natural
15.7.5.1.2.Organic
15.7.5.2.Australia Energy Drinks Market Revenue (US$ Mn) and Forecasts, By Product Type
15.7.5.2.1.Alcoholic
15.7.5.2.2.Non Alcoholic
15.7.5.3.Australia Energy Drinks Market Revenue (US$ Mn) and Forecasts, By Packaging
15.7.5.3.1.Cans
15.7.5.3.2.Bottles
15.7.5.3.3.Pouches
15.7.5.3.4.Others
15.7.5.4.Australia Energy Drinks Market Revenue (US$ Mn) and Forecasts, By Flavour Type
15.7.5.4.1.Flavoured
15.7.5.4.2.Unflavoured
15.7.5.5.Australia Energy Drinks Market Revenue (US$ Mn) and Forecasts, By Distribution Channel
15.7.5.5.1.Online
15.7.5.5.2.Offline
15.7.5.5.2.1.Supermarkets/Hypermarkets
15.7.5.5.2.2.Specialty Stores
15.7.5.5.2.3.Others
15.7.6.South Korea
15.7.6.1.South Korea Energy Drinks Market Revenue (US$ Mn) and Forecasts, By Nature
15.7.6.1.1.Natural
15.7.6.1.2.Organic
15.7.6.2.South Korea Energy Drinks Market Revenue (US$ Mn) and Forecasts, By Product Type
15.7.6.2.1.Alcoholic
15.7.6.2.2.Non Alcoholic
15.7.6.3.South Korea Energy Drinks Market Revenue (US$ Mn) and Forecasts, By Packaging
15.7.6.3.1.Cans
15.7.6.3.2.Bottles
15.7.6.3.3.Pouches
15.7.6.3.4.Others
15.7.6.4.South Korea Energy Drinks Market Revenue (US$ Mn) and Forecasts, By Flavour Type
15.7.6.4.1.Flavoured
15.7.6.4.2.Unflavoured
15.7.6.5.South Korea Energy Drinks Market Revenue (US$ Mn) and Forecasts, By Distribution Channel
15.7.6.5.1.Online
15.7.6.5.2.Offline
15.7.6.5.2.1.Supermarkets/Hypermarkets
15.7.6.5.2.2.Specialty Stores
15.7.6.5.2.3.Others
15.7.7.Southeast Asia
15.7.7.1.Southeast Asia Energy Drinks Market Revenue (US$ Mn) and Forecasts, By Nature
15.7.7.1.1.Natural
15.7.7.1.2.Organic
15.7.7.2.Southeast Asia Energy Drinks Market Revenue (US$ Mn) and Forecasts, By Product Type
15.7.7.2.1.Alcoholic
15.7.7.2.2.Non Alcoholic
15.7.7.3.Southeast Asia Energy Drinks Market Revenue (US$ Mn) and Forecasts, By Packaging
15.7.7.3.1.Cans
15.7.7.3.2.Bottles
15.7.7.3.3.Pouches
15.7.7.3.4.Others
15.7.7.4.Southeast Asia Energy Drinks Market Revenue (US$ Mn) and Forecasts, By Flavour Type
15.7.7.4.1.Flavoured
15.7.7.4.2.Unflavoured
15.7.7.5.Southeast Asia Energy Drinks Market Revenue (US$ Mn) and Forecasts, By Distribution Channel
15.7.7.5.1.Online
15.7.7.5.2.Offline
15.7.7.5.2.1.Supermarkets/Hypermarkets
15.7.7.5.2.2.Specialty Stores
15.7.7.5.2.3.Others
15.7.7.6.Southeast Asia Energy Drinks Market Revenue (US$ Mn) and Forecasts, By Country
15.7.7.6.1.Indonesia
15.7.7.6.2.Thailand
15.7.7.6.3.Malaysia
15.7.7.6.4.Singapore
15.7.7.6.5.Rest of Southeast Asia
15.7.8.Rest of Asia Pacific
15.7.8.1.Rest of Asia Pacific Energy Drinks Market Revenue (US$ Mn) and Forecasts, By Nature
15.7.8.1.1.Natural
15.7.8.1.2.Organic
15.7.8.2.Rest of Asia Pacific Energy Drinks Market Revenue (US$ Mn) and Forecasts, By Product Type
15.7.8.2.1.Alcoholic
15.7.8.2.2.Non Alcoholic
15.7.8.3.Rest of Asia Pacific Energy Drinks Market Revenue (US$ Mn) and Forecasts, By Packaging
15.7.8.3.1.Cans
15.7.8.3.2.Bottles
15.7.8.3.3.Pouches
15.7.8.3.4.Others
15.7.8.4.Rest of Asia Pacific Energy Drinks Market Revenue (US$ Mn) and Forecasts, By Flavour Type
15.7.8.4.1.Flavoured
15.7.8.4.2.Unflavoured
15.7.8.5.Rest of Asia Pacific Energy Drinks Market Revenue (US$ Mn) and Forecasts, By Distribution Channel
15.7.8.5.1.Online
15.7.8.5.2.Offline
15.7.8.5.2.1.Supermarkets/Hypermarkets
15.7.8.5.2.2.Specialty Stores
15.7.8.5.2.3.Others
15.8.Key Segment for Channeling Investments
15.8.1.By Country
15.8.2.By Nature
15.8.3.By Product Type
15.8.4.By Packaging
15.8.5.By Flavour Type
15.8.6.By Distribution Channel
16.Middle East and Africa Energy Drinks Market Analysis and Forecasts, 2024 – 2034
16.1.Overview
16.1.1.Middle East and Africa Energy Drinks Market Revenue (US$ Mn)
16.2.Middle East and Africa Energy Drinks Market Revenue (US$ Mn) and Forecasts, By Nature
16.2.1.Natural
16.2.2.Organic
16.3.Middle East and Africa Energy Drinks Market Revenue (US$ Mn) and Forecasts, By Product Type
16.3.1.Alcoholic
16.3.2.Non Alcoholic
16.4.Middle East and Africa Energy Drinks Market Revenue (US$ Mn) and Forecasts, By Packaging
16.4.1.Cans
16.4.2.Bottles
16.4.3.Pouches
16.4.4.Others
16.5.Middle East and Africa Energy Drinks Market Revenue (US$ Mn) and Forecasts, By Flavour Type
16.5.1.Flavoured
16.5.2.Unflavoured
16.6.Middle East and Africa Energy Drinks Market Revenue (US$ Mn) and Forecasts, By Distribution Channel
16.6.1.Online
16.6.2.Offline
16.6.2.1.Supermarkets/Hypermarkets
16.6.2.2.Specialty Stores
16.6.2.3.Others
16.7.Middle East and Africa Energy Drinks Market Revenue (US$ Mn) and Forecasts, By Country
16.7.1.Saudi Arabia
16.7.1.1.Saudi Arabia Energy Drinks Market Revenue (US$ Mn) and Forecasts, By Nature
16.7.1.1.1.Natural
16.7.1.1.2.Organic
16.7.1.2.Saudi Arabia Energy Drinks Market Revenue (US$ Mn) and Forecasts, By Product Type
16.7.1.2.1.Alcoholic
16.7.1.2.2.Non Alcoholic
16.7.1.3.Saudi Arabia Energy Drinks Market Revenue (US$ Mn) and Forecasts, By Packaging
16.7.1.3.1.Cans
16.7.1.3.2.Bottles
16.7.1.3.3.Pouches
16.7.1.3.4.Others
16.7.1.4.Saudi Arabia Energy Drinks Market Revenue (US$ Mn) and Forecasts, By Flavour Type
16.7.1.4.1.Flavoured
16.7.1.4.2.Unflavoured
16.7.1.5.Saudi Arabia Energy Drinks Market Revenue (US$ Mn) and Forecasts, By Distribution Channel
16.7.1.5.1.Online
16.7.1.5.2.Offline
16.7.1.5.2.1.Supermarkets/Hypermarkets
16.7.1.5.2.2.Specialty Stores
16.7.1.5.2.3.Others
16.7.2.UAE
16.7.2.1.UAE Energy Drinks Market Revenue (US$ Mn) and Forecasts, By Nature
16.7.2.1.1.Natural
16.7.2.1.2.Organic
16.7.2.2.UAE Energy Drinks Market Revenue (US$ Mn) and Forecasts, By Product Type
16.7.2.2.1.Alcoholic
16.7.2.2.2.Non Alcoholic
16.7.2.3.UAE Energy Drinks Market Revenue (US$ Mn) and Forecasts, By Packaging
16.7.2.3.1.Cans
16.7.2.3.2.Bottles
16.7.2.3.3.Pouches
16.7.2.3.4.Others
16.7.2.4.UAE Energy Drinks Market Revenue (US$ Mn) and Forecasts, By Flavour Type
16.7.2.4.1.Flavoured
16.7.2.4.2.Unflavoured
16.7.2.5.UAE Energy Drinks Market Revenue (US$ Mn) and Forecasts, By Distribution Channel
16.7.2.5.1.Online
16.7.2.5.2.Offline
16.7.2.5.2.1.Supermarkets/Hypermarkets
16.7.2.5.2.2.Specialty Stores
16.7.2.5.2.3.Others
16.7.3.Egypt
16.7.3.1.Egypt Energy Drinks Market Revenue (US$ Mn) and Forecasts, By Nature
16.7.3.1.1.Natural
16.7.3.1.2.Organic
16.7.3.2.Egypt Energy Drinks Market Revenue (US$ Mn) and Forecasts, By Product Type
16.7.3.2.1.Alcoholic
16.7.3.2.2.Non Alcoholic
16.7.3.3.Egypt Energy Drinks Market Revenue (US$ Mn) and Forecasts, By Packaging
16.7.3.3.1.Cans
16.7.3.3.2.Bottles
16.7.3.3.3.Pouches
16.7.3.3.4.Others
16.7.3.4.Egypt Energy Drinks Market Revenue (US$ Mn) and Forecasts, By Flavour Type
16.7.3.4.1.Flavoured
16.7.3.4.2.Unflavoured
16.7.3.5.Egypt Energy Drinks Market Revenue (US$ Mn) and Forecasts, By Distribution Channel
16.7.3.5.1.Online
16.7.3.5.2.Offline
16.7.3.5.2.1.Supermarkets/Hypermarkets
16.7.3.5.2.2.Specialty Stores
16.7.3.5.2.3.Others
16.7.4.Kuwait
16.7.4.1.Kuwait Energy Drinks Market Revenue (US$ Mn) and Forecasts, By Nature
16.7.4.1.1.Natural
16.7.4.1.2.Organic
16.7.4.2.Kuwait Energy Drinks Market Revenue (US$ Mn) and Forecasts, By Product Type
16.7.4.2.1.Alcoholic
16.7.4.2.2.Non Alcoholic
16.7.4.3.Kuwait Energy Drinks Market Revenue (US$ Mn) and Forecasts, By Packaging
16.7.4.3.1.Cans
16.7.4.3.2.Bottles
16.7.4.3.3.Pouches
16.7.4.3.4.Others
16.7.4.4.Kuwait Energy Drinks Market Revenue (US$ Mn) and Forecasts, By Flavour Type
16.7.4.4.1.Flavoured
16.7.4.4.2.Unflavoured
16.7.4.5.Kuwait Energy Drinks Market Revenue (US$ Mn) and Forecasts, By Distribution Channel
16.7.4.5.1.Online
16.7.4.5.2.Offline
16.7.4.5.2.1.Supermarkets/Hypermarkets
16.7.4.5.2.2.Specialty Stores
16.7.4.5.2.3.Others
16.7.5.South Africa
16.7.5.1.South Africa Energy Drinks Market Revenue (US$ Mn) and Forecasts, By Nature
16.7.5.1.1.Natural
16.7.5.1.2.Organic
16.7.5.2.South Africa Energy Drinks Market Revenue (US$ Mn) and Forecasts, By Product Type
16.7.5.2.1.Alcoholic
16.7.5.2.2.Non Alcoholic
16.7.5.3.South Africa Energy Drinks Market Revenue (US$ Mn) and Forecasts, By Packaging
16.7.5.3.1.Cans
16.7.5.3.2.Bottles
16.7.5.3.3.Pouches
16.7.5.3.4.Others
16.7.5.4.South Africa Energy Drinks Market Revenue (US$ Mn) and Forecasts, By Flavour Type
16.7.5.4.1.Flavoured
16.7.5.4.2.Unflavoured
16.7.5.5.South Africa Energy Drinks Market Revenue (US$ Mn) and Forecasts, By Distribution Channel
16.7.5.5.1.Online
16.7.5.5.2.Offline
16.7.5.5.2.1.Supermarkets/Hypermarkets
16.7.5.5.2.2.Specialty Stores
16.7.5.5.2.3.Others
16.7.6.Rest of Middle East & Africa
16.7.6.1.Rest of Middle East & Africa Energy Drinks Market Revenue (US$ Mn) and Forecasts, By Nature
16.7.6.1.1.Natural
16.7.6.1.2.Organic
16.7.6.2.Rest of Middle East & Africa Energy Drinks Market Revenue (US$ Mn) and Forecasts, By Product Type
16.7.6.2.1.Alcoholic
16.7.6.2.2.Non Alcoholic
16.7.6.3.Rest of Middle East & Africa Energy Drinks Market Revenue (US$ Mn) and Forecasts, By Packaging
16.7.6.3.1.Cans
16.7.6.3.2.Bottles
16.7.6.3.3.Pouches
16.7.6.3.4.Others
16.7.6.4.Rest of Middle East & Africa Energy Drinks Market Revenue (US$ Mn) and Forecasts, By Flavour Type
16.7.6.4.1.Flavoured
16.7.6.4.2.Unflavoured
16.7.6.5.Rest of Middle East & Africa Energy Drinks Market Revenue (US$ Mn) and Forecasts, By Distribution Channel
16.7.6.5.1.Online
16.7.6.5.2.Offline
16.7.6.5.2.1.Supermarkets/Hypermarkets
16.7.6.5.2.2.Specialty Stores
16.7.6.5.2.3.Others
16.8.Key Segment for Channeling Investments
16.8.1.By Country
16.8.2.By Nature
16.8.3.By Product Type
16.8.4.By Packaging
16.8.5.By Flavour Type
16.8.6.By Distribution Channel
17.Latin America Energy Drinks Market Analysis and Forecasts, 2024 – 2034
17.1.Overview
17.1.1.Latin America Energy Drinks Market Revenue (US$ Mn)
17.2.Latin America Energy Drinks Market Revenue (US$ Mn) and Forecasts, By Nature
17.2.1.Natural
17.2.2.Organic
17.3.Latin America Energy Drinks Market Revenue (US$ Mn) and Forecasts, By Product Type
17.3.1.Alcoholic
17.3.2.Non Alcoholic
17.4.Latin America Energy Drinks Market Revenue (US$ Mn) and Forecasts, By Packaging
17.4.1.Cans
17.4.2.Bottles
17.4.3.Pouches
17.4.4.Others
17.5.Latin America Energy Drinks Market Revenue (US$ Mn) and Forecasts, By Flavour Type
17.5.1.Flavoured
17.5.2.Unflavoured
17.6.Latin America Energy Drinks Market Revenue (US$ Mn) and Forecasts, By Distribution Channel
17.6.1.Online
17.6.2.Offline
17.6.2.1.Supermarkets/Hypermarkets
17.6.2.2.Specialty Stores
17.6.2.3.Others
17.7.Latin America Energy Drinks Market Revenue (US$ Mn) and Forecasts, By Country
17.7.1.Brazil
17.7.1.1.Brazil Energy Drinks Market Revenue (US$ Mn) and Forecasts, By Nature
17.7.1.1.1.Natural
17.7.1.1.2.Organic
17.7.1.2.Brazil Energy Drinks Market Revenue (US$ Mn) and Forecasts, By Product Type
17.7.1.2.1.Alcoholic
17.7.1.2.2.Non Alcoholic
17.7.1.3.Brazil Energy Drinks Market Revenue (US$ Mn) and Forecasts, By Packaging
17.7.1.3.1.Cans
17.7.1.3.2.Bottles
17.7.1.3.3.Pouches
17.7.1.3.4.Others
17.7.1.4.Brazil Energy Drinks Market Revenue (US$ Mn) and Forecasts, By Flavour Type
17.7.1.4.1.Flavoured
17.7.1.4.2.Unflavoured
17.7.1.5.Brazil Energy Drinks Market Revenue (US$ Mn) and Forecasts, By Distribution Channel
17.7.1.5.1.Online
17.7.1.5.2.Offline
17.7.1.5.2.1.Supermarkets/Hypermarkets
17.7.1.5.2.2.Specialty Stores
17.7.1.5.2.3.Others
17.7.2.Argentina
17.7.2.1.Argentina Energy Drinks Market Revenue (US$ Mn) and Forecasts, By Nature
17.7.2.1.1.Natural
17.7.2.1.2.Organic
17.7.2.2.Argentina Energy Drinks Market Revenue (US$ Mn) and Forecasts, By Product Type
17.7.2.2.1.Alcoholic
17.7.2.2.2.Non Alcoholic
17.7.2.3.Argentina Energy Drinks Market Revenue (US$ Mn) and Forecasts, By Packaging
17.7.2.3.1.Cans
17.7.2.3.2.Bottles
17.7.2.3.3.Pouches
17.7.2.3.4.Others
17.7.2.4.Argentina Energy Drinks Market Revenue (US$ Mn) and Forecasts, By Flavour Type
17.7.2.4.1.Flavoured
17.7.2.4.2.Unflavoured
17.7.2.5.Argentina Energy Drinks Market Revenue (US$ Mn) and Forecasts, By Distribution Channel
17.7.2.5.1.Online
17.7.2.5.2.Offline
17.7.2.5.2.1.Supermarkets/Hypermarkets
17.7.2.5.2.2.Specialty Stores
17.7.2.5.2.3.Others
17.7.3.Rest of Latin America
17.7.3.1.Rest of Latin America Energy Drinks Market Revenue (US$ Mn) and Forecasts, By Nature
17.7.3.1.1.Natural
17.7.3.1.2.Organic
17.7.3.2.Rest of Latin America Energy Drinks Market Revenue (US$ Mn) and Forecasts, By Product Type
17.7.3.2.1.Alcoholic
17.7.3.2.2.Non Alcoholic
17.7.3.3.Rest of Latin America Energy Drinks Market Revenue (US$ Mn) and Forecasts, By Packaging
17.7.3.3.1.Cans
17.7.3.3.2.Bottles
17.7.3.3.3.Pouches
17.7.3.3.4.Others
17.7.3.4.Rest of Latin America Energy Drinks Market Revenue (US$ Mn) and Forecasts, By Flavour Type
17.7.3.4.1.Flavoured
17.7.3.4.2.Unflavoured
17.7.3.5.Rest of Latin America Energy Drinks Market Revenue (US$ Mn) and Forecasts, By Distribution Channel
17.7.3.5.1.Online
17.7.3.5.2.Offline
17.7.3.5.2.1.Supermarkets/Hypermarkets
17.7.3.5.2.2.Specialty Stores
17.7.3.5.2.3.Others
17.8.Key Segment for Channeling Investments
17.8.1.By Country
17.8.2.By Nature
17.8.3.By Product Type
17.8.4.By Packaging
17.8.5.By Flavour Type
17.8.6.By Distribution Channel
18.Competitive Benchmarking
18.1.Brand Benchmarking
18.2.Market Share Analysis, 2023
18.3.Global Presence and Growth Strategies
18.3.1.Mergers and Acquisitions
18.3.2.Product Launches
18.3.3.Investments Trends
18.3.4.R&D Initiatives
19.Player Profiles
19.1.Asia Brewery Incorporated
19.1.1.Company Details
19.1.2.Company Overview
19.1.3.Product Offerings
19.1.4.Key Developments
19.1.5.Financial Analysis
19.1.6.SWOT Analysis
19.1.7.Business Strategies
19.2.Carlsberg A/S
19.2.1.Company Details
19.2.2.Company Overview
19.2.3.Product Offerings
19.2.4.Key Developments
19.2.5.Financial Analysis
19.2.6.SWOT Analysis
19.2.7.Business Strategies
19.3.Coca-Cola Co.
19.3.1.Company Details
19.3.2.Company Overview
19.3.3.Product Offerings
19.3.4.Key Developments
19.3.5.Financial Analysis
19.3.6.SWOT Analysis
19.3.7.Business Strategies
19.4.Dali foods group
19.4.1.Company Details
19.4.2.Company Overview
19.4.3.Product Offerings
19.4.4.Key Developments
19.4.5.Financial Analysis
19.4.6.SWOT Analysis
19.4.7.Business Strategies
19.5.Kabisa B.V.
19.5.1.Company Details
19.5.2.Company Overview
19.5.3.Product Offerings
19.5.4.Key Developments
19.5.5.Financial Analysis
19.5.6.SWOT Analysis
19.5.7.Business Strategies
19.6.Kraft Foods Inc.
19.6.1.Company Details
19.6.2.Company Overview
19.6.3.Product Offerings
19.6.4.Key Developments
19.6.5.Financial Analysis
19.6.6.SWOT Analysis
19.6.7.Business Strategies
19.7.LT Group Inc.
19.7.1.Company Details
19.7.2.Company Overview
19.7.3.Product Offerings
19.7.4.Key Developments
19.7.5.Financial Analysis
19.7.6.SWOT Analysis
19.7.7.Business Strategies
19.8.Monster Beverage Corp.
19.8.1.Company Details
19.8.2.Company Overview
19.8.3.Product Offerings
19.8.4.Key Developments
19.8.5.Financial Analysis
19.8.6.SWOT Analysis
19.8.7.Business Strategies
19.9.NEALKO ORAVAN, spol s.r.o
19.9.1.Company Details
19.9.2.Company Overview
19.9.3.Product Offerings
19.9.4.Key Developments
19.9.5.Financial Analysis
19.9.6.SWOT Analysis
19.9.7.Business Strategies
19.10.Nestlé S.A.
19.10.1.Company Details
19.10.2.Company Overview
19.10.3.Product Offerings
19.10.4.Key Developments
19.10.5.Financial Analysis
19.10.6.SWOT Analysis
19.10.7.Business Strategies
19.11.Otsuka Pharmaceutical Co.
19.11.1.Company Details
19.11.2.Company Overview
19.11.3.Product Offerings
19.11.4.Key Developments
19.11.5.Financial Analysis
19.11.6.SWOT Analysis
19.11.7.Business Strategies
19.12.PepsiCo Inc.
19.12.1.Company Details
19.12.2.Company Overview
19.12.3.Product Offerings
19.12.4.Key Developments
19.12.5.Financial Analysis
19.12.6.SWOT Analysis
19.12.7.Business Strategies
19.13.Red Bull GmbH
19.13.1.Company Details
19.13.2.Company Overview
19.13.3.Product Offerings
19.13.4.Key Developments
19.13.5.Financial Analysis
19.13.6.SWOT Analysis
19.13.7.Business Strategies
19.14.Shenzhen Eastroc Beverage Co. Ltd.
19.14.1.Company Details
19.14.2.Company Overview
19.14.3.Product Offerings
19.14.4.Key Developments
19.14.5.Financial Analysis
19.14.6.SWOT Analysis
19.14.7.Business Strategies
19.15.Suntory Holdings Ltd.
19.15.1.Company Details
19.15.2.Company Overview
19.15.3.Product Offerings
19.15.4.Key Developments
19.15.5.Financial Analysis
19.15.6.SWOT Analysis
19.15.7.Business Strategies
19.16.The Gatorade Company, Inc.
19.16.1.Company Details
19.16.2.Company Overview
19.16.3.Product Offerings
19.16.4.Key Developments
19.16.5.Financial Analysis
19.16.6.SWOT Analysis
19.16.7.Business Strategies
19.17.Other Industry Participants
20.Key Findings

.

Note: This ToC is tentative and can be changed according to the research study conducted during the course of report completion.

.

**Exclusive for Multi-User and Enterprise User.

Global Energy Drinks Market

By Nature

  • Natural
  • Organic

By Product Type

  • Alcoholic
  • Non Alcoholic

By Packaging

  • Cans
  • Bottles
  • Pouches
  • Others

By Flavour Type

  • Flavoured
  • Unflavoured

By Distribution Channel

  • Online
  • Offline
    • Supermarkets/Hypermarkets
    • Specialty Stores
    • Others

By Region

  • North America (U.S., Canada, Mexico, Rest of North America)
  • Europe (France, The UK, Spain, Germany, Italy, Nordic Countries (Denmark, Finland, Iceland, Sweden, Norway), Benelux Union (Belgium, The Netherlands, Luxembourg), Rest of Europe)
  • Asia Pacific (China, Japan, India, New Zealand, Australia, South Korea, Southeast Asia (Indonesia, Thailand, Malaysia, Singapore, Rest of Southeast Asia), Rest of Asia Pacific)
  • Middle East & Africa (Saudi Arabia, UAE, Egypt, Kuwait, South Africa, Rest of Middle East & Africa)
  • Latin America (Brazil, Argentina, Rest of Latin America)

The Niche Research approach encompasses both primary and secondary research methods to provide comprehensive insights. While primary research is the cornerstone of our studies, we also incorporate secondary research sources such as company annual reports, premium industry databases, press releases, industry journals, and white papers.

Within our primary research, we actively engage with various industry stakeholders, conducting paid interviews and surveys. Our meticulous analysis extends to every market participant in major countries, allowing us to thoroughly examine their portfolios, calculate market shares, and segment revenues.

Our data collection primarily focuses on individual countries within our research scope, enabling us to estimate regional market sizes. Typically, we employ a bottom-up approach, meticulously tracking trends in different countries. We analyze growth drivers, constraints, technological innovations, and opportunities for each country, ultimately arriving at regional figures.Our process begins by examining the growth prospects of each country. Building upon these insights, we project growth and trends for the entire region. Finally, we utilize our proprietary model to refine estimations and forecasts.

Our data validation standards are integral to ensuring the reliability and accuracy of our research findings. Here’s a breakdown of our data validation processes and the stakeholders we engage with during our primary research:

  • Supply Side Analysis: We initiate a supply side analysis by directly contacting market participants, through telephonic interviews and questionnaires containing both open-ended and close-ended questions. We gather information on their portfolios, segment revenues, developments, and growth strategies.
  • Demand Side Analysis: To gain insights into adoption trends and consumer preferences, we reach out to target customers and users (non-vendors). This information forms a vital part of the qualitative analysis section of our reports, covering market dynamics, adoption trends, consumer behavior, spending patterns, and other related aspects.
  • Consultant Insights: We tap into the expertise of our partner consultants from around the world to obtain their unique viewpoints and perspectives. Their insights contribute to a well-rounded understanding of the markets under investigation.
  • In-House Validation: To ensure data accuracy and reliability, we conduct cross-validation of data points and information through our in-house team of consultants and utilize advanced data modeling tools for thorough verification.

The forecasts we provide are based on a comprehensive assessment of various factors, including:

  • Market Trends and Past Performance (Last Five Years): We accurately analyze market trends and performance data from preceding five years to identify historical patterns and understand the market’s evolution.
  • Historical Performance and Growth of Market Participants: We assess the historical performance and growth trajectories of key market participants. This analysis provides insights into the competitive landscape and individual company strategies.
  • Market Determinants Impact Analysis (Next Eight Years): We conduct a rigorous analysis of the factors that are projected to influence the market over the next eight years. This includes assessing both internal and external determinants that can shape market dynamics.
  • Drivers and Challenges for the Forecast Period:Identify the factors expected to drive market growth during the forecast period, as well as the challenges that the industry may face. This analysis aids in deriving an accurate growth rate projection.
  • New Acquisitions, Collaborations, or Partnerships: We keep a close watch on any new acquisitions, collaborations, or partnerships within the industry. These developments can have a significant impact on market dynamics and competitiveness.
  • Macro and Micro Factors Analysis:A thorough examination of both macro-level factors (e.g., economic trends, regulatory changes) and micro-level factors (e.g., technological advancements, consumer preferences) that may influence the market during the forecast period.
  • End-User Sentiment Analysis: To understand the market from the end-user perspective, we conduct sentiment analysis. This involves assessing the sentiment, preferences, and feedback of the end-users, which can provide valuable insights into market trends.
  • Perspective of Primary Participants: Insights gathered directly from primary research participants play a crucial role in shaping our forecasts. Their perspectives and experiences provide valuable qualitative data.
  • Year-on-Year Growth Trend: We utilize a year-on-year growth trend based on historical market growth and expected future trends. This helps in formulating our growth projections, aligning them with the market’s historical performance.

Research process adopted by TNR involves multiple stages, including data collection, validation, quality checks, and presentation. It’s crucial that the data and information we provide add value to your existing market understanding and expertise. We have also established partnerships with business consulting, research, and survey organizations across regions and globally to collaborate on regional analysis and data validation, ensuring the highest level of accuracy and reliability in our reports.


Procure Comprehensive Study of

Global Energy Drinks Market

Online Only

  • Online Access
  • Read Only File
  • Validity 3 Months
  • Print, Copy, Paste & Download
  • PPT, Excel
  • Cost-Free Report in the Next Update
$3300
Buy Now

Single User

  • Access to One User on One System
  • Read Only File
  • Validity 6 Months
  • Limited Print,Copy, Paste
  • PPT, Excel
  • Cost-Free Report in the Next Update
$4200
Buy Now

Multi User

  • Access to Fiver Users
  • PDF File
  • Validity 1 Year
  • Upto FivePrints
  • Cost-Free Report in the Next Update
  • PPT, Excel
$6000
Buy Now

Enterprise User

  • Access to Unlimited Users
  • PDF, PPT, Excel
  • Unlimited Validity, Prints&Downloads
  • 1 Hour Cost-Free & Dedicated Analyst Support
  • 10% Cost-Free Customization
  • Cost-Free Report Update Twice in a Year
  • Recommendations for Business Strategies
  • Authorization to Quote TNR, The Niche Research
$7300
Buy Now

Library Access

  • Online Access to Content Publications
  • Access Player Profiles Online
  • Get Immediate Access to Newly Added Content
  • Acquire 12 PDF Downloads
  • Acquire 5 Excel Data Sets
  • Gain Access to 290+ PDFs of Company Profiles
  • Round-the-clock Email and Phone Assistance
  • Dashboard Usage and Trends
  • Renewal & Upgrade Assistance
  • Assessing Customization Options and Alerts for New Reports
$10788
Buy Now
*Taxes/Fees, if applicable will be added during checkout. All prices in USD

Why TNR The Niche Research?

  • Unwavering Commitment to Excellence

  • Veteran Team of Researchers

  • Accurate and Timely Insights

  • Ethical Practices and Customized Service

  • Uninterrupted Availability Around the Clock

Scroll to Top