Global Fiber Optics Market: By Type, By Material, By End User Industry: Global & Regional Insights, Trends & Forecasts, 2015 – 2031

  • Industry: Semiconductors & Electronics
  • Report ID: TNR-110-960
  • Number of Pages: 420
  • Table/Charts : Yes
  • November, 2023
  • Base Year : 2024
  • No. of Companies : 11+
  • No. of Countries : 29
  • Views : 10146
  • Covid Impact Covered: Yes
  • War Impact Covered: Yes
  • Formats : PDF, Excel, PPT

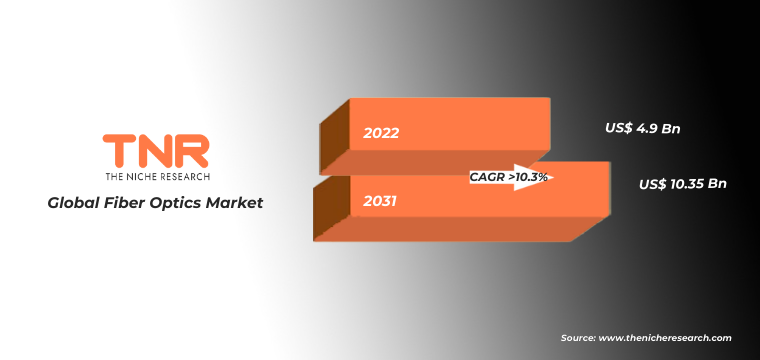
Global Fiber Optics Market is Projected to Reach USD 10.35 Bn by 2031 with Estimated of CAGR 10.3% by 2031.

Fiber optic, as the name implies, are cables that carry data using light rather than electricity. They’re constructed of silica glass fibers approximately the diameter of a human hair, allowing light to bounce back and forth down the cable. A fiber optic cable’s glass core is wrapped by a thin layer of glass cladding to prevent light from seeping out and ensuring it is reflected along the length of the cable. This is further insulated by a main plastic covering, which provides physical protection for the cable’s internal glass structure and prevents excessive bending.

Global Fiber Optics Market Revenue & Forecast, (US$ Million), 2015 – 2031

Global Fiber Optics Market Growth Factors

  • Fiber Optic Transmission Speed Advances: Ongoing research has resulted in remarkable advances in fiber optic transmission speeds. Fiber optic networks today attain astounding data speeds, outperforming conventional systems, thanks to breakthroughs such as wavelength division multiplexing (WDM) and coherent detection methods.
  • High-Density Fiber Optic Cables and Connectors: High-density fiber optic cables and connectors have evolved to fulfil the rising need for better bandwidth and scalability. These systems enable effective space utilization and easy network infrastructure growth.
  • Improved Durability and Reliability: Fiber optic systems have grown more resilient and dependable as materials and manufacturing techniques have advanced. Increased resilience to external variables, lower signal deterioration, and increased fault tolerance have enhanced the performance and lifetime of fiber optic networks.

Report Coverage and Deliveries

Common

Single mode fiber is becoming more prevalent for a wide range of applications due to its higher bandwidth, longer transmission distances, and compatibility with advanced technologies like wavelength division multiplexing (WDM). Besides Single-mode fiber is extensively used in telecommunications networks to provide high-speed internet, voice communication, and other data services over long distances. On the other hand, multi-mode fiber is still widely used for shorter-distance connections, such as within data centers and corporate LANs.

In most telecommunications and high-speed data transmission applications, glass fibers are the preferred choice due to their superior optical properties, lower signal loss, and higher bandwidth. However, plastic fibers find applications in areas where cost-effectiveness and short-distance communication are more important, such as in some consumer electronics and automotive systems. Conversely other specialty materials and coatings are being used for specific applications, such as specialty fibers for sensing, medical applications, and high-power laser transmission.

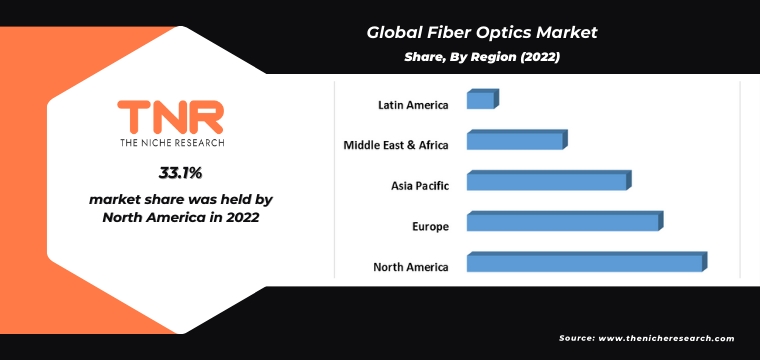
North America had the highest share in the fiber optics market in 2022. United States and Canada has witnessed a surge in data center construction and expansion which has led to the rise in demand for fiber optics. Fiber optics are vital for connecting data centers and facilitating efficient data transfer among servers and storage systems. Besides Many cities in North America are investing in smart city projects, which require robust communication networks to connect various Iota devices, sensors, and systems wherein fiber optics will take a lead role.

Competitive Landscape

The global fiber optics market is characterized by the presence of several prominent players striving to maintain their competitive edge in the industry. These players engage in various strategies, including product innovations, partnerships, acquisitions, and geographic expansions, to strengthen their market positions and cater to the evolving demands of customers. In addition to the aforementioned key players, the global fiber optics market includes several other emerging participants contributing diverse expertise and solutions to the market. The report will include both quantitative and qualitative analysis on the global fiber optics market, as well as extensive insights and development strategies used by the top competitors. Key players operational across the global fiber optics market are listed below:

  • AFL
  • Belden Inc.
  • CommScope
  • Corning Incorporated
  • FiberHome
  • Fujikura Ltd.
  • Hexatronic Group
  • LS Cable & System Ltd.
  • NEXANS
  • Prysmian Spa
  • Sterlite Technologies Limited
  • Sumitomo Electric Lightwave, Inc.
  • TE Connectivity
  • Tongding Interconnection Information Co., Ltd.
  • Yangtze Optical Fibre
  • Other market participants

Global Fiber Optics Market Report Coverage

Report Specifications Details
Market Revenue in 2022 US$ 4.9 Billion
Market Size Forecast by 2031 US$ 10.35 Billion
Growth Rate (CAGR) 10.3%
Historic Data 2015 – 2021
Base Year for Estimation 2022
Forecast Period 2023 – 2031
Report Inclusions Market Size & Estimates, Market Dynamics, Competitive Scenario, Trends, Growth Factors, Market Determinants, Key Investment Segmentation, Product/Service/Solutions Benchmarking
Segments Covered By  Type, By Material, By End User Industry
Regions Covered North America, Europe, Asia Pacific, Middle East & Africa, Latin America
Countries Covered U.S., Canada, Mexico, Rest of North America,  France, The UK, Spain, Germany, Italy, Nordic Countries (Denmark, Finland, Iceland, Sweden, Norway), Benelux Union (Belgium, The Netherlands, Luxembourg), Rest of Europe,  China, Japan, India, New Zealand, Australia, South Korea, Southeast Asia (Indonesia, Thailand, Malaysia, Singapore, Rest of Southeast Asia), Rest of Asia Pacific,  Saudi Arabia, UAE, Egypt, Kuwait, South Africa, Rest of Middle East & Africa,  Brazil, Argentina, Rest of Latin America
Key Players AFL, Belden Inc., CommScope, Corning Incorporated, FiberHome, Fujikura Ltd., Hexatronic Group, LS Cable & System Ltd., NEXANS, Prysmian Spa, Sterlite Technologies Limited, Sumitomo Electric Lightwave, Inc., TE Connectivity, Tongding Interconnection Information Co., Ltd., Yangtze Optical Fibre, Other Industry Participants
Customization Scope Customization allows for the inclusion/modification of content pertaining to geographical regions, countries, and specific market segments.
Pricing & Procurement Options Explore purchase options tailored to your specific research requirements
Contact Details Consult With Our Expert

Japan (Toll-Free): – +81 663-386-8111

South Korea (Toll-Free): – +82-808- 703-126

Saudi Arabia (Toll-Free): – +966 800 850 1643

United States: +1 302-232-5106

United Kingdom: +447537105080

E-mail:  askanexpert@thenicheresearch.com


Key Segments Profiled in the Fiber Optics Market

By Type

  • Single Mode
  • Multi mode
    • Multimode graded index
    • Multimode step index

By Material

  • Glass
  • Plastic

By End User Industry

  • IT and Telecommunications
  • Energy and Utilities
  • Defense and Military
  • Electronics
  • Construction
  • Healthcare
  • Manufacturing
  • Aerospace
  • Automotive
  • Others

By Region

  • North America (U.S., Canada, Mexico, Rest of North America)
  • Europe (France, The UK, Spain, Germany, Italy, Nordic Countries (Denmark, Finland, Iceland, Sweden, Norway), Benelux Union (Belgium, The Netherlands, Luxembourg), Rest of Europe)
  • Asia Pacific (China, Japan, India, New Zealand, Australia, South Korea, Southeast Asia (Indonesia, Thailand, Malaysia, Singapore, Rest of Southeast Asia), Rest of Asia Pacific)
  • Middle East & Africa (Saudi Arabia, UAE, Egypt, Kuwait, South Africa, Rest of Middle East & Africa)
  • Latin America (Brazil, Argentina, Rest of Latin America)

Table of Contents

.

1.Market Scope
1.1.Market Segmentation
1.2.Years Considered
1.2.1.Historic Years: 2015 – 2021
1.2.2.Base Year: 2022
1.2.3.Forecast Years: 2023 – 2031
2.Key Target Audiences
3.Research Methodology
3.1.Primary Research
3.1.1.Research Questionnaire
3.1.2.Global Percentage Breakdown
3.1.3.Primary Interviews: Key Opinion Leaders (KOLs)
3.2.Secondary Research
3.2.1.Paid Databases
3.2.2.Secondary Sources
3.3.Market Size Estimates
3.3.1.Top-Down Approach
3.3.2.Bottom-Up Approach
3.4.Data Triangulation Methodology
3.5.Research Assumptions
4.Recommendations and Insights from TNR’s Perspective**
5.Holistic Overview of Fiber Optics Market
6.Market Synopsis: Fiber Optics Market
7.Fiber Optics Market Analysis: Qualitative Perspective
7.1.Introduction
7.1.1.Product Definition
7.1.2.Industry Development
7.2.Market Dynamics
7.2.1.Drivers
7.2.2.Restraints
7.2.3.Opportunities
7.3.Trends in Fiber Optics Market
7.4.Market Determinants Radar Chart
7.5.Macro-Economic and Micro-Economic Indicators: Fiber Optics Market
7.6.Porter’s Five Force Analysis
7.7.Impact of Covid-19 on Fiber Optics Market
8.Global Fiber Optics Market Analysis and Forecasts, 2023 – 2031
8.1.Overview
8.1.1.Global Fiber Optics Market Revenue (US$ Mn)
8.2.Global Fiber Optics Market Revenue (US$ Mn) and Forecasts, By Type
8.2.1. Single Mode
8.2.1.1.Definition
8.2.1.2.Market Estimation and Penetration, 2015 – 2022
8.2.1.3.Market Forecast, 2023 – 2031
8.2.1.4.Compound Annual Growth Rate (CAGR)
8.2.1.5.Regional Bifurcation
8.2.1.5.1.North America
8.2.1.5.1.1.Market Estimation, 2015 – 2022
8.2.1.5.1.2.Market Forecast, 2023 – 2031
8.2.1.5.2.Europe
8.2.1.5.2.1.Market Estimation, 2015 – 2022
8.2.1.5.2.2.Market Forecast, 2023 – 2031
8.2.1.5.3.Asia Pacific
8.2.1.5.3.1.Market Estimation, 2015 – 2022
8.2.1.5.3.2.Market Forecast, 2023 – 2031
8.2.1.5.4.Middle East and Africa
8.2.1.5.4.1.Market Estimation, 2015 – 2022
8.2.1.5.4.2.Market Forecast, 2023 – 2031
8.2.1.5.5.Latin America
8.2.1.5.5.1.Market Estimation, 2015 – 2022
8.2.1.5.5.2.Market Forecast, 2023 – 2031
8.2.2.Multi mode (Definition, Market Estimation and Penetration, 2015 – 2022, Market Estimation (2015 – 2022), Market Forecast (2023 – 2031), Compound Annual Growth Rate (CAGR), Regional Bifurcation (North America, Europe, Asia Pacific, Middle East and Africa, Latin America) and Information on Multimode graded index, Multimode step index)
8.2.2.1.Multimode graded index
8.2.2.2.Multimode step index
8.3.Key Segment for Channeling Investments
8.3.1.By Type
9.Global Fiber Optics Market Analysis and Forecasts, 2023 – 2031
9.1.Overview
9.2.Global Fiber Optics Market Revenue (US$ Mn) and Forecasts, By Material
9.2.1.Glass
9.2.1.1.Definition
9.2.1.2.Market Estimation and Penetration, 2015 – 2022
9.2.1.3.Market Forecast, 2023 – 2031
9.2.1.4.Compound Annual Growth Rate (CAGR)
9.2.1.5.Regional Bifurcation
9.2.1.5.1.North America
9.2.1.5.1.1.Market Estimation, 2015 – 2022
9.2.1.5.1.2.Market Forecast, 2023 – 2031
9.2.1.5.2.Europe
9.2.1.5.2.1.Market Estimation, 2015 – 2022
9.2.1.5.2.2.Market Forecast, 2023 – 2031
9.2.1.5.3.Asia Pacific
9.2.1.5.3.1.Market Estimation, 2015 – 2022
9.2.1.5.3.2.Market Forecast, 2023 – 2031
9.2.1.5.4.Middle East and Africa
9.2.1.5.4.1.Market Estimation, 2015 – 2022
9.2.1.5.4.2.Market Forecast, 2023 – 2031
9.2.1.5.5.Latin America
9.2.1.5.5.1.Market Estimation, 2015 – 2022
9.2.1.5.5.2.Market Forecast, 2023 – 2031
9.2.2.Plastic
9.2.2.1.Definition
9.2.2.2.Market Estimation and Penetration, 2015 – 2022
9.2.2.3.Market Forecast, 2023 – 2031
9.2.2.4.Compound Annual Growth Rate (CAGR)
9.2.2.5.Regional Bifurcation
9.2.2.5.1.North America
9.2.2.5.1.1.Market Estimation, 2015 – 2022
9.2.2.5.1.2.Market Forecast, 2023 – 2031
9.2.2.5.2.Europe
9.2.2.5.2.1.Market Estimation, 2015 – 2022
9.2.2.5.2.2.Market Forecast, 2023 – 2031
9.2.2.5.3.Asia Pacific
9.2.2.5.3.1.Market Estimation, 2015 – 2022
9.2.2.5.3.2.Market Forecast, 2023 – 2031
9.2.2.5.4.Middle East and Africa
9.2.2.5.4.1.Market Estimation, 2015 – 2022
9.2.2.5.4.2.Market Forecast, 2023 – 2031
9.2.2.5.5.Latin America
9.2.2.5.5.1.Market Estimation, 2015 – 2022
9.2.2.5.5.2.Market Forecast, 2023 – 2031
9.3.Key Segment for Channeling Investments
9.3.1.By Material
10.Global Fiber Optics Market Analysis and Forecasts, 2023 – 2031
10.1.Overview
10.2.Global Fiber Optics Market Revenue (US$ Mn) and Forecasts, By End User Industry
10.2.1.IT and Telecommunications
10.2.1.1.Definition
10.2.1.2.Market Estimation and Penetration, 2015 – 2022
10.2.1.3.Market Forecast, 2023 – 2031
10.2.1.4.Compound Annual Growth Rate (CAGR)
10.2.1.5.Regional Bifurcation
10.2.1.5.1.North America
10.2.1.5.1.1.Market Estimation, 2015 – 2022
10.2.1.5.1.2.Market Forecast, 2023 – 2031
10.2.1.5.2.Europe
10.2.1.5.2.1.Market Estimation, 2015 – 2022
10.2.1.5.2.2.Market Forecast, 2023 – 2031
10.2.1.5.3.Asia Pacific
10.2.1.5.3.1.Market Estimation, 2015 – 2022
10.2.1.5.3.2.Market Forecast, 2023 – 2031
10.2.1.5.4.Middle East and Africa
10.2.1.5.4.1.Market Estimation, 2015 – 2022
10.2.1.5.4.2.Market Forecast, 2023 – 2031
10.2.1.5.5.Latin America
10.2.1.5.5.1.Market Estimation, 2015 – 2022
10.2.1.5.5.2.Market Forecast, 2023 – 2031
10.2.2.Energy and Utilities
10.2.2.1.Definition
10.2.2.2.Market Estimation and Penetration, 2015 – 2022
10.2.2.3.Market Forecast, 2023 – 2031
10.2.2.4.Compound Annual Growth Rate (CAGR)
10.2.2.5.Regional Bifurcation
10.2.2.5.1.North America
10.2.2.5.1.1.Market Estimation, 2015 – 2022
10.2.2.5.1.2.Market Forecast, 2023 – 2031
10.2.2.5.2.Europe
10.2.2.5.2.1.Market Estimation, 2015 – 2022
10.2.2.5.2.2.Market Forecast, 2023 – 2031
10.2.2.5.3.Asia Pacific
10.2.2.5.3.1.Market Estimation, 2015 – 2022
10.2.2.5.3.2.Market Forecast, 2023 – 2031
10.2.2.5.4.Middle East and Africa
10.2.2.5.4.1.Market Estimation, 2015 – 2022
10.2.2.5.4.2.Market Forecast, 2023 – 2031
10.2.2.5.5.Latin America
10.2.2.5.5.1.Market Estimation, 2015 – 2022
10.2.2.5.5.2.Market Forecast, 2023 – 2031
10.2.3.Defense and Military
10.2.3.1.Definition
10.2.3.2.Market Estimation and Penetration, 2015 – 2022
10.2.3.3.Market Forecast, 2023 – 2031
10.2.3.4.Compound Annual Growth Rate (CAGR)
10.2.3.5.Regional Bifurcation
10.2.3.5.1.North America
10.2.3.5.1.1.Market Estimation, 2015 – 2022
10.2.3.5.1.2.Market Forecast, 2023 – 2031
10.2.3.5.2.Europe
10.2.3.5.2.1.Market Estimation, 2015 – 2022
10.2.3.5.2.2.Market Forecast, 2023 – 2031
10.2.3.5.3.Asia Pacific
10.2.3.5.3.1.Market Estimation, 2015 – 2022
10.2.3.5.3.2.Market Forecast, 2023 – 2031
10.2.3.5.4.Middle East and Africa
10.2.3.5.4.1.Market Estimation, 2015 – 2022
10.2.3.5.4.2.Market Forecast, 2023 – 2031
10.2.3.5.5.Latin America
10.2.3.5.5.1.Market Estimation, 2015 – 2022
10.2.3.5.5.2.Market Forecast, 2023 – 2031
10.2.4.Electronics
10.2.4.1.Definition
10.2.4.2.Market Estimation and Penetration, 2015 – 2022
10.2.4.3.Market Forecast, 2023 – 2031
10.2.4.4.Compound Annual Growth Rate (CAGR)
10.2.4.5.Regional Bifurcation
10.2.4.5.1.North America
10.2.4.5.1.1.Market Estimation, 2015 – 2022
10.2.4.5.1.2.Market Forecast, 2023 – 2031
10.2.4.5.2.Europe
10.2.4.5.2.1.Market Estimation, 2015 – 2022
10.2.4.5.2.2.Market Forecast, 2023 – 2031
10.2.4.5.3.Asia Pacific
10.2.4.5.3.1.Market Estimation, 2015 – 2022
10.2.4.5.3.2.Market Forecast, 2023 – 2031
10.2.4.5.4.Middle East and Africa
10.2.4.5.4.1.Market Estimation, 2015 – 2022
10.2.4.5.4.2.Market Forecast, 2023 – 2031
10.2.4.5.5.Latin America
10.2.4.5.5.1.Market Estimation, 2015 – 2022
10.2.4.5.5.2.Market Forecast, 2023 – 2031
10.2.5.Construction
10.2.5.1.Definition
10.2.5.2.Market Estimation and Penetration, 2015 – 2022
10.2.5.3.Market Forecast, 2023 – 2031
10.2.5.4.Compound Annual Growth Rate (CAGR)
10.2.5.5.Regional Bifurcation
10.2.5.5.1.North America
10.2.5.5.1.1.Market Estimation, 2015 – 2022
10.2.5.5.1.2.Market Forecast, 2023 – 2031
10.2.5.5.2.Europe
10.2.5.5.2.1.Market Estimation, 2015 – 2022
10.2.5.5.2.2.Market Forecast, 2023 – 2031
10.2.5.5.3.Asia Pacific
10.2.5.5.3.1.Market Estimation, 2015 – 2022
10.2.5.5.3.2.Market Forecast, 2023 – 2031
10.2.5.5.4.Middle East and Africa
10.2.5.5.4.1.Market Estimation, 2015 – 2022
10.2.5.5.4.2.Market Forecast, 2023 – 2031
10.2.5.5.5.Latin America
10.2.5.5.5.1.Market Estimation, 2015 – 2022
10.2.5.5.5.2.Market Forecast, 2023 – 2031
10.2.6.Healthcare
10.2.6.1.Definition
10.2.6.2.Market Estimation and Penetration, 2015 – 2022
10.2.6.3.Market Forecast, 2023 – 2031
10.2.6.4.Compound Annual Growth Rate (CAGR)
10.2.6.5.Regional Bifurcation
10.2.6.5.1.North America
10.2.6.5.1.1.Market Estimation, 2015 – 2022
10.2.6.5.1.2.Market Forecast, 2023 – 2031
10.2.6.5.2.Europe
10.2.6.5.2.1.Market Estimation, 2015 – 2022
10.2.6.5.2.2.Market Forecast, 2023 – 2031
10.2.6.5.3.Asia Pacific
10.2.6.5.3.1.Market Estimation, 2015 – 2022
10.2.6.5.3.2.Market Forecast, 2023 – 2031
10.2.6.5.4.Middle East and Africa
10.2.6.5.4.1.Market Estimation, 2015 – 2022
10.2.6.5.4.2.Market Forecast, 2023 – 2031
10.2.6.5.5.Latin America
10.2.6.5.5.1.Market Estimation, 2015 – 2022
10.2.6.5.5.2.Market Forecast, 2023 – 2031
10.2.7.Manufacturing
10.2.7.1.Definition
10.2.7.2.Market Estimation and Penetration, 2015 – 2022
10.2.7.3.Market Forecast, 2023 – 2031
10.2.7.4.Compound Annual Growth Rate (CAGR)
10.2.7.5.Regional Bifurcation
10.2.7.5.1.North America
10.2.7.5.1.1.Market Estimation, 2015 – 2022
10.2.7.5.1.2.Market Forecast, 2023 – 2031
10.2.7.5.2.Europe
10.2.7.5.2.1.Market Estimation, 2015 – 2022
10.2.7.5.2.2.Market Forecast, 2023 – 2031
10.2.7.5.3.Asia Pacific
10.2.7.5.3.1.Market Estimation, 2015 – 2022
10.2.7.5.3.2.Market Forecast, 2023 – 2031
10.2.7.5.4.Middle East and Africa
10.2.7.5.4.1.Market Estimation, 2015 – 2022
10.2.7.5.4.2.Market Forecast, 2023 – 2031
10.2.7.5.5.Latin America
10.2.7.5.5.1.Market Estimation, 2015 – 2022
10.2.7.5.5.2.Market Forecast, 2023 – 2031
10.2.8.Aerospace
10.2.8.1.Definition
10.2.8.2.Market Estimation and Penetration, 2015 – 2022
10.2.8.3.Market Forecast, 2023 – 2031
10.2.8.4.Compound Annual Growth Rate (CAGR)
10.2.8.5.Regional Bifurcation
10.2.8.5.1.North America
10.2.8.5.1.1.Market Estimation, 2015 – 2022
10.2.8.5.1.2.Market Forecast, 2023 – 2031
10.2.8.5.2.Europe
10.2.8.5.2.1.Market Estimation, 2015 – 2022
10.2.8.5.2.2.Market Forecast, 2023 – 2031
10.2.8.5.3.Asia Pacific
10.2.8.5.3.1.Market Estimation, 2015 – 2022
10.2.8.5.3.2.Market Forecast, 2023 – 2031
10.2.8.5.4.Middle East and Africa
10.2.8.5.4.1.Market Estimation, 2015 – 2022
10.2.8.5.4.2.Market Forecast, 2023 – 2031
10.2.8.5.5.Latin America
10.2.8.5.5.1.Market Estimation, 2015 – 2022
10.2.8.5.5.2.Market Forecast, 2023 – 2031
10.2.9.Automotive
10.2.9.1.Definition
10.2.9.2.Market Estimation and Penetration, 2015 – 2022
10.2.9.3.Market Forecast, 2023 – 2031
10.2.9.4.Compound Annual Growth Rate (CAGR)
10.2.9.5.Regional Bifurcation
10.2.9.5.1.North America
10.2.9.5.1.1.Market Estimation, 2015 – 2022
10.2.9.5.1.2.Market Forecast, 2023 – 2031
10.2.9.5.2.Europe
10.2.9.5.2.1.Market Estimation, 2015 – 2022
10.2.9.5.2.2.Market Forecast, 2023 – 2031
10.2.9.5.3.Asia Pacific
10.2.9.5.3.1.Market Estimation, 2015 – 2022
10.2.9.5.3.2.Market Forecast, 2023 – 2031
10.2.9.5.4.Middle East and Africa
10.2.9.5.4.1.Market Estimation, 2015 – 2022
10.2.9.5.4.2.Market Forecast, 2023 – 2031
10.2.9.5.5.Latin America
10.2.9.5.5.1.Market Estimation, 2015 – 2022
10.2.9.5.5.2.Market Forecast, 2023 – 2031
10.2.10.Others
10.2.10.1.Definition
10.2.10.2.Market Estimation and Penetration, 2015 – 2022
10.2.10.3.Market Forecast, 2023 – 2031
10.2.10.4.Compound Annual Growth Rate (CAGR)
10.2.10.5.Regional Bifurcation
10.2.10.5.1.North America
10.2.10.5.1.1.Market Estimation, 2015 – 2022
10.2.10.5.1.2.Market Forecast, 2023 – 2031
10.2.10.5.2.Europe
10.2.10.5.2.1.Market Estimation, 2015 – 2022
10.2.10.5.2.2.Market Forecast, 2023 – 2031
10.2.10.5.3.Asia Pacific
10.2.10.5.3.1.Market Estimation, 2015 – 2022
10.2.10.5.3.2.Market Forecast, 2023 – 2031
10.2.10.5.4.Middle East and Africa
10.2.10.5.4.1.Market Estimation, 2015 – 2022
10.2.10.5.4.2.Market Forecast, 2023 – 2031
10.2.10.5.5.Latin America
10.2.10.5.5.1.Market Estimation, 2015 – 2022
10.2.10.5.5.2.Market Forecast, 2023 – 2031
10.3.Key Segment for Channeling Investments
10.3.1.By End User Industry
11.North America Fiber Optics Market Analysis and Forecasts, 2023 – 2031
11.1.Overview
11.1.1.North America Fiber Optics Market Revenue (US$ Mn)
11.2.North America Fiber Optics Market Revenue (US$ Mn) and Forecasts, By Type
11.2.1. Single Mode
11.2.2.Multi mode
11.2.2.1.Multimode graded index
11.2.2.2.Multimode step index
11.3.North America Fiber Optics Market Revenue (US$ Mn) and Forecasts, By Material
11.3.1.Glass
11.3.2.Plastic
11.4.North America Fiber Optics Market Revenue (US$ Mn) and Forecasts, By End User Industry
11.4.1.IT and Telecommunications
11.4.2.Energy and Utilities
11.4.3.Defense and Military
11.4.4.Electronics
11.4.5.Construction
11.4.6.Healthcare
11.4.7.Manufacturing
11.4.8.Aerospace
11.4.9.Automotive
11.4.10.Others
11.5.North America Fiber Optics Market Revenue (US$ Mn) and Forecasts, By Country
11.5.1.U.S
11.5.1.1.U.S Fiber Optics Market Revenue (US$ Mn) and Forecasts, By Type
11.5.1.1.1. Single Mode
11.5.1.1.2.Multi mode
11.5.1.1.2.1.Multimode graded index
11.5.1.1.2.2.Multimode step index
11.5.1.2.U.S Fiber Optics Market Revenue (US$ Mn) and Forecasts, By Material
11.5.1.2.1.Glass
11.5.1.2.2.Plastic
11.5.1.3.U.S Fiber Optics Market Revenue (US$ Mn) and Forecasts, By End User Industry
11.5.1.3.1.IT and Telecommunications
11.5.1.3.2.Energy and Utilities
11.5.1.3.3.Defense and Military
11.5.1.3.4.Electronics
11.5.1.3.5.Construction
11.5.1.3.6.Healthcare
11.5.1.3.7.Manufacturing
11.5.1.3.8.Aerospace
11.5.1.3.9.Automotive
11.5.1.3.10.Others
11.5.2.Canada
11.5.2.1.Canada Fiber Optics Market Revenue (US$ Mn) and Forecasts, By Type
11.5.2.1.1. Single Mode
11.5.2.1.2.Multi mode
11.5.2.1.2.1.Multimode graded index
11.5.2.1.2.2.Multimode step index
11.5.2.2.Canada Fiber Optics Market Revenue (US$ Mn) and Forecasts, By Material
11.5.2.2.1.Glass
11.5.2.2.2.Plastic
11.5.2.3.Canada Fiber Optics Market Revenue (US$ Mn) and Forecasts, By End User Industry
11.5.2.3.1.IT and Telecommunications
11.5.2.3.2.Energy and Utilities
11.5.2.3.3.Defense and Military
11.5.2.3.4.Electronics
11.5.2.3.5.Construction
11.5.2.3.6.Healthcare
11.5.2.3.7.Manufacturing
11.5.2.3.8.Aerospace
11.5.2.3.9.Automotive
11.5.2.3.10.Others
11.5.3.Mexico
11.5.3.1.Mexico Fiber Optics Market Revenue (US$ Mn) and Forecasts, By Type
11.5.3.1.1. Single Mode
11.5.3.1.2.Multi mode
11.5.3.1.2.1.Multimode graded index
11.5.3.1.2.2.Multimode step index
11.5.3.2.Mexico Fiber Optics Market Revenue (US$ Mn) and Forecasts, By Material
11.5.3.2.1.Glass
11.5.3.2.2.Plastic
11.5.3.3.Mexico Fiber Optics Market Revenue (US$ Mn) and Forecasts, By End User Industry
11.5.3.3.1.IT and Telecommunications
11.5.3.3.2.Energy and Utilities
11.5.3.3.3.Defense and Military
11.5.3.3.4.Electronics
11.5.3.3.5.Construction
11.5.3.3.6.Healthcare
11.5.3.3.7.Manufacturing
11.5.3.3.8.Aerospace
11.5.3.3.9.Automotive
11.5.3.3.10.Others
11.5.4.Rest of North America
11.5.4.1.Rest of North America Fiber Optics Market Revenue (US$ Mn) and Forecasts, By Type
11.5.4.1.1. Single Mode
11.5.4.1.2.Multi mode
11.5.4.1.2.1.Multimode graded index
11.5.4.1.2.2.Multimode step index
11.5.4.2.Rest of North America Fiber Optics Market Revenue (US$ Mn) and Forecasts, By Material
11.5.4.2.1.Glass
11.5.4.2.2.Plastic
11.5.4.3.Rest of North America Fiber Optics Market Revenue (US$ Mn) and Forecasts, By End User Industry
11.5.4.3.1.IT and Telecommunications
11.5.4.3.2.Energy and Utilities
11.5.4.3.3.Defense and Military
11.5.4.3.4.Electronics
11.5.4.3.5.Construction
11.5.4.3.6.Healthcare
11.5.4.3.7.Manufacturing
11.5.4.3.8.Aerospace
11.5.4.3.9.Automotive
11.5.4.3.10.Others
11.6.Key Segment for Channeling Investments
11.6.1.By Country
11.6.2.By Type
11.6.3.By Material
11.6.4.By End User Industry
12.Europe Fiber Optics Market Analysis and Forecasts, 2023 – 2031
12.1.Overview
12.1.1.Europe Fiber Optics Market Revenue (US$ Mn)
12.2.Europe Fiber Optics Market Revenue (US$ Mn) and Forecasts, By Type
12.2.1. Single Mode
12.2.2.Multi mode
12.2.2.1.Multimode graded index
12.2.2.2.Multimode step index
12.3.Europe Fiber Optics Market Revenue (US$ Mn) and Forecasts, By Material
12.3.1.Glass
12.3.2.Plastic
12.4.Europe Fiber Optics Market Revenue (US$ Mn) and Forecasts, By End User Industry
12.4.1.IT and Telecommunications
12.4.2.Energy and Utilities
12.4.3.Defense and Military
12.4.4.Electronics
12.4.5.Construction
12.4.6.Healthcare
12.4.7.Manufacturing
12.4.8.Aerospace
12.4.9.Automotive
12.4.10.Others
12.5.Europe Fiber Optics Market Revenue (US$ Mn) and Forecasts, By Country
12.5.1.France
12.5.1.1.France Fiber Optics Market Revenue (US$ Mn) and Forecasts, By Type
12.5.1.1.1. Single Mode
12.5.1.1.2.Multi mode
12.5.1.1.2.1.Multimode graded index
12.5.1.1.2.2.Multimode step index
12.5.1.2.France Fiber Optics Market Revenue (US$ Mn) and Forecasts, By Material
12.5.1.2.1.Glass
12.5.1.2.2.Plastic
12.5.1.3.France Fiber Optics Market Revenue (US$ Mn) and Forecasts, By End User Industry
12.5.1.3.1.IT and Telecommunications
12.5.1.3.2.Energy and Utilities
12.5.1.3.3.Defense and Military
12.5.1.3.4.Electronics
12.5.1.3.5.Construction
12.5.1.3.6.Healthcare
12.5.1.3.7.Manufacturing
12.5.1.3.8.Aerospace
12.5.1.3.9.Automotive
12.5.1.3.10.Others
12.5.2.The UK
12.5.2.1.The UK Fiber Optics Market Revenue (US$ Mn) and Forecasts, By Type
12.5.2.1.1. Single Mode
12.5.2.1.2.Multi mode
12.5.2.1.2.1.Multimode graded index
12.5.2.1.2.2.Multimode step index
12.5.2.2.The UK Fiber Optics Market Revenue (US$ Mn) and Forecasts, By Material
12.5.2.2.1.Glass
12.5.2.2.2.Plastic
12.5.2.3.The UK Fiber Optics Market Revenue (US$ Mn) and Forecasts, By End User Industry
12.5.2.3.1.IT and Telecommunications
12.5.2.3.2.Energy and Utilities
12.5.2.3.3.Defense and Military
12.5.2.3.4.Electronics
12.5.2.3.5.Construction
12.5.2.3.6.Healthcare
12.5.2.3.7.Manufacturing
12.5.2.3.8.Aerospace
12.5.2.3.9.Automotive
12.5.2.3.10.Others
12.5.3.Spain
12.5.3.1.Spain Fiber Optics Market Revenue (US$ Mn) and Forecasts, By Type
12.5.3.1.1. Single Mode
12.5.3.1.2.Multi mode
12.5.3.1.2.1.Multimode graded index
12.5.3.1.2.2.Multimode step index
12.5.3.2.Spain Fiber Optics Market Revenue (US$ Mn) and Forecasts, By Material
12.5.3.2.1.Glass
12.5.3.2.2.Plastic
12.5.3.3.Spain Fiber Optics Market Revenue (US$ Mn) and Forecasts, By End User Industry
12.5.3.3.1.IT and Telecommunications
12.5.3.3.2.Energy and Utilities
12.5.3.3.3.Defense and Military
12.5.3.3.4.Electronics
12.5.3.3.5.Construction
12.5.3.3.6.Healthcare
12.5.3.3.7.Manufacturing
12.5.3.3.8.Aerospace
12.5.3.3.9.Automotive
12.5.3.3.10.Others
12.5.4.Germany
12.5.4.1.Germany Fiber Optics Market Revenue (US$ Mn) and Forecasts, By Type
12.5.4.1.1. Single Mode
12.5.4.1.2.Multi mode
12.5.4.1.2.1.Multimode graded index
12.5.4.1.2.2.Multimode step index
12.5.4.2.Germany Fiber Optics Market Revenue (US$ Mn) and Forecasts, By Material
12.5.4.2.1.Glass
12.5.4.2.2.Plastic
12.5.4.3.Germany Fiber Optics Market Revenue (US$ Mn) and Forecasts, By End User Industry
12.5.4.3.1.IT and Telecommunications
12.5.4.3.2.Energy and Utilities
12.5.4.3.3.Defense and Military
12.5.4.3.4.Electronics
12.5.4.3.5.Construction
12.5.4.3.6.Healthcare
12.5.4.3.7.Manufacturing
12.5.4.3.8.Aerospace
12.5.4.3.9.Automotive
12.5.4.3.10.Others
12.5.5.Italy
12.5.5.1.Italy Fiber Optics Market Revenue (US$ Mn) and Forecasts, By Type
12.5.5.1.1. Single Mode
12.5.5.1.2.Multi mode
12.5.5.1.2.1.Multimode graded index
12.5.5.1.2.2.Multimode step index
12.5.5.2.Italy Fiber Optics Market Revenue (US$ Mn) and Forecasts, By Material
12.5.5.2.1.Glass
12.5.5.2.2.Plastic
12.5.5.3.Italy Fiber Optics Market Revenue (US$ Mn) and Forecasts, By End User Industry
12.5.5.3.1.IT and Telecommunications
12.5.5.3.2.Energy and Utilities
12.5.5.3.3.Defense and Military
12.5.5.3.4.Electronics
12.5.5.3.5.Construction
12.5.5.3.6.Healthcare
12.5.5.3.7.Manufacturing
12.5.5.3.8.Aerospace
12.5.5.3.9.Automotive
12.5.5.3.10.Others
12.5.6.Nordic Countries
12.5.6.1.Nordic Countries Fiber Optics Market Revenue (US$ Mn) and Forecasts, By Type
12.5.6.1.1. Single Mode
12.5.6.1.2.Multi mode
12.5.6.1.2.1.Multimode graded index
12.5.6.1.2.2.Multimode step index
12.5.6.2.Nordic Countries Fiber Optics Market Revenue (US$ Mn) and Forecasts, By Material
12.5.6.2.1.Glass
12.5.6.2.2.Plastic
12.5.6.3.Nordic Countries Fiber Optics Market Revenue (US$ Mn) and Forecasts, By End User Industry
12.5.6.3.1.IT and Telecommunications
12.5.6.3.2.Energy and Utilities
12.5.6.3.3.Defense and Military
12.5.6.3.4.Electronics
12.5.6.3.5.Construction
12.5.6.3.6.Healthcare
12.5.6.3.7.Manufacturing
12.5.6.3.8.Aerospace
12.5.6.3.9.Automotive
12.5.6.3.10.Others
12.5.6.4.Nordic Countries Fiber Optics Market Revenue (US$ Mn) and Forecasts, By Country
12.5.6.4.1.Denmark
12.5.6.4.2.Finland
12.5.6.4.3.Iceland
12.5.6.4.4.Sweden
12.5.6.4.5.Norway
12.5.7.Benelux Union
12.5.7.1.Benelux Union Fiber Optics Market Revenue (US$ Mn) and Forecasts, By Type
12.5.7.1.1. Single Mode
12.5.7.1.2.Multi mode
12.5.7.1.2.1.Multimode graded index
12.5.7.1.2.2.Multimode step index
12.5.7.2.Benelux Union Fiber Optics Market Revenue (US$ Mn) and Forecasts, By Material
12.5.7.2.1.Glass
12.5.7.2.2.Plastic
12.5.7.3.Benelux Union Fiber Optics Market Revenue (US$ Mn) and Forecasts, By End User Industry
12.5.7.3.1.IT and Telecommunications
12.5.7.3.2.Energy and Utilities
12.5.7.3.3.Defense and Military
12.5.7.3.4.Electronics
12.5.7.3.5.Construction
12.5.7.3.6.Healthcare
12.5.7.3.7.Manufacturing
12.5.7.3.8.Aerospace
12.5.7.3.9.Automotive
12.5.7.3.10.Others
12.5.7.4.Benelux Union Fiber Optics Market Revenue (US$ Mn) and Forecasts, By Country
12.5.7.4.1.Belgium
12.5.7.4.2.The Netherlands
12.5.7.4.3.Luxembourg
12.5.8.Rest of Europe
12.5.8.1.Rest of Europe Fiber Optics Market Revenue (US$ Mn) and Forecasts, By Type
12.5.8.1.1. Single Mode
12.5.8.1.2.Multi mode
12.5.8.1.2.1.Multimode graded index
12.5.8.1.2.2.Multimode step index
12.5.8.2.Rest of Europe Fiber Optics Market Revenue (US$ Mn) and Forecasts, By Material
12.5.8.2.1.Glass
12.5.8.2.2.Plastic
12.5.8.3.Rest of Europe Fiber Optics Market Revenue (US$ Mn) and Forecasts, By End User Industry
12.5.8.3.1.IT and Telecommunications
12.5.8.3.2.Energy and Utilities
12.5.8.3.3.Defense and Military
12.5.8.3.4.Electronics
12.5.8.3.5.Construction
12.5.8.3.6.Healthcare
12.5.8.3.7.Manufacturing
12.5.8.3.8.Aerospace
12.5.8.3.9.Automotive
12.5.8.3.10.Others
12.6.Key Segment for Channeling Investments
12.6.1.By Country
12.6.2.By Type
12.6.3.By Material
12.6.4.By End User Industry
13.Asia Pacific Fiber Optics Market Analysis and Forecasts, 2023 – 2031
13.1.Overview
13.1.1.Asia Pacific Fiber Optics Market Revenue (US$ Mn)
13.2.Asia Pacific Fiber Optics Market Revenue (US$ Mn) and Forecasts, By Type
13.2.1. Single Mode
13.2.2.Multi mode
13.2.2.1.Multimode graded index
13.2.2.2.Multimode step index
13.3.Asia Pacific Fiber Optics Market Revenue (US$ Mn) and Forecasts, By Material
13.3.1.Glass
13.3.2.Plastic
13.4.Asia Pacific Fiber Optics Market Revenue (US$ Mn) and Forecasts, By End User Industry
13.4.1.IT and Telecommunications
13.4.2.Energy and Utilities
13.4.3.Defense and Military
13.4.4.Electronics
13.4.5.Construction
13.4.6.Healthcare
13.4.7.Manufacturing
13.4.8.Aerospace
13.4.9.Automotive
13.4.10.Others
13.5.Asia Pacific Fiber Optics Market Revenue (US$ Mn) and Forecasts, By Country
13.5.1.China
13.5.1.1.China Fiber Optics Market Revenue (US$ Mn) and Forecasts, By Type
13.5.1.1.1. Single Mode
13.5.1.1.2.Multi mode
13.5.1.1.2.1.Multimode graded index
13.5.1.1.2.2.Multimode step index
13.5.1.2.China Fiber Optics Market Revenue (US$ Mn) and Forecasts, By Material
13.5.1.2.1.Glass
13.5.1.2.2.Plastic
13.5.1.3.China Fiber Optics Market Revenue (US$ Mn) and Forecasts, By End User Industry
13.5.1.3.1.IT and Telecommunications
13.5.1.3.2.Energy and Utilities
13.5.1.3.3.Defense and Military
13.5.1.3.4.Electronics
13.5.1.3.5.Construction
13.5.1.3.6.Healthcare
13.5.1.3.7.Manufacturing
13.5.1.3.8.Aerospace
13.5.1.3.9.Automotive
13.5.1.3.10.Others
13.5.2.Japan
13.5.2.1.Japan Fiber Optics Market Revenue (US$ Mn) and Forecasts, By Type
13.5.2.1.1. Single Mode
13.5.2.1.2.Multi mode
13.5.2.1.2.1.Multimode graded index
13.5.2.1.2.2.Multimode step index
13.5.2.2.Japan Fiber Optics Market Revenue (US$ Mn) and Forecasts, By Material
13.5.2.2.1.Glass
13.5.2.2.2.Plastic
13.5.2.3.Japan Fiber Optics Market Revenue (US$ Mn) and Forecasts, By End User Industry
13.5.2.3.1.IT and Telecommunications
13.5.2.3.2.Energy and Utilities
13.5.2.3.3.Defense and Military
13.5.2.3.4.Electronics
13.5.2.3.5.Construction
13.5.2.3.6.Healthcare
13.5.2.3.7.Manufacturing
13.5.2.3.8.Aerospace
13.5.2.3.9.Automotive
13.5.2.3.10.Others
13.5.3.India
13.5.3.1.India Fiber Optics Market Revenue (US$ Mn) and Forecasts, By Type
13.5.3.1.1. Single Mode
13.5.3.1.2.Multi mode
13.5.3.1.2.1.Multimode graded index
13.5.3.1.2.2.Multimode step index
13.5.3.2.India Fiber Optics Market Revenue (US$ Mn) and Forecasts, By Material
13.5.3.2.1.Glass
13.5.3.2.2.Plastic
13.5.3.3.India Fiber Optics Market Revenue (US$ Mn) and Forecasts, By End User Industry
13.5.3.3.1.IT and Telecommunications
13.5.3.3.2.Energy and Utilities
13.5.3.3.3.Defense and Military
13.5.3.3.4.Electronics
13.5.3.3.5.Construction
13.5.3.3.6.Healthcare
13.5.3.3.7.Manufacturing
13.5.3.3.8.Aerospace
13.5.3.3.9.Automotive
13.5.3.3.10.Others
13.5.4.New Zealand
13.5.4.1.New Zealand Fiber Optics Market Revenue (US$ Mn) and Forecasts, By Type
13.5.4.1.1. Single Mode
13.5.4.1.2.Multi mode
13.5.4.1.2.1.Multimode graded index
13.5.4.1.2.2.Multimode step index
13.5.4.2.New Zealand Fiber Optics Market Revenue (US$ Mn) and Forecasts, By Material
13.5.4.2.1.Glass
13.5.4.2.2.Plastic
13.5.4.3.New Zealand Fiber Optics Market Revenue (US$ Mn) and Forecasts, By End User Industry
13.5.4.3.1.IT and Telecommunications
13.5.4.3.2.Energy and Utilities
13.5.4.3.3.Defense and Military
13.5.4.3.4.Electronics
13.5.4.3.5.Construction
13.5.4.3.6.Healthcare
13.5.4.3.7.Manufacturing
13.5.4.3.8.Aerospace
13.5.4.3.9.Automotive
13.5.4.3.10.Others
13.5.5.Australia
13.5.5.1.Australia Fiber Optics Market Revenue (US$ Mn) and Forecasts, By Type
13.5.5.1.1. Single Mode
13.5.5.1.2.Multi mode
13.5.5.1.2.1.Multimode graded index
13.5.5.1.2.2.Multimode step index
13.5.5.2.Australia Fiber Optics Market Revenue (US$ Mn) and Forecasts, By Material
13.5.5.2.1.Glass
13.5.5.2.2.Plastic
13.5.5.3.Australia Fiber Optics Market Revenue (US$ Mn) and Forecasts, By End User Industry
13.5.5.3.1.IT and Telecommunications
13.5.5.3.2.Energy and Utilities
13.5.5.3.3.Defense and Military
13.5.5.3.4.Electronics
13.5.5.3.5.Construction
13.5.5.3.6.Healthcare
13.5.5.3.7.Manufacturing
13.5.5.3.8.Aerospace
13.5.5.3.9.Automotive
13.5.5.3.10.Others
13.5.6.South Korea
13.5.6.1.South Korea Fiber Optics Market Revenue (US$ Mn) and Forecasts, By Type
13.5.6.1.1. Single Mode
13.5.6.1.2.Multi mode
13.5.6.1.2.1.Multimode graded index
13.5.6.1.2.2.Multimode step index
13.5.6.2.South Korea Fiber Optics Market Revenue (US$ Mn) and Forecasts, By Material
13.5.6.2.1.Glass
13.5.6.2.2.Plastic
13.5.6.3.South Korea Fiber Optics Market Revenue (US$ Mn) and Forecasts, By End User Industry
13.5.6.3.1.IT and Telecommunications
13.5.6.3.2.Energy and Utilities
13.5.6.3.3.Defense and Military
13.5.6.3.4.Electronics
13.5.6.3.5.Construction
13.5.6.3.6.Healthcare
13.5.6.3.7.Manufacturing
13.5.6.3.8.Aerospace
13.5.6.3.9.Automotive
13.5.6.3.10.Others
13.5.7.Southeast Asia
13.5.7.1.Southeast Asia Fiber Optics Market Revenue (US$ Mn) and Forecasts, By Type
13.5.7.1.1. Single Mode
13.5.7.1.2.Multi mode
13.5.7.1.2.1.Multimode graded index
13.5.7.1.2.2.Multimode step index
13.5.7.2.Southeast Asia Fiber Optics Market Revenue (US$ Mn) and Forecasts, By Material
13.5.7.2.1.Glass
13.5.7.2.2.Plastic
13.5.7.3.Southeast Asia Fiber Optics Market Revenue (US$ Mn) and Forecasts, By End User Industry
13.5.7.3.1.IT and Telecommunications
13.5.7.3.2.Energy and Utilities
13.5.7.3.3.Defense and Military
13.5.7.3.4.Electronics
13.5.7.3.5.Construction
13.5.7.3.6.Healthcare
13.5.7.3.7.Manufacturing
13.5.7.3.8.Aerospace
13.5.7.3.9.Automotive
13.5.7.3.10.Others
13.5.7.4.Southeast Asia Fiber Optics Market Revenue (US$ Mn) and Forecasts, By Country
13.5.7.4.1.Indonesia
13.5.7.4.2.Thailand
13.5.7.4.3.Malaysia
13.5.7.4.4.Singapore
13.5.7.4.5.Rest of Southeast Asia
13.5.8.Rest of Asia Pacific
13.5.8.1.Rest of Asia Pacific Fiber Optics Market Revenue (US$ Mn) and Forecasts, By Type
13.5.8.1.1. Single Mode
13.5.8.1.2.Multi mode
13.5.8.1.2.1.Multimode graded index
13.5.8.1.2.2.Multimode step index
13.5.8.2.Rest of Asia Pacific Fiber Optics Market Revenue (US$ Mn) and Forecasts, By Material
13.5.8.2.1.Glass
13.5.8.2.2.Plastic
13.5.8.3.Rest of Asia Pacific Fiber Optics Market Revenue (US$ Mn) and Forecasts, By End User Industry
13.5.8.3.1.IT and Telecommunications
13.5.8.3.2.Energy and Utilities
13.5.8.3.3.Defense and Military
13.5.8.3.4.Electronics
13.5.8.3.5.Construction
13.5.8.3.6.Healthcare
13.5.8.3.7.Manufacturing
13.5.8.3.8.Aerospace
13.5.8.3.9.Automotive
13.5.8.3.10.Others
13.6.Key Segment for Channeling Investments
13.6.1.By Country
13.6.2.By Type
13.6.3.By Material
13.6.4.By End User Industry
14.Middle East and Africa Fiber Optics Market Analysis and Forecasts, 2023 – 2031
14.1.Overview
14.1.1.Middle East and Africa Fiber Optics Market Revenue (US$ Mn)
14.2.Middle East and Africa Fiber Optics Market Revenue (US$ Mn) and Forecasts, By Type
14.2.1. Single Mode
14.2.2.Multi mode
14.2.2.1.Multimode graded index
14.2.2.2.Multimode step index
14.3.Middle East and Africa Fiber Optics Market Revenue (US$ Mn) and Forecasts, By Material
14.3.1.Glass
14.3.2.Plastic
14.4.Middle East and Africa Fiber Optics Market Revenue (US$ Mn) and Forecasts, By End User Industry
14.4.1.IT and Telecommunications
14.4.2.Energy and Utilities
14.4.3.Defense and Military
14.4.4.Electronics
14.4.5.Construction
14.4.6.Healthcare
14.4.7.Manufacturing
14.4.8.Aerospace
14.4.9.Automotive
14.4.10.Others
14.5.Middle East and Africa Fiber Optics Market Revenue (US$ Mn) and Forecasts, By Country
14.5.1.Saudi Arabia
14.5.1.1.Saudi Arabia Fiber Optics Market Revenue (US$ Mn) and Forecasts, By Type
14.5.1.1.1. Single Mode
14.5.1.1.2.Multi mode
14.5.1.1.2.1.Multimode graded index
14.5.1.1.2.2.Multimode step index
14.5.1.2.Saudi Arabia Fiber Optics Market Revenue (US$ Mn) and Forecasts, By Material
14.5.1.2.1.Glass
14.5.1.2.2.Plastic
14.5.1.3.Saudi Arabia Fiber Optics Market Revenue (US$ Mn) and Forecasts, By End User Industry
14.5.1.3.1.IT and Telecommunications
14.5.1.3.2.Energy and Utilities
14.5.1.3.3.Defense and Military
14.5.1.3.4.Electronics
14.5.1.3.5.Construction
14.5.1.3.6.Healthcare
14.5.1.3.7.Manufacturing
14.5.1.3.8.Aerospace
14.5.1.3.9.Automotive
14.5.1.3.10.Others
14.5.2.UAE
14.5.2.1.UAE Fiber Optics Market Revenue (US$ Mn) and Forecasts, By Type
14.5.2.1.1. Single Mode
14.5.2.1.2.Multi mode
14.5.2.1.2.1.Multimode graded index
14.5.2.1.2.2.Multimode step index
14.5.2.2.UAE Fiber Optics Market Revenue (US$ Mn) and Forecasts, By Material
14.5.2.2.1.Glass
14.5.2.2.2.Plastic
14.5.2.3.UAE Fiber Optics Market Revenue (US$ Mn) and Forecasts, By End User Industry
14.5.2.3.1.IT and Telecommunications
14.5.2.3.2.Energy and Utilities
14.5.2.3.3.Defense and Military
14.5.2.3.4.Electronics
14.5.2.3.5.Construction
14.5.2.3.6.Healthcare
14.5.2.3.7.Manufacturing
14.5.2.3.8.Aerospace
14.5.2.3.9.Automotive
14.5.2.3.10.Others
14.5.3.Egypt
14.5.3.1.Egypt Fiber Optics Market Revenue (US$ Mn) and Forecasts, By Type
14.5.3.1.1. Single Mode
14.5.3.1.2.Multi mode
14.5.3.1.2.1.Multimode graded index
14.5.3.1.2.2.Multimode step index
14.5.3.2.Egypt Fiber Optics Market Revenue (US$ Mn) and Forecasts, By Material
14.5.3.2.1.Glass
14.5.3.2.2.Plastic
14.5.3.3.Egypt Fiber Optics Market Revenue (US$ Mn) and Forecasts, By End User Industry
14.5.3.3.1.IT and Telecommunications
14.5.3.3.2.Energy and Utilities
14.5.3.3.3.Defense and Military
14.5.3.3.4.Electronics
14.5.3.3.5.Construction
14.5.3.3.6.Healthcare
14.5.3.3.7.Manufacturing
14.5.3.3.8.Aerospace
14.5.3.3.9.Automotive
14.5.3.3.10.Others
14.5.4.Kuwait
14.5.4.1.Kuwait Fiber Optics Market Revenue (US$ Mn) and Forecasts, By Type
14.5.4.1.1. Single Mode
14.5.4.1.2.Multi mode
14.5.4.1.2.1.Multimode graded index
14.5.4.1.2.2.Multimode step index
14.5.4.2.Kuwait Fiber Optics Market Revenue (US$ Mn) and Forecasts, By Material
14.5.4.2.1.Glass
14.5.4.2.2.Plastic
14.5.4.3.Kuwait Fiber Optics Market Revenue (US$ Mn) and Forecasts, By End User Industry
14.5.4.3.1.IT and Telecommunications
14.5.4.3.2.Energy and Utilities
14.5.4.3.3.Defense and Military
14.5.4.3.4.Electronics
14.5.4.3.5.Construction
14.5.4.3.6.Healthcare
14.5.4.3.7.Manufacturing
14.5.4.3.8.Aerospace
14.5.4.3.9.Automotive
14.5.4.3.10.Others
14.5.5.South Africa
14.5.5.1.South Africa Fiber Optics Market Revenue (US$ Mn) and Forecasts, By Type
14.5.5.1.1. Single Mode
14.5.5.1.2.Multi mode
14.5.5.1.2.1.Multimode graded index
14.5.5.1.2.2.Multimode step index
14.5.5.2.South Africa Fiber Optics Market Revenue (US$ Mn) and Forecasts, By Material
14.5.5.2.1.Glass
14.5.5.2.2.Plastic
14.5.5.3.South Africa Fiber Optics Market Revenue (US$ Mn) and Forecasts, By End User Industry
14.5.5.3.1.IT and Telecommunications
14.5.5.3.2.Energy and Utilities
14.5.5.3.3.Defense and Military
14.5.5.3.4.Electronics
14.5.5.3.5.Construction
14.5.5.3.6.Healthcare
14.5.5.3.7.Manufacturing
14.5.5.3.8.Aerospace
14.5.5.3.9.Automotive
14.5.5.3.10.Others
14.5.6.Rest of Middle East & Africa
14.5.6.1.Rest of Middle East & Africa Fiber Optics Market Revenue (US$ Mn) and Forecasts, By Type
14.5.6.1.1. Single Mode
14.5.6.1.2.Multi mode
14.5.6.1.2.1.Multimode graded index
14.5.6.1.2.2.Multimode step index
14.5.6.2.Rest of Middle East & Africa Fiber Optics Market Revenue (US$ Mn) and Forecasts, By Material
14.5.6.2.1.Glass
14.5.6.2.2.Plastic
14.5.6.3.Rest of Middle East & Africa Fiber Optics Market Revenue (US$ Mn) and Forecasts, By End User Industry
14.5.6.3.1.IT and Telecommunications
14.5.6.3.2.Energy and Utilities
14.5.6.3.3.Defense and Military
14.5.6.3.4.Electronics
14.5.6.3.5.Construction
14.5.6.3.6.Healthcare
14.5.6.3.7.Manufacturing
14.5.6.3.8.Aerospace
14.5.6.3.9.Automotive
14.5.6.3.10.Others
14.6.Key Segment for Channeling Investments
14.6.1.By Country
14.6.2.By Type
14.6.3.By Material
14.6.4.By End User Industry
15.Latin America Fiber Optics Market Analysis and Forecasts, 2023 – 2031
15.1.Overview
15.1.1.Latin America Fiber Optics Market Revenue (US$ Mn)
15.2.Latin America Fiber Optics Market Revenue (US$ Mn) and Forecasts, By Type
15.2.1. Single Mode
15.2.2.Multi mode
15.2.2.1.Multimode graded index
15.2.2.2.Multimode step index
15.3.Latin America Fiber Optics Market Revenue (US$ Mn) and Forecasts, By Material
15.3.1.Glass
15.3.2.Plastic
15.4.Latin America Fiber Optics Market Revenue (US$ Mn) and Forecasts, By End User Industry
15.4.1.IT and Telecommunications
15.4.2.Energy and Utilities
15.4.3.Defense and Military
15.4.4.Electronics
15.4.5.Construction
15.4.6.Healthcare
15.4.7.Manufacturing
15.4.8.Aerospace
15.4.9.Automotive
15.4.10.Others
15.5.Latin America Fiber Optics Market Revenue (US$ Mn) and Forecasts, By Country
15.5.1.Brazil
15.5.1.1.Brazil Fiber Optics Market Revenue (US$ Mn) and Forecasts, By Type
15.5.1.1.1. Single Mode
15.5.1.1.2.Multi mode
15.5.1.1.2.1.Multimode graded index
15.5.1.1.2.2.Multimode step index
15.5.1.2.Brazil Fiber Optics Market Revenue (US$ Mn) and Forecasts, By Material
15.5.1.2.1.Glass
15.5.1.2.2.Plastic
15.5.1.3.Brazil Fiber Optics Market Revenue (US$ Mn) and Forecasts, By End User Industry
15.5.1.3.1.IT and Telecommunications
15.5.1.3.2.Energy and Utilities
15.5.1.3.3.Defense and Military
15.5.1.3.4.Electronics
15.5.1.3.5.Construction
15.5.1.3.6.Healthcare
15.5.1.3.7.Manufacturing
15.5.1.3.8.Aerospace
15.5.1.3.9.Automotive
15.5.1.3.10.Others
15.5.2.Argentina
15.5.2.1.Argentina Fiber Optics Market Revenue (US$ Mn) and Forecasts, By Type
15.5.2.1.1. Single Mode
15.5.2.1.2.Multi mode
15.5.2.1.2.1.Multimode graded index
15.5.2.1.2.2.Multimode step index
15.5.2.2.Argentina Fiber Optics Market Revenue (US$ Mn) and Forecasts, By Material
15.5.2.2.1.Glass
15.5.2.2.2.Plastic
15.5.2.3.Argentina Fiber Optics Market Revenue (US$ Mn) and Forecasts, By End User Industry
15.5.2.3.1.IT and Telecommunications
15.5.2.3.2.Energy and Utilities
15.5.2.3.3.Defense and Military
15.5.2.3.4.Electronics
15.5.2.3.5.Construction
15.5.2.3.6.Healthcare
15.5.2.3.7.Manufacturing
15.5.2.3.8.Aerospace
15.5.2.3.9.Automotive
15.5.2.3.10.Others
15.5.3.Rest of Latin America
15.5.3.1.Rest of Latin America Fiber Optics Market Revenue (US$ Mn) and Forecasts, By Type
15.5.3.1.1. Single Mode
15.5.3.1.2.Multi mode
15.5.3.1.2.1.Multimode graded index
15.5.3.1.2.2.Multimode step index
15.5.3.2.Rest of Latin America Fiber Optics Market Revenue (US$ Mn) and Forecasts, By Material
15.5.3.2.1.Glass
15.5.3.2.2.Plastic
15.5.3.3.Rest of Latin America Fiber Optics Market Revenue (US$ Mn) and Forecasts, By End User Industry
15.5.3.3.1.IT and Telecommunications
15.5.3.3.2.Energy and Utilities
15.5.3.3.3.Defense and Military
15.5.3.3.4.Electronics
15.5.3.3.5.Construction
15.5.3.3.6.Healthcare
15.5.3.3.7.Manufacturing
15.5.3.3.8.Aerospace
15.5.3.3.9.Automotive
15.5.3.3.10.Others
15.6.Key Segment for Channeling Investments
15.6.1.By Country
15.6.2.By Type
15.6.3.By Material
15.6.4.By End User Industry
16.Competitive Benchmarking
16.1.Market Share Analysis, 2022
16.2.Global Presence and Growth Strategies
16.2.1.Mergers and Acquisitions
16.2.2.Product Launches
16.2.3.Investments Trends
16.2.4.R&D Initiatives
17.Player Profiles
17.1.AFL
17.1.1.Company Details
17.1.2.Company Overview
17.1.3.Product Offerings
17.1.4.Key Developments
17.1.5.Financial Analysis
17.1.6.SWOT Analysis
17.1.7.Business Strategies
17.2.Belden Inc
17.2.1.Company Details
17.2.2.Company Overview
17.2.3.Product Offerings
17.2.4.Key Developments
17.2.5.Financial Analysis
17.2.6.SWOT Analysis
17.2.7.Business Strategies
17.3.CommScope
17.3.1.Company Details
17.3.2.Company Overview
17.3.3.Product Offerings
17.3.4.Key Developments
17.3.5.Financial Analysis
17.3.6.SWOT Analysis
17.3.7.Business Strategies
17.4.Corning Incorporated
17.4.1.Company Details
17.4.2.Company Overview
17.4.3.Product Offerings
17.4.4.Key Developments
17.4.5.Financial Analysis
17.4.6.SWOT Analysis
17.4.7.Business Strategies
17.5.FiberHome
17.5.1.Company Details
17.5.2.Company Overview
17.5.3.Product Offerings
17.5.4.Key Developments
17.5.5.Financial Analysis
17.5.6.SWOT Analysis
17.5.7.Business Strategies
17.6.Fujikura Ltd
17.6.1.Company Details
17.6.2.Company Overview
17.6.3.Product Offerings
17.6.4.Key Developments
17.6.5.Financial Analysis
17.6.6.SWOT Analysis
17.6.7.Business Strategies
17.7.Hexatronic Group
17.7.1.Company Details
17.7.2.Company Overview
17.7.3.Product Offerings
17.7.4.Key Developments
17.7.5.Financial Analysis
17.7.6.SWOT Analysis
17.7.7.Business Strategies
17.8.LS Cable & System Ltd.
17.8.1.Company Details
17.8.2.Company Overview
17.8.3.Product Offerings
17.8.4.Key Developments
17.8.5.Financial Analysis
17.8.6.SWOT Analysis
17.8.7.Business Strategies
17.9.NEXANS
17.9.1.Company Details
17.9.2.Company Overview
17.9.3.Product Offerings
17.9.4.Key Developments
17.9.5.Financial Analysis
17.9.6.SWOT Analysis
17.9.7.Business Strategies
17.10.Prysmian Spa
17.10.1.Company Details
17.10.2.Company Overview
17.10.3.Product Offerings
17.10.4.Key Developments
17.10.5.Financial Analysis
17.10.6.SWOT Analysis
17.10.7.Business Strategies
17.11.Sterlite Technologies Limited
17.11.1.Company Details
17.11.2.Company Overview
17.11.3.Product Offerings
17.11.4.Key Developments
17.11.5.Financial Analysis
17.11.6.SWOT Analysis
17.11.7.Business Strategies
17.12.Sumitomo Electric Lightwave, Inc.
17.12.1.Company Details
17.12.2.Company Overview
17.12.3.Product Offerings
17.12.4.Key Developments
17.12.5.Financial Analysis
17.12.6.SWOT Analysis
17.12.7.Business Strategies
17.13.TE Connectivity
17.13.1.Company Details
17.13.2.Company Overview
17.13.3.Product Offerings
17.13.4.Key Developments
17.13.5.Financial Analysis
17.13.6.SWOT Analysis
17.13.7.Business Strategies
17.14.Tongding Interconnection Information Co., Ltd.
17.14.1.Company Details
17.14.2.Company Overview
17.14.3.Product Offerings
17.14.4.Key Developments
17.14.5.Financial Analysis
17.14.6.SWOT Analysis
17.14.7.Business Strategies
17.15.Yangtze Optical Fibre
17.15.1.Company Details
17.15.2.Company Overview
17.15.3.Product Offerings
17.15.4.Key Developments
17.15.5.Financial Analysis
17.15.6.SWOT Analysis
17.15.7.Business Strategies
17.16.Other market participants
18.Key Findings

.

Note: This ToC is tentative and can be changed according to the research study conducted during the course of report completion.

.

**Exclusive for Multi-User and Enterprise User.

.

Global Fiber Optics Market Segmentation

By Type

 Single Mode
 Multi mode
 Multimode graded index
 Multimode step index

By Material

 Glass
 Plastic

By End User Industry

 IT and Telecommunications
 Energy and Utilities
 Defense and Military
 Electronics
 Construction
 Healthcare
 Manufacturing
 Aerospace
 Automotive
 Others

By Region

 North America (U.S., Canada, Mexico, Rest of North America)
 Europe (France, The UK, Spain, Germany, Italy, Nordic Countries (Denmark, Finland, Iceland, Sweden, Norway), Benelux Union (Belgium, The Netherlands, Luxembourg), Rest of Europe)
 Asia Pacific (China, Japan, India, New Zealand, Australia, South Korea, Southeast Asia (Indonesia, Thailand, Malaysia, Singapore, Rest of Southeast Asia), Rest of Asia Pacific)
 Middle East & Africa (Saudi Arabia, UAE, Egypt, Kuwait, South Africa, Rest of Middle East & Africa)
 Latin America (Brazil, Argentina, Rest of Latin America)

**Note: The report covers cross-segmentation analysis by region further into countries

.

The Niche Research approach encompasses both primary and secondary research methods to provide comprehensive insights. While primary research is the cornerstone of our studies, we also incorporate secondary research sources such as company annual reports, premium industry databases, press releases, industry journals, and white papers.

Within our primary research, we actively engage with various industry stakeholders, conducting paid interviews and surveys. Our meticulous analysis extends to every market participant in major countries, allowing us to thoroughly examine their portfolios, calculate market shares, and segment revenues.

Our data collection primarily focuses on individual countries within our research scope, enabling us to estimate regional market sizes. Typically, we employ a bottom-up approach, meticulously tracking trends in different countries. We analyze growth drivers, constraints, technological innovations, and opportunities for each country, ultimately arriving at regional figures.Our process begins by examining the growth prospects of each country. Building upon these insights, we project growth and trends for the entire region. Finally, we utilize our proprietary model to refine estimations and forecasts.

Our data validation standards are integral to ensuring the reliability and accuracy of our research findings. Here’s a breakdown of our data validation processes and the stakeholders we engage with during our primary research:

  • Supply Side Analysis: We initiate a supply side analysis by directly contacting market participants, through telephonic interviews and questionnaires containing both open-ended and close-ended questions. We gather information on their portfolios, segment revenues, developments, and growth strategies.
  • Demand Side Analysis: To gain insights into adoption trends and consumer preferences, we reach out to target customers and users (non-vendors). This information forms a vital part of the qualitative analysis section of our reports, covering market dynamics, adoption trends, consumer behavior, spending patterns, and other related aspects.
  • Consultant Insights: We tap into the expertise of our partner consultants from around the world to obtain their unique viewpoints and perspectives. Their insights contribute to a well-rounded understanding of the markets under investigation.
  • In-House Validation: To ensure data accuracy and reliability, we conduct cross-validation of data points and information through our in-house team of consultants and utilize advanced data modeling tools for thorough verification.

The forecasts we provide are based on a comprehensive assessment of various factors, including:

  • Market Trends and Past Performance (Last Five Years): We accurately analyze market trends and performance data from preceding five years to identify historical patterns and understand the market’s evolution.
  • Historical Performance and Growth of Market Participants: We assess the historical performance and growth trajectories of key market participants. This analysis provides insights into the competitive landscape and individual company strategies.
  • Market Determinants Impact Analysis (Next Eight Years): We conduct a rigorous analysis of the factors that are projected to influence the market over the next eight years. This includes assessing both internal and external determinants that can shape market dynamics.
  • Drivers and Challenges for the Forecast Period:Identify the factors expected to drive market growth during the forecast period, as well as the challenges that the industry may face. This analysis aids in deriving an accurate growth rate projection.
  • New Acquisitions, Collaborations, or Partnerships: We keep a close watch on any new acquisitions, collaborations, or partnerships within the industry. These developments can have a significant impact on market dynamics and competitiveness.
  • Macro and Micro Factors Analysis:A thorough examination of both macro-level factors (e.g., economic trends, regulatory changes) and micro-level factors (e.g., technological advancements, consumer preferences) that may influence the market during the forecast period.
  • End-User Sentiment Analysis: To understand the market from the end-user perspective, we conduct sentiment analysis. This involves assessing the sentiment, preferences, and feedback of the end-users, which can provide valuable insights into market trends.
  • Perspective of Primary Participants: Insights gathered directly from primary research participants play a crucial role in shaping our forecasts. Their perspectives and experiences provide valuable qualitative data.
  • Year-on-Year Growth Trend: We utilize a year-on-year growth trend based on historical market growth and expected future trends. This helps in formulating our growth projections, aligning them with the market’s historical performance.

Research process adopted by TNR involves multiple stages, including data collection, validation, quality checks, and presentation. It’s crucial that the data and information we provide add value to your existing market understanding and expertise. We have also established partnerships with business consulting, research, and survey organizations across regions and globally to collaborate on regional analysis and data validation, ensuring the highest level of accuracy and reliability in our reports.


Procure Comprehensive Study of

Global Fiber Optics Market

Online Only

  • Online Access
  • Read Only File
  • Validity 3 Months
  • Print, Copy, Paste & Download
  • PPT, Excel
  • Cost-Free Report in the Next Update
$3300
Buy Now

Single User

  • Access to One User on One System
  • Read Only File
  • Validity 6 Months
  • Limited Print,Copy, Paste
  • PPT, Excel
  • Cost-Free Report in the Next Update
$4200
Buy Now

Multi User

  • Access to Fiver Users
  • PDF File
  • Validity 1 Year
  • Upto FivePrints
  • Cost-Free Report in the Next Update
  • PPT, Excel
$6000
Buy Now

Enterprise User

  • Access to Unlimited Users
  • PDF, PPT, Excel
  • Unlimited Validity, Prints&Downloads
  • 1 Hour Cost-Free & Dedicated Analyst Support
  • 10% Cost-Free Customization
  • Cost-Free Report Update Twice in a Year
  • Recommendations for Business Strategies
  • Authorization to Quote TNR, The Niche Research
$7300
Buy Now

Library Access

  • Online Access to Content Publications
  • Access Player Profiles Online
  • Get Immediate Access to Newly Added Content
  • Acquire 12 PDF Downloads
  • Acquire 5 Excel Data Sets
  • Gain Access to 290+ PDFs of Company Profiles
  • Round-the-clock Email and Phone Assistance
  • Dashboard Usage and Trends
  • Renewal & Upgrade Assistance
  • Assessing Customization Options and Alerts for New Reports
$10788
Buy Now
*Taxes/Fees, if applicable will be added during checkout. All prices in USD

Why TNR The Niche Research?

  • Unwavering Commitment to Excellence

  • Veteran Team of Researchers

  • Accurate and Timely Insights

  • Ethical Practices and Customized Service

  • Uninterrupted Availability Around the Clock

Scroll to Top