Global Fiber to the Home Market, By Product, By Service Provider, By Application, By Region & Segmental Insights Trends and Forecast, 2023 – 2031

  • Industry: Technology
  • Report ID: TNR-110-1027
  • Number of Pages: 420
  • Table/Charts : Yes
  • November, 2023
  • Base Year : 2024
  • No. of Companies : 11+
  • No. of Countries : 29
  • Views : 10208
  • Covid Impact Covered: Yes
  • War Impact Covered: Yes
  • Formats : PDF, Excel, PPT

Fiber to the Home is a high-speed internet connectivity technology that delivers data using optical fiber directly to residential buildings. It offers ultra-fast internet speeds, low latency, and reliable connections, enabling seamless streaming, gaming, and other online activities. Fiber to the Home enhances digital experiences for households by providing efficient and robust internet access. In terms of revenue, the global fiber to the home market was worth US$ 48.45 Bn in 2022, anticipated to witness CAGR of 10.7% during 2023 – 2031.

Global Fiber to the Home Market Revenue & Forecast, (US$ Million), 2015 – 2031


Trends in the Global Fiber to the Home Market

  • The demand for high-speed internet is continuously increasing as more people engage in bandwidth-intensive activities like online gaming, video streaming, and remote work. With the current trend of remote work arrangements and online education, there’s a pressing need for faster and more reliable internet connections, which Fiber to the Home technology is well-suited to provide. This heightened demand is driving the expansion of Fiber to the Home networks to meet the growing bandwidth requirements of households.
  • Telecommunications companies are actively modernizing their networks to support emerging technologies like 5G and IoT. Fiber to the Home plays a crucial role in this transformation, as it provides the necessary infrastructure for high-capacity data transfer and low-latency connections. This ongoing trend of digital transformation is fueling investments in fiber to the home market deployment to enable seamless connectivity and to stay competitive in the evolving telecommunications landscape.

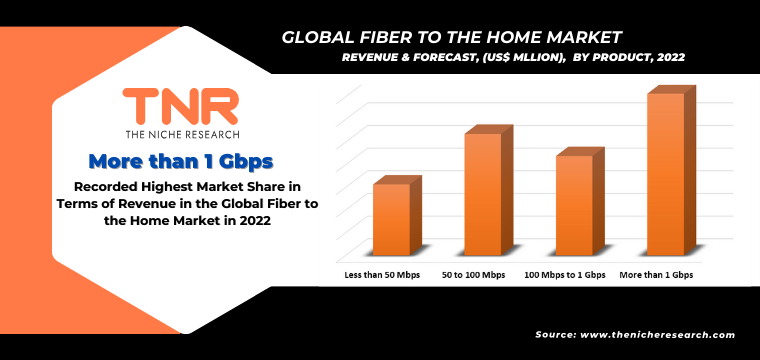
100 Mbps to 1 Gbps segment has gained popularity in recent years and is anticipated to be the fastest growing segment in the global fiber to the home market during the forecast period. While offering remarkable speed, it strikes a balance between cost and performance, making it an attractive choice for a wide range of users. This segment caters to the majority of residential and small business needs, encompassing activities like HD streaming, remote work, and online gaming. With a surge in remote work and digital content consumption, this segment is witnessing substantial growth. It meets the evolving connectivity demands of users, positioning itself as a popular and adaptable choice in the Fiber to the Home market.

Telecom Operators, among service providers, had the highest share in the global fiber to the home market in 2022. The dominance is driven by its extensive infrastructure, experience, and established customer base. Major telecom operators possess the resources to invest in and deploy Fiber to the Home networks on a large scale. For example, as of 2021, AT&T had over 14.5 million Fiber to the Home customers in the US. Telecom giants also offer bundled services, including internet, TV, and phone, attracting a broad customer demographic. Their ability to reach urban and remote areas, coupled with a reputation for reliability, solidifies their leadership in delivering high-speed fiber-optic connectivity to homes worldwide.

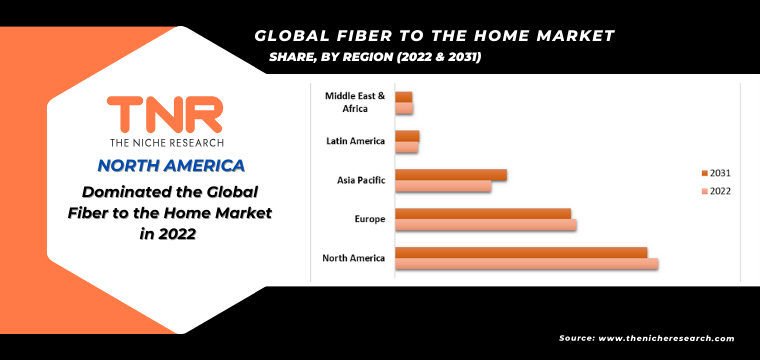
Among regions, Middle East and Africa is expected to witness the highest growth rate in the fiber to the home market during the forecast period. This growth is driven by the increasing demand for high-speed internet access due to digital transformation efforts, rising urbanization, and expanding economies in the region. Countries like the United Arab Emirates and South Africa are witnessing significant Fiber to the Home deployment. Moreover, governments are actively investing in broadband infrastructure, aiming to bridge the digital divide. As the Middle East and Africa embrace online education, e-commerce, and digital services, the demand for fast, reliable connectivity continues to surge, making Fiber to the Home the preferred choice for broadband access.

Competitive Landscape

Some of the players operating in the fiber to the home market are

  • AT&T Intellectual Property
  • CenturyLink
  • CSC Holdings, LLC
  • Etisalat
  • Frontier Communications Parent, Inc.
  • Singtel
  • SoftBank Corp
  • Verizon
  • Windstream Intellectual Property Services, LLC
  • Ziply Fiber
  • Other Industry Participants

Global Fiber to the Home Market Snapshot

Report Specifications Details
Market Revenue in 2022 US$ 48.45 Bn
Market Size Forecast by 2031 US$ 89.34 Bn
Growth Rate (CAGR) 10.7%
Historic Data 2015 – 2021
Base Year for Estimation 2022
Forecast Period 2023 – 2031
Report Inclusions Market Size & Estimates, Market Dynamics, Competitive Scenario, Trends, Growth Factors, Market Determinants, Key Investment Segmentation, Product/Service/Solutions Benchmarking
Segments Covered By Product, By Service Provider, By Application
Regions Covered North America, Europe, Asia Pacific, Middle East & Africa, Latin America
Countries Covered U.S., Canada, Mexico, Rest of North America,  France, The UK, Spain, Germany, Italy, Nordic Countries (Denmark, Finland, Iceland, Sweden, Norway), Benelux Union (Belgium, The Netherlands, Luxembourg), Rest of Europe,  China, Japan, India, New Zealand, Australia, South Korea, Southeast Asia (Indonesia, Thailand, Malaysia, Singapore, Rest of Southeast Asia), Rest of Asia Pacific,  Saudi Arabia, UAE, Egypt, Kuwait, South Africa, Rest of Middle East & Africa,  Brazil, Argentina, Rest of Latin America
Key Players AT&T Intellectual Property, CenturyLink, CSC Holdings, LLC, Etisalat, Frontier Communications Parent, Inc., Singtel, SoftBank Corp, Verizon, Windstream Intellectual Property Services, LLC, Ziply Fiber, Other Industry Participants
Customization Scope Customization allows for the inclusion/modification of content pertaining to geographical regions, countries, and specific market segments.
Pricing & Procurement Options Explore purchase options tailored to your specific research requirements
Contact Details Consult With Our Expert

Japan (Toll-Free):  +81 663-386-8111

South Korea (Toll-Free):  +82-808- 703-126

Saudi Arabia (Toll-Free):  +966 800-850-1643

United Kingdom: +44 753-710-5080

United States: +1 302-232-5106

E-mail:  askanexpert@thenicheresearch.com


Global Fiber to the Home Market

By Product

  • Less than 50 Mbps
  • 50 to 100 Mbps
  • 100 Mbps to 1 Gbps
  • More than 1 Gbps

By Service Provider

  • Telecom Operators
  • Internet Service Providers
  • Cable Operators
  • Other Broadband service providers

By Application

  • Internet TV
  • VoIP
  • Interactive Gaming
  • Smart Home Application
  • Virtual Private LAN Service
  • Remote Education
  • VPN on Broadband

By Region

  • North America (U.S., Canada, Mexico, Rest of North America)
  • Europe (France, The UK, Spain, Germany, Italy, Nordic Countries (Denmark, Finland, Iceland, Sweden, Norway), Benelux Union (Belgium, The Netherlands, Luxembourg), Rest of Europe)
  • Asia Pacific (China, Japan, India, New Zealand, Australia, South Korea, Southeast Asia (Indonesia, Thailand, Malaysia, Singapore, Rest of Southeast Asia), Rest of Asia Pacific)
  • Middle East & Africa (Saudi Arabia, UAE, Egypt, Kuwait, South Africa, Rest of Middle East & Africa)
  • Latin America (Brazil, Argentina, Rest of Latin America)

Report Coverage & Deliverables 

.

Table of Contents

.

1.Market Scope
1.1.Market Segmentation
1.2.Years Considered
1.2.1.Historic Years: 2015 – 2021
1.2.2.Base Year: 2022
1.2.3.Forecast Years: 2023 – 2031
2.Key Target Audiences
3.Research Methodology
3.1.Primary Research
3.1.1.Research Questionnaire
3.1.2.Global Percentage Breakdown
3.1.3.Primary Interviews: Key Opinion Leaders (KOLs)
3.2.Secondary Research
3.2.1.Paid Databases
3.2.2.Secondary Sources
3.3.Market Size Estimates
3.3.1.Top-Down Approach
3.3.2.Bottom-Up Approach
3.4.Data Triangulation Methodology
3.5.Research Assumptions
4.Recommendations and Insights from TNR’s Perspective**
5.Holistic Overview of Fiber to the Home Market
6.Market Synopsis: Fiber to the Home Market
7.Fiber to the Home Market Analysis: Qualitative Perspective
7.1.Introduction
7.1.1.Product Definition
7.1.2.Industry Development
7.2.Market Dynamics
7.2.1.Drivers
7.2.2.Restraints
7.2.3.Opportunities
7.2.4.Challenges
7.3.Trends in Fiber to the Home Market
7.4.Market Determinants Radar Chart
7.5.Macro-Economic and Micro-Economic Indicators: Fiber to the Home Market
7.6.Porter’s Five Force Analysis
7.7.Impact of Covid-19 on Fiber to the Home Market
8.Global Fiber to the Home Market Analysis and Forecasts, 2023 – 2031
8.1.Overview
8.1.1.Global Fiber to the Home Market Revenue (US$ Mn)
8.2.Global Fiber to the Home Market Revenue (US$ Mn) and Forecasts, By Product
8.2.1.Less than 50 Mbps
8.2.1.1.Definition
8.2.1.2.Market Estimation and Penetration, 2015 – 2022
8.2.1.3.Market Forecast, 2023 – 2031
8.2.1.4.Compound Annual Growth Rate (CAGR)
8.2.1.5.Regional Bifurcation
8.2.1.5.1.North America
8.2.1.5.1.1.Market Estimation, 2015 – 2022
8.2.1.5.1.2.Market Forecast, 2023 – 2031
8.2.1.5.2.Europe
8.2.1.5.2.1.Market Estimation, 2015 – 2022
8.2.1.5.2.2.Market Forecast, 2023 – 2031
8.2.1.5.3.Asia Pacific
8.2.1.5.3.1.Market Estimation, 2015 – 2022
8.2.1.5.3.2.Market Forecast, 2023 – 2031
8.2.1.5.4.Middle East and Africa
8.2.1.5.4.1.Market Estimation, 2015 – 2022
8.2.1.5.4.2.Market Forecast, 2023 – 2031
8.2.1.5.5.Latin America
8.2.1.5.5.1.Market Estimation, 2015 – 2022
8.2.1.5.5.2.Market Forecast, 2023 – 2031
8.2.2.50 to 100 Mbps
8.2.2.1.Definition
8.2.2.2.Market Estimation and Penetration, 2015 – 2022
8.2.2.3.Market Forecast, 2023 – 2031
8.2.2.4.Compound Annual Growth Rate (CAGR)
8.2.2.5.Regional Bifurcation
8.2.2.5.1.North America
8.2.2.5.1.1.Market Estimation, 2015 – 2022
8.2.2.5.1.2.Market Forecast, 2023 – 2031
8.2.2.5.2.Europe
8.2.2.5.2.1.Market Estimation, 2015 – 2022
8.2.2.5.2.2.Market Forecast, 2023 – 2031
8.2.2.5.3.Asia Pacific
8.2.2.5.3.1.Market Estimation, 2015 – 2022
8.2.2.5.3.2.Market Forecast, 2023 – 2031
8.2.2.5.4.Middle East and Africa
8.2.2.5.4.1.Market Estimation, 2015 – 2022
8.2.2.5.4.2.Market Forecast, 2023 – 2031
8.2.2.5.5.Latin America
8.2.2.5.5.1.Market Estimation, 2015 – 2022
8.2.2.5.5.2.Market Forecast, 2023 – 2031
8.2.3.100 Mbps to 1 Gbps
8.2.3.1.Definition
8.2.3.2.Market Estimation and Penetration, 2015 – 2022
8.2.3.3.Market Forecast, 2023 – 2031
8.2.3.4.Compound Annual Growth Rate (CAGR)
8.2.3.5.Regional Bifurcation
8.2.3.5.1.North America
8.2.3.5.1.1.Market Estimation, 2015 – 2022
8.2.3.5.1.2.Market Forecast, 2023 – 2031
8.2.3.5.2.Europe
8.2.3.5.2.1.Market Estimation, 2015 – 2022
8.2.3.5.2.2.Market Forecast, 2023 – 2031
8.2.3.5.3.Asia Pacific
8.2.3.5.3.1.Market Estimation, 2015 – 2022
8.2.3.5.3.2.Market Forecast, 2023 – 2031
8.2.3.5.4.Middle East and Africa
8.2.3.5.4.1.Market Estimation, 2015 – 2022
8.2.3.5.4.2.Market Forecast, 2023 – 2031
8.2.3.5.5.Latin America
8.2.3.5.5.1.Market Estimation, 2015 – 2022
8.2.3.5.5.2.Market Forecast, 2023 – 2031
8.2.4.More than 1 Gbps
8.2.4.1.Definition
8.2.4.2.Market Estimation and Penetration, 2015 – 2022
8.2.4.3.Market Forecast, 2023 – 2031
8.2.4.4.Compound Annual Growth Rate (CAGR)
8.2.4.5.Regional Bifurcation
8.2.4.5.1.North America
8.2.4.5.1.1.Market Estimation, 2015 – 2022
8.2.4.5.1.2.Market Forecast, 2023 – 2031
8.2.4.5.2.Europe
8.2.4.5.2.1.Market Estimation, 2015 – 2022
8.2.4.5.2.2.Market Forecast, 2023 – 2031
8.2.4.5.3.Asia Pacific
8.2.4.5.3.1.Market Estimation, 2015 – 2022
8.2.4.5.3.2.Market Forecast, 2023 – 2031
8.2.4.5.4.Middle East and Africa
8.2.4.5.4.1.Market Estimation, 2015 – 2022
8.2.4.5.4.2.Market Forecast, 2023 – 2031
8.2.4.5.5.Latin America
8.2.4.5.5.1.Market Estimation, 2015 – 2022
8.2.4.5.5.2.Market Forecast, 2023 – 2031
8.3.Key Segment for Channeling Investments
8.3.1.By Product
9.Global Fiber to the Home Market Analysis and Forecasts, 2023 – 2031
9.1.Overview
9.2.Global Fiber to the Home Market Revenue (US$ Mn) and Forecasts, By Service Provider
9.2.1.Telecom Operators
9.2.1.1.Definition
9.2.1.2.Market Estimation and Penetration, 2015 – 2022
9.2.1.3.Market Forecast, 2023 – 2031
9.2.1.4.Compound Annual Growth Rate (CAGR)
9.2.1.5.Regional Bifurcation
9.2.1.5.1.North America
9.2.1.5.1.1.Market Estimation, 2015 – 2022
9.2.1.5.1.2.Market Forecast, 2023 – 2031
9.2.1.5.2.Europe
9.2.1.5.2.1.Market Estimation, 2015 – 2022
9.2.1.5.2.2.Market Forecast, 2023 – 2031
9.2.1.5.3.Asia Pacific
9.2.1.5.3.1.Market Estimation, 2015 – 2022
9.2.1.5.3.2.Market Forecast, 2023 – 2031
9.2.1.5.4.Middle East and Africa
9.2.1.5.4.1.Market Estimation, 2015 – 2022
9.2.1.5.4.2.Market Forecast, 2023 – 2031
9.2.1.5.5.Latin America
9.2.1.5.5.1.Market Estimation, 2015 – 2022
9.2.1.5.5.2.Market Forecast, 2023 – 2031
9.2.2.Internet Service Provider
9.2.2.1.Definition
9.2.2.2.Market Estimation and Penetration, 2015 – 2022
9.2.2.3.Market Forecast, 2023 – 2031
9.2.2.4.Compound Annual Growth Rate (CAGR)
9.2.2.5.Regional Bifurcation
9.2.2.5.1.North America
9.2.2.5.1.1.Market Estimation, 2015 – 2022
9.2.2.5.1.2.Market Forecast, 2023 – 2031
9.2.2.5.2.Europe
9.2.2.5.2.1.Market Estimation, 2015 – 2022
9.2.2.5.2.2.Market Forecast, 2023 – 2031
9.2.2.5.3.Asia Pacific
9.2.2.5.3.1.Market Estimation, 2015 – 2022
9.2.2.5.3.2.Market Forecast, 2023 – 2031
9.2.2.5.4.Middle East and Africa
9.2.2.5.4.1.Market Estimation, 2015 – 2022
9.2.2.5.4.2.Market Forecast, 2023 – 2031
9.2.2.5.5.Latin America
9.2.2.5.5.1.Market Estimation, 2015 – 2022
9.2.2.5.5.2.Market Forecast, 2023 – 2031
9.2.3.Cable Operators
9.2.3.1.Definition
9.2.3.2.Market Estimation and Penetration, 2015 – 2022
9.2.3.3.Market Forecast, 2023 – 2031
9.2.3.4.Compound Annual Growth Rate (CAGR)
9.2.3.5.Regional Bifurcation
9.2.3.5.1.North America
9.2.3.5.1.1.Market Estimation, 2015 – 2022
9.2.3.5.1.2.Market Forecast, 2023 – 2031
9.2.3.5.2.Europe
9.2.3.5.2.1.Market Estimation, 2015 – 2022
9.2.3.5.2.2.Market Forecast, 2023 – 2031
9.2.3.5.3.Asia Pacific
9.2.3.5.3.1.Market Estimation, 2015 – 2022
9.2.3.5.3.2.Market Forecast, 2023 – 2031
9.2.3.5.4.Middle East and Africa
9.2.3.5.4.1.Market Estimation, 2015 – 2022
9.2.3.5.4.2.Market Forecast, 2023 – 2031
9.2.3.5.5.Latin America
9.2.3.5.5.1.Market Estimation, 2015 – 2022
9.2.3.5.5.2.Market Forecast, 2023 – 2031
9.2.4.Other Broadband service providers
9.2.4.1.Definition
9.2.4.2.Market Estimation and Penetration, 2015 – 2022
9.2.4.3.Market Forecast, 2023 – 2031
9.2.4.4.Compound Annual Growth Rate (CAGR)
9.2.4.5.Regional Bifurcation
9.2.4.5.1.North America
9.2.4.5.1.1.Market Estimation, 2015 – 2022
9.2.4.5.1.2.Market Forecast, 2023 – 2031
9.2.4.5.2.Europe
9.2.4.5.2.1.Market Estimation, 2015 – 2022
9.2.4.5.2.2.Market Forecast, 2023 – 2031
9.2.4.5.3.Asia Pacific
9.2.4.5.3.1.Market Estimation, 2015 – 2022
9.2.4.5.3.2.Market Forecast, 2023 – 2031
9.2.4.5.4.Middle East and Africa
9.2.4.5.4.1.Market Estimation, 2015 – 2022
9.2.4.5.4.2.Market Forecast, 2023 – 2031
9.2.4.5.5.Latin America
9.2.4.5.5.1.Market Estimation, 2015 – 2022
9.2.4.5.5.2.Market Forecast, 2023 – 2031
9.3.Key Segment for Channeling Investments
9.3.1.By Service Provider
10.Global Fiber to the Home Market Analysis and Forecasts, 2023 – 2031
10.1.Overview
10.2.Global Fiber to the Home Market Revenue (US$ Mn) and Forecasts, By Application
10.2.1.Internet TV
10.2.1.1.Definition
10.2.1.2.Market Estimation and Penetration, 2015 – 2022
10.2.1.3.Market Forecast, 2023 – 2031
10.2.1.4.Compound Annual Growth Rate (CAGR)
10.2.1.5.Regional Bifurcation
10.2.1.5.1.North America
10.2.1.5.1.1.Market Estimation, 2015 – 2022
10.2.1.5.1.2.Market Forecast, 2023 – 2031
10.2.1.5.2.Europe
10.2.1.5.2.1.Market Estimation, 2015 – 2022
10.2.1.5.2.2.Market Forecast, 2023 – 2031
10.2.1.5.3.Asia Pacific
10.2.1.5.3.1.Market Estimation, 2015 – 2022
10.2.1.5.3.2.Market Forecast, 2023 – 2031
10.2.1.5.4.Middle East and Africa
10.2.1.5.4.1.Market Estimation, 2015 – 2022
10.2.1.5.4.2.Market Forecast, 2023 – 2031
10.2.1.5.5.Latin America
10.2.1.5.5.1.Market Estimation, 2015 – 2022
10.2.1.5.5.2.Market Forecast, 2023 – 2031
10.2.2.VoIP
10.2.2.1.Definition
10.2.2.2.Market Estimation and Penetration, 2015 – 2022
10.2.2.3.Market Forecast, 2023 – 2031
10.2.2.4.Compound Annual Growth Rate (CAGR)
10.2.2.5.Regional Bifurcation
10.2.2.5.1.North America
10.2.2.5.1.1.Market Estimation, 2015 – 2022
10.2.2.5.1.2.Market Forecast, 2023 – 2031
10.2.2.5.2.Europe
10.2.2.5.2.1.Market Estimation, 2015 – 2022
10.2.2.5.2.2.Market Forecast, 2023 – 2031
10.2.2.5.3.Asia Pacific
10.2.2.5.3.1.Market Estimation, 2015 – 2022
10.2.2.5.3.2.Market Forecast, 2023 – 2031
10.2.2.5.4.Middle East and Africa
10.2.2.5.4.1.Market Estimation, 2015 – 2022
10.2.2.5.4.2.Market Forecast, 2023 – 2031
10.2.2.5.5.Latin America
10.2.2.5.5.1.Market Estimation, 2015 – 2022
10.2.2.5.5.2.Market Forecast, 2023 – 2031
10.2.3.Interactive Gaming
10.2.3.1.Definition
10.2.3.2.Market Estimation and Penetration, 2015 – 2022
10.2.3.3.Market Forecast, 2023 – 2031
10.2.3.4.Compound Annual Growth Rate (CAGR)
10.2.3.5.Regional Bifurcation
10.2.3.5.1.North America
10.2.3.5.1.1.Market Estimation, 2015 – 2022
10.2.3.5.1.2.Market Forecast, 2023 – 2031
10.2.3.5.2.Europe
10.2.3.5.2.1.Market Estimation, 2015 – 2022
10.2.3.5.2.2.Market Forecast, 2023 – 2031
10.2.3.5.3.Asia Pacific
10.2.3.5.3.1.Market Estimation, 2015 – 2022
10.2.3.5.3.2.Market Forecast, 2023 – 2031
10.2.3.5.4.Middle East and Africa
10.2.3.5.4.1.Market Estimation, 2015 – 2022
10.2.3.5.4.2.Market Forecast, 2023 – 2031
10.2.3.5.5.Latin America
10.2.3.5.5.1.Market Estimation, 2015 – 2022
10.2.3.5.5.2.Market Forecast, 2023 – 2031
10.2.4.Smart Home Application
10.2.4.1.Definition
10.2.4.2.Market Estimation and Penetration, 2015 – 2022
10.2.4.3.Market Forecast, 2023 – 2031
10.2.4.4.Compound Annual Growth Rate (CAGR)
10.2.4.5.Regional Bifurcation
10.2.4.5.1.North America
10.2.4.5.1.1.Market Estimation, 2015 – 2022
10.2.4.5.1.2.Market Forecast, 2023 – 2031
10.2.4.5.2.Europe
10.2.4.5.2.1.Market Estimation, 2015 – 2022
10.2.4.5.2.2.Market Forecast, 2023 – 2031
10.2.4.5.3.Asia Pacific
10.2.4.5.3.1.Market Estimation, 2015 – 2022
10.2.4.5.3.2.Market Forecast, 2023 – 2031
10.2.4.5.4.Middle East and Africa
10.2.4.5.4.1.Market Estimation, 2015 – 2022
10.2.4.5.4.2.Market Forecast, 2023 – 2031
10.2.4.5.5.Latin America
10.2.4.5.5.1.Market Estimation, 2015 – 2022
10.2.4.5.5.2.Market Forecast, 2023 – 2031
10.2.5.Virtual Private LAN Service
10.2.5.1.Definition
10.2.5.2.Market Estimation and Penetration, 2015 – 2022
10.2.5.3.Market Forecast, 2023 – 2031
10.2.5.4.Compound Annual Growth Rate (CAGR)
10.2.5.5.Regional Bifurcation
10.2.5.5.1.North America
10.2.5.5.1.1.Market Estimation, 2015 – 2022
10.2.5.5.1.2.Market Forecast, 2023 – 2031
10.2.5.5.2.Europe
10.2.5.5.2.1.Market Estimation, 2015 – 2022
10.2.5.5.2.2.Market Forecast, 2023 – 2031
10.2.5.5.3.Asia Pacific
10.2.5.5.3.1.Market Estimation, 2015 – 2022
10.2.5.5.3.2.Market Forecast, 2023 – 2031
10.2.5.5.4.Middle East and Africa
10.2.5.5.4.1.Market Estimation, 2015 – 2022
10.2.5.5.4.2.Market Forecast, 2023 – 2031
10.2.5.5.5.Latin America
10.2.5.5.5.1.Market Estimation, 2015 – 2022
10.2.5.5.5.2.Market Forecast, 2023 – 2031
10.2.6.Remote Education
10.2.6.1.Definition
10.2.6.2.Market Estimation and Penetration, 2015 – 2022
10.2.6.3.Market Forecast, 2023 – 2031
10.2.6.4.Compound Annual Growth Rate (CAGR)
10.2.6.5.Regional Bifurcation
10.2.6.5.1.North America
10.2.6.5.1.1.Market Estimation, 2015 – 2022
10.2.6.5.1.2.Market Forecast, 2023 – 2031
10.2.6.5.2.Europe
10.2.6.5.2.1.Market Estimation, 2015 – 2022
10.2.6.5.2.2.Market Forecast, 2023 – 2031
10.2.6.5.3.Asia Pacific
10.2.6.5.3.1.Market Estimation, 2015 – 2022
10.2.6.5.3.2.Market Forecast, 2023 – 2031
10.2.6.5.4.Middle East and Africa
10.2.6.5.4.1.Market Estimation, 2015 – 2022
10.2.6.5.4.2.Market Forecast, 2023 – 2031
10.2.6.5.5.Latin America
10.2.6.5.5.1.Market Estimation, 2015 – 2022
10.2.6.5.5.2.Market Forecast, 2023 – 2031
10.2.7.VPN on Broadband
10.2.7.1.Definition
10.2.7.2.Market Estimation and Penetration, 2015 – 2022
10.2.7.3.Market Forecast, 2023 – 2031
10.2.7.4.Compound Annual Growth Rate (CAGR)
10.2.7.5.Regional Bifurcation
10.2.7.5.1.North America
10.2.7.5.1.1.Market Estimation, 2015 – 2022
10.2.7.5.1.2.Market Forecast, 2023 – 2031
10.2.7.5.2.Europe
10.2.7.5.2.1.Market Estimation, 2015 – 2022
10.2.7.5.2.2.Market Forecast, 2023 – 2031
10.2.7.5.3.Asia Pacific
10.2.7.5.3.1.Market Estimation, 2015 – 2022
10.2.7.5.3.2.Market Forecast, 2023 – 2031
10.2.7.5.4.Middle East and Africa
10.2.7.5.4.1.Market Estimation, 2015 – 2022
10.2.7.5.4.2.Market Forecast, 2023 – 2031
10.2.7.5.5.Latin America
10.2.7.5.5.1.Market Estimation, 2015 – 2022
10.2.7.5.5.2.Market Forecast, 2023 – 2031
10.3.Key Segment for Channeling Investments
10.3.1.By Application
11.North America Fiber to the Home Market Analysis and Forecasts, 2023 – 2031
11.1.Overview
11.1.1.North America Fiber to the Home Market Revenue (US$ Mn)
11.2.North America Fiber to the Home Market Revenue (US$ Mn) and Forecasts, By Product
11.2.1.Less than 50 Mbps
11.2.2.50 to 100 Mbps
11.2.3.100 Mbps to 1 Gbps
11.2.4.More than 1 Gbps
11.3.North America Fiber to the Home Market Revenue (US$ Mn) and Forecasts, By Service Provider
11.3.1.Telecom Operators
11.3.2.Internet Service Provider
11.3.3.Cable Operators
11.3.4.Other Broadband service providers
11.4.North America Fiber to the Home Market Revenue (US$ Mn) and Forecasts, By Application
11.4.1.Internet TV
11.4.2.VoIP
11.4.3.Interactive Gaming
11.4.4.Smart Home Application
11.4.5.Virtual Private LAN Service
11.4.6.Remote Education
11.4.7.VPN on Broadband
11.5.North America Fiber to the Home Market Revenue (US$ Mn) and Forecasts, By Country
11.5.1.U.S
11.5.1.1.U.S Fiber to the Home Market Revenue (US$ Mn) and Forecasts, By Product
11.5.1.1.1.Less than 50 Mbps
11.5.1.1.2.50 to 100 Mbps
11.5.1.1.3.100 Mbps to 1 Gbps
11.5.1.1.4.More than 1 Gbps
11.5.1.2.U.S Fiber to the Home Market Revenue (US$ Mn) and Forecasts, By Service Provider
11.5.1.2.1.Telecom Operators
11.5.1.2.2.Internet Service Provider
11.5.1.2.3.Cable Operators
11.5.1.2.4.Other Broadband service providers
11.5.1.3.U.S Fiber to the Home Market Revenue (US$ Mn) and Forecasts, By Application
11.5.1.3.1.Internet TV
11.5.1.3.2.VoIP
11.5.1.3.3.Interactive Gaming
11.5.1.3.4.Smart Home Application
11.5.1.3.5.Virtual Private LAN Service
11.5.1.3.6.Remote Education
11.5.1.3.7.VPN on Broadband
11.5.2.Canada
11.5.2.1.Canada Fiber to the Home Market Revenue (US$ Mn) and Forecasts, By Product
11.5.2.1.1.Less than 50 Mbps
11.5.2.1.2.50 to 100 Mbps
11.5.2.1.3.100 Mbps to 1 Gbps
11.5.2.1.4.More than 1 Gbps
11.5.2.2.Canada Fiber to the Home Market Revenue (US$ Mn) and Forecasts, By Service Provider
11.5.2.2.1.Telecom Operators
11.5.2.2.2.Internet Service Provider
11.5.2.2.3.Cable Operators
11.5.2.2.4.Other Broadband service providers
11.5.2.3.Canada Fiber to the Home Market Revenue (US$ Mn) and Forecasts, By Application
11.5.2.3.1.Internet TV
11.5.2.3.2.VoIP
11.5.2.3.3.Interactive Gaming
11.5.2.3.4.Smart Home Application
11.5.2.3.5.Virtual Private LAN Service
11.5.2.3.6.Remote Education
11.5.2.3.7.VPN on Broadband
11.5.3.Mexico
11.5.3.1.Mexico Fiber to the Home Market Revenue (US$ Mn) and Forecasts, By Product
11.5.3.1.1.Less than 50 Mbps
11.5.3.1.2.50 to 100 Mbps
11.5.3.1.3.100 Mbps to 1 Gbps
11.5.3.1.4.More than 1 Gbps
11.5.3.2.Mexico Fiber to the Home Market Revenue (US$ Mn) and Forecasts, By Service Provider
11.5.3.2.1.Telecom Operators
11.5.3.2.2.Internet Service Provider
11.5.3.2.3.Cable Operators
11.5.3.2.4.Other Broadband service providers
11.5.3.3.Mexico Fiber to the Home Market Revenue (US$ Mn) and Forecasts, By Application
11.5.3.3.1.Internet TV
11.5.3.3.2.VoIP
11.5.3.3.3.Interactive Gaming
11.5.3.3.4.Smart Home Application
11.5.3.3.5.Virtual Private LAN Service
11.5.3.3.6.Remote Education
11.5.3.3.7.VPN on Broadband
11.5.4.Rest of North America
11.5.4.1.Rest of North America Fiber to the Home Market Revenue (US$ Mn) and Forecasts, By Product
11.5.4.1.1.Less than 50 Mbps
11.5.4.1.2.50 to 100 Mbps
11.5.4.1.3.100 Mbps to 1 Gbps
11.5.4.1.4.More than 1 Gbps
11.5.4.2.Rest of North America Fiber to the Home Market Revenue (US$ Mn) and Forecasts, By Service Provider
11.5.4.2.1.Telecom Operators
11.5.4.2.2.Internet Service Provider
11.5.4.2.3.Cable Operators
11.5.4.2.4.Other Broadband service providers
11.5.4.3.Rest of North America Fiber to the Home Market Revenue (US$ Mn) and Forecasts, By Application
11.5.4.3.1.Internet TV
11.5.4.3.2.VoIP
11.5.4.3.3.Interactive Gaming
11.5.4.3.4.Smart Home Application
11.5.4.3.5.Virtual Private LAN Service
11.5.4.3.6.Remote Education
11.5.4.3.7.VPN on Broadband
11.6.Key Segment for Channeling Investments
11.6.1.By Country
11.6.2.By Product
11.6.3.By Service Provider
11.6.4.By Application
12.Europe Fiber to the Home Market Analysis and Forecasts, 2023 – 2031
12.1.Overview
12.1.1.Europe Fiber to the Home Market Revenue (US$ Mn)
12.2.Europe Fiber to the Home Market Revenue (US$ Mn) and Forecasts, By Product
12.2.1.Less than 50 Mbps
12.2.2.50 to 100 Mbps
12.2.3.100 Mbps to 1 Gbps
12.2.4.More than 1 Gbps
12.3.Europe Fiber to the Home Market Revenue (US$ Mn) and Forecasts, By Service Provider
12.3.1.Telecom Operators
12.3.2.Internet Service Provider
12.3.3.Cable Operators
12.3.4.Other Broadband service providers
12.4.Europe Fiber to the Home Market Revenue (US$ Mn) and Forecasts, By Application
12.4.1.Internet TV
12.4.2.VoIP
12.4.3.Interactive Gaming
12.4.4.Smart Home Application
12.4.5.Virtual Private LAN Service
12.4.6.Remote Education
12.4.7.VPN on Broadband
12.5.Europe Fiber to the Home Market Revenue (US$ Mn) and Forecasts, By Country
12.5.1.France
12.5.1.1.France Fiber to the Home Market Revenue (US$ Mn) and Forecasts, By Product
12.5.1.1.1.Less than 50 Mbps
12.5.1.1.2.50 to 100 Mbps
12.5.1.1.3.100 Mbps to 1 Gbps
12.5.1.1.4.More than 1 Gbps
12.5.1.2.France Fiber to the Home Market Revenue (US$ Mn) and Forecasts, By Service Provider
12.5.1.2.1.Telecom Operators
12.5.1.2.2.Internet Service Provider
12.5.1.2.3.Cable Operators
12.5.1.2.4.Other Broadband service providers
12.5.1.3.France Fiber to the Home Market Revenue (US$ Mn) and Forecasts, By Application
12.5.1.3.1.Internet TV
12.5.1.3.2.VoIP
12.5.1.3.3.Interactive Gaming
12.5.1.3.4.Smart Home Application
12.5.1.3.5.Virtual Private LAN Service
12.5.1.3.6.Remote Education
12.5.1.3.7.VPN on Broadband
12.5.2.The UK
12.5.2.1.The UK Fiber to the Home Market Revenue (US$ Mn) and Forecasts, By Product
12.5.2.1.1.Less than 50 Mbps
12.5.2.1.2.50 to 100 Mbps
12.5.2.1.3.100 Mbps to 1 Gbps
12.5.2.1.4.More than 1 Gbps
12.5.2.2.The UK Fiber to the Home Market Revenue (US$ Mn) and Forecasts, By Service Provider
12.5.2.2.1.Telecom Operators
12.5.2.2.2.Internet Service Provider
12.5.2.2.3.Cable Operators
12.5.2.2.4.Other Broadband service providers
12.5.2.3.The UK Fiber to the Home Market Revenue (US$ Mn) and Forecasts, By Application
12.5.2.3.1.Internet TV
12.5.2.3.2.VoIP
12.5.2.3.3.Interactive Gaming
12.5.2.3.4.Smart Home Application
12.5.2.3.5.Virtual Private LAN Service
12.5.2.3.6.Remote Education
12.5.2.3.7.VPN on Broadband
12.5.3.Spain
12.5.3.1.Spain Fiber to the Home Market Revenue (US$ Mn) and Forecasts, By Product
12.5.3.1.1.Less than 50 Mbps
12.5.3.1.2.50 to 100 Mbps
12.5.3.1.3.100 Mbps to 1 Gbps
12.5.3.1.4.More than 1 Gbps
12.5.3.2.Spain Fiber to the Home Market Revenue (US$ Mn) and Forecasts, By Service Provider
12.5.3.2.1.Telecom Operators
12.5.3.2.2.Internet Service Provider
12.5.3.2.3.Cable Operators
12.5.3.2.4.Other Broadband service providers
12.5.3.3.Spain Fiber to the Home Market Revenue (US$ Mn) and Forecasts, By Application
12.5.3.3.1.Internet TV
12.5.3.3.2.VoIP
12.5.3.3.3.Interactive Gaming
12.5.3.3.4.Smart Home Application
12.5.3.3.5.Virtual Private LAN Service
12.5.3.3.6.Remote Education
12.5.3.3.7.VPN on Broadband
12.5.4.Germany
12.5.4.1.Germany Fiber to the Home Market Revenue (US$ Mn) and Forecasts, By Product
12.5.4.1.1.Less than 50 Mbps
12.5.4.1.2.50 to 100 Mbps
12.5.4.1.3.100 Mbps to 1 Gbps
12.5.4.1.4.More than 1 Gbps
12.5.4.2.Germany Fiber to the Home Market Revenue (US$ Mn) and Forecasts, By Service Provider
12.5.4.2.1.Telecom Operators
12.5.4.2.2.Internet Service Provider
12.5.4.2.3.Cable Operators
12.5.4.2.4.Other Broadband service providers
12.5.4.3.Germany Fiber to the Home Market Revenue (US$ Mn) and Forecasts, By Application
12.5.4.3.1.Internet TV
12.5.4.3.2.VoIP
12.5.4.3.3.Interactive Gaming
12.5.4.3.4.Smart Home Application
12.5.4.3.5.Virtual Private LAN Service
12.5.4.3.6.Remote Education
12.5.4.3.7.VPN on Broadband
12.5.5.Italy
12.5.5.1.Italy Fiber to the Home Market Revenue (US$ Mn) and Forecasts, By Product
12.5.5.1.1.Less than 50 Mbps
12.5.5.1.2.50 to 100 Mbps
12.5.5.1.3.100 Mbps to 1 Gbps
12.5.5.1.4.More than 1 Gbps
12.5.5.2.Italy Fiber to the Home Market Revenue (US$ Mn) and Forecasts, By Service Provider
12.5.5.2.1.Telecom Operators
12.5.5.2.2.Internet Service Provider
12.5.5.2.3.Cable Operators
12.5.5.2.4.Other Broadband service providers
12.5.5.3.Italy Fiber to the Home Market Revenue (US$ Mn) and Forecasts, By Application
12.5.5.3.1.Internet TV
12.5.5.3.2.VoIP
12.5.5.3.3.Interactive Gaming
12.5.5.3.4.Smart Home Application
12.5.5.3.5.Virtual Private LAN Service
12.5.5.3.6.Remote Education
12.5.5.3.7.VPN on Broadband
12.5.6.Nordic Countries
12.5.6.1.Nordic Countries Fiber to the Home Market Revenue (US$ Mn) and Forecasts, By Product
12.5.6.1.1.Less than 50 Mbps
12.5.6.1.2.50 to 100 Mbps
12.5.6.1.3.100 Mbps to 1 Gbps
12.5.6.1.4.More than 1 Gbps
12.5.6.2.Nordic Countries Fiber to the Home Market Revenue (US$ Mn) and Forecasts, By Service Provider
12.5.6.2.1.Telecom Operators
12.5.6.2.2.Internet Service Provider
12.5.6.2.3.Cable Operators
12.5.6.2.4.Other Broadband service providers
12.5.6.3.Nordic Countries Fiber to the Home Market Revenue (US$ Mn) and Forecasts, By Application
12.5.6.3.1.Internet TV
12.5.6.3.2.VoIP
12.5.6.3.3.Interactive Gaming
12.5.6.3.4.Smart Home Application
12.5.6.3.5.Virtual Private LAN Service
12.5.6.3.6.Remote Education
12.5.6.3.7.VPN on Broadband
12.5.6.4.Nordic Countries Fiber to the Home Market Revenue (US$ Mn) and Forecasts, By Country
12.5.6.4.1.Denmark
12.5.6.4.2.Finland
12.5.6.4.3.Iceland
12.5.6.4.4.Sweden
12.5.6.4.5.Norway
12.5.7.Benelux Union
12.5.7.1.Benelux Union Fiber to the Home Market Revenue (US$ Mn) and Forecasts, By Product
12.5.7.1.1.Less than 50 Mbps
12.5.7.1.2.50 to 100 Mbps
12.5.7.1.3.100 Mbps to 1 Gbps
12.5.7.1.4.More than 1 Gbps
12.5.7.2.Benelux Union Fiber to the Home Market Revenue (US$ Mn) and Forecasts, By Service Provider
12.5.7.2.1.Telecom Operators
12.5.7.2.2.Internet Service Provider
12.5.7.2.3.Cable Operators
12.5.7.2.4.Other Broadband service providers
12.5.7.3.Benelux Union Fiber to the Home Market Revenue (US$ Mn) and Forecasts, By Application
12.5.7.3.1.Internet TV
12.5.7.3.2.VoIP
12.5.7.3.3.Interactive Gaming
12.5.7.3.4.Smart Home Application
12.5.7.3.5.Virtual Private LAN Service
12.5.7.3.6.Remote Education
12.5.7.3.7.VPN on Broadband
12.5.7.4.Benelux Union Fiber to the Home Market Revenue (US$ Mn) and Forecasts, By Country
12.5.7.4.1.Belgium
12.5.7.4.2.The Netherlands
12.5.7.4.3.Luxembourg
12.5.8.Rest of Europe
12.5.8.1.Rest of Europe Fiber to the Home Market Revenue (US$ Mn) and Forecasts, By Product
12.5.8.1.1.Less than 50 Mbps
12.5.8.1.2.50 to 100 Mbps
12.5.8.1.3.100 Mbps to 1 Gbps
12.5.8.1.4.More than 1 Gbps
12.5.8.2.Rest of Europe Fiber to the Home Market Revenue (US$ Mn) and Forecasts, By Service Provider
12.5.8.2.1.Telecom Operators
12.5.8.2.2.Internet Service Provider
12.5.8.2.3.Cable Operators
12.5.8.2.4.Other Broadband service providers
12.5.8.3.Rest of Europe Fiber to the Home Market Revenue (US$ Mn) and Forecasts, By Application
12.5.8.3.1.Internet TV
12.5.8.3.2.VoIP
12.5.8.3.3.Interactive Gaming
12.5.8.3.4.Smart Home Application
12.5.8.3.5.Virtual Private LAN Service
12.5.8.3.6.Remote Education
12.5.8.3.7.VPN on Broadband
12.6.Key Segment for Channeling Investments
12.6.1.By Country
12.6.2.By Product
12.6.3.By Service Provider
12.6.4.By Application
13.Asia Pacific Fiber to the Home Market Analysis and Forecasts, 2023 – 2031
13.1.Overview
13.1.1.Asia Pacific Fiber to the Home Market Revenue (US$ Mn)
13.2.Asia Pacific Fiber to the Home Market Revenue (US$ Mn) and Forecasts, By Product
13.2.1.Less than 50 Mbps
13.2.2.50 to 100 Mbps
13.2.3.100 Mbps to 1 Gbps
13.2.4.More than 1 Gbps
13.3.Asia Pacific Fiber to the Home Market Revenue (US$ Mn) and Forecasts, By Service Provider
13.3.1.Telecom Operators
13.3.2.Internet Service Provider
13.3.3.Cable Operators
13.3.4.Other Broadband service providers
13.4.Asia Pacific Fiber to the Home Market Revenue (US$ Mn) and Forecasts, By Application
13.4.1.Internet TV
13.4.2.VoIP
13.4.3.Interactive Gaming
13.4.4.Smart Home Application
13.4.5.Virtual Private LAN Service
13.4.6.Remote Education
13.4.7.VPN on Broadband
13.5.Asia Pacific Fiber to the Home Market Revenue (US$ Mn) and Forecasts, By Country
13.5.1.China
13.5.1.1.China Fiber to the Home Market Revenue (US$ Mn) and Forecasts, By Product
13.5.1.1.1.Less than 50 Mbps
13.5.1.1.2.50 to 100 Mbps
13.5.1.1.3.100 Mbps to 1 Gbps
13.5.1.1.4.More than 1 Gbps
13.5.1.2.China Fiber to the Home Market Revenue (US$ Mn) and Forecasts, By Service Provider
13.5.1.2.1.Telecom Operators
13.5.1.2.2.Internet Service Provider
13.5.1.2.3.Cable Operators
13.5.1.2.4.Other Broadband service providers
13.5.1.3.China Fiber to the Home Market Revenue (US$ Mn) and Forecasts, By Application
13.5.1.3.1.Internet TV
13.5.1.3.2.VoIP
13.5.1.3.3.Interactive Gaming
13.5.1.3.4.Smart Home Application
13.5.1.3.5.Virtual Private LAN Service
13.5.1.3.6.Remote Education
13.5.1.3.7.VPN on Broadband
13.5.2.Japan
13.5.2.1.Japan Fiber to the Home Market Revenue (US$ Mn) and Forecasts, By Product
13.5.2.1.1.Less than 50 Mbps
13.5.2.1.2.50 to 100 Mbps
13.5.2.1.3.100 Mbps to 1 Gbps
13.5.2.1.4.More than 1 Gbps
13.5.2.2.Japan Fiber to the Home Market Revenue (US$ Mn) and Forecasts, By Service Provider
13.5.2.2.1.Telecom Operators
13.5.2.2.2.Internet Service Provider
13.5.2.2.3.Cable Operators
13.5.2.2.4.Other Broadband service providers
13.5.2.3.Japan Fiber to the Home Market Revenue (US$ Mn) and Forecasts, By Application
13.5.2.3.1.Internet TV
13.5.2.3.2.VoIP
13.5.2.3.3.Interactive Gaming
13.5.2.3.4.Smart Home Application
13.5.2.3.5.Virtual Private LAN Service
13.5.2.3.6.Remote Education
13.5.2.3.7.VPN on Broadband
13.5.3.India
13.5.3.1.India Fiber to the Home Market Revenue (US$ Mn) and Forecasts, By Product
13.5.3.1.1.Less than 50 Mbps
13.5.3.1.2.50 to 100 Mbps
13.5.3.1.3.100 Mbps to 1 Gbps
13.5.3.1.4.More than 1 Gbps
13.5.3.2.India Fiber to the Home Market Revenue (US$ Mn) and Forecasts, By Service Provider
13.5.3.2.1.Telecom Operators
13.5.3.2.2.Internet Service Provider
13.5.3.2.3.Cable Operators
13.5.3.2.4.Other Broadband service providers
13.5.3.3.India Fiber to the Home Market Revenue (US$ Mn) and Forecasts, By Application
13.5.3.3.1.Internet TV
13.5.3.3.2.VoIP
13.5.3.3.3.Interactive Gaming
13.5.3.3.4.Smart Home Application
13.5.3.3.5.Virtual Private LAN Service
13.5.3.3.6.Remote Education
13.5.3.3.7.VPN on Broadband
13.5.4.New Zealand
13.5.4.1.New Zealand Fiber to the Home Market Revenue (US$ Mn) and Forecasts, By Product
13.5.4.1.1.Less than 50 Mbps
13.5.4.1.2.50 to 100 Mbps
13.5.4.1.3.100 Mbps to 1 Gbps
13.5.4.1.4.More than 1 Gbps
13.5.4.2.New Zealand Fiber to the Home Market Revenue (US$ Mn) and Forecasts, By Service Provider
13.5.4.2.1.Telecom Operators
13.5.4.2.2.Internet Service Provider
13.5.4.2.3.Cable Operators
13.5.4.2.4.Other Broadband service providers
13.5.4.3.New Zealand Fiber to the Home Market Revenue (US$ Mn) and Forecasts, By Application
13.5.4.3.1.Internet TV
13.5.4.3.2.VoIP
13.5.4.3.3.Interactive Gaming
13.5.4.3.4.Smart Home Application
13.5.4.3.5.Virtual Private LAN Service
13.5.4.3.6.Remote Education
13.5.4.3.7.VPN on Broadband
13.5.5.Australia
13.5.5.1.Australia Fiber to the Home Market Revenue (US$ Mn) and Forecasts, By Product
13.5.5.1.1.Less than 50 Mbps
13.5.5.1.2.50 to 100 Mbps
13.5.5.1.3.100 Mbps to 1 Gbps
13.5.5.1.4.More than 1 Gbps
13.5.5.2.Australia Fiber to the Home Market Revenue (US$ Mn) and Forecasts, By Service Provider
13.5.5.2.1.Telecom Operators
13.5.5.2.2.Internet Service Provider
13.5.5.2.3.Cable Operators
13.5.5.2.4.Other Broadband service providers
13.5.5.3.Australia Fiber to the Home Market Revenue (US$ Mn) and Forecasts, By Application
13.5.5.3.1.Internet TV
13.5.5.3.2.VoIP
13.5.5.3.3.Interactive Gaming
13.5.5.3.4.Smart Home Application
13.5.5.3.5.Virtual Private LAN Service
13.5.5.3.6.Remote Education
13.5.5.3.7.VPN on Broadband
13.5.6.South Korea
13.5.6.1.South Korea Fiber to the Home Market Revenue (US$ Mn) and Forecasts, By Product
13.5.6.1.1.Less than 50 Mbps
13.5.6.1.2.50 to 100 Mbps
13.5.6.1.3.100 Mbps to 1 Gbps
13.5.6.1.4.More than 1 Gbps
13.5.6.2.South Korea Fiber to the Home Market Revenue (US$ Mn) and Forecasts, By Service Provider
13.5.6.2.1.Telecom Operators
13.5.6.2.2.Internet Service Provider
13.5.6.2.3.Cable Operators
13.5.6.2.4.Other Broadband service providers
13.5.6.3.South Korea Fiber to the Home Market Revenue (US$ Mn) and Forecasts, By Application
13.5.6.3.1.Internet TV
13.5.6.3.2.VoIP
13.5.6.3.3.Interactive Gaming
13.5.6.3.4.Smart Home Application
13.5.6.3.5.Virtual Private LAN Service
13.5.6.3.6.Remote Education
13.5.6.3.7.VPN on Broadband
13.5.7.Southeast Asia
13.5.7.1.Southeast Asia Fiber to the Home Market Revenue (US$ Mn) and Forecasts, By Product
13.5.7.1.1.Less than 50 Mbps
13.5.7.1.2.50 to 100 Mbps
13.5.7.1.3.100 Mbps to 1 Gbps
13.5.7.1.4.More than 1 Gbps
13.5.7.2.Southeast Asia Fiber to the Home Market Revenue (US$ Mn) and Forecasts, By Service Provider
13.5.7.2.1.Telecom Operators
13.5.7.2.2.Internet Service Provider
13.5.7.2.3.Cable Operators
13.5.7.2.4.Other Broadband service providers
13.5.7.3.Southeast Asia Fiber to the Home Market Revenue (US$ Mn) and Forecasts, By Application
13.5.7.3.1.Internet TV
13.5.7.3.2.VoIP
13.5.7.3.3.Interactive Gaming
13.5.7.3.4.Smart Home Application
13.5.7.3.5.Virtual Private LAN Service
13.5.7.3.6.Remote Education
13.5.7.3.7.VPN on Broadband
13.5.7.4.Southeast Asia Fiber to the Home Market Revenue (US$ Mn) and Forecasts, By Country
13.5.7.4.1.Indonesia
13.5.7.4.2.Thailand
13.5.7.4.3.Malaysia
13.5.7.4.4.Singapore
13.5.7.4.5.Rest of Southeast Asia
13.5.8.Rest of Asia Pacific
13.5.8.1.Rest of Asia Pacific Fiber to the Home Market Revenue (US$ Mn) and Forecasts, By Product
13.5.8.1.1.Less than 50 Mbps
13.5.8.1.2.50 to 100 Mbps
13.5.8.1.3.100 Mbps to 1 Gbps
13.5.8.1.4.More than 1 Gbps
13.5.8.2.Rest of Asia Pacific Fiber to the Home Market Revenue (US$ Mn) and Forecasts, By Service Provider
13.5.8.2.1.Telecom Operators
13.5.8.2.2.Internet Service Provider
13.5.8.2.3.Cable Operators
13.5.8.2.4.Other Broadband service providers
13.5.8.3.Rest of Asia Pacific Fiber to the Home Market Revenue (US$ Mn) and Forecasts, By Application
13.5.8.3.1.Internet TV
13.5.8.3.2.VoIP
13.5.8.3.3.Interactive Gaming
13.5.8.3.4.Smart Home Application
13.5.8.3.5.Virtual Private LAN Service
13.5.8.3.6.Remote Education
13.5.8.3.7.VPN on Broadband
13.6.Key Segment for Channeling Investments
13.6.1.By Country
13.6.2.By Product
13.6.3.By Service Provider
13.6.4.By Application
14.Middle East and Africa Fiber to the Home Market Analysis and Forecasts, 2023 – 2031
14.1.Overview
14.1.1.Middle East and Africa Fiber to the Home Market Revenue (US$ Mn)
14.2.Middle East and Africa Fiber to the Home Market Revenue (US$ Mn) and Forecasts, By Product
14.2.1.Less than 50 Mbps
14.2.2.50 to 100 Mbps
14.2.3.100 Mbps to 1 Gbps
14.2.4.More than 1 Gbps
14.3.Middle East and Africa Fiber to the Home Market Revenue (US$ Mn) and Forecasts, By Service Provider
14.3.1.Telecom Operators
14.3.2.Internet Service Provider
14.3.3.Cable Operators
14.3.4.Other Broadband service providers
14.4.Middle East and Africa Fiber to the Home Market Revenue (US$ Mn) and Forecasts, By Application
14.4.1.Internet TV
14.4.2.VoIP
14.4.3.Interactive Gaming
14.4.4.Smart Home Application
14.4.5.Virtual Private LAN Service
14.4.6.Remote Education
14.4.7.VPN on Broadband
14.5.Middle East and Africa Fiber to the Home Market Revenue (US$ Mn) and Forecasts, By Country
14.5.1.Saudi Arabia
14.5.1.1.Saudi Arabia Fiber to the Home Market Revenue (US$ Mn) and Forecasts, By Product
14.5.1.1.1.Less than 50 Mbps
14.5.1.1.2.50 to 100 Mbps
14.5.1.1.3.100 Mbps to 1 Gbps
14.5.1.1.4.More than 1 Gbps
14.5.1.2.Saudi Arabia Fiber to the Home Market Revenue (US$ Mn) and Forecasts, By Service Provider
14.5.1.2.1.Telecom Operators
14.5.1.2.2.Internet Service Provider
14.5.1.2.3.Cable Operators
14.5.1.2.4.Other Broadband service providers
14.5.1.3.Saudi Arabia Fiber to the Home Market Revenue (US$ Mn) and Forecasts, By Application
14.5.1.3.1.Internet TV
14.5.1.3.2.VoIP
14.5.1.3.3.Interactive Gaming
14.5.1.3.4.Smart Home Application
14.5.1.3.5.Virtual Private LAN Service
14.5.1.3.6.Remote Education
14.5.1.3.7.VPN on Broadband
14.5.2.UAE
14.5.2.1.UAE Fiber to the Home Market Revenue (US$ Mn) and Forecasts, By Product
14.5.2.1.1.Less than 50 Mbps
14.5.2.1.2.50 to 100 Mbps
14.5.2.1.3.100 Mbps to 1 Gbps
14.5.2.1.4.More than 1 Gbps
14.5.2.2.UAE Fiber to the Home Market Revenue (US$ Mn) and Forecasts, By Service Provider
14.5.2.2.1.Telecom Operators
14.5.2.2.2.Internet Service Provider
14.5.2.2.3.Cable Operators
14.5.2.2.4.Other Broadband service providers
14.5.2.3.UAE Fiber to the Home Market Revenue (US$ Mn) and Forecasts, By Application
14.5.2.3.1.Internet TV
14.5.2.3.2.VoIP
14.5.2.3.3.Interactive Gaming
14.5.2.3.4.Smart Home Application
14.5.2.3.5.Virtual Private LAN Service
14.5.2.3.6.Remote Education
14.5.2.3.7.VPN on Broadband
14.5.3.Egypt
14.5.3.1.Egypt Fiber to the Home Market Revenue (US$ Mn) and Forecasts, By Product
14.5.3.1.1.Less than 50 Mbps
14.5.3.1.2.50 to 100 Mbps
14.5.3.1.3.100 Mbps to 1 Gbps
14.5.3.1.4.More than 1 Gbps
14.5.3.2.Egypt Fiber to the Home Market Revenue (US$ Mn) and Forecasts, By Service Provider
14.5.3.2.1.Telecom Operators
14.5.3.2.2.Internet Service Provider
14.5.3.2.3.Cable Operators
14.5.3.2.4.Other Broadband service providers
14.5.3.3.Egypt Fiber to the Home Market Revenue (US$ Mn) and Forecasts, By Application
14.5.3.3.1.Internet TV
14.5.3.3.2.VoIP
14.5.3.3.3.Interactive Gaming
14.5.3.3.4.Smart Home Application
14.5.3.3.5.Virtual Private LAN Service
14.5.3.3.6.Remote Education
14.5.3.3.7.VPN on Broadband
14.5.4.Kuwait
14.5.4.1.Kuwait Fiber to the Home Market Revenue (US$ Mn) and Forecasts, By Product
14.5.4.1.1.Less than 50 Mbps
14.5.4.1.2.50 to 100 Mbps
14.5.4.1.3.100 Mbps to 1 Gbps
14.5.4.1.4.More than 1 Gbps
14.5.4.2.Kuwait Fiber to the Home Market Revenue (US$ Mn) and Forecasts, By Service Provider
14.5.4.2.1.Telecom Operators
14.5.4.2.2.Internet Service Provider
14.5.4.2.3.Cable Operators
14.5.4.2.4.Other Broadband service providers
14.5.4.3.Kuwait Fiber to the Home Market Revenue (US$ Mn) and Forecasts, By Application
14.5.4.3.1.Internet TV
14.5.4.3.2.VoIP
14.5.4.3.3.Interactive Gaming
14.5.4.3.4.Smart Home Application
14.5.4.3.5.Virtual Private LAN Service
14.5.4.3.6.Remote Education
14.5.4.3.7.VPN on Broadband
14.5.5.South Africa
14.5.5.1.South Africa Fiber to the Home Market Revenue (US$ Mn) and Forecasts, By Product
14.5.5.1.1.Less than 50 Mbps
14.5.5.1.2.50 to 100 Mbps
14.5.5.1.3.100 Mbps to 1 Gbps
14.5.5.1.4.More than 1 Gbps
14.5.5.2.South Africa Fiber to the Home Market Revenue (US$ Mn) and Forecasts, By Service Provider
14.5.5.2.1.Telecom Operators
14.5.5.2.2.Internet Service Provider
14.5.5.2.3.Cable Operators
14.5.5.2.4.Other Broadband service providers
14.5.5.3.South Africa Fiber to the Home Market Revenue (US$ Mn) and Forecasts, By Application
14.5.5.3.1.Internet TV
14.5.5.3.2.VoIP
14.5.5.3.3.Interactive Gaming
14.5.5.3.4.Smart Home Application
14.5.5.3.5.Virtual Private LAN Service
14.5.5.3.6.Remote Education
14.5.5.3.7.VPN on Broadband
14.5.6.Rest of Middle East & Africa
14.5.6.1.Rest of Middle East & Africa Fiber to the Home Market Revenue (US$ Mn) and Forecasts, By Product
14.5.6.1.1.Less than 50 Mbps
14.5.6.1.2.50 to 100 Mbps
14.5.6.1.3.100 Mbps to 1 Gbps
14.5.6.1.4.More than 1 Gbps
14.5.6.2.Rest of Middle East & Africa Fiber to the Home Market Revenue (US$ Mn) and Forecasts, By Service Provider
14.5.6.2.1.Telecom Operators
14.5.6.2.2.Internet Service Provider
14.5.6.2.3.Cable Operators
14.5.6.2.4.Other Broadband service providers
14.5.6.3.Rest of Middle East & Africa Fiber to the Home Market Revenue (US$ Mn) and Forecasts, By Application
14.5.6.3.1.Internet TV
14.5.6.3.2.VoIP
14.5.6.3.3.Interactive Gaming
14.5.6.3.4.Smart Home Application
14.5.6.3.5.Virtual Private LAN Service
14.5.6.3.6.Remote Education
14.5.6.3.7.VPN on Broadband
14.6.Key Segment for Channeling Investments
14.6.1.By Country
14.6.2.By Product
14.6.3.By Service Provider
14.6.4.By Application
15.Latin America Fiber to the Home Market Analysis and Forecasts, 2023 – 2031
15.1.Overview
15.1.1.Latin America Fiber to the Home Market Revenue (US$ Mn)
15.2.Latin America Fiber to the Home Market Revenue (US$ Mn) and Forecasts, By Product
15.2.1.Less than 50 Mbps
15.2.2.50 to 100 Mbps
15.2.3.100 Mbps to 1 Gbps
15.2.4.More than 1 Gbps
15.3.Latin America Fiber to the Home Market Revenue (US$ Mn) and Forecasts, By Service Provider
15.3.1.Telecom Operators
15.3.2.Internet Service Provider
15.3.3.Cable Operators
15.3.4.Other Broadband service providers
15.4.Latin America Fiber to the Home Market Revenue (US$ Mn) and Forecasts, By Application
15.4.1.Internet TV
15.4.2.VoIP
15.4.3.Interactive Gaming
15.4.4.Smart Home Application
15.4.5.Virtual Private LAN Service
15.4.6.Remote Education
15.4.7.VPN on Broadband
15.5.Latin America Fiber to the Home Market Revenue (US$ Mn) and Forecasts, By Country
15.5.1.Brazil
15.5.1.1.Brazil Fiber to the Home Market Revenue (US$ Mn) and Forecasts, By Product
15.5.1.1.1.Less than 50 Mbps
15.5.1.1.2.50 to 100 Mbps
15.5.1.1.3.100 Mbps to 1 Gbps
15.5.1.1.4.More than 1 Gbps
15.5.1.2.Brazil Fiber to the Home Market Revenue (US$ Mn) and Forecasts, By Service Provider
15.5.1.2.1.Telecom Operators
15.5.1.2.2.Internet Service Provider
15.5.1.2.3.Cable Operators
15.5.1.2.4.Other Broadband service providers
15.5.1.3.Brazil Fiber to the Home Market Revenue (US$ Mn) and Forecasts, By Application
15.5.1.3.1.Internet TV
15.5.1.3.2.VoIP
15.5.1.3.3.Interactive Gaming
15.5.1.3.4.Smart Home Application
15.5.1.3.5.Virtual Private LAN Service
15.5.1.3.6.Remote Education
15.5.1.3.7.VPN on Broadband
15.5.2.Argentina
15.5.2.1.Argentina Fiber to the Home Market Revenue (US$ Mn) and Forecasts, By Product
15.5.2.1.1.Less than 50 Mbps
15.5.2.1.2.50 to 100 Mbps
15.5.2.1.3.100 Mbps to 1 Gbps
15.5.2.1.4.More than 1 Gbps
15.5.2.2.Argentina Fiber to the Home Market Revenue (US$ Mn) and Forecasts, By Service Provider
15.5.2.2.1.Telecom Operators
15.5.2.2.2.Internet Service Provider
15.5.2.2.3.Cable Operators
15.5.2.2.4.Other Broadband service providers
15.5.2.3.Argentina Fiber to the Home Market Revenue (US$ Mn) and Forecasts, By Application
15.5.2.3.1.Internet TV
15.5.2.3.2.VoIP
15.5.2.3.3.Interactive Gaming
15.5.2.3.4.Smart Home Application
15.5.2.3.5.Virtual Private LAN Service
15.5.2.3.6.Remote Education
15.5.2.3.7.VPN on Broadband
15.5.3.Rest of Latin America
15.5.3.1.Rest of Latin America Fiber to the Home Market Revenue (US$ Mn) and Forecasts, By Product
15.5.3.1.1.Less than 50 Mbps
15.5.3.1.2.50 to 100 Mbps
15.5.3.1.3.100 Mbps to 1 Gbps
15.5.3.1.4.More than 1 Gbps
15.5.3.2.Rest of Latin America Fiber to the Home Market Revenue (US$ Mn) and Forecasts, By Service Provider
15.5.3.2.1.Telecom Operators
15.5.3.2.2.Internet Service Provider
15.5.3.2.3.Cable Operators
15.5.3.2.4.Other Broadband service providers
15.5.3.3.Rest of Latin America Fiber to the Home Market Revenue (US$ Mn) and Forecasts, By Application
15.5.3.3.1.Internet TV
15.5.3.3.2.VoIP
15.5.3.3.3.Interactive Gaming
15.5.3.3.4.Smart Home Application
15.5.3.3.5.Virtual Private LAN Service
15.5.3.3.6.Remote Education
15.5.3.3.7.VPN on Broadband
15.6.Key Segment for Channeling Investments
15.6.1.By Country
15.6.2.By Product
15.6.3.By Service Provider
15.6.4.By Application
16.Competitive Benchmarking
16.1.Brand Benchmarking
16.2.Market Share Analysis, 2022
16.3.Global Presence and Growth Strategies
16.3.1.Mergers and Acquisitions
16.3.2.Product Launches
16.3.3.Investments Trends
16.3.4.R&D Initiatives
17.Player Profiles
17.1.ATaT Intellectual Property
17.1.1.Company Details
17.1.2.Company Overview
17.1.3.Product Offerings
17.1.4.Key Developments
17.1.5.Financial Analysis
17.1.6.SWOT Analysis
17.1.7.Business Strategies
17.2.Other Market Participants
18.Key Findings

.

**Exclusive for Multi-User and Enterprise User.

Global Fiber to the Home Market

By Product

 Less than 50 Mbps
 50 to 100 Mbps
 100 Mbps to 1 Gbps
 More than 1 Gbps

By Service Provider

 Telecom Operators
 Internet Service Providers
 Cable Operators
 Other Broadband service providers

By Application

 Internet TV
 VoIP
 Interactive Gaming
 Smart Home Application
 Virtual Private LAN Service
 Remote Education
 VPN on Broadband

By Region

 North America (U.S., Canada, Mexico, Rest of North America)
 Europe (France, The UK, Spain, Germany, Italy, Nordic Countries (Denmark, Finland, Iceland, Sweden, Norway), Benelux Union (Belgium, The Netherlands, Luxembourg), Rest of Europe)
 Asia Pacific (China, Japan, India, New Zealand, Australia, South Korea, Southeast Asia (Indonesia, Thailand, Malaysia, Singapore, Rest of Southeast Asia), Rest of Asia Pacific)
 Middle East & Africa (Saudi Arabia, UAE, Egypt, Kuwait, South Africa, Rest of Middle East & Africa)
 Latin America (Brazil, Argentina, Rest of Latin America)

Note: This ToC is tentative and can be changed according to the research study conducted during the course of report completion

**Exclusive for Multi-User and Enterprise User.

The Niche Research approach encompasses both primary and secondary research methods to provide comprehensive insights. While primary research is the cornerstone of our studies, we also incorporate secondary research sources such as company annual reports, premium industry databases, press releases, industry journals, and white papers.

Within our primary research, we actively engage with various industry stakeholders, conducting paid interviews and surveys. Our meticulous analysis extends to every market participant in major countries, allowing us to thoroughly examine their portfolios, calculate market shares, and segment revenues.

Our data collection primarily focuses on individual countries within our research scope, enabling us to estimate regional market sizes. Typically, we employ a bottom-up approach, meticulously tracking trends in different countries. We analyze growth drivers, constraints, technological innovations, and opportunities for each country, ultimately arriving at regional figures.Our process begins by examining the growth prospects of each country. Building upon these insights, we project growth and trends for the entire region. Finally, we utilize our proprietary model to refine estimations and forecasts.

Our data validation standards are integral to ensuring the reliability and accuracy of our research findings. Here’s a breakdown of our data validation processes and the stakeholders we engage with during our primary research:

  • Supply Side Analysis: We initiate a supply side analysis by directly contacting market participants, through telephonic interviews and questionnaires containing both open-ended and close-ended questions. We gather information on their portfolios, segment revenues, developments, and growth strategies.
  • Demand Side Analysis: To gain insights into adoption trends and consumer preferences, we reach out to target customers and users (non-vendors). This information forms a vital part of the qualitative analysis section of our reports, covering market dynamics, adoption trends, consumer behavior, spending patterns, and other related aspects.
  • Consultant Insights: We tap into the expertise of our partner consultants from around the world to obtain their unique viewpoints and perspectives. Their insights contribute to a well-rounded understanding of the markets under investigation.
  • In-House Validation: To ensure data accuracy and reliability, we conduct cross-validation of data points and information through our in-house team of consultants and utilize advanced data modeling tools for thorough verification.

The forecasts we provide are based on a comprehensive assessment of various factors, including:

  • Market Trends and Past Performance (Last Five Years): We accurately analyze market trends and performance data from preceding five years to identify historical patterns and understand the market’s evolution.
  • Historical Performance and Growth of Market Participants: We assess the historical performance and growth trajectories of key market participants. This analysis provides insights into the competitive landscape and individual company strategies.
  • Market Determinants Impact Analysis (Next Eight Years): We conduct a rigorous analysis of the factors that are projected to influence the market over the next eight years. This includes assessing both internal and external determinants that can shape market dynamics.
  • Drivers and Challenges for the Forecast Period:Identify the factors expected to drive market growth during the forecast period, as well as the challenges that the industry may face. This analysis aids in deriving an accurate growth rate projection.
  • New Acquisitions, Collaborations, or Partnerships: We keep a close watch on any new acquisitions, collaborations, or partnerships within the industry. These developments can have a significant impact on market dynamics and competitiveness.
  • Macro and Micro Factors Analysis:A thorough examination of both macro-level factors (e.g., economic trends, regulatory changes) and micro-level factors (e.g., technological advancements, consumer preferences) that may influence the market during the forecast period.
  • End-User Sentiment Analysis: To understand the market from the end-user perspective, we conduct sentiment analysis. This involves assessing the sentiment, preferences, and feedback of the end-users, which can provide valuable insights into market trends.
  • Perspective of Primary Participants: Insights gathered directly from primary research participants play a crucial role in shaping our forecasts. Their perspectives and experiences provide valuable qualitative data.
  • Year-on-Year Growth Trend: We utilize a year-on-year growth trend based on historical market growth and expected future trends. This helps in formulating our growth projections, aligning them with the market’s historical performance.

Research process adopted by TNR involves multiple stages, including data collection, validation, quality checks, and presentation. It’s crucial that the data and information we provide add value to your existing market understanding and expertise. We have also established partnerships with business consulting, research, and survey organizations across regions and globally to collaborate on regional analysis and data validation, ensuring the highest level of accuracy and reliability in our reports.


Procure Comprehensive Study of

Global Fiber to the Home Market

Online Only

  • Online Access
  • Read Only File
  • Validity 3 Months
  • Print, Copy, Paste & Download
  • PPT, Excel
  • Cost-Free Report in the Next Update
$3300
Buy Now

Single User

  • Access to One User on One System
  • Read Only File
  • Validity 6 Months
  • Limited Print,Copy, Paste
  • PPT, Excel
  • Cost-Free Report in the Next Update
$4200
Buy Now

Multi User

  • Access to Fiver Users
  • PDF File
  • Validity 1 Year
  • Upto FivePrints
  • Cost-Free Report in the Next Update
  • PPT, Excel
$6000
Buy Now

Enterprise User

  • Access to Unlimited Users
  • PDF, PPT, Excel
  • Unlimited Validity, Prints&Downloads
  • 1 Hour Cost-Free & Dedicated Analyst Support
  • 10% Cost-Free Customization
  • Cost-Free Report Update Twice in a Year
  • Recommendations for Business Strategies
  • Authorization to Quote TNR, The Niche Research
$7300
Buy Now

Library Access

  • Online Access to Content Publications
  • Access Player Profiles Online
  • Get Immediate Access to Newly Added Content
  • Acquire 12 PDF Downloads
  • Acquire 5 Excel Data Sets
  • Gain Access to 290+ PDFs of Company Profiles
  • Round-the-clock Email and Phone Assistance
  • Dashboard Usage and Trends
  • Renewal & Upgrade Assistance
  • Assessing Customization Options and Alerts for New Reports
$10788
Buy Now
*Taxes/Fees, if applicable will be added during checkout. All prices in USD

Why TNR The Niche Research?

  • Unwavering Commitment to Excellence

  • Veteran Team of Researchers

  • Accurate and Timely Insights

  • Ethical Practices and Customized Service

  • Uninterrupted Availability Around the Clock

Scroll to Top