Global High-frequency Power Amplifier Market is Expanding at a CAGR of ~9% over the Forecast Period (2023 – 2031)
A high-frequency power amplifier (HFPA) is an electronic device designed to amplify high-frequency signals while maintaining their power levels. It’s an essential component in various communication, broadcasting, and radar systems, as well as in scientific and industrial applications where precise and powerful signal amplification is needed at high frequencies. The primary purpose of a high-frequency power amplifier is to take a low-power input signal and increase its power level while preserving the signal’s characteristics. High-frequency power amplifiers operate in the radio frequency (RF) and microwave frequency range. This typically includes frequencies ranging from hundreds of megahertz (MHz) to several gigahertz (GHz), depending on the specific application.
Global High-frequency Power Amplifier Market Report Coverage and Deliverables
The high-frequency power amplifier market is versatile and caters to a wide range of applications across diverse industries. Each application area has unique requirements and demands, and HFPA plays a pivotal role in ensuring efficient signal amplification. A few of the applications covered are listed below:
- Wireless communication relies on high-frequency power amplifiers for transmitting and boosting signals across cellular networks, Wi-Fi routers, and other wireless systems. In base stations and access points, HFPA ensures that signals maintain strength and coverage, enabling seamless connectivity even in densely populated areas.
- Radar systems are crucial for navigation, surveillance, and weather monitoring. High-frequency power amplifiers amplify radar signals for accurate detection and transmission. These systems find applications in aviation, maritime, meteorology, and military scenarios.
- Satellite communication relies on HFPA to amplify signals for efficient transmission between satellites and ground stations. From broadcasting television signals to providing global internet coverage, HFPA is essential for reliable and widespread communication.
- Broadcasting requires reliable transmission of radio and television signals over long distances. High-frequency power amplifiers play a vital role in transmitting clear and strong signals to reach a broad audience.
- In medical imaging equipment such as MRI and CT scanners, HFPA enhances signal quality and accuracy. By amplifying the signals emitted and received during imaging procedures, HFPA contributes to producing detailed and precise medical images, which is boosting the growth of high-frequency power amplifier market across the medical imaging sector.
From ensuring seamless wireless connectivity to enabling scientific exploration, high-frequency power amplifier market plays an integral role in shaping modern technology across various industries.
North America is a hub for technological innovation. The region is at the forefront of developing advanced semiconductor materials and amplifier designs that enhance HFPA performance. The deployment of 5G networks is driving the demand for high-frequency power amplifier market to support higher data rates and connectivity required by 5G technology. The region’s robust aerospace and defense industry relies on HFPA for radar systems, satellite communication, and electronic warfare, contributing to the for high-frequency power amplifier market’s growth.
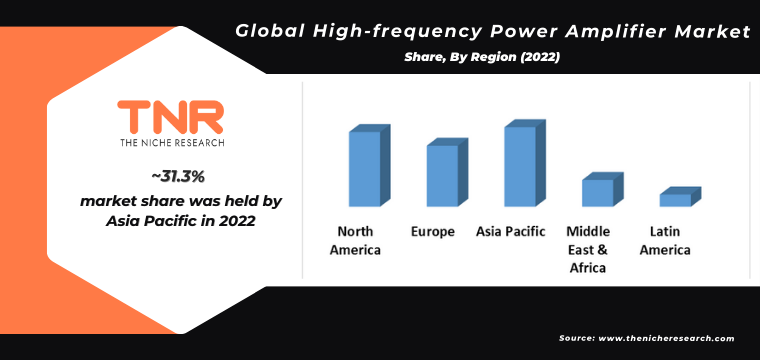
Asia Pacific on the other hand is a global manufacturing hub for electronics, including high-frequency power amplifiers, due to cost-effective production capabilities. The region’s large and diverse population drives the demand for improved wireless communication infrastructure, contributing to high-frequency power amplifier market growth. Countries like China and India are witnessing rapid economic growth, resulting in increased investments in various sectors that require HFPA technology.
Competitive Landscape
- AmpliTech, Inc.
- Keylink Microwave
- MACOM
- Nautel
- Ophir RF, Inc.
- Pasternack
- Qorvo, Inc
- Skyworks Solutions, Inc.
- Spectrum Control
- Other Industry Participants
Global High-frequency Power Amplifier Market Report Coverage
| Report Specifications |
Details |
| Growth Rate (CAGR) |
~9 % |
| Historic Data |
2015 – 2021 |
| Base Year for Estimation |
2022 |
| Forecast Period |
2023 – 2031 |
| Report Inclusions |
Market Size & Estimates, Market Dynamics, Competitive Scenario, Trends, Growth Factors, Market Determinants, Key Investment Segmentation, Product/Service/Solutions Benchmarking |
| Segments Covered |
By Application |
| Regions Covered |
North America, Europe, Asia Pacific, Middle East & Africa, Latin America |
| Countries Covered |
U.S., Canada, Mexico, Rest of North America, France, The UK, Spain, Germany, Italy, Nordic Countries (Denmark, Finland, Iceland, Sweden, Norway), Benelux Union (Belgium, The Netherlands, Luxembourg), Rest of Europe, China, Japan, India, New Zealand, Australia, South Korea, Southeast Asia (Indonesia, Thailand, Malaysia, Singapore, Rest of Southeast Asia), Rest of Asia Pacific, Saudi Arabia, UAE, Egypt, Kuwait, South Africa, Rest of Middle East & Africa, Brazil, Argentina, Rest of Latin America |
| Key Players |
AmpliTech, Inc., Keylink Microwave, MACOM, Nautel, Ophir RF, Inc., Pasternack, Qorvo, Inc, Skyworks Solutions, Inc., Spectrum Control, Other Industry Participants |
| Customization Scope |
Customization allows for the inclusion/modification of content pertaining to geographical regions, countries, and specific market segments. |
| Pricing & Procurement Options |
Explore purchase options tailored to your specific research requirements |
| Contact Details |
Consult With Our Expert
Japan (Toll-Free): – +81 663-386-8111
South Korea (Toll-Free): – +82-808- 703-126
Saudi Arabia (Toll-Free): – +966 800 850 1643
United States: +1 302-232-5106
United Kingdom: +447537105080
E-mail: askanexpert@thenicheresearch.com
|
Global High-frequency Power Amplifier Market
By Applications
- Wireless Communication
- Radar Systems
- Satellite Communication
- Radio and Television Broadcasting
- Medical Imaging
- Industrial Applications
- Test and Measurement
- Military and Defense
- Space Exploration
- Others
By Region
- North America (U.S., Canada, Mexico, Rest of North America)
- Europe (France, The UK, Spain, Germany, Italy, Nordic Countries (Denmark, Finland, Iceland, Sweden, Norway), Benelux Union (Belgium, The Netherlands, Luxembourg), Rest of Europe)
- Asia Pacific (China, Japan, India, New Zealand, Australia, South Korea, Southeast Asia (Indonesia, Thailand, Malaysia, Singapore, Rest of Southeast Asia), Rest of Asia Pacific)
- Middle East & Africa (Saudi Arabia, UAE, Egypt, Kuwait, South Africa, Rest of Middle East & Africa)
- Latin America (Brazil, Argentina, Rest of Latin America)
Table of Contents
.
1.Market Scope
1.2.Years Considered
1.2.1.Historic Years: 2015 – 2021
1.2.3.Forecast Years: 2023 – 2031
3.Research Methodology
3.1.Primary Research
3.1.1.Research Questionnaire
3.1.2.Global Percentage Breakdown
3.1.3.Primary Interviews: Key Opinion Leaders (KOLs)
3.3.Market Size Estimates
3.4.Data Triangulation Methodology
4.Recommendations and Insights from TNR’s Perspective**
5.Holistic Overview of High-frequency Power Amplifier Market
6.Market Synopsis: High-frequency Power Amplifier Market
7.High-frequency Power Amplifier Market Analysis: Qualitative Perspective
7.1.Introduction
7.1.2.Industry Development
7.3.Trends in High-frequency Power Amplifier Market
7.4.Market Determinants Radar Chart
7.5.Macro-Economic and Micro-Economic Indicators: High-frequency Power Amplifier Market
7.6.Industry Gross Margin Overview
7.7.Porter’s Five Force Analysis
8.Global High-frequency Power Amplifier Market Analysis and Forecasts, 2023 – 2031
8.1.Overview
8.1.1.Global High-frequency Power Amplifier Market Revenue (US$ Mn)
8.2.Global High-frequency Power Amplifier Market Revenue (US$ Mn) and Forecasts, By Applications
8.2.1.Wireless Communication
8.2.1.2.Market Estimation and Penetration, 2015 – 2022
8.2.1.3.Market Forecast, 2023 – 2031
8.2.1.4.Compound Annual Growth Rate (CAGR)
8.2.1.5.Regional Bifurcation
8.2.1.5.1.North America
8.2.1.5.1.1.Market Estimation, 2015 – 2022
8.2.1.5.1.2.Market Forecast, 2023 – 2031
8.2.1.5.2.Europe
8.2.1.5.2.1.Market Estimation, 2015 – 2022
8.2.1.5.2.2.Market Forecast, 2023 – 2031
8.2.1.5.3.Asia Pacific
8.2.1.5.3.1.Market Estimation, 2015 – 2022
8.2.1.5.3.2.Market Forecast, 2023 – 2031
8.2.1.5.4.Middle East and Africa
8.2.1.5.4.1.Market Estimation, 2015 – 2022
8.2.1.5.4.2.Market Forecast, 2023 – 2031
8.2.1.5.5.Latin America
8.2.1.5.5.1.Market Estimation, 2015 – 2022
8.2.1.5.5.2.Market Forecast, 2023 – 2031
8.2.2.Radar Systems
8.2.2.2.Market Estimation and Penetration, 2015 – 2022
8.2.2.3.Market Forecast, 2023 – 2031
8.2.2.4.Compound Annual Growth Rate (CAGR)
8.2.2.5.Regional Bifurcation
8.2.2.5.1.North America
8.2.2.5.1.1.Market Estimation, 2015 – 2022
8.2.2.5.1.2.Market Forecast, 2023 – 2031
8.2.2.5.2.Europe
8.2.2.5.2.1.Market Estimation, 2015 – 2022
8.2.2.5.2.2.Market Forecast, 2023 – 2031
8.2.2.5.3.Asia Pacific
8.2.2.5.3.1.Market Estimation, 2015 – 2022
8.2.2.5.3.2.Market Forecast, 2023 – 2031
8.2.2.5.4.Middle East and Africa
8.2.2.5.4.1.Market Estimation, 2015 – 2022
8.2.2.5.4.2.Market Forecast, 2023 – 2031
8.2.2.5.5.Latin America
8.2.2.5.5.1.Market Estimation, 2015 – 2022
8.2.2.5.5.2.Market Forecast, 2023 – 2031
8.2.3.Satellite Communication
8.2.3.2.Market Estimation and Penetration, 2015 – 2022
8.2.3.3.Market Forecast, 2023 – 2031
8.2.3.4.Compound Annual Growth Rate (CAGR)
8.2.3.5.Regional Bifurcation
8.2.3.5.1.North America
8.2.3.5.1.1.Market Estimation, 2015 – 2022
8.2.3.5.1.2.Market Forecast, 2023 – 2031
8.2.3.5.2.Europe
8.2.3.5.2.1.Market Estimation, 2015 – 2022
8.2.3.5.2.2.Market Forecast, 2023 – 2031
8.2.3.5.3.Asia Pacific
8.2.3.5.3.1.Market Estimation, 2015 – 2022
8.2.3.5.3.2.Market Forecast, 2023 – 2031
8.2.3.5.4.Middle East and Africa
8.2.3.5.4.1.Market Estimation, 2015 – 2022
8.2.3.5.4.2.Market Forecast, 2023 – 2031
8.2.3.5.5.Latin America
8.2.3.5.5.1.Market Estimation, 2015 – 2022
8.2.3.5.5.2.Market Forecast, 2023 – 2031
8.2.4.Radio and Television Broadcasting
8.2.4.2.Market Estimation and Penetration, 2015 – 2022
8.2.4.3.Market Forecast, 2023 – 2031
8.2.4.4.Compound Annual Growth Rate (CAGR)
8.2.4.5.Regional Bifurcation
8.2.4.5.1.North America
8.2.4.5.1.1.Market Estimation, 2015 – 2022
8.2.4.5.1.2.Market Forecast, 2023 – 2031
8.2.4.5.2.Europe
8.2.4.5.2.1.Market Estimation, 2015 – 2022
8.2.4.5.2.2.Market Forecast, 2023 – 2031
8.2.4.5.3.Asia Pacific
8.2.4.5.3.1.Market Estimation, 2015 – 2022
8.2.4.5.3.2.Market Forecast, 2023 – 2031
8.2.4.5.4.Middle East and Africa
8.2.4.5.4.1.Market Estimation, 2015 – 2022
8.2.4.5.4.2.Market Forecast, 2023 – 2031
8.2.4.5.5.Latin America
8.2.4.5.5.1.Market Estimation, 2015 – 2022
8.2.4.5.5.2.Market Forecast, 2023 – 2031
8.2.5.Medical Imaging
8.2.5.2.Market Estimation and Penetration, 2015 – 2022
8.2.5.3.Market Forecast, 2023 – 2031
8.2.5.4.Compound Annual Growth Rate (CAGR)
8.2.5.5.Regional Bifurcation
8.2.5.5.1.North America
8.2.5.5.1.1.Market Estimation, 2015 – 2022
8.2.5.5.1.2.Market Forecast, 2023 – 2031
8.2.5.5.2.Europe
8.2.5.5.2.1.Market Estimation, 2015 – 2022
8.2.5.5.2.2.Market Forecast, 2023 – 2031
8.2.5.5.3.Asia Pacific
8.2.5.5.3.1.Market Estimation, 2015 – 2022
8.2.5.5.3.2.Market Forecast, 2023 – 2031
8.2.5.5.4.Middle East and Africa
8.2.5.5.4.1.Market Estimation, 2015 – 2022
8.2.5.5.4.2.Market Forecast, 2023 – 2031
8.2.5.5.5.Latin America
8.2.5.5.5.1.Market Estimation, 2015 – 2022
8.2.5.5.5.2.Market Forecast, 2023 – 2031
8.2.6.Industrial Applications
8.2.6.2.Market Estimation and Penetration, 2015 – 2022
8.2.6.3.Market Forecast, 2023 – 2031
8.2.6.4.Compound Annual Growth Rate (CAGR)
8.2.6.5.Regional Bifurcation
8.2.6.5.1.North America
8.2.6.5.1.1.Market Estimation, 2015 – 2022
8.2.6.5.1.2.Market Forecast, 2023 – 2031
8.2.6.5.2.Europe
8.2.6.5.2.1.Market Estimation, 2015 – 2022
8.2.6.5.2.2.Market Forecast, 2023 – 2031
8.2.6.5.3.Asia Pacific
8.2.6.5.3.1.Market Estimation, 2015 – 2022
8.2.6.5.3.2.Market Forecast, 2023 – 2031
8.2.6.5.4.Middle East and Africa
8.2.6.5.4.1.Market Estimation, 2015 – 2022
8.2.6.5.4.2.Market Forecast, 2023 – 2031
8.2.6.5.5.Latin America
8.2.6.5.5.1.Market Estimation, 2015 – 2022
8.2.6.5.5.2.Market Forecast, 2023 – 2031
8.2.7.Test and Measurement
8.2.7.2.Market Estimation and Penetration, 2015 – 2022
8.2.7.3.Market Forecast, 2023 – 2031
8.2.7.4.Compound Annual Growth Rate (CAGR)
8.2.7.5.Regional Bifurcation
8.2.7.5.1.North America
8.2.7.5.1.1.Market Estimation, 2015 – 2022
8.2.7.5.1.2.Market Forecast, 2023 – 2031
8.2.7.5.2.Europe
8.2.7.5.2.1.Market Estimation, 2015 – 2022
8.2.7.5.2.2.Market Forecast, 2023 – 2031
8.2.7.5.3.Asia Pacific
8.2.7.5.3.1.Market Estimation, 2015 – 2022
8.2.7.5.3.2.Market Forecast, 2023 – 2031
8.2.7.5.4.Middle East and Africa
8.2.7.5.4.1.Market Estimation, 2015 – 2022
8.2.7.5.4.2.Market Forecast, 2023 – 2031
8.2.7.5.5.Latin America
8.2.7.5.5.1.Market Estimation, 2015 – 2022
8.2.7.5.5.2.Market Forecast, 2023 – 2031
8.2.8.Military and Defense
8.2.8.2.Market Estimation and Penetration, 2015 – 2022
8.2.8.3.Market Forecast, 2023 – 2031
8.2.8.4.Compound Annual Growth Rate (CAGR)
8.2.8.5.Regional Bifurcation
8.2.8.5.1.North America
8.2.8.5.1.1.Market Estimation, 2015 – 2022
8.2.8.5.1.2.Market Forecast, 2023 – 2031
8.2.8.5.2.Europe
8.2.8.5.2.1.Market Estimation, 2015 – 2022
8.2.8.5.2.2.Market Forecast, 2023 – 2031
8.2.8.5.3.Asia Pacific
8.2.8.5.3.1.Market Estimation, 2015 – 2022
8.2.8.5.3.2.Market Forecast, 2023 – 2031
8.2.8.5.4.Middle East and Africa
8.2.8.5.4.1.Market Estimation, 2015 – 2022
8.2.8.5.4.2.Market Forecast, 2023 – 2031
8.2.8.5.5.Latin America
8.2.8.5.5.1.Market Estimation, 2015 – 2022
8.2.8.5.5.2.Market Forecast, 2023 – 2031
8.2.9.Space Exploration
8.2.9.2.Market Estimation and Penetration, 2015 – 2022
8.2.9.3.Market Forecast, 2023 – 2031
8.2.9.4.Compound Annual Growth Rate (CAGR)
8.2.9.5.Regional Bifurcation
8.2.9.5.1.North America
8.2.9.5.1.1.Market Estimation, 2015 – 2022
8.2.9.5.1.2.Market Forecast, 2023 – 2031
8.2.9.5.2.Europe
8.2.9.5.2.1.Market Estimation, 2015 – 2022
8.2.9.5.2.2.Market Forecast, 2023 – 2031
8.2.9.5.3.Asia Pacific
8.2.9.5.3.1.Market Estimation, 2015 – 2022
8.2.9.5.3.2.Market Forecast, 2023 – 2031
8.2.9.5.4.Middle East and Africa
8.2.9.5.4.1.Market Estimation, 2015 – 2022
8.2.9.5.4.2.Market Forecast, 2023 – 2031
8.2.9.5.5.Latin America
8.2.9.5.5.1.Market Estimation, 2015 – 2022
8.2.9.5.5.2.Market Forecast, 2023 – 2031
8.2.10.Others
8.2.10.2.Market Estimation and Penetration, 2015 – 2022
8.2.10.3.Market Forecast, 2023 – 2031
8.2.10.4.Compound Annual Growth Rate (CAGR)
8.2.10.5.Regional Bifurcation
8.2.10.5.1.North America
8.2.10.5.1.1.Market Estimation, 2015 – 2022
8.2.10.5.1.2.Market Forecast, 2023 – 2031
8.2.10.5.2.Europe
8.2.10.5.2.1.Market Estimation, 2015 – 2022
8.2.10.5.2.2.Market Forecast, 2023 – 2031
8.2.10.5.3.Asia Pacific
8.2.10.5.3.1.Market Estimation, 2015 – 2022
8.2.10.5.3.2.Market Forecast, 2023 – 2031
8.2.10.5.4.Middle East and Africa
8.2.10.5.4.1.Market Estimation, 2015 – 2022
8.2.10.5.4.2.Market Forecast, 2023 – 2031
8.2.10.5.5.Latin America
8.2.10.5.5.1.Market Estimation, 2015 – 2022
8.2.10.5.5.2.Market Forecast, 2023 – 2031
8.3.Key Segment for Channeling Investments
9.North America High-frequency Power Amplifier Market Analysis and Forecasts, 2023 – 2031
9.1.Overview
9.1.1.North America High-frequency Power Amplifier Market Revenue (US$ Mn)
9.2.North America High-frequency Power Amplifier Market Revenue (US$ Mn) and Forecasts, By Applications
9.2.1.Wireless Communication
9.2.3.Satellite Communication
9.2.4.Radio and Television Broadcasting
9.2.6.Industrial Applications
9.2.7.Test and Measurement
9.2.8.Military and Defense
9.3.North America High-frequency Power Amplifier Market Revenue (US$ Mn) and Forecasts, By Country
9.3.1.U.S
9.3.1.1.U.S High-frequency Power Amplifier Market Revenue (US$ Mn) and Forecasts, By Applications
9.3.1.1.1.Wireless Communication
9.3.1.1.3.Satellite Communication
9.3.1.1.4.Radio and Television Broadcasting
9.3.1.1.5.Medical Imaging
9.3.1.1.6.Industrial Applications
9.3.1.1.7.Test and Measurement
9.3.1.1.8.Military and Defense
9.3.1.1.9.Space Exploration
9.3.2.Canada
9.3.2.1.Canada High-frequency Power Amplifier Market Revenue (US$ Mn) and Forecasts, By Applications
9.3.2.1.1.Wireless Communication
9.3.2.1.3.Satellite Communication
9.3.2.1.4.Radio and Television Broadcasting
9.3.2.1.5.Medical Imaging
9.3.2.1.6.Industrial Applications
9.3.2.1.7.Test and Measurement
9.3.2.1.8.Military and Defense
9.3.2.1.9.Space Exploration
9.3.3.Mexico
9.3.3.1.Mexico High-frequency Power Amplifier Market Revenue (US$ Mn) and Forecasts, By Applications
9.3.3.1.1.Wireless Communication
9.3.3.1.3.Satellite Communication
9.3.3.1.4.Radio and Television Broadcasting
9.3.3.1.5.Medical Imaging
9.3.3.1.6.Industrial Applications
9.3.3.1.7.Test and Measurement
9.3.3.1.8.Military and Defense
9.3.3.1.9.Space Exploration
9.3.4.Rest of North America
9.3.4.1.Rest of North America High-frequency Power Amplifier Market Revenue (US$ Mn) and Forecasts, By Applications
9.3.4.1.1.Wireless Communication
9.3.4.1.3.Satellite Communication
9.3.4.1.4.Radio and Television Broadcasting
9.3.4.1.5.Medical Imaging
9.3.4.1.6.Industrial Applications
9.3.4.1.7.Test and Measurement
9.3.4.1.8.Military and Defense
9.3.4.1.9.Space Exploration
9.4.Key Segment for Channeling Investments
10.Europe High-frequency Power Amplifier Market Analysis and Forecasts, 2023 – 2031
10.1.Overview
10.1.1.Europe High-frequency Power Amplifier Market Revenue (US$ Mn)
10.2.Europe High-frequency Power Amplifier Market Revenue (US$ Mn) and Forecasts, By Applications
10.2.1.Wireless Communication
10.2.3.Satellite Communication
10.2.4.Radio and Television Broadcasting
10.2.6.Industrial Applications
10.2.7.Test and Measurement
10.2.8.Military and Defense
10.3.Europe High-frequency Power Amplifier Market Revenue (US$ Mn) and Forecasts, By Country
10.3.1.France
10.3.1.1.France High-frequency Power Amplifier Market Revenue (US$ Mn) and Forecasts, By Applications
10.3.1.1.1.Wireless Communication
10.3.1.1.3.Satellite Communication
10.3.1.1.4.Radio and Television Broadcasting
10.3.1.1.5.Medical Imaging
10.3.1.1.6.Industrial Applications
10.3.1.1.7.Test and Measurement
10.3.1.1.8.Military and Defense
10.3.1.1.9.Space Exploration
10.3.2.The UK
10.3.2.1.The UK High-frequency Power Amplifier Market Revenue (US$ Mn) and Forecasts, By Applications
10.3.2.1.1.Wireless Communication
10.3.2.1.3.Satellite Communication
10.3.2.1.4.Radio and Television Broadcasting
10.3.2.1.5.Medical Imaging
10.3.2.1.6.Industrial Applications
10.3.2.1.7.Test and Measurement
10.3.2.1.8.Military and Defense
10.3.2.1.9.Space Exploration
10.3.3.Spain
10.3.3.1.Spain High-frequency Power Amplifier Market Revenue (US$ Mn) and Forecasts, By Applications
10.3.3.1.1.Wireless Communication
10.3.3.1.3.Satellite Communication
10.3.3.1.4.Radio and Television Broadcasting
10.3.3.1.5.Medical Imaging
10.3.3.1.6.Industrial Applications
10.3.3.1.7.Test and Measurement
10.3.3.1.8.Military and Defense
10.3.3.1.9.Space Exploration
10.3.4.Germany
10.3.4.1.Germany High-frequency Power Amplifier Market Revenue (US$ Mn) and Forecasts, By Applications
10.3.4.1.1.Wireless Communication
10.3.4.1.3.Satellite Communication
10.3.4.1.4.Radio and Television Broadcasting
10.3.4.1.5.Medical Imaging
10.3.4.1.6.Industrial Applications
10.3.4.1.7.Test and Measurement
10.3.4.1.8.Military and Defense
10.3.4.1.9.Space Exploration
10.3.5.Italy
10.3.5.1.Italy High-frequency Power Amplifier Market Revenue (US$ Mn) and Forecasts, By Applications
10.3.5.1.1.Wireless Communication
10.3.5.1.3.Satellite Communication
10.3.5.1.4.Radio and Television Broadcasting
10.3.5.1.5.Medical Imaging
10.3.5.1.6.Industrial Applications
10.3.5.1.7.Test and Measurement
10.3.5.1.8.Military and Defense
10.3.5.1.9.Space Exploration
10.3.6.Nordic Countries
10.3.6.1.Nordic Countries High-frequency Power Amplifier Market Revenue (US$ Mn) and Forecasts, By Applications
10.3.6.1.1.Wireless Communication
10.3.6.1.3.Satellite Communication
10.3.6.1.4.Radio and Television Broadcasting
10.3.6.1.5.Medical Imaging
10.3.6.1.6.Industrial Applications
10.3.6.1.7.Test and Measurement
10.3.6.1.8.Military and Defense
10.3.6.1.9.Space Exploration
10.3.6.2.Nordic Countries High-frequency Power Amplifier Market Revenue (US$ Mn) and Forecasts, By Country
10.3.7.Benelux Union
10.3.7.1.Benelux Union High-frequency Power Amplifier Market Revenue (US$ Mn) and Forecasts, By Applications
10.3.7.1.1.Wireless Communication
10.3.7.1.3.Satellite Communication
10.3.7.1.4.Radio and Television Broadcasting
10.3.7.1.5.Medical Imaging
10.3.7.1.6.Industrial Applications
10.3.7.1.7.Test and Measurement
10.3.7.1.8.Military and Defense
10.3.7.1.9.Space Exploration
10.3.7.2.Benelux Union High-frequency Power Amplifier Market Revenue (US$ Mn) and Forecasts, By Country
10.3.7.2.2.The Netherlands
10.3.8.Rest of Europe
10.3.8.1.Rest of Europe High-frequency Power Amplifier Market Revenue (US$ Mn) and Forecasts, By Applications
10.3.8.1.1.Wireless Communication
10.3.8.1.3.Satellite Communication
10.3.8.1.4.Radio and Television Broadcasting
10.3.8.1.5.Medical Imaging
10.3.8.1.6.Industrial Applications
10.3.8.1.7.Test and Measurement
10.3.8.1.8.Military and Defense
10.3.8.1.9.Space Exploration
10.4.Key Segment for Channeling Investments
11.Asia Pacific High-frequency Power Amplifier Market Analysis and Forecasts, 2023 – 2031
11.1.Overview
11.1.1.Asia Pacific High-frequency Power Amplifier Market Revenue (US$ Mn)
11.2.Asia Pacific High-frequency Power Amplifier Market Revenue (US$ Mn) and Forecasts, By Applications
11.2.1.Wireless Communication
11.2.3.Satellite Communication
11.2.4.Radio and Television Broadcasting
11.2.6.Industrial Applications
11.2.7.Test and Measurement
11.2.8.Military and Defense
11.3.Asia Pacific High-frequency Power Amplifier Market Revenue (US$ Mn) and Forecasts, By Country
11.3.1.China
11.3.1.1.China High-frequency Power Amplifier Market Revenue (US$ Mn) and Forecasts, By Applications
11.3.1.1.1.Wireless Communication
11.3.1.1.3.Satellite Communication
11.3.1.1.4.Radio and Television Broadcasting
11.3.1.1.5.Medical Imaging
11.3.1.1.6.Industrial Applications
11.3.1.1.7.Test and Measurement
11.3.1.1.8.Military and Defense
11.3.1.1.9.Space Exploration
11.3.2.Japan
11.3.2.1.Japan High-frequency Power Amplifier Market Revenue (US$ Mn) and Forecasts, By Applications
11.3.2.1.1.Wireless Communication
11.3.2.1.3.Satellite Communication
11.3.2.1.4.Radio and Television Broadcasting
11.3.2.1.5.Medical Imaging
11.3.2.1.6.Industrial Applications
11.3.2.1.7.Test and Measurement
11.3.2.1.8.Military and Defense
11.3.2.1.9.Space Exploration
11.3.3.India
11.3.3.1.India High-frequency Power Amplifier Market Revenue (US$ Mn) and Forecasts, By Applications
11.3.3.1.1.Wireless Communication
11.3.3.1.3.Satellite Communication
11.3.3.1.4.Radio and Television Broadcasting
11.3.3.1.5.Medical Imaging
11.3.3.1.6.Industrial Applications
11.3.3.1.7.Test and Measurement
11.3.3.1.8.Military and Defense
11.3.3.1.9.Space Exploration
11.3.4.New Zealand
11.3.4.1.New Zealand High-frequency Power Amplifier Market Revenue (US$ Mn) and Forecasts, By Applications
11.3.4.1.1.Wireless Communication
11.3.4.1.3.Satellite Communication
11.3.4.1.4.Radio and Television Broadcasting
11.3.4.1.5.Medical Imaging
11.3.4.1.6.Industrial Applications
11.3.4.1.7.Test and Measurement
11.3.4.1.8.Military and Defense
11.3.4.1.9.Space Exploration
11.3.5.Australia
11.3.5.1.Australia High-frequency Power Amplifier Market Revenue (US$ Mn) and Forecasts, By Applications
11.3.5.1.1.Wireless Communication
11.3.5.1.3.Satellite Communication
11.3.5.1.4.Radio and Television Broadcasting
11.3.5.1.5.Medical Imaging
11.3.5.1.6.Industrial Applications
11.3.5.1.7.Test and Measurement
11.3.5.1.8.Military and Defense
11.3.5.1.9.Space Exploration
11.3.6.South Korea
11.3.6.1.South Korea High-frequency Power Amplifier Market Revenue (US$ Mn) and Forecasts, By Applications
11.3.6.1.1.Wireless Communication
11.3.6.1.3.Satellite Communication
11.3.6.1.4.Radio and Television Broadcasting
11.3.6.1.5.Medical Imaging
11.3.6.1.6.Industrial Applications
11.3.6.1.7.Test and Measurement
11.3.6.1.8.Military and Defense
11.3.6.1.9.Space Exploration
11.3.7.Southeast Asia
11.3.7.1.Southeast Asia High-frequency Power Amplifier Market Revenue (US$ Mn) and Forecasts, By Applications
11.3.7.1.1.Wireless Communication
11.3.7.1.3.Satellite Communication
11.3.7.1.4.Radio and Television Broadcasting
11.3.7.1.5.Medical Imaging
11.3.7.1.6.Industrial Applications
11.3.7.1.7.Test and Measurement
11.3.7.1.8.Military and Defense
11.3.7.1.9.Space Exploration
11.3.7.2.Southeast Asia High-frequency Power Amplifier Market Revenue (US$ Mn) and Forecasts, By Country
11.3.7.2.5.Rest of Southeast Asia
11.3.8.Rest of Asia Pacific
11.3.8.1.Rest of Asia Pacific High-frequency Power Amplifier Market Revenue (US$ Mn) and Forecasts, By Applications
11.3.8.1.1.Wireless Communication
11.3.8.1.3.Satellite Communication
11.3.8.1.4.Radio and Television Broadcasting
11.3.8.1.5.Medical Imaging
11.3.8.1.6.Industrial Applications
11.3.8.1.7.Test and Measurement
11.3.8.1.8.Military and Defense
11.3.8.1.9.Space Exploration
11.4.Key Segment for Channeling Investments
12.Middle East and Africa High-frequency Power Amplifier Market Analysis and Forecasts, 2023 – 2031
12.1.Overview
12.1.1.Middle East and Africa High-frequency Power Amplifier Market Revenue (US$ Mn)
12.2.Middle East and Africa High-frequency Power Amplifier Market Revenue (US$ Mn) and Forecasts, By Applications
12.2.1.Wireless Communication
12.2.3.Satellite Communication
12.2.4.Radio and Television Broadcasting
12.2.6.Industrial Applications
12.2.7.Test and Measurement
12.2.8.Military and Defense
12.3.Middle East and Africa High-frequency Power Amplifier Market Revenue (US$ Mn) and Forecasts, By Country
12.3.1.Saudi Arabia
12.3.1.1.Saudi Arabia High-frequency Power Amplifier Market Revenue (US$ Mn) and Forecasts, By Applications
12.3.1.1.1.Wireless Communication
12.3.1.1.3.Satellite Communication
12.3.1.1.4.Radio and Television Broadcasting
12.3.1.1.5.Medical Imaging
12.3.1.1.6.Industrial Applications
12.3.1.1.7.Test and Measurement
12.3.1.1.8.Military and Defense
12.3.1.1.9.Space Exploration
12.3.2.UAE
12.3.2.1.UAE High-frequency Power Amplifier Market Revenue (US$ Mn) and Forecasts, By Applications
12.3.2.1.1.Wireless Communication
12.3.2.1.3.Satellite Communication
12.3.2.1.4.Radio and Television Broadcasting
12.3.2.1.5.Medical Imaging
12.3.2.1.6.Industrial Applications
12.3.2.1.7.Test and Measurement
12.3.2.1.8.Military and Defense
12.3.2.1.9.Space Exploration
12.3.3.Egypt
12.3.3.1.Egypt High-frequency Power Amplifier Market Revenue (US$ Mn) and Forecasts, By Applications
12.3.3.1.1.Wireless Communication
12.3.3.1.3.Satellite Communication
12.3.3.1.4.Radio and Television Broadcasting
12.3.3.1.5.Medical Imaging
12.3.3.1.6.Industrial Applications
12.3.3.1.7.Test and Measurement
12.3.3.1.8.Military and Defense
12.3.3.1.9.Space Exploration
12.3.4.Kuwait
12.3.4.1.Kuwait High-frequency Power Amplifier Market Revenue (US$ Mn) and Forecasts, By Applications
12.3.4.1.1.Wireless Communication
12.3.4.1.3.Satellite Communication
12.3.4.1.4.Radio and Television Broadcasting
12.3.4.1.5.Medical Imaging
12.3.4.1.6.Industrial Applications
12.3.4.1.7.Test and Measurement
12.3.4.1.8.Military and Defense
12.3.4.1.9.Space Exploration
12.3.5.South Africa
12.3.5.1.South Africa High-frequency Power Amplifier Market Revenue (US$ Mn) and Forecasts, By Applications
12.3.5.1.1.Wireless Communication
12.3.5.1.3.Satellite Communication
12.3.5.1.4.Radio and Television Broadcasting
12.3.5.1.5.Medical Imaging
12.3.5.1.6.Industrial Applications
12.3.5.1.7.Test and Measurement
12.3.5.1.8.Military and Defense
12.3.5.1.9.Space Exploration
12.3.6.Rest of Middle East & Africa
12.3.6.1.Rest of Middle East & Africa High-frequency Power Amplifier Market Revenue (US$ Mn) and Forecasts, By Applications
12.3.6.1.1.Wireless Communication
12.3.6.1.3.Satellite Communication
12.3.6.1.4.Radio and Television Broadcasting
12.3.6.1.5.Medical Imaging
12.3.6.1.6.Industrial Applications
12.3.6.1.7.Test and Measurement
12.3.6.1.8.Military and Defense
12.3.6.1.9.Space Exploration
12.4.Key Segment for Channeling Investments
13.Latin America High-frequency Power Amplifier Market Analysis and Forecasts, 2023 – 2031
13.1.Overview
13.1.1.Latin America High-frequency Power Amplifier Market Revenue (US$ Mn)
13.2.Latin America High-frequency Power Amplifier Market Revenue (US$ Mn) and Forecasts, By Applications
13.2.1.Wireless Communication
13.2.3.Satellite Communication
13.2.4.Radio and Television Broadcasting
13.2.6.Industrial Applications
13.2.7.Test and Measurement
13.2.8.Military and Defense
13.3.Latin America High-frequency Power Amplifier Market Revenue (US$ Mn) and Forecasts, By Country
13.3.1.Brazil
13.3.1.1.Brazil High-frequency Power Amplifier Market Revenue (US$ Mn) and Forecasts, By Applications
13.3.1.1.1.Wireless Communication
13.3.1.1.3.Satellite Communication
13.3.1.1.4.Radio and Television Broadcasting
13.3.1.1.5.Medical Imaging
13.3.1.1.6.Industrial Applications
13.3.1.1.7.Test and Measurement
13.3.1.1.8.Military and Defense
13.3.1.1.9.Space Exploration
13.3.2.Argentina
13.3.2.1.Argentina High-frequency Power Amplifier Market Revenue (US$ Mn) and Forecasts, By Applications
13.3.2.1.1.Wireless Communication
13.3.2.1.3.Satellite Communication
13.3.2.1.4.Radio and Television Broadcasting
13.3.2.1.5.Medical Imaging
13.3.2.1.6.Industrial Applications
13.3.2.1.7.Test and Measurement
13.3.2.1.8.Military and Defense
13.3.2.1.9.Space Exploration
13.3.3.Rest of Latin America
13.3.3.1.Rest of Latin America High-frequency Power Amplifier Market Revenue (US$ Mn) and Forecasts, By Applications
13.3.3.1.1.Wireless Communication
13.3.3.1.3.Satellite Communication
13.3.3.1.4.Radio and Television Broadcasting
13.3.3.1.5.Medical Imaging
13.3.3.1.6.Industrial Applications
13.3.3.1.7.Test and Measurement
13.3.3.1.8.Military and Defense
13.3.3.1.9.Space Exploration
13.4.Key Segment for Channeling Investments
14.Competitive Benchmarking
14.1.Market Share Analysis, 2022
14.2.Global Presence and Growth Strategies
14.2.1.Mergers and Acquisitions
14.2.3.Investments Trends
15.Player Profiles
15.1.AmpliTech, Inc.
15.1.5.Financial Analysis
15.1.7.Business Strategies
15.2.Keylink Microwave.
15.2.5.Financial Analysis
15.2.7.Business Strategies
15.3.MACOM
15.3.5.Financial Analysis
15.3.7.Business Strategies
15.4.Nautel
15.4.5.Financial Analysis
15.4.7.Business Strategies
15.5.Ophir RF, Inc.
15.5.5.Financial Analysis
15.5.7.Business Strategies
15.6.Pasternack
15.6.5.Financial Analysis
15.6.7.Business Strategies
15.7.Qorvo, Inc
15.7.5.Financial Analysis
15.7.7.Business Strategies
15.8.Skyworks Solutions, Inc.
15.8.5.Financial Analysis
15.8.7.Business Strategies
15.9.Spectrum Control
15.9.5.Financial Analysis
15.9.7.Business Strategies
15.10.Other market participants
.
Note: This ToC is tentative and can be changed according to the research study conducted during the course of report completion.
.
**Exclusive for Multi-User and Enterprise User.
.
Global High-frequency Power Amplifier Market Segmentation
Global High-frequency Power Amplifier Market – Application Outlook (Revenue, USD Million, 2015 – 2031)
◦ Satellite Communication
◦ Radio and Television Broadcasting
◦ Industrial Applications
Global High-frequency Power Amplifier Market – Regional Outlook (Revenue, USD Million, 2015 – 2031)
◦ North America (U.S., Canada, Mexico, Rest of North America)
◦ Europe (France, The UK, Spain, Germany, Italy, Nordic Countries (Denmark, Finland, Iceland, Sweden, Norway), Benelux Union (Belgium, The Netherlands, Luxembourg), Rest of Europe)
◦ Asia Pacific (China, Japan, India, New Zealand, Australia, South Korea, Southeast Asia (Indonesia, Thailand, Malaysia, Singapore, Rest of Southeast Asia), Rest of Asia Pacific)
◦ Middle East & Africa (Saudi Arabia, UAE, Egypt, Kuwait, South Africa, Rest of Middle East & Africa)
◦ Latin America (Brazil, Argentina, Rest of Latin America)
**Note: The report covers cross-segmentation analysis by region further into countries
The Niche Research approach encompasses both primary and secondary research methods to provide comprehensive insights. While primary research is the cornerstone of our studies, we also incorporate secondary research sources such as company annual reports, premium industry databases, press releases, industry journals, and white papers.
Within our primary research, we actively engage with various industry stakeholders, conducting paid interviews and surveys. Our meticulous analysis extends to every market participant in major countries, allowing us to thoroughly examine their portfolios, calculate market shares, and segment revenues.
Our data collection primarily focuses on individual countries within our research scope, enabling us to estimate regional market sizes. Typically, we employ a bottom-up approach, meticulously tracking trends in different countries. We analyze growth drivers, constraints, technological innovations, and opportunities for each country, ultimately arriving at regional figures.Our process begins by examining the growth prospects of each country. Building upon these insights, we project growth and trends for the entire region. Finally, we utilize our proprietary model to refine estimations and forecasts.
Our data validation standards are integral to ensuring the reliability and accuracy of our research findings. Here’s a breakdown of our data validation processes and the stakeholders we engage with during our primary research:
- Supply Side Analysis: We initiate a supply side analysis by directly contacting market participants, through telephonic interviews and questionnaires containing both open-ended and close-ended questions. We gather information on their portfolios, segment revenues, developments, and growth strategies.
- Demand Side Analysis: To gain insights into adoption trends and consumer preferences, we reach out to target customers and users (non-vendors). This information forms a vital part of the qualitative analysis section of our reports, covering market dynamics, adoption trends, consumer behavior, spending patterns, and other related aspects.
- Consultant Insights: We tap into the expertise of our partner consultants from around the world to obtain their unique viewpoints and perspectives. Their insights contribute to a well-rounded understanding of the markets under investigation.
- In-House Validation: To ensure data accuracy and reliability, we conduct cross-validation of data points and information through our in-house team of consultants and utilize advanced data modeling tools for thorough verification.
The forecasts we provide are based on a comprehensive assessment of various factors, including:
- Market Trends and Past Performance (Last Five Years): We accurately analyze market trends and performance data from preceding five years to identify historical patterns and understand the market’s evolution.
- Historical Performance and Growth of Market Participants: We assess the historical performance and growth trajectories of key market participants. This analysis provides insights into the competitive landscape and individual company strategies.
- Market Determinants Impact Analysis (Next Eight Years): We conduct a rigorous analysis of the factors that are projected to influence the market over the next eight years. This includes assessing both internal and external determinants that can shape market dynamics.
- Drivers and Challenges for the Forecast Period:Identify the factors expected to drive market growth during the forecast period, as well as the challenges that the industry may face. This analysis aids in deriving an accurate growth rate projection.
- New Acquisitions, Collaborations, or Partnerships: We keep a close watch on any new acquisitions, collaborations, or partnerships within the industry. These developments can have a significant impact on market dynamics and competitiveness.
- Macro and Micro Factors Analysis:A thorough examination of both macro-level factors (e.g., economic trends, regulatory changes) and micro-level factors (e.g., technological advancements, consumer preferences) that may influence the market during the forecast period.
- End-User Sentiment Analysis: To understand the market from the end-user perspective, we conduct sentiment analysis. This involves assessing the sentiment, preferences, and feedback of the end-users, which can provide valuable insights into market trends.
- Perspective of Primary Participants: Insights gathered directly from primary research participants play a crucial role in shaping our forecasts. Their perspectives and experiences provide valuable qualitative data.
- Year-on-Year Growth Trend: We utilize a year-on-year growth trend based on historical market growth and expected future trends. This helps in formulating our growth projections, aligning them with the market’s historical performance.
Research process adopted by TNR involves multiple stages, including data collection, validation, quality checks, and presentation. It’s crucial that the data and information we provide add value to your existing market understanding and expertise. We have also established partnerships with business consulting, research, and survey organizations across regions and globally to collaborate on regional analysis and data validation, ensuring the highest level of accuracy and reliability in our reports.