Global Hydrogen Electrolyzer Market By Product, By Capacity, By Distribution Channel, By Application & By Region Segmental Trends and Forecasts, 2015 – 2031

  • Industry: Energy & Power
  • Report ID: TNR-110-984
  • Number of Pages: 420
  • Table/Charts : Yes
  • December, 2023
  • Base Year : 2024
  • No. of Companies : 10+
  • No. of Countries : 29
  • Views : 10122
  • Covid Impact Covered: Yes
  • War Impact Covered: Yes
  • Formats : PDF, Excel, PPT

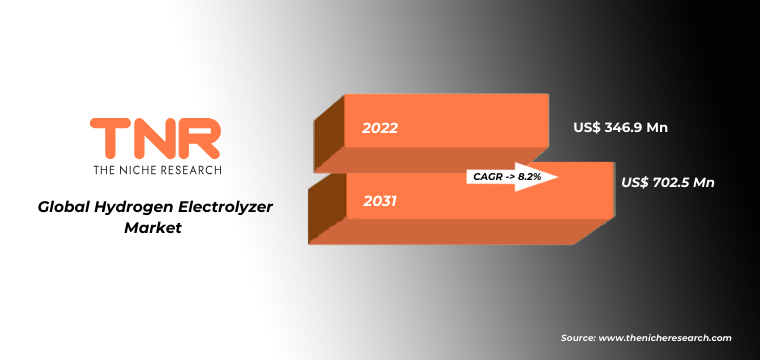
Global Hydrogen Electrolyzer Market Accounted for US$ 346.9 Mn in 2022, Growing at a CAGR of 8.2% over the Forecast Period (2023 – 2031)

A hydrogen electrolyzer is a device that uses electricity to split water (H2O) into its constituent elements: hydrogen (H2) and oxygen (O2). This process is called electrolysis, and it involves passing an electric current through an electrolyte (usually water) to drive a chemical reaction.

The basic components of a hydrogen electrolyzer include:

  • Electrolyte: This is the medium through which the electric current passes. In most cases, distilled water is used as the electrolyte. However, electrolytes with additives or special properties can be used to enhance the efficiency and durability of the electrolyzer.
  • Electrodes: Electrodes are typically made of conductive materials, such as metals like platinum, iridium, or nickel. There are two types of electrodes:
    • Anode: The anode is the electrode connected to the positive terminal of the power source. At the anode, water molecules are oxidized, releasing oxygen gas (O2) and electrons (e^-).
    • Cathode: The cathode is the electrode connected to the negative terminal of the power source. At the cathode, electrons from the anode combine with hydrogen ions (H+) in the electrolyte to form hydrogen gas (H2).
  • Power Source: A direct current (DC) power source is used to provide the electrical energy needed for the electrolysis process. The voltage and current supplied by the power source determine the rate of hydrogen and oxygen gas production.
  • Separator: A separator is used to prevent the mixing of hydrogen and oxygen gases that are produced during electrolysis. This is important because hydrogen and oxygen gases are highly flammable when mixed together.

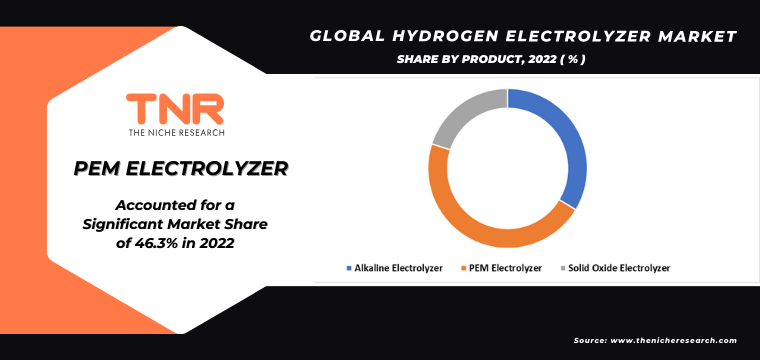
Surging Need for Producing High-Purity Hydrogen: Driving the Adoption of Proton Exchange Membrane (Pem) Electrolyzer in the Global Hydrogen Electrolyzer Market

PEM electrolyzers offer several advantages that make them well-suited for applications where high-purity hydrogen is essential:

  • High Purity: PEM electrolyzers are capable of producing high-purity hydrogen gas (typically 99.999% pure or higher). This level of purity is often required for applications such as fuel cells used in automotive, aerospace, and stationary power generation.
  • Efficiency: PEM electrolyzers are known for their high efficiency, especially at partial load conditions. This means they can respond quickly to changes in electricity supply and demand, making them suitable for intermittent renewable energy sources like wind and solar.
  • Compact Design: These electrolyzers are relatively compact and lightweight compared to other types of electrolyzers, such as alkaline electrolyzers. This makes them more suitable for decentralized and mobile applications, propelling its dominance in the global hydrogen electrolyzer market.
  • Fast Start-up and Shutdown: They can start up and shut down rapidly, allowing for dynamic response to changes in hydrogen demand. This feature is particularly important in applications like hydrogen refuelling stations for fuel cell vehicles.
  • No Alkali Metals: Unlike alkaline electrolyzers, PEM electrolyzers do not require alkali metals as electrolyte materials. This eliminates concerns related to the handling and disposal of hazardous materials.
  • Low Maintenance: PEM electrolyzers typically have lower maintenance requirements compared to other types of electrolyzers in the global hydrogen electrolyzer market, which can reduce operating costs over the long term.

Government bodies and industries around the world are investing in hydrogen infrastructure and technologies to support the transition to a low-carbon and hydrogen-based economy. PEM electrolyzers are a critical component of this infrastructure, enabling the production of clean hydrogen from renewable energy sources and contributing to efforts to reduce greenhouse gas emissions. All these factor account for PEM electrolyzers dominant market share in the global hydrogen electrolyzer market.

Transportation Showcasing Promising Applications in the Global Hydrogen Electrolyzer Market

  • Zero-Emissions Vehicles: Hydrogen fuel cell vehicles (FCVs) are considered zero-emission vehicles because they produce no harmful tailpipe emissions. This makes hydrogen a compelling option for reducing greenhouse gas emissions and improving air quality, particularly in the transportation sector, boosting the growth of the global hydrogen electrolyzer market.
  • Longer Driving Range: Hydrogen FCVs typically offer longer driving ranges compared to battery electric vehicles (BEVs). This is particularly important for applications like long-haul trucking, where extended range is essential.
  • Fast Refuelling: Hydrogen refuelling is much quicker than recharging electric vehicle batteries. This “fast refuelling” characteristic is crucial for fleet operators and individuals who require rapid turnaround times.
  • Versatility: Hydrogen can be used in various modes of transportation, including passenger vehicles, trucks, buses, trains, ships, and even aircraft. This versatility makes it suitable for a wide range of applications in the global hydrogen electrolyzer market.
  • Reducing Dependency on Fossil Fuels: Hydrogen production using electrolyzers can be powered by renewable energy sources, such as wind and solar. This reduces the transportation sector’s reliance on fossil fuels and aligns with clean energy and sustainability goals.
  • Energy Storage Integration: Hydrogen can play a role in energy storage for transportation. Excess renewable energy can be used to produce hydrogen through electrolysis, which can then be stored and used to power vehicles when needed.
  • Government Support: Many government bodies around the world are providing incentives and support for the adoption of hydrogen fuel cell vehicles and associated infrastructure, including hydrogen production through electrolysis.

Global Hydrogen Electrolyzer Market Report Summary

  • Heavy-Duty Applications: Hydrogen is particularly well-suited for heavy-duty and commercial transportation, including trucks, buses, and trains. These applications benefit from the high energy density and quick refuelling properties of hydrogen, pushing the global hydrogen electrolyzer market.
  • Reducing Carbon Footprint: Hydrogen produced through electrolysis using renewable energy sources can significantly reduce the carbon footprint of the transportation sector, helping countries meet their emissions reduction targets.
  • Hydrogen Ecosystem Development: The growth of hydrogen refueling infrastructure is expanding, making it increasingly viable for consumers and businesses to adopt hydrogen FCVs. Manufacturers, energy companies, and governments are investing in developing this ecosystem.

Report SnapshotGlobal Hydrogen Electrolyzer Market

Key operating players in the global hydrogen electrolyzer market are:

  • Air Liquide
  • Bloom Energy
  • Cockerill Jingli Hydrogen
  • Cummins, Inc.
  • ECPlaza Network Inc.
  • Enapter
  • Fuel Cell Store
  • McPhy Energy
  • Nel ASA
  • Ohmium
  • Proton Onsit
  • Shandong Saikesaisi Hydrogen Energy Co, Ltd.
  • Siemens Energy
  • TianJin Mainland Hydrogen Equipment Co., Ltd
  • Other Market Participants

Global Hydrogen Electrolyzer Market Insights

Report Specifications Details
Market Revenue in 2022 US$ 346.9 Mn
Market Size Forecast by 2031 US$ 702.5 Mn
Growth Rate (CAGR) 8.2%
Historic Data 2015 – 2021
Base Year for Estimation 2022
Forecast Period 2023 – 2031
Report Inclusions Market Size & Estimates, Market Dynamics, Competitive Scenario, Trends, Growth Factors, Market Determinants, Key Investment Segmentation, Product/Service/Solutions Benchmarking
Segments Covered By Product, By Capacity, By Application
Regions Covered North America, Europe, Asia Pacific, Middle East & Africa, Latin America
Countries Covered U.S., Canada, Mexico, Rest of North America,  France, The UK, Spain, Germany, Italy, Nordic Countries (Denmark, Finland, Iceland, Sweden, Norway), Benelux Union (Belgium, The Netherlands, Luxembourg), Rest of Europe,  China, Japan, India, New Zealand, Australia, South Korea, Southeast Asia (Indonesia, Thailand, Malaysia, Singapore, Rest of Southeast Asia), Rest of Asia Pacific,  Saudi Arabia, UAE, Egypt, Kuwait, South Africa, Rest of Middle East & Africa,  Brazil, Argentina, Rest of Latin America
Key Players Air Liquide, Bloom Energy, Cockerill Jingli Hydrogen, Cummins, Inc., ECPlaza Network Inc., Enapter, Fuel Cell Store, McPhy Energy, Nel ASA, Ohmium, Proton Onsit, Shandong Saikesaisi Hydrogen Energy Co, Ltd., Siemens Energy, TianJin Mainland Hydrogen Equipment Co., Ltd, Other Market Participants
Customization Scope Customization allows for the inclusion/modification of content pertaining to geographical regions, countries, and specific market segments.
Pricing & Procurement Options Explore purchase options tailored to your specific research requirements
Contact Details Consult With Our Expert

Japan (Toll-Free):  +81 663-386-8111

South Korea (Toll-Free):  +82-808- 703-126

Saudi Arabia (Toll-Free):  +966 800-850-1643

United Kingdom: +44 753-710-5080

United States: +1 302-232-5106

E-mail:  askanexpert@thenicheresearch.com


Global Hydrogen Electrolyzer Market


By  Product

  • Alkaline Electrolyzer
  • PEM Electrolyzer
  • Solid Oxide Electrolyzer

By Capacity

  • 120-1000kW
  • 1000kW- 2000kW
  • More than 2000kW

By Application

  • Energy and Power generation
  • Methanol production
  • Ammonia production
  • Petroleum Refining
  • Agriculture
  • Transportation
  • Metal production and fabrication
  • Glass Production
  • Pharmaceutical
  • Others

By Region

  • North America (U.S., Canada, Mexico, Rest of North America)
  • Europe (France, The UK, Spain, Germany, Italy, Nordic Countries (Denmark, Finland, Iceland, Sweden, Norway), Benelux Union (Belgium, The Netherlands, Luxembourg), Rest of Europe)
  • Asia Pacific (China, Japan, India, New Zealand, Australia, South Korea, Southeast Asia (Indonesia, Thailand, Malaysia, Singapore, Rest of Southeast Asia), Rest of Asia Pacific)
  • Middle East & Africa (Saudi Arabia, UAE, Egypt, Kuwait, South Africa, Rest of Middle East & Africa)
  • Latin America (Brazil, Argentina, Rest of Latin America)

.

Table of Contents

.

1.Market Scope
1.1.Market Segmentation
1.2.Years Considered
1.2.1.Historic Years: 2015 – 2021
1.2.2.Base Year: 2022
1.2.3.Forecast Years: 2023 – 2031
2.Key Target Audiences
3.Research Methodology
3.1.Primary Research
3.1.1.Research Questionnaire
3.1.2.Global Percentage Breakdown
3.1.3.Primary Interviews: Key Opinion Leaders (KOLs)
3.2.Secondary Research
3.2.1.Paid Databases
3.2.2.Secondary Sources
3.3.Market Size Estimates
3.3.1.Top-Down Approach
3.3.2.Bottom-Up Approach
3.4.Data Triangulation Methodology
3.5.Research Assumptions
4.Recommendations and Insights from TNR’s Perspective**
5.Holistic Overview of Hydrogen Electrolyzer Market
6.Market Synopsis: Hydrogen Electrolyzer Market
7.Hydrogen Electrolyzer Market Analysis: Qualitative Perspective
7.1.Introduction
7.1.1.Product Definition
7.1.2.Industry Development
7.2.Market Dynamics
7.2.1.Drivers
7.2.2.Restraints
7.2.3.Opportunities
7.2.4.Challenges
7.3.Trends in Hydrogen Electrolyzer Market
7.4.Market Determinants Radar Chart
7.5.Macro-Economic and Micro-Economic Indicators: Hydrogen Electrolyzer Market
7.6.Impact of Covid-19 on Hydrogen Electrolyzer Market
8.Global Hydrogen Electrolyzer Market Analysis and Forecasts, 2023 – 2031
8.1.Overview
8.1.1.Global Hydrogen Electrolyzer Market Revenue (US$ Mn)
8.2.Global Hydrogen Electrolyzer Market Revenue (US$ Mn) and Forecasts, By Product
8.2.1.Alkaline Electrolyzer
8.2.1.1.Definition
8.2.1.2.Market Estimation and Penetration, 2015 – 2022
8.2.1.3.Market Forecast, 2023 – 2031
8.2.1.4.Compound Annual Growth Rate (CAGR)
8.2.1.5.Regional Bifurcation
8.2.1.5.1.North America
8.2.1.5.1.1.Market Estimation, 2015 – 2022
8.2.1.5.1.2.Market Forecast, 2023 – 2031
8.2.1.5.2.Europe
8.2.1.5.2.1.Market Estimation, 2015 – 2022
8.2.1.5.2.2.Market Forecast, 2023 – 2031
8.2.1.5.3.Asia Pacific
8.2.1.5.3.1.Market Estimation, 2015 – 2022
8.2.1.5.3.2.Market Forecast, 2023 – 2031
8.2.1.5.4.Middle East and Africa
8.2.1.5.4.1.Market Estimation, 2015 – 2022
8.2.1.5.4.2.Market Forecast, 2023 – 2031
8.2.1.5.5.Latin America
8.2.1.5.5.1.Market Estimation, 2015 – 2022
8.2.1.5.5.2.Market Forecast, 2023 – 2031
8.2.2.PEM Electrolyzer
8.2.2.1.Definition
8.2.2.2.Market Estimation and Penetration, 2015 – 2022
8.2.2.3.Market Forecast, 2023 – 2031
8.2.2.4.Compound Annual Growth Rate (CAGR)
8.2.2.5.Regional Bifurcation
8.2.2.5.1.North America
8.2.2.5.1.1.Market Estimation, 2015 – 2022
8.2.2.5.1.2.Market Forecast, 2023 – 2031
8.2.2.5.2.Europe
8.2.2.5.2.1.Market Estimation, 2015 – 2022
8.2.2.5.2.2.Market Forecast, 2023 – 2031
8.2.2.5.3.Asia Pacific
8.2.2.5.3.1.Market Estimation, 2015 – 2022
8.2.2.5.3.2.Market Forecast, 2023 – 2031
8.2.2.5.4.Middle East and Africa
8.2.2.5.4.1.Market Estimation, 2015 – 2022
8.2.2.5.4.2.Market Forecast, 2023 – 2031
8.2.2.5.5.Latin America
8.2.2.5.5.1.Market Estimation, 2015 – 2022
8.2.2.5.5.2.Market Forecast, 2023 – 2031
8.2.3.Solid Oxide Electrolyzer
8.2.3.1.Definition
8.2.3.2.Market Estimation and Penetration, 2015 – 2022
8.2.3.3.Market Forecast, 2023 – 2031
8.2.3.4.Compound Annual Growth Rate (CAGR)
8.2.3.5.Regional Bifurcation
8.2.3.5.1.North America
8.2.3.5.1.1.Market Estimation, 2015 – 2022
8.2.3.5.1.2.Market Forecast, 2023 – 2031
8.2.3.5.2.Europe
8.2.3.5.2.1.Market Estimation, 2015 – 2022
8.2.3.5.2.2.Market Forecast, 2023 – 2031
8.2.3.5.3.Asia Pacific
8.2.3.5.3.1.Market Estimation, 2015 – 2022
8.2.3.5.3.2.Market Forecast, 2023 – 2031
8.2.3.5.4.Middle East and Africa
8.2.3.5.4.1.Market Estimation, 2015 – 2022
8.2.3.5.4.2.Market Forecast, 2023 – 2031
8.2.3.5.5.Latin America
8.2.3.5.5.1.Market Estimation, 2015 – 2022
8.2.3.5.5.2.Market Forecast, 2023 – 2031
8.3.Key Segment for Channeling Investments
8.3.1.By Product
9.Global Hydrogen Electrolyzer Market Analysis and Forecasts, 2023 – 2031
9.1.Overview
9.2.Global Hydrogen Electrolyzer Market Revenue (US$ Mn) and Forecasts, By Capacity
9.2.1.120-1000kW
9.2.1.1.Definition
9.2.1.2.Market Estimation and Penetration, 2015 – 2022
9.2.1.3.Market Forecast, 2023 – 2031
9.2.1.4.Compound Annual Growth Rate (CAGR)
9.2.1.5.Regional Bifurcation
9.2.1.5.1.North America
9.2.1.5.1.1.Market Estimation, 2015 – 2022
9.2.1.5.1.2.Market Forecast, 2023 – 2031
9.2.1.5.2.Europe
9.2.1.5.2.1.Market Estimation, 2015 – 2022
9.2.1.5.2.2.Market Forecast, 2023 – 2031
9.2.1.5.3.Asia Pacific
9.2.1.5.3.1.Market Estimation, 2015 – 2022
9.2.1.5.3.2.Market Forecast, 2023 – 2031
9.2.1.5.4.Middle East and Africa
9.2.1.5.4.1.Market Estimation, 2015 – 2022
9.2.1.5.4.2.Market Forecast, 2023 – 2031
9.2.1.5.5.Latin America
9.2.1.5.5.1.Market Estimation, 2015 – 2022
9.2.1.5.5.2.Market Forecast, 2023 – 2031
9.2.2.1000kW- 2000kW
9.2.2.1.Definition
9.2.2.2.Market Estimation and Penetration, 2015 – 2022
9.2.2.3.Market Forecast, 2023 – 2031
9.2.2.4.Compound Annual Growth Rate (CAGR)
9.2.2.5.Regional Bifurcation
9.2.2.5.1.North America
9.2.2.5.1.1.Market Estimation, 2015 – 2022
9.2.2.5.1.2.Market Forecast, 2023 – 2031
9.2.2.5.2.Europe
9.2.2.5.2.1.Market Estimation, 2015 – 2022
9.2.2.5.2.2.Market Forecast, 2023 – 2031
9.2.2.5.3.Asia Pacific
9.2.2.5.3.1.Market Estimation, 2015 – 2022
9.2.2.5.3.2.Market Forecast, 2023 – 2031
9.2.2.5.4.Middle East and Africa
9.2.2.5.4.1.Market Estimation, 2015 – 2022
9.2.2.5.4.2.Market Forecast, 2023 – 2031
9.2.2.5.5.Latin America
9.2.2.5.5.1.Market Estimation, 2015 – 2022
9.2.2.5.5.2.Market Forecast, 2023 – 2031
9.2.3.More than 2000kW
9.2.3.1.Definition
9.2.3.2.Market Estimation and Penetration, 2015 – 2022
9.2.3.3.Market Forecast, 2023 – 2031
9.2.3.4.Compound Annual Growth Rate (CAGR)
9.2.3.5.Regional Bifurcation
9.2.3.5.1.North America
9.2.3.5.1.1.Market Estimation, 2015 – 2022
9.2.3.5.1.2.Market Forecast, 2023 – 2031
9.2.3.5.2.Europe
9.2.3.5.2.1.Market Estimation, 2015 – 2022
9.2.3.5.2.2.Market Forecast, 2023 – 2031
9.2.3.5.3.Asia Pacific
9.2.3.5.3.1.Market Estimation, 2015 – 2022
9.2.3.5.3.2.Market Forecast, 2023 – 2031
9.2.3.5.4.Middle East and Africa
9.2.3.5.4.1.Market Estimation, 2015 – 2022
9.2.3.5.4.2.Market Forecast, 2023 – 2031
9.2.3.5.5.Latin America
9.2.3.5.5.1.Market Estimation, 2015 – 2022
9.2.3.5.5.2.Market Forecast, 2023 – 2031
9.3.Key Segment for Channeling Investments
9.3.1.By Capacity
10.Global Hydrogen Electrolyzer Market Analysis and Forecasts, 2023 – 2031
10.1.Overview
10.2.Global Hydrogen Electrolyzer Market Revenue (US$ Mn) and Forecasts, By Distribution Channel
10.2.1.Online
10.2.1.1.Definition
10.2.1.2.Market Estimation and Penetration, 2015 – 2022
10.2.1.3.Market Forecast, 2023 – 2031
10.2.1.4.Compound Annual Growth Rate (CAGR)
10.2.1.5.Regional Bifurcation
10.2.1.5.1.North America
10.2.1.5.1.1.Market Estimation, 2015 – 2022
10.2.1.5.1.2.Market Forecast, 2023 – 2031
10.2.1.5.2.Europe
10.2.1.5.2.1.Market Estimation, 2015 – 2022
10.2.1.5.2.2.Market Forecast, 2023 – 2031
10.2.1.5.3.Asia Pacific
10.2.1.5.3.1.Market Estimation, 2015 – 2022
10.2.1.5.3.2.Market Forecast, 2023 – 2031
10.2.1.5.4.Middle East and Africa
10.2.1.5.4.1.Market Estimation, 2015 – 2022
10.2.1.5.4.2.Market Forecast, 2023 – 2031
10.2.1.5.5.Latin America
10.2.1.5.5.1.Market Estimation, 2015 – 2022
10.2.1.5.5.2.Market Forecast, 2023 – 2031
10.2.2.Offline
10.2.2.1.Definition
10.2.2.2.Market Estimation and Penetration, 2015 – 2022
10.2.2.3.Market Forecast, 2023 – 2031
10.2.2.4.Compound Annual Growth Rate (CAGR)
10.2.2.5.Regional Bifurcation
10.2.2.5.1.North America
10.2.2.5.1.1.Market Estimation, 2015 – 2022
10.2.2.5.1.2.Market Forecast, 2023 – 2031
10.2.2.5.2.Europe
10.2.2.5.2.1.Market Estimation, 2015 – 2022
10.2.2.5.2.2.Market Forecast, 2023 – 2031
10.2.2.5.3.Asia Pacific
10.2.2.5.3.1.Market Estimation, 2015 – 2022
10.2.2.5.3.2.Market Forecast, 2023 – 2031
10.2.2.5.4.Middle East and Africa
10.2.2.5.4.1.Market Estimation, 2015 – 2022
10.2.2.5.4.2.Market Forecast, 2023 – 2031
10.2.2.5.5.Latin America
10.2.2.5.5.1.Market Estimation, 2015 – 2022
10.2.2.5.5.2.Market Forecast, 2023 – 2031
10.3.Key Segment for Channeling Investments
10.3.1.By Distribution Channel
11.Global Hydrogen Electrolyzer Market Analysis and Forecasts, 2023 – 2031
11.1.Overview
11.2.Global Hydrogen Electrolyzer Market Revenue (US$ Mn) and Forecasts, By Application
11.2.1.Energy and Power generation
11.2.1.1.Definition
11.2.1.2.Market Estimation and Penetration, 2015 – 2022
11.2.1.3.Market Forecast, 2023 – 2031
11.2.1.4.Compound Annual Growth Rate (CAGR)
11.2.1.5.Regional Bifurcation
11.2.1.5.1.North America
11.2.1.5.1.1.Market Estimation, 2015 – 2022
11.2.1.5.1.2.Market Forecast, 2023 – 2031
11.2.1.5.2.Europe
11.2.1.5.2.1.Market Estimation, 2015 – 2022
11.2.1.5.2.2.Market Forecast, 2023 – 2031
11.2.1.5.3.Asia Pacific
11.2.1.5.3.1.Market Estimation, 2015 – 2022
11.2.1.5.3.2.Market Forecast, 2023 – 2031
11.2.1.5.4.Middle East and Africa
11.2.1.5.4.1.Market Estimation, 2015 – 2022
11.2.1.5.4.2.Market Forecast, 2023 – 2031
11.2.1.5.5.Latin America
11.2.1.5.5.1.Market Estimation, 2015 – 2022
11.2.1.5.5.2.Market Forecast, 2023 – 2031
11.2.2.Methanol production
11.2.2.1.Definition
11.2.2.2.Market Estimation and Penetration, 2015 – 2022
11.2.2.3.Market Forecast, 2023 – 2031
11.2.2.4.Compound Annual Growth Rate (CAGR)
11.2.2.5.Regional Bifurcation
11.2.2.5.1.North America
11.2.2.5.1.1.Market Estimation, 2015 – 2022
11.2.2.5.1.2.Market Forecast, 2023 – 2031
11.2.2.5.2.Europe
11.2.2.5.2.1.Market Estimation, 2015 – 2022
11.2.2.5.2.2.Market Forecast, 2023 – 2031
11.2.2.5.3.Asia Pacific
11.2.2.5.3.1.Market Estimation, 2015 – 2022
11.2.2.5.3.2.Market Forecast, 2023 – 2031
11.2.2.5.4.Middle East and Africa
11.2.2.5.4.1.Market Estimation, 2015 – 2022
11.2.2.5.4.2.Market Forecast, 2023 – 2031
11.2.2.5.5.Latin America
11.2.2.5.5.1.Market Estimation, 2015 – 2022
11.2.2.5.5.2.Market Forecast, 2023 – 2031
11.2.3.Ammonia production
11.2.3.1.Definition
11.2.3.2.Market Estimation and Penetration, 2015 – 2022
11.2.3.3.Market Forecast, 2023 – 2031
11.2.3.4.Compound Annual Growth Rate (CAGR)
11.2.3.5.Regional Bifurcation
11.2.3.5.1.North America
11.2.3.5.1.1.Market Estimation, 2015 – 2022
11.2.3.5.1.2.Market Forecast, 2023 – 2031
11.2.3.5.2.Europe
11.2.3.5.2.1.Market Estimation, 2015 – 2022
11.2.3.5.2.2.Market Forecast, 2023 – 2031
11.2.3.5.3.Asia Pacific
11.2.3.5.3.1.Market Estimation, 2015 – 2022
11.2.3.5.3.2.Market Forecast, 2023 – 2031
11.2.3.5.4.Middle East and Africa
11.2.3.5.4.1.Market Estimation, 2015 – 2022
11.2.3.5.4.2.Market Forecast, 2023 – 2031
11.2.3.5.5.Latin America
11.2.3.5.5.1.Market Estimation, 2015 – 2022
11.2.3.5.5.2.Market Forecast, 2023 – 2031
11.2.4.Petroleum Refining
11.2.4.1.Definition
11.2.4.2.Market Estimation and Penetration, 2015 – 2022
11.2.4.3.Market Forecast, 2023 – 2031
11.2.4.4.Compound Annual Growth Rate (CAGR)
11.2.4.5.Regional Bifurcation
11.2.4.5.1.North America
11.2.4.5.1.1.Market Estimation, 2015 – 2022
11.2.4.5.1.2.Market Forecast, 2023 – 2031
11.2.4.5.2.Europe
11.2.4.5.2.1.Market Estimation, 2015 – 2022
11.2.4.5.2.2.Market Forecast, 2023 – 2031
11.2.4.5.3.Asia Pacific
11.2.4.5.3.1.Market Estimation, 2015 – 2022
11.2.4.5.3.2.Market Forecast, 2023 – 2031
11.2.4.5.4.Middle East and Africa
11.2.4.5.4.1.Market Estimation, 2015 – 2022
11.2.4.5.4.2.Market Forecast, 2023 – 2031
11.2.4.5.5.Latin America
11.2.4.5.5.1.Market Estimation, 2015 – 2022
11.2.4.5.5.2.Market Forecast, 2023 – 2031
11.2.5.Agriculture
11.2.5.1.Definition
11.2.5.2.Market Estimation and Penetration, 2015 – 2022
11.2.5.3.Market Forecast, 2023 – 2031
11.2.5.4.Compound Annual Growth Rate (CAGR)
11.2.5.5.Regional Bifurcation
11.2.5.5.1.North America
11.2.5.5.1.1.Market Estimation, 2015 – 2022
11.2.5.5.1.2.Market Forecast, 2023 – 2031
11.2.5.5.2.Europe
11.2.5.5.2.1.Market Estimation, 2015 – 2022
11.2.5.5.2.2.Market Forecast, 2023 – 2031
11.2.5.5.3.Asia Pacific
11.2.5.5.3.1.Market Estimation, 2015 – 2022
11.2.5.5.3.2.Market Forecast, 2023 – 2031
11.2.5.5.4.Middle East and Africa
11.2.5.5.4.1.Market Estimation, 2015 – 2022
11.2.5.5.4.2.Market Forecast, 2023 – 2031
11.2.5.5.5.Latin America
11.2.5.5.5.1.Market Estimation, 2015 – 2022
11.2.5.5.5.2.Market Forecast, 2023 – 2031
11.2.6.Transportation
11.2.6.1.Definition
11.2.6.2.Market Estimation and Penetration, 2015 – 2022
11.2.6.3.Market Forecast, 2023 – 2031
11.2.6.4.Compound Annual Growth Rate (CAGR)
11.2.6.5.Regional Bifurcation
11.2.6.5.1.North America
11.2.6.5.1.1.Market Estimation, 2015 – 2022
11.2.6.5.1.2.Market Forecast, 2023 – 2031
11.2.6.5.2.Europe
11.2.6.5.2.1.Market Estimation, 2015 – 2022
11.2.6.5.2.2.Market Forecast, 2023 – 2031
11.2.6.5.3.Asia Pacific
11.2.6.5.3.1.Market Estimation, 2015 – 2022
11.2.6.5.3.2.Market Forecast, 2023 – 2031
11.2.6.5.4.Middle East and Africa
11.2.6.5.4.1.Market Estimation, 2015 – 2022
11.2.6.5.4.2.Market Forecast, 2023 – 2031
11.2.6.5.5.Latin America
11.2.6.5.5.1.Market Estimation, 2015 – 2022
11.2.6.5.5.2.Market Forecast, 2023 – 2031
11.2.7.Metal production and fabrication
11.2.7.1.Definition
11.2.7.2.Market Estimation and Penetration, 2015 – 2022
11.2.7.3.Market Forecast, 2023 – 2031
11.2.7.4.Compound Annual Growth Rate (CAGR)
11.2.7.5.Regional Bifurcation
11.2.7.5.1.North America
11.2.7.5.1.1.Market Estimation, 2015 – 2022
11.2.7.5.1.2.Market Forecast, 2023 – 2031
11.2.7.5.2.Europe
11.2.7.5.2.1.Market Estimation, 2015 – 2022
11.2.7.5.2.2.Market Forecast, 2023 – 2031
11.2.7.5.3.Asia Pacific
11.2.7.5.3.1.Market Estimation, 2015 – 2022
11.2.7.5.3.2.Market Forecast, 2023 – 2031
11.2.7.5.4.Middle East and Africa
11.2.7.5.4.1.Market Estimation, 2015 – 2022
11.2.7.5.4.2.Market Forecast, 2023 – 2031
11.2.7.5.5.Latin America
11.2.7.5.5.1.Market Estimation, 2015 – 2022
11.2.7.5.5.2.Market Forecast, 2023 – 2031
11.2.8.Glass Production
11.2.8.1.Definition
11.2.8.2.Market Estimation and Penetration, 2015 – 2022
11.2.8.3.Market Forecast, 2023 – 2031
11.2.8.4.Compound Annual Growth Rate (CAGR)
11.2.8.5.Regional Bifurcation
11.2.8.5.1.North America
11.2.8.5.1.1.Market Estimation, 2015 – 2022
11.2.8.5.1.2.Market Forecast, 2023 – 2031
11.2.8.5.2.Europe
11.2.8.5.2.1.Market Estimation, 2015 – 2022
11.2.8.5.2.2.Market Forecast, 2023 – 2031
11.2.8.5.3.Asia Pacific
11.2.8.5.3.1.Market Estimation, 2015 – 2022
11.2.8.5.3.2.Market Forecast, 2023 – 2031
11.2.8.5.4.Middle East and Africa
11.2.8.5.4.1.Market Estimation, 2015 – 2022
11.2.8.5.4.2.Market Forecast, 2023 – 2031
11.2.8.5.5.Latin America
11.2.8.5.5.1.Market Estimation, 2015 – 2022
11.2.8.5.5.2.Market Forecast, 2023 – 2031
11.2.9.Pharmaceutical
11.2.9.1.Definition
11.2.9.2.Market Estimation and Penetration, 2015 – 2022
11.2.9.3.Market Forecast, 2023 – 2031
11.2.9.4.Compound Annual Growth Rate (CAGR)
11.2.9.5.Regional Bifurcation
11.2.9.5.1.North America
11.2.9.5.1.1.Market Estimation, 2015 – 2022
11.2.9.5.1.2.Market Forecast, 2023 – 2031
11.2.9.5.2.Europe
11.2.9.5.2.1.Market Estimation, 2015 – 2022
11.2.9.5.2.2.Market Forecast, 2023 – 2031
11.2.9.5.3.Asia Pacific
11.2.9.5.3.1.Market Estimation, 2015 – 2022
11.2.9.5.3.2.Market Forecast, 2023 – 2031
11.2.9.5.4.Middle East and Africa
11.2.9.5.4.1.Market Estimation, 2015 – 2022
11.2.9.5.4.2.Market Forecast, 2023 – 2031
11.2.9.5.5.Latin America
11.2.9.5.5.1.Market Estimation, 2015 – 2022
11.2.9.5.5.2.Market Forecast, 2023 – 2031
11.2.10.Others
11.2.10.1.Definition
11.2.10.2.Market Estimation and Penetration, 2015 – 2022
11.2.10.3.Market Forecast, 2023 – 2031
11.2.10.4.Compound Annual Growth Rate (CAGR)
11.2.10.5.Regional Bifurcation
11.2.10.5.1.North America
11.2.10.5.1.1.Market Estimation, 2015 – 2022
11.2.10.5.1.2.Market Forecast, 2023 – 2031
11.2.10.5.2.Europe
11.2.10.5.2.1.Market Estimation, 2015 – 2022
11.2.10.5.2.2.Market Forecast, 2023 – 2031
11.2.10.5.3.Asia Pacific
11.2.10.5.3.1.Market Estimation, 2015 – 2022
11.2.10.5.3.2.Market Forecast, 2023 – 2031
11.2.10.5.4.Middle East and Africa
11.2.10.5.4.1.Market Estimation, 2015 – 2022
11.2.10.5.4.2.Market Forecast, 2023 – 2031
11.2.10.5.5.Latin America
11.2.10.5.5.1.Market Estimation, 2015 – 2022
11.2.10.5.5.2.Market Forecast, 2023 – 2031
11.3.Key Segment for Channeling Investments
11.3.1.By Application
12.North America Hydrogen Electrolyzer Market Analysis and Forecasts, 2023 – 2031
12.1.Overview
12.1.1.North America Hydrogen Electrolyzer Market Revenue (US$ Mn)
12.2.North America Hydrogen Electrolyzer Market Revenue (US$ Mn) and Forecasts, By Product
12.2.1.Alkaline Electrolyzer
12.2.2.PEM Electrolyzer
12.2.3.Solid Oxide Electrolyzer
12.3.North America Hydrogen Electrolyzer Market Revenue (US$ Mn) and Forecasts, By Capacity
12.3.1.120-1000kW
12.3.2.1000kW- 2000kW
12.3.3.More than 2000kW
12.4.North America Hydrogen Electrolyzer Market Revenue (US$ Mn) and Forecasts, By Distribution Channel
12.4.1.Online
12.4.2.Offline
12.5.North America Hydrogen Electrolyzer Market Revenue (US$ Mn) and Forecasts, By Application
12.5.1.Energy and Power generation
12.5.2.Methanol production
12.5.3.Ammonia production
12.5.4.Petroleum Refining
12.5.5.Agriculture
12.5.6.Transportation
12.5.7.Metal production and fabrication
12.5.8.Glass Production
12.5.9.Pharmaceutical
12.5.10.Others
12.6.North America Hydrogen Electrolyzer Market Revenue (US$ Mn) and Forecasts, By Country
12.6.1.U.S
12.6.1.1.U.S Hydrogen Electrolyzer Market Revenue (US$ Mn) and Forecasts, By Product
12.6.1.1.1.Alkaline Electrolyzer
12.6.1.1.2.PEM Electrolyzer
12.6.1.1.3.Solid Oxide Electrolyzer
12.6.1.2.U.S Hydrogen Electrolyzer Market Revenue (US$ Mn) and Forecasts, By Capacity
12.6.1.2.1.120-1000kW
12.6.1.2.2.1000kW- 2000kW
12.6.1.2.3.More than 2000kW
12.6.1.3.U.S Hydrogen Electrolyzer Market Revenue (US$ Mn) and Forecasts, By Distribution Channel
12.6.1.3.1.Online
12.6.1.3.2.Offline
12.6.1.4.U.S Hydrogen Electrolyzer Market Revenue (US$ Mn) and Forecasts, By Application
12.6.1.4.1.Energy and Power generation
12.6.1.4.2.Methanol production
12.6.1.4.3.Ammonia production
12.6.1.4.4.Petroleum Refining
12.6.1.4.5.Agriculture
12.6.1.4.6.Transportation
12.6.1.4.7.Metal production and fabrication
12.6.1.4.8.Glass Production
12.6.1.4.9.Pharmaceutical
12.6.1.4.10.Others
12.6.2.Canada
12.6.2.1.Canada Hydrogen Electrolyzer Market Revenue (US$ Mn) and Forecasts, By Product
12.6.2.1.1.Alkaline Electrolyzer
12.6.2.1.2.PEM Electrolyzer
12.6.2.1.3.Solid Oxide Electrolyzer
12.6.2.2.Canada Hydrogen Electrolyzer Market Revenue (US$ Mn) and Forecasts, By Capacity
12.6.2.2.1.120-1000kW
12.6.2.2.2.1000kW- 2000kW
12.6.2.2.3.More than 2000kW
12.6.2.3.Canada Hydrogen Electrolyzer Market Revenue (US$ Mn) and Forecasts, By Distribution Channel
12.6.2.3.1.Online
12.6.2.3.2.Offline
12.6.2.4.Canada Hydrogen Electrolyzer Market Revenue (US$ Mn) and Forecasts, By Application
12.6.2.4.1.Energy and Power generation
12.6.2.4.2.Methanol production
12.6.2.4.3.Ammonia production
12.6.2.4.4.Petroleum Refining
12.6.2.4.5.Agriculture
12.6.2.4.6.Transportation
12.6.2.4.7.Metal production and fabrication
12.6.2.4.8.Glass Production
12.6.2.4.9.Pharmaceutical
12.6.2.4.10.Others
12.6.3.Mexico
12.6.3.1.Mexico Hydrogen Electrolyzer Market Revenue (US$ Mn) and Forecasts, By Product
12.6.3.1.1.Alkaline Electrolyzer
12.6.3.1.2.PEM Electrolyzer
12.6.3.1.3.Solid Oxide Electrolyzer
12.6.3.2.Mexico Hydrogen Electrolyzer Market Revenue (US$ Mn) and Forecasts, By Capacity
12.6.3.2.1.120-1000kW
12.6.3.2.2.1000kW- 2000kW
12.6.3.2.3.More than 2000kW
12.6.3.3.Mexico Hydrogen Electrolyzer Market Revenue (US$ Mn) and Forecasts, By Distribution Channel
12.6.3.3.1.Online
12.6.3.3.2.Offline
12.6.3.4.Mexico Hydrogen Electrolyzer Market Revenue (US$ Mn) and Forecasts, By Application
12.6.3.4.1.Energy and Power generation
12.6.3.4.2.Methanol production
12.6.3.4.3.Ammonia production
12.6.3.4.4.Petroleum Refining
12.6.3.4.5.Agriculture
12.6.3.4.6.Transportation
12.6.3.4.7.Metal production and fabrication
12.6.3.4.8.Glass Production
12.6.3.4.9.Pharmaceutical
12.6.3.4.10.Others
12.6.4.Rest of North America
12.6.4.1.Rest of North America Hydrogen Electrolyzer Market Revenue (US$ Mn) and Forecasts, By Product
12.6.4.1.1.Alkaline Electrolyzer
12.6.4.1.2.PEM Electrolyzer
12.6.4.1.3.Solid Oxide Electrolyzer
12.6.4.2.Rest of North America Hydrogen Electrolyzer Market Revenue (US$ Mn) and Forecasts, By Capacity
12.6.4.2.1.120-1000kW
12.6.4.2.2.1000kW- 2000kW
12.6.4.2.3.More than 2000kW
12.6.4.3.Rest of North America Hydrogen Electrolyzer Market Revenue (US$ Mn) and Forecasts, By Distribution Channel
12.6.4.3.1.Online
12.6.4.3.2.Offline
12.6.4.4.Rest of North America Hydrogen Electrolyzer Market Revenue (US$ Mn) and Forecasts, By Application
12.6.4.4.1.Energy and Power generation
12.6.4.4.2.Methanol production
12.6.4.4.3.Ammonia production
12.6.4.4.4.Petroleum Refining
12.6.4.4.5.Agriculture
12.6.4.4.6.Transportation
12.6.4.4.7.Metal production and fabrication
12.6.4.4.8.Glass Production
12.6.4.4.9.Pharmaceutical
12.6.4.4.10.Others
12.7.Key Segment for Channeling Investments
12.7.1.By Country
12.7.2.By Product
12.7.3.By Capacity
12.7.4.By Distribution Channel
12.7.5.By Application
13.Europe Hydrogen Electrolyzer Market Analysis and Forecasts, 2023 – 2031
13.1.Overview
13.1.1.Europe Hydrogen Electrolyzer Market Revenue (US$ Mn)
13.2.Europe Hydrogen Electrolyzer Market Revenue (US$ Mn) and Forecasts, By Product
13.2.1.Alkaline Electrolyzer
13.2.2.PEM Electrolyzer
13.2.3.Solid Oxide Electrolyzer
13.3.Europe Hydrogen Electrolyzer Market Revenue (US$ Mn) and Forecasts, By Capacity
13.3.1.120-1000kW
13.3.2.1000kW- 2000kW
13.3.3.More than 2000kW
13.4.Europe Hydrogen Electrolyzer Market Revenue (US$ Mn) and Forecasts, By Distribution Channel
13.4.1.Online
13.4.2.Offline
13.5.Europe Hydrogen Electrolyzer Market Revenue (US$ Mn) and Forecasts, By Application
13.5.1.Energy and Power generation
13.5.2.Methanol production
13.5.3.Ammonia production
13.5.4.Petroleum Refining
13.5.5.Agriculture
13.5.6.Transportation
13.5.7.Metal production and fabrication
13.5.8.Glass Production
13.5.9.Pharmaceutical
13.5.10.Others
13.6.Europe Hydrogen Electrolyzer Market Revenue (US$ Mn) and Forecasts, By Country
13.6.1.France
13.6.1.1.France Hydrogen Electrolyzer Market Revenue (US$ Mn) and Forecasts, By Product
13.6.1.1.1.Alkaline Electrolyzer
13.6.1.1.2.PEM Electrolyzer
13.6.1.1.3.Solid Oxide Electrolyzer
13.6.1.2.France Hydrogen Electrolyzer Market Revenue (US$ Mn) and Forecasts, By Capacity
13.6.1.2.1.120-1000kW
13.6.1.2.2.1000kW- 2000kW
13.6.1.2.3.More than 2000kW
13.6.1.3.France Hydrogen Electrolyzer Market Revenue (US$ Mn) and Forecasts, By Distribution Channel
13.6.1.3.1.Online
13.6.1.3.2.Offline
13.6.1.4.France Hydrogen Electrolyzer Market Revenue (US$ Mn) and Forecasts, By Application
13.6.1.4.1.Energy and Power generation
13.6.1.4.2.Methanol production
13.6.1.4.3.Ammonia production
13.6.1.4.4.Petroleum Refining
13.6.1.4.5.Agriculture
13.6.1.4.6.Transportation
13.6.1.4.7.Metal production and fabrication
13.6.1.4.8.Glass Production
13.6.1.4.9.Pharmaceutical
13.6.1.4.10.Others
13.6.2.The UK
13.6.2.1.The UK Hydrogen Electrolyzer Market Revenue (US$ Mn) and Forecasts, By Product
13.6.2.1.1.Alkaline Electrolyzer
13.6.2.1.2.PEM Electrolyzer
13.6.2.1.3.Solid Oxide Electrolyzer
13.6.2.2.The UK Hydrogen Electrolyzer Market Revenue (US$ Mn) and Forecasts, By Capacity
13.6.2.2.1.120-1000kW
13.6.2.2.2.1000kW- 2000kW
13.6.2.2.3.More than 2000kW
13.6.2.3.The UK Hydrogen Electrolyzer Market Revenue (US$ Mn) and Forecasts, By Distribution Channel
13.6.2.3.1.Online
13.6.2.3.2.Offline
13.6.2.4.The UK Hydrogen Electrolyzer Market Revenue (US$ Mn) and Forecasts, By Application
13.6.2.4.1.Energy and Power generation
13.6.2.4.2.Methanol production
13.6.2.4.3.Ammonia production
13.6.2.4.4.Petroleum Refining
13.6.2.4.5.Agriculture
13.6.2.4.6.Transportation
13.6.2.4.7.Metal production and fabrication
13.6.2.4.8.Glass Production
13.6.2.4.9.Pharmaceutical
13.6.2.4.10.Others
13.6.3.Spain
13.6.3.1.Spain Hydrogen Electrolyzer Market Revenue (US$ Mn) and Forecasts, By Product
13.6.3.1.1.Alkaline Electrolyzer
13.6.3.1.2.PEM Electrolyzer
13.6.3.1.3.Solid Oxide Electrolyzer
13.6.3.2.Spain Hydrogen Electrolyzer Market Revenue (US$ Mn) and Forecasts, By Capacity
13.6.3.2.1.120-1000kW
13.6.3.2.2.1000kW- 2000kW
13.6.3.2.3.More than 2000kW
13.6.3.3.Spain Hydrogen Electrolyzer Market Revenue (US$ Mn) and Forecasts, By Distribution Channel
13.6.3.3.1.Online
13.6.3.3.2.Offline
13.6.3.4.Spain Hydrogen Electrolyzer Market Revenue (US$ Mn) and Forecasts, By Application
13.6.3.4.1.Energy and Power generation
13.6.3.4.2.Methanol production
13.6.3.4.3.Ammonia production
13.6.3.4.4.Petroleum Refining
13.6.3.4.5.Agriculture
13.6.3.4.6.Transportation
13.6.3.4.7.Metal production and fabrication
13.6.3.4.8.Glass Production
13.6.3.4.9.Pharmaceutical
13.6.3.4.10.Others
13.6.4.Germany
13.6.4.1.Germany Hydrogen Electrolyzer Market Revenue (US$ Mn) and Forecasts, By Product
13.6.4.1.1.Alkaline Electrolyzer
13.6.4.1.2.PEM Electrolyzer
13.6.4.1.3.Solid Oxide Electrolyzer
13.6.4.2.Germany Hydrogen Electrolyzer Market Revenue (US$ Mn) and Forecasts, By Capacity
13.6.4.2.1.120-1000kW
13.6.4.2.2.1000kW- 2000kW
13.6.4.2.3.More than 2000kW
13.6.4.3.Germany Hydrogen Electrolyzer Market Revenue (US$ Mn) and Forecasts, By Distribution Channel
13.6.4.3.1.Online
13.6.4.3.2.Offline
13.6.4.4.Germany Hydrogen Electrolyzer Market Revenue (US$ Mn) and Forecasts, By Application
13.6.4.4.1.Energy and Power generation
13.6.4.4.2.Methanol production
13.6.4.4.3.Ammonia production
13.6.4.4.4.Petroleum Refining
13.6.4.4.5.Agriculture
13.6.4.4.6.Transportation
13.6.4.4.7.Metal production and fabrication
13.6.4.4.8.Glass Production
13.6.4.4.9.Pharmaceutical
13.6.4.4.10.Others
13.6.5.Italy
13.6.5.1.Italy Hydrogen Electrolyzer Market Revenue (US$ Mn) and Forecasts, By Product
13.6.5.1.1.Alkaline Electrolyzer
13.6.5.1.2.PEM Electrolyzer
13.6.5.1.3.Solid Oxide Electrolyzer
13.6.5.2.Italy Hydrogen Electrolyzer Market Revenue (US$ Mn) and Forecasts, By Capacity
13.6.5.2.1.120-1000kW
13.6.5.2.2.1000kW- 2000kW
13.6.5.2.3.More than 2000kW
13.6.5.3.Italy Hydrogen Electrolyzer Market Revenue (US$ Mn) and Forecasts, By Distribution Channel
13.6.5.3.1.Online
13.6.5.3.2.Offline
13.6.5.4.Italy Hydrogen Electrolyzer Market Revenue (US$ Mn) and Forecasts, By Application
13.6.5.4.1.Energy and Power generation
13.6.5.4.2.Methanol production
13.6.5.4.3.Ammonia production
13.6.5.4.4.Petroleum Refining
13.6.5.4.5.Agriculture
13.6.5.4.6.Transportation
13.6.5.4.7.Metal production and fabrication
13.6.5.4.8.Glass Production
13.6.5.4.9.Pharmaceutical
13.6.5.4.10.Others
13.6.6.Nordic Countries
13.6.6.1.Nordic Countries Hydrogen Electrolyzer Market Revenue (US$ Mn) and Forecasts, By Product
13.6.6.1.1.Alkaline Electrolyzer
13.6.6.1.2.PEM Electrolyzer
13.6.6.1.3.Solid Oxide Electrolyzer
13.6.6.2.Nordic Countries Hydrogen Electrolyzer Market Revenue (US$ Mn) and Forecasts, By Capacity
13.6.6.2.1.120-1000kW
13.6.6.2.2.1000kW- 2000kW
13.6.6.2.3.More than 2000kW
13.6.6.3.Nordic Countries Hydrogen Electrolyzer Market Revenue (US$ Mn) and Forecasts, By Distribution Channel
13.6.6.3.1.Online
13.6.6.3.2.Offline
13.6.6.4.Nordic Countries Hydrogen Electrolyzer Market Revenue (US$ Mn) and Forecasts, By Application
13.6.6.4.1.Energy and Power generation
13.6.6.4.2.Methanol production
13.6.6.4.3.Ammonia production
13.6.6.4.4.Petroleum Refining
13.6.6.4.5.Agriculture
13.6.6.4.6.Transportation
13.6.6.4.7.Metal production and fabrication
13.6.6.4.8.Glass Production
13.6.6.4.9.Pharmaceutical
13.6.6.4.10.Others
13.6.6.5.Nordic Countries Hydrogen Electrolyzer Market Revenue (US$ Mn) and Forecasts, By Country
13.6.6.5.1.Denmark
13.6.6.5.2.Finland
13.6.6.5.3.Iceland
13.6.6.5.4.Sweden
13.6.6.5.5.Norway
13.6.7.Benelux Union
13.6.7.1.Benelux Union Hydrogen Electrolyzer Market Revenue (US$ Mn) and Forecasts, By Product
13.6.7.1.1.Alkaline Electrolyzer
13.6.7.1.2.PEM Electrolyzer
13.6.7.1.3.Solid Oxide Electrolyzer
13.6.7.2.Benelux Union Hydrogen Electrolyzer Market Revenue (US$ Mn) and Forecasts, By Capacity
13.6.7.2.1.120-1000kW
13.6.7.2.2.1000kW- 2000kW
13.6.7.2.3.More than 2000kW
13.6.7.3.Benelux Union Hydrogen Electrolyzer Market Revenue (US$ Mn) and Forecasts, By Distribution Channel
13.6.7.3.1.Online
13.6.7.3.2.Offline
13.6.7.4.Benelux Union Hydrogen Electrolyzer Market Revenue (US$ Mn) and Forecasts, By Application
13.6.7.4.1.Energy and Power generation
13.6.7.4.2.Methanol production
13.6.7.4.3.Ammonia production
13.6.7.4.4.Petroleum Refining
13.6.7.4.5.Agriculture
13.6.7.4.6.Transportation
13.6.7.4.7.Metal production and fabrication
13.6.7.4.8.Glass Production
13.6.7.4.9.Pharmaceutical
13.6.7.4.10.Others
13.6.7.5.Benelux Union Hydrogen Electrolyzer Market Revenue (US$ Mn) and Forecasts, By Country
13.6.7.5.1.Belgium
13.6.7.5.2.The Netherlands
13.6.7.5.3.Luxembourg
13.6.8.Rest of Europe
13.6.8.1.Rest of Europe Hydrogen Electrolyzer Market Revenue (US$ Mn) and Forecasts, By Product
13.6.8.1.1.Alkaline Electrolyzer
13.6.8.1.2.PEM Electrolyzer
13.6.8.1.3.Solid Oxide Electrolyzer
13.6.8.2.Rest of Europe Hydrogen Electrolyzer Market Revenue (US$ Mn) and Forecasts, By Capacity
13.6.8.2.1.120-1000kW
13.6.8.2.2.1000kW- 2000kW
13.6.8.2.3.More than 2000kW
13.6.8.3.Rest of Europe Hydrogen Electrolyzer Market Revenue (US$ Mn) and Forecasts, By Distribution Channel
13.6.8.3.1.Online
13.6.8.3.2.Offline
13.6.8.4.Rest of Europe Hydrogen Electrolyzer Market Revenue (US$ Mn) and Forecasts, By Application
13.6.8.4.1.Energy and Power generation
13.6.8.4.2.Methanol production
13.6.8.4.3.Ammonia production
13.6.8.4.4.Petroleum Refining
13.6.8.4.5.Agriculture
13.6.8.4.6.Transportation
13.6.8.4.7.Metal production and fabrication
13.6.8.4.8.Glass Production
13.6.8.4.9.Pharmaceutical
13.6.8.4.10.Others
13.7.Key Segment for Channeling Investments
13.7.1.By Country
13.7.2.By Product
13.7.3.By Capacity
13.7.4.By Distribution Channel
13.7.5.By Application
14.Asia Pacific Hydrogen Electrolyzer Market Analysis and Forecasts, 2023 – 2031
14.1.Overview
14.1.1.Asia Pacific Hydrogen Electrolyzer Market Revenue (US$ Mn)
14.2.Asia Pacific Hydrogen Electrolyzer Market Revenue (US$ Mn) and Forecasts, By Product
14.2.1.Alkaline Electrolyzer
14.2.2.PEM Electrolyzer
14.2.3.Solid Oxide Electrolyzer
14.3.Asia Pacific Hydrogen Electrolyzer Market Revenue (US$ Mn) and Forecasts, By Capacity
14.3.1.120-1000kW
14.3.2.1000kW- 2000kW
14.3.3.More than 2000kW
14.4.Asia Pacific Hydrogen Electrolyzer Market Revenue (US$ Mn) and Forecasts, By Distribution Channel
14.4.1.Online
14.4.2.Offline
14.5.Asia Pacific Hydrogen Electrolyzer Market Revenue (US$ Mn) and Forecasts, By Application
14.5.1.Energy and Power generation
14.5.2.Methanol production
14.5.3.Ammonia production
14.5.4.Petroleum Refining
14.5.5.Agriculture
14.5.6.Transportation
14.5.7.Metal production and fabrication
14.5.8.Glass Production
14.5.9.Pharmaceutical
14.5.10.Others
14.6.Asia Pacific Hydrogen Electrolyzer Market Revenue (US$ Mn) and Forecasts, By Country
14.6.1.China
14.6.1.1.China Hydrogen Electrolyzer Market Revenue (US$ Mn) and Forecasts, By Product
14.6.1.1.1.Alkaline Electrolyzer
14.6.1.1.2.PEM Electrolyzer
14.6.1.1.3.Solid Oxide Electrolyzer
14.6.1.2.China Hydrogen Electrolyzer Market Revenue (US$ Mn) and Forecasts, By Capacity
14.6.1.2.1.120-1000kW
14.6.1.2.2.1000kW- 2000kW
14.6.1.2.3.More than 2000kW
14.6.1.3.China Hydrogen Electrolyzer Market Revenue (US$ Mn) and Forecasts, By Distribution Channel
14.6.1.3.1.Online
14.6.1.3.2.Offline
14.6.1.4.China Hydrogen Electrolyzer Market Revenue (US$ Mn) and Forecasts, By Application
14.6.1.4.1.Energy and Power generation
14.6.1.4.2.Methanol production
14.6.1.4.3.Ammonia production
14.6.1.4.4.Petroleum Refining
14.6.1.4.5.Agriculture
14.6.1.4.6.Transportation
14.6.1.4.7.Metal production and fabrication
14.6.1.4.8.Glass Production
14.6.1.4.9.Pharmaceutical
14.6.1.4.10.Others
14.6.2.Japan
14.6.2.1.Japan Hydrogen Electrolyzer Market Revenue (US$ Mn) and Forecasts, By Product
14.6.2.1.1.Alkaline Electrolyzer
14.6.2.1.2.PEM Electrolyzer
14.6.2.1.3.Solid Oxide Electrolyzer
14.6.2.2.Japan Hydrogen Electrolyzer Market Revenue (US$ Mn) and Forecasts, By Capacity
14.6.2.2.1.120-1000kW
14.6.2.2.2.1000kW- 2000kW
14.6.2.2.3.More than 2000kW
14.6.2.3.Japan Hydrogen Electrolyzer Market Revenue (US$ Mn) and Forecasts, By Distribution Channel
14.6.2.3.1.Online
14.6.2.3.2.Offline
14.6.2.4.Japan Hydrogen Electrolyzer Market Revenue (US$ Mn) and Forecasts, By Application
14.6.2.4.1.Energy and Power generation
14.6.2.4.2.Methanol production
14.6.2.4.3.Ammonia production
14.6.2.4.4.Petroleum Refining
14.6.2.4.5.Agriculture
14.6.2.4.6.Transportation
14.6.2.4.7.Metal production and fabrication
14.6.2.4.8.Glass Production
14.6.2.4.9.Pharmaceutical
14.6.2.4.10.Others
14.6.3.India
14.6.3.1.India Hydrogen Electrolyzer Market Revenue (US$ Mn) and Forecasts, By Product
14.6.3.1.1.Alkaline Electrolyzer
14.6.3.1.2.PEM Electrolyzer
14.6.3.1.3.Solid Oxide Electrolyzer
14.6.3.2.India Hydrogen Electrolyzer Market Revenue (US$ Mn) and Forecasts, By Capacity
14.6.3.2.1.120-1000kW
14.6.3.2.2.1000kW- 2000kW
14.6.3.2.3.More than 2000kW
14.6.3.3.India Hydrogen Electrolyzer Market Revenue (US$ Mn) and Forecasts, By Distribution Channel
14.6.3.3.1.Online
14.6.3.3.2.Offline
14.6.3.4.India Hydrogen Electrolyzer Market Revenue (US$ Mn) and Forecasts, By Application
14.6.3.4.1.Energy and Power generation
14.6.3.4.2.Methanol production
14.6.3.4.3.Ammonia production
14.6.3.4.4.Petroleum Refining
14.6.3.4.5.Agriculture
14.6.3.4.6.Transportation
14.6.3.4.7.Metal production and fabrication
14.6.3.4.8.Glass Production
14.6.3.4.9.Pharmaceutical
14.6.3.4.10.Others
14.6.4.New Zealand
14.6.4.1.New Zealand Hydrogen Electrolyzer Market Revenue (US$ Mn) and Forecasts, By Product
14.6.4.1.1.Alkaline Electrolyzer
14.6.4.1.2.PEM Electrolyzer
14.6.4.1.3.Solid Oxide Electrolyzer
14.6.4.2.New Zealand Hydrogen Electrolyzer Market Revenue (US$ Mn) and Forecasts, By Capacity
14.6.4.2.1.120-1000kW
14.6.4.2.2.1000kW- 2000kW
14.6.4.2.3.More than 2000kW
14.6.4.3.New Zealand Hydrogen Electrolyzer Market Revenue (US$ Mn) and Forecasts, By Distribution Channel
14.6.4.3.1.Online
14.6.4.3.2.Offline
14.6.4.4.New Zealand Hydrogen Electrolyzer Market Revenue (US$ Mn) and Forecasts, By Application
14.6.4.4.1.Energy and Power generation
14.6.4.4.2.Methanol production
14.6.4.4.3.Ammonia production
14.6.4.4.4.Petroleum Refining
14.6.4.4.5.Agriculture
14.6.4.4.6.Transportation
14.6.4.4.7.Metal production and fabrication
14.6.4.4.8.Glass Production
14.6.4.4.9.Pharmaceutical
14.6.4.4.10.Others
14.6.5.Australia
14.6.5.1.Australia Hydrogen Electrolyzer Market Revenue (US$ Mn) and Forecasts, By Product
14.6.5.1.1.Alkaline Electrolyzer
14.6.5.1.2.PEM Electrolyzer
14.6.5.1.3.Solid Oxide Electrolyzer
14.6.5.2.Australia Hydrogen Electrolyzer Market Revenue (US$ Mn) and Forecasts, By Capacity
14.6.5.2.1.120-1000kW
14.6.5.2.2.1000kW- 2000kW
14.6.5.2.3.More than 2000kW
14.6.5.3.Australia Hydrogen Electrolyzer Market Revenue (US$ Mn) and Forecasts, By Distribution Channel
14.6.5.3.1.Online
14.6.5.3.2.Offline
14.6.5.4.Australia Hydrogen Electrolyzer Market Revenue (US$ Mn) and Forecasts, By Application
14.6.5.4.1.Energy and Power generation
14.6.5.4.2.Methanol production
14.6.5.4.3.Ammonia production
14.6.5.4.4.Petroleum Refining
14.6.5.4.5.Agriculture
14.6.5.4.6.Transportation
14.6.5.4.7.Metal production and fabrication
14.6.5.4.8.Glass Production
14.6.5.4.9.Pharmaceutical
14.6.5.4.10.Others
14.6.6.South Korea
14.6.6.1.South Korea Hydrogen Electrolyzer Market Revenue (US$ Mn) and Forecasts, By Product
14.6.6.1.1.Alkaline Electrolyzer
14.6.6.1.2.PEM Electrolyzer
14.6.6.1.3.Solid Oxide Electrolyzer
14.6.6.2.South Korea Hydrogen Electrolyzer Market Revenue (US$ Mn) and Forecasts, By Capacity
14.6.6.2.1.120-1000kW
14.6.6.2.2.1000kW- 2000kW
14.6.6.2.3.More than 2000kW
14.6.6.3.South Korea Hydrogen Electrolyzer Market Revenue (US$ Mn) and Forecasts, By Distribution Channel
14.6.6.3.1.Online
14.6.6.3.2.Offline
14.6.6.4.South Korea Hydrogen Electrolyzer Market Revenue (US$ Mn) and Forecasts, By Application
14.6.6.4.1.Energy and Power generation
14.6.6.4.2.Methanol production
14.6.6.4.3.Ammonia production
14.6.6.4.4.Petroleum Refining
14.6.6.4.5.Agriculture
14.6.6.4.6.Transportation
14.6.6.4.7.Metal production and fabrication
14.6.6.4.8.Glass Production
14.6.6.4.9.Pharmaceutical
14.6.6.4.10.Others
14.6.7.Southeast Asia
14.6.7.1.Southeast Asia Hydrogen Electrolyzer Market Revenue (US$ Mn) and Forecasts, By Product
14.6.7.1.1.Alkaline Electrolyzer
14.6.7.1.2.PEM Electrolyzer
14.6.7.1.3.Solid Oxide Electrolyzer
14.6.7.2.Southeast Asia Hydrogen Electrolyzer Market Revenue (US$ Mn) and Forecasts, By Capacity
14.6.7.2.1.120-1000kW
14.6.7.2.2.1000kW- 2000kW
14.6.7.2.3.More than 2000kW
14.6.7.3.Southeast Asia Hydrogen Electrolyzer Market Revenue (US$ Mn) and Forecasts, By Distribution Channel
14.6.7.3.1.Online
14.6.7.3.2.Offline
14.6.7.4.Southeast Asia Hydrogen Electrolyzer Market Revenue (US$ Mn) and Forecasts, By Application
14.6.7.4.1.Energy and Power generation
14.6.7.4.2.Methanol production
14.6.7.4.3.Ammonia production
14.6.7.4.4.Petroleum Refining
14.6.7.4.5.Agriculture
14.6.7.4.6.Transportation
14.6.7.4.7.Metal production and fabrication
14.6.7.4.8.Glass Production
14.6.7.4.9.Pharmaceutical
14.6.7.4.10.Others
14.6.7.5.Southeast Asia Hydrogen Electrolyzer Market Revenue (US$ Mn) and Forecasts, By Country
14.6.7.5.1.Indonesia
14.6.7.5.2.Thailand
14.6.7.5.3.Malaysia
14.6.7.5.4.Singapore
14.6.7.5.5.Rest of Southeast Asia
14.6.8.Rest of Asia Pacific
14.6.8.1.Rest of Asia Pacific Hydrogen Electrolyzer Market Revenue (US$ Mn) and Forecasts, By Product
14.6.8.1.1.Alkaline Electrolyzer
14.6.8.1.2.PEM Electrolyzer
14.6.8.1.3.Solid Oxide Electrolyzer
14.6.8.2.Rest of Asia Pacific Hydrogen Electrolyzer Market Revenue (US$ Mn) and Forecasts, By Capacity
14.6.8.2.1.120-1000kW
14.6.8.2.2.1000kW- 2000kW
14.6.8.2.3.More than 2000kW
14.6.8.3.Rest of Asia Pacific Hydrogen Electrolyzer Market Revenue (US$ Mn) and Forecasts, By Distribution Channel
14.6.8.3.1.Online
14.6.8.3.2.Offline
14.6.8.4.Rest of Asia Pacific Hydrogen Electrolyzer Market Revenue (US$ Mn) and Forecasts, By Application
14.6.8.4.1.Energy and Power generation
14.6.8.4.2.Methanol production
14.6.8.4.3.Ammonia production
14.6.8.4.4.Petroleum Refining
14.6.8.4.5.Agriculture
14.6.8.4.6.Transportation
14.6.8.4.7.Metal production and fabrication
14.6.8.4.8.Glass Production
14.6.8.4.9.Pharmaceutical
14.6.8.4.10.Others
14.7.Key Segment for Channeling Investments
14.7.1.By Country
14.7.2.By Product
14.7.3.By Capacity
14.7.4.By Distribution Channel
14.7.5.By Application
15.Middle East and Africa Hydrogen Electrolyzer Market Analysis and Forecasts, 2023 – 2031
15.1.Overview
15.1.1.Middle East and Africa Hydrogen Electrolyzer Market Revenue (US$ Mn)
15.2.Middle East and Africa Hydrogen Electrolyzer Market Revenue (US$ Mn) and Forecasts, By Product
15.2.1.Alkaline Electrolyzer
15.2.2.PEM Electrolyzer
15.2.3.Solid Oxide Electrolyzer
15.3.Middle East and Africa Hydrogen Electrolyzer Market Revenue (US$ Mn) and Forecasts, By Capacity
15.3.1.120-1000kW
15.3.2.1000kW- 2000kW
15.3.3.More than 2000kW
15.4.Middle East and Africa Hydrogen Electrolyzer Market Revenue (US$ Mn) and Forecasts, By Distribution Channel
15.4.1.Online
15.4.2.Offline
15.5.Middle East and Africa Hydrogen Electrolyzer Market Revenue (US$ Mn) and Forecasts, By Application
15.5.1.Energy and Power generation
15.5.2.Methanol production
15.5.3.Ammonia production
15.5.4.Petroleum Refining
15.5.5.Agriculture
15.5.6.Transportation
15.5.7.Metal production and fabrication
15.5.8.Glass Production
15.5.9.Pharmaceutical
15.5.10.Others
15.6.Middle East and Africa Hydrogen Electrolyzer Market Revenue (US$ Mn) and Forecasts, By Country
15.6.1.Saudi Arabia
15.6.1.1.Saudi Arabia Hydrogen Electrolyzer Market Revenue (US$ Mn) and Forecasts, By Product
15.6.1.1.1.Alkaline Electrolyzer
15.6.1.1.2.PEM Electrolyzer
15.6.1.1.3.Solid Oxide Electrolyzer
15.6.1.2.Saudi Arabia Hydrogen Electrolyzer Market Revenue (US$ Mn) and Forecasts, By Capacity
15.6.1.2.1.120-1000kW
15.6.1.2.2.1000kW- 2000kW
15.6.1.2.3.More than 2000kW
15.6.1.3.Saudi Arabia Hydrogen Electrolyzer Market Revenue (US$ Mn) and Forecasts, By Distribution Channel
15.6.1.3.1.Online
15.6.1.3.2.Offline
15.6.1.4.Saudi Arabia Hydrogen Electrolyzer Market Revenue (US$ Mn) and Forecasts, By Application
15.6.1.4.1.Energy and Power generation
15.6.1.4.2.Methanol production
15.6.1.4.3.Ammonia production
15.6.1.4.4.Petroleum Refining
15.6.1.4.5.Agriculture
15.6.1.4.6.Transportation
15.6.1.4.7.Metal production and fabrication
15.6.1.4.8.Glass Production
15.6.1.4.9.Pharmaceutical
15.6.1.4.10.Others
15.6.2.UAE
15.6.2.1.UAE Hydrogen Electrolyzer Market Revenue (US$ Mn) and Forecasts, By Product
15.6.2.1.1.Alkaline Electrolyzer
15.6.2.1.2.PEM Electrolyzer
15.6.2.1.3.Solid Oxide Electrolyzer
15.6.2.2.UAE Hydrogen Electrolyzer Market Revenue (US$ Mn) and Forecasts, By Capacity
15.6.2.2.1.120-1000kW
15.6.2.2.2.1000kW- 2000kW
15.6.2.2.3.More than 2000kW
15.6.2.3.UAE Hydrogen Electrolyzer Market Revenue (US$ Mn) and Forecasts, By Distribution Channel
15.6.2.3.1.Online
15.6.2.3.2.Offline
15.6.2.4.UAE Hydrogen Electrolyzer Market Revenue (US$ Mn) and Forecasts, By Application
15.6.2.4.1.Energy and Power generation
15.6.2.4.2.Methanol production
15.6.2.4.3.Ammonia production
15.6.2.4.4.Petroleum Refining
15.6.2.4.5.Agriculture
15.6.2.4.6.Transportation
15.6.2.4.7.Metal production and fabrication
15.6.2.4.8.Glass Production
15.6.2.4.9.Pharmaceutical
15.6.2.4.10.Others
15.6.3.Egypt
15.6.3.1.Egypt Hydrogen Electrolyzer Market Revenue (US$ Mn) and Forecasts, By Product
15.6.3.1.1.Alkaline Electrolyzer
15.6.3.1.2.PEM Electrolyzer
15.6.3.1.3.Solid Oxide Electrolyzer
15.6.3.2.Egypt Hydrogen Electrolyzer Market Revenue (US$ Mn) and Forecasts, By Capacity
15.6.3.2.1.120-1000kW
15.6.3.2.2.1000kW- 2000kW
15.6.3.2.3.More than 2000kW
15.6.3.3.Egypt Hydrogen Electrolyzer Market Revenue (US$ Mn) and Forecasts, By Distribution Channel
15.6.3.3.1.Online
15.6.3.3.2.Offline
15.6.3.4.Egypt Hydrogen Electrolyzer Market Revenue (US$ Mn) and Forecasts, By Application
15.6.3.4.1.Energy and Power generation
15.6.3.4.2.Methanol production
15.6.3.4.3.Ammonia production
15.6.3.4.4.Petroleum Refining
15.6.3.4.5.Agriculture
15.6.3.4.6.Transportation
15.6.3.4.7.Metal production and fabrication
15.6.3.4.8.Glass Production
15.6.3.4.9.Pharmaceutical
15.6.3.4.10.Others
15.6.4.Kuwait
15.6.4.1.Kuwait Hydrogen Electrolyzer Market Revenue (US$ Mn) and Forecasts, By Product
15.6.4.1.1.Alkaline Electrolyzer
15.6.4.1.2.PEM Electrolyzer
15.6.4.1.3.Solid Oxide Electrolyzer
15.6.4.2.Kuwait Hydrogen Electrolyzer Market Revenue (US$ Mn) and Forecasts, By Capacity
15.6.4.2.1.120-1000kW
15.6.4.2.2.1000kW- 2000kW
15.6.4.2.3.More than 2000kW
15.6.4.3.Kuwait Hydrogen Electrolyzer Market Revenue (US$ Mn) and Forecasts, By Distribution Channel
15.6.4.3.1.Online
15.6.4.3.2.Offline
15.6.4.4.Kuwait Hydrogen Electrolyzer Market Revenue (US$ Mn) and Forecasts, By Application
15.6.4.4.1.Energy and Power generation
15.6.4.4.2.Methanol production
15.6.4.4.3.Ammonia production
15.6.4.4.4.Petroleum Refining
15.6.4.4.5.Agriculture
15.6.4.4.6.Transportation
15.6.4.4.7.Metal production and fabrication
15.6.4.4.8.Glass Production
15.6.4.4.9.Pharmaceutical
15.6.4.4.10.Others
15.6.5.South Africa
15.6.5.1.South Africa Hydrogen Electrolyzer Market Revenue (US$ Mn) and Forecasts, By Product
15.6.5.1.1.Alkaline Electrolyzer
15.6.5.1.2.PEM Electrolyzer
15.6.5.1.3.Solid Oxide Electrolyzer
15.6.5.2.South Africa Hydrogen Electrolyzer Market Revenue (US$ Mn) and Forecasts, By Capacity
15.6.5.2.1.120-1000kW
15.6.5.2.2.1000kW- 2000kW
15.6.5.2.3.More than 2000kW
15.6.5.3.South Africa Hydrogen Electrolyzer Market Revenue (US$ Mn) and Forecasts, By Distribution Channel
15.6.5.3.1.Online
15.6.5.3.2.Offline
15.6.5.4.South Africa Hydrogen Electrolyzer Market Revenue (US$ Mn) and Forecasts, By Application
15.6.5.4.1.Energy and Power generation
15.6.5.4.2.Methanol production
15.6.5.4.3.Ammonia production
15.6.5.4.4.Petroleum Refining
15.6.5.4.5.Agriculture
15.6.5.4.6.Transportation
15.6.5.4.7.Metal production and fabrication
15.6.5.4.8.Glass Production
15.6.5.4.9.Pharmaceutical
15.6.5.4.10.Others
15.6.6.Rest of Middle East & Africa
15.6.6.1.Rest of Middle East & Africa Hydrogen Electrolyzer Market Revenue (US$ Mn) and Forecasts, By Product
15.6.6.1.1.Alkaline Electrolyzer
15.6.6.1.2.PEM Electrolyzer
15.6.6.1.3.Solid Oxide Electrolyzer
15.6.6.2.Rest of Middle East & Africa Hydrogen Electrolyzer Market Revenue (US$ Mn) and Forecasts, By Capacity
15.6.6.2.1.120-1000kW
15.6.6.2.2.1000kW- 2000kW
15.6.6.2.3.More than 2000kW
15.6.6.3.Rest of Middle East & Africa Hydrogen Electrolyzer Market Revenue (US$ Mn) and Forecasts, By Distribution Channel
15.6.6.3.1.Online
15.6.6.3.2.Offline
15.6.6.4.Rest of Middle East & Africa Hydrogen Electrolyzer Market Revenue (US$ Mn) and Forecasts, By Application
15.6.6.4.1.Energy and Power generation
15.6.6.4.2.Methanol production
15.6.6.4.3.Ammonia production
15.6.6.4.4.Petroleum Refining
15.6.6.4.5.Agriculture
15.6.6.4.6.Transportation
15.6.6.4.7.Metal production and fabrication
15.6.6.4.8.Glass Production
15.6.6.4.9.Pharmaceutical
15.6.6.4.10.Others
15.7.Key Segment for Channeling Investments
15.7.1.By Country
15.7.2.By Product
15.7.3.By Capacity
15.7.4.By Distribution Channel
15.7.5.By Application
16.Latin America Hydrogen Electrolyzer Market Analysis and Forecasts, 2023 – 2031
16.1.Overview
16.1.1.Latin America Hydrogen Electrolyzer Market Revenue (US$ Mn)
16.2.Latin America Hydrogen Electrolyzer Market Revenue (US$ Mn) and Forecasts, By Product
16.2.1.Alkaline Electrolyzer
16.2.2.PEM Electrolyzer
16.2.3.Solid Oxide Electrolyzer
16.3.Latin America Hydrogen Electrolyzer Market Revenue (US$ Mn) and Forecasts, By Capacity
16.3.1.120-1000kW
16.3.2.1000kW- 2000kW
16.3.3.More than 2000kW
16.4.Latin America Hydrogen Electrolyzer Market Revenue (US$ Mn) and Forecasts, By Distribution Channel
16.4.1.Online
16.4.2.Offline
16.5.Latin America Hydrogen Electrolyzer Market Revenue (US$ Mn) and Forecasts, By Application
16.5.1.Energy and Power generation
16.5.2.Methanol production
16.5.3.Ammonia production
16.5.4.Petroleum Refining
16.5.5.Agriculture
16.5.6.Transportation
16.5.7.Metal production and fabrication
16.5.8.Glass Production
16.5.9.Pharmaceutical
16.5.10.Others
16.6.Latin America Hydrogen Electrolyzer Market Revenue (US$ Mn) and Forecasts, By Country
16.6.1.Brazil
16.6.1.1.Brazil Hydrogen Electrolyzer Market Revenue (US$ Mn) and Forecasts, By Product
16.6.1.1.1.Alkaline Electrolyzer
16.6.1.1.2.PEM Electrolyzer
16.6.1.1.3.Solid Oxide Electrolyzer
16.6.1.2.Brazil Hydrogen Electrolyzer Market Revenue (US$ Mn) and Forecasts, By Capacity
16.6.1.2.1.120-1000kW
16.6.1.2.2.1000kW- 2000kW
16.6.1.2.3.More than 2000kW
16.6.1.3.Brazil Hydrogen Electrolyzer Market Revenue (US$ Mn) and Forecasts, By Distribution Channel
16.6.1.3.1.Online
16.6.1.3.2.Offline
16.6.1.4.Brazil Hydrogen Electrolyzer Market Revenue (US$ Mn) and Forecasts, By Application
16.6.1.4.1.Energy and Power generation
16.6.1.4.2.Methanol production
16.6.1.4.3.Ammonia production
16.6.1.4.4.Petroleum Refining
16.6.1.4.5.Agriculture
16.6.1.4.6.Transportation
16.6.1.4.7.Metal production and fabrication
16.6.1.4.8.Glass Production
16.6.1.4.9.Pharmaceutical
16.6.1.4.10.Others
16.6.2.Argentina
16.6.2.1.Argentina Hydrogen Electrolyzer Market Revenue (US$ Mn) and Forecasts, By Product
16.6.2.1.1.Alkaline Electrolyzer
16.6.2.1.2.PEM Electrolyzer
16.6.2.1.3.Solid Oxide Electrolyzer
16.6.2.2.Argentina Hydrogen Electrolyzer Market Revenue (US$ Mn) and Forecasts, By Capacity
16.6.2.2.1.120-1000kW
16.6.2.2.2.1000kW- 2000kW
16.6.2.2.3.More than 2000kW
16.6.2.3.Argentina Hydrogen Electrolyzer Market Revenue (US$ Mn) and Forecasts, By Distribution Channel
16.6.2.3.1.Online
16.6.2.3.2.Offline
16.6.2.4.Argentina Hydrogen Electrolyzer Market Revenue (US$ Mn) and Forecasts, By Application
16.6.2.4.1.Energy and Power generation
16.6.2.4.2.Methanol production
16.6.2.4.3.Ammonia production
16.6.2.4.4.Petroleum Refining
16.6.2.4.5.Agriculture
16.6.2.4.6.Transportation
16.6.2.4.7.Metal production and fabrication
16.6.2.4.8.Glass Production
16.6.2.4.9.Pharmaceutical
16.6.2.4.10.Others
16.6.3.Rest of Latin America
16.6.3.1.Rest of Latin America Hydrogen Electrolyzer Market Revenue (US$ Mn) and Forecasts, By Product
16.6.3.1.1.Alkaline Electrolyzer
16.6.3.1.2.PEM Electrolyzer
16.6.3.1.3.Solid Oxide Electrolyzer
16.6.3.2.Rest of Latin America Hydrogen Electrolyzer Market Revenue (US$ Mn) and Forecasts, By Capacity
16.6.3.2.1.120-1000kW
16.6.3.2.2.1000kW- 2000kW
16.6.3.2.3.More than 2000kW
16.6.3.3.Rest of Latin America Hydrogen Electrolyzer Market Revenue (US$ Mn) and Forecasts, By Distribution Channel
16.6.3.3.1.Online
16.6.3.3.2.Offline
16.6.3.4.Rest of Latin America Hydrogen Electrolyzer Market Revenue (US$ Mn) and Forecasts, By Application
16.6.3.4.1.Energy and Power generation
16.6.3.4.2.Methanol production
16.6.3.4.3.Ammonia production
16.6.3.4.4.Petroleum Refining
16.6.3.4.5.Agriculture
16.6.3.4.6.Transportation
16.6.3.4.7.Metal production and fabrication
16.6.3.4.8.Glass Production
16.6.3.4.9.Pharmaceutical
16.6.3.4.10.Others
16.7.Key Segment for Channeling Investments
16.7.1.By Country
16.7.2.By Product
16.7.3.By Capacity
16.7.4.By Distribution Channel
16.7.5.By Application
17.Competitive Benchmarking
17.1.Brand Benchmarking
17.2.Market Share Analysis, 2022
17.3.Global Presence and Growth Strategies
17.3.1.Mergers and Acquisitions
17.3.2.Product Launches
17.3.3.Investments Trends
17.3.4.R&D Initiatives
18.Player Profiles
18.1.Air Liquide
18.1.1.Company Details
18.1.2.Company Overview
18.1.3.Product Offerings
18.1.4.Key Developments
18.1.5.Financial Analysis
18.1.6.SWOT Analysis
18.1.7.Business Strategies
18.2.Air Liquide
18.2.1.Company Details
18.2.2.Company Overview
18.2.3.Product Offerings
18.2.4.Key Developments
18.2.5.Financial Analysis
18.2.6.SWOT Analysis
18.2.7.Business Strategies
18.3.Bloom Energy
18.3.1.Company Details
18.3.2.Company Overview
18.3.3.Product Offerings
18.3.4.Key Developments
18.3.5.Financial Analysis
18.3.6.SWOT Analysis
18.3.7.Business Strategies
18.4.Cockerill Jingli Hydrogen
18.4.1.Company Details
18.4.2.Company Overview
18.4.3.Product Offerings
18.4.4.Key Developments
18.4.5.Financial Analysis
18.4.6.SWOT Analysis
18.4.7.Business Strategies
18.5.Cummins, Inc.
18.5.1.Company Details
18.5.2.Company Overview
18.5.3.Product Offerings
18.5.4.Key Developments
18.5.5.Financial Analysis
18.5.6.SWOT Analysis
18.5.7.Business Strategies
18.6.ECPlaza Network Inc.
18.6.1.Company Details
18.6.2.Company Overview
18.6.3.Product Offerings
18.6.4.Key Developments
18.6.5.Financial Analysis
18.6.6.SWOT Analysis
18.6.7.Business Strategies
18.7.Enapter
18.7.1.Company Details
18.7.2.Company Overview
18.7.3.Product Offerings
18.7.4.Key Developments
18.7.5.Financial Analysis
18.7.6.SWOT Analysis
18.7.7.Business Strategies
18.8.Fuel Cell Store
18.8.1.Company Details
18.8.2.Company Overview
18.8.3.Product Offerings
18.8.4.Key Developments
18.8.5.Financial Analysis
18.8.6.SWOT Analysis
18.8.7.Business Strategies
18.9.McPhy Energy
18.9.1.Company Details
18.9.2.Company Overview
18.9.3.Product Offerings
18.9.4.Key Developments
18.9.5.Financial Analysis
18.9.6.SWOT Analysis
18.9.7.Business Strategies
18.10.Nel ASA
18.10.1.Company Details
18.10.2.Company Overview
18.10.3.Product Offerings
18.10.4.Key Developments
18.10.5.Financial Analysis
18.10.6.SWOT Analysis
18.10.7.Business Strategies
18.11.Ohmium
18.11.1.Company Details
18.11.2.Company Overview
18.11.3.Product Offerings
18.11.4.Key Developments
18.11.5.Financial Analysis
18.11.6.SWOT Analysis
18.11.7.Business Strategies
18.12.Proton Onsit
18.12.1.Company Details
18.12.2.Company Overview
18.12.3.Product Offerings
18.12.4.Key Developments
18.12.5.Financial Analysis
18.12.6.SWOT Analysis
18.12.7.Business Strategies
18.13.Shandong Saikesaisi Hydrogen Energy Co, Ltd.
18.13.1.Company Details
18.13.2.Company Overview
18.13.3.Product Offerings
18.13.4.Key Developments
18.13.5.Financial Analysis
18.13.6.SWOT Analysis
18.13.7.Business Strategies
18.14.Siemens Energy
18.14.1.Company Details
18.14.2.Company Overview
18.14.3.Product Offerings
18.14.4.Key Developments
18.14.5.Financial Analysis
18.14.6.SWOT Analysis
18.14.7.Business Strategies
18.15.TianJin Mainland Hydrogen Equipment Co., Ltd
18.15.1.Company Details
18.15.2.Company Overview
18.15.3.Product Offerings
18.15.4.Key Developments
18.15.5.Financial Analysis
18.15.6.SWOT Analysis
18.15.7.Business Strategies
18.16.Other Market Participants
19.Key Findings

.

***Exclusive for Multi-User and Enterprise User.

Global Hydrogen Electrolyzer Market

By Product

 Alkaline Electrolyzer
 PEM Electrolyzer
 Solid Oxide Electrolyzer

By Capacity

 120-1000kW
 1000kW- 2000kW
 More than 2000kW

By Application

 Energy and Power generation
 Methanol production
 Ammonia production
 Petroleum Refining
 Agriculture
 Transportation
 Metal production and fabrication
 Glass Production
 Pharmaceutical
 Others

By Region

 North America (U.S., Canada, Mexico, Rest of North America)
 Europe (France, The UK, Spain, Germany, Italy, Nordic Countries (Denmark, Finland, Iceland, Sweden, Norway), Benelux Union (Belgium, The Netherlands, Luxembourg), Rest of Europe)
 Asia Pacific (China, Japan, India, New Zealand, Australia, South Korea, Southeast Asia (Indonesia, Thailand, Malaysia, Singapore, Rest of Southeast Asia), Rest of Asia Pacific)
 Middle East & Africa (Saudi Arabia, UAE, Egypt, Kuwait, South Africa, Rest of Middle East & Africa)
 Latin America (Brazil, Argentina, Rest of Latin America)

**Note: The report covers cross-segmentation analysis by region further into countries

The Niche Research approach encompasses both primary and secondary research methods to provide comprehensive insights. While primary research is the cornerstone of our studies, we also incorporate secondary research sources such as company annual reports, premium industry databases, press releases, industry journals, and white papers.

Within our primary research, we actively engage with various industry stakeholders, conducting paid interviews and surveys. Our meticulous analysis extends to every market participant in major countries, allowing us to thoroughly examine their portfolios, calculate market shares, and segment revenues.

Our data collection primarily focuses on individual countries within our research scope, enabling us to estimate regional market sizes. Typically, we employ a bottom-up approach, meticulously tracking trends in different countries. We analyze growth drivers, constraints, technological innovations, and opportunities for each country, ultimately arriving at regional figures.Our process begins by examining the growth prospects of each country. Building upon these insights, we project growth and trends for the entire region. Finally, we utilize our proprietary model to refine estimations and forecasts.

Our data validation standards are integral to ensuring the reliability and accuracy of our research findings. Here’s a breakdown of our data validation processes and the stakeholders we engage with during our primary research:

  • Supply Side Analysis: We initiate a supply side analysis by directly contacting market participants, through telephonic interviews and questionnaires containing both open-ended and close-ended questions. We gather information on their portfolios, segment revenues, developments, and growth strategies.
  • Demand Side Analysis: To gain insights into adoption trends and consumer preferences, we reach out to target customers and users (non-vendors). This information forms a vital part of the qualitative analysis section of our reports, covering market dynamics, adoption trends, consumer behavior, spending patterns, and other related aspects.
  • Consultant Insights: We tap into the expertise of our partner consultants from around the world to obtain their unique viewpoints and perspectives. Their insights contribute to a well-rounded understanding of the markets under investigation.
  • In-House Validation: To ensure data accuracy and reliability, we conduct cross-validation of data points and information through our in-house team of consultants and utilize advanced data modeling tools for thorough verification.

The forecasts we provide are based on a comprehensive assessment of various factors, including:

  • Market Trends and Past Performance (Last Five Years): We accurately analyze market trends and performance data from preceding five years to identify historical patterns and understand the market’s evolution.
  • Historical Performance and Growth of Market Participants: We assess the historical performance and growth trajectories of key market participants. This analysis provides insights into the competitive landscape and individual company strategies.
  • Market Determinants Impact Analysis (Next Eight Years): We conduct a rigorous analysis of the factors that are projected to influence the market over the next eight years. This includes assessing both internal and external determinants that can shape market dynamics.
  • Drivers and Challenges for the Forecast Period:Identify the factors expected to drive market growth during the forecast period, as well as the challenges that the industry may face. This analysis aids in deriving an accurate growth rate projection.
  • New Acquisitions, Collaborations, or Partnerships: We keep a close watch on any new acquisitions, collaborations, or partnerships within the industry. These developments can have a significant impact on market dynamics and competitiveness.
  • Macro and Micro Factors Analysis:A thorough examination of both macro-level factors (e.g., economic trends, regulatory changes) and micro-level factors (e.g., technological advancements, consumer preferences) that may influence the market during the forecast period.
  • End-User Sentiment Analysis: To understand the market from the end-user perspective, we conduct sentiment analysis. This involves assessing the sentiment, preferences, and feedback of the end-users, which can provide valuable insights into market trends.
  • Perspective of Primary Participants: Insights gathered directly from primary research participants play a crucial role in shaping our forecasts. Their perspectives and experiences provide valuable qualitative data.
  • Year-on-Year Growth Trend: We utilize a year-on-year growth trend based on historical market growth and expected future trends. This helps in formulating our growth projections, aligning them with the market’s historical performance.

Research process adopted by TNR involves multiple stages, including data collection, validation, quality checks, and presentation. It’s crucial that the data and information we provide add value to your existing market understanding and expertise. We have also established partnerships with business consulting, research, and survey organizations across regions and globally to collaborate on regional analysis and data validation, ensuring the highest level of accuracy and reliability in our reports.


Procure Comprehensive Study of

Global Hydrogen Electrolyzer Market

Online Only

  • Online Access
  • Read Only File
  • Validity 3 Months
  • Print, Copy, Paste & Download
  • PPT, Excel
  • Cost-Free Report in the Next Update
$3300
Buy Now

Single User

  • Access to One User on One System
  • Read Only File
  • Validity 6 Months
  • Limited Print,Copy, Paste
  • PPT, Excel
  • Cost-Free Report in the Next Update
$4200
Buy Now

Multi User

  • Access to Fiver Users
  • PDF File
  • Validity 1 Year
  • Upto FivePrints
  • Cost-Free Report in the Next Update
  • PPT, Excel
$6000
Buy Now

Enterprise User

  • Access to Unlimited Users
  • PDF, PPT, Excel
  • Unlimited Validity, Prints&Downloads
  • 1 Hour Cost-Free & Dedicated Analyst Support
  • 10% Cost-Free Customization
  • Cost-Free Report Update Twice in a Year
  • Recommendations for Business Strategies
  • Authorization to Quote TNR, The Niche Research
$7300
Buy Now

Library Access

  • Online Access to Content Publications
  • Access Player Profiles Online
  • Get Immediate Access to Newly Added Content
  • Acquire 12 PDF Downloads
  • Acquire 5 Excel Data Sets
  • Gain Access to 290+ PDFs of Company Profiles
  • Round-the-clock Email and Phone Assistance
  • Dashboard Usage and Trends
  • Renewal & Upgrade Assistance
  • Assessing Customization Options and Alerts for New Reports
$10788
Buy Now
*Taxes/Fees, if applicable will be added during checkout. All prices in USD

Why TNR The Niche Research?

  • Unwavering Commitment to Excellence

  • Veteran Team of Researchers

  • Accurate and Timely Insights

  • Ethical Practices and Customized Service

  • Uninterrupted Availability Around the Clock

Scroll to Top