Global Hydrogen Infrastructure Market Insights, Growth, Share, Size: By Production, By Storage, By Delivery, By Region & Segmental Forecast, 2023-2031, Comparative Analysis and Trends

  • Industry: Energy & Power
  • Report ID: TNR-110-962
  • Number of Pages: 420
  • Table/Charts : Yes
  • November, 2023
  • Base Year : 2024
  • No. of Companies : 11+
  • No. of Countries : 29
  • Views : 10099
  • Covid Impact Covered: Yes
  • War Impact Covered: Yes
  • Formats : PDF, Excel, PPT

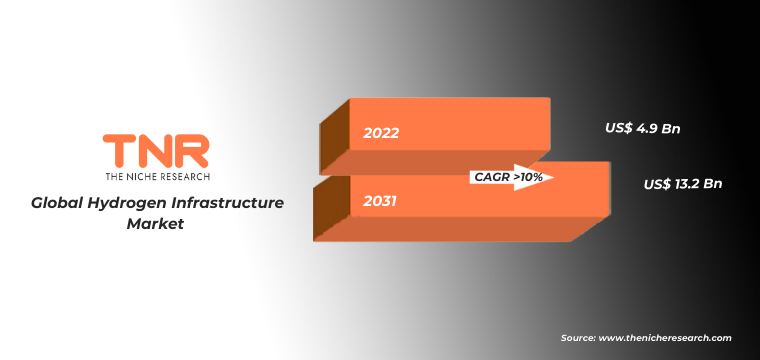
Global Hydrogen Infrastructure Market was Valued at USD 4.9 Bn in 2022, Anticipated to Reach USD 13.2 Billion by 2031, Growing at an Estimated CAGR of 10% from 2023- 2031

Due to the growing worldwide interest in clean and sustainable energy solutions, the global hydrogen infrastructure market is witnessing tremendous expansion and attention. In recent years, the hydrogen market and accompanying hydrogen infrastructure have risen dramatically, with increased interest in the hydrogen economy from governments, investors, and enterprises seeking to fulfil their decarbonisation ambitions. Hydrogen is predicted to play a crucial role in accomplishing global decarbonisation efforts and fulfilling 2050 net-zero ambitions as a clean and flexible energy carrier.

Global Hydrogen Infrastructure Market Revenue & Forecast, (US$ Million), 2015 – 2031

Global Hydrogen Infrastructure Market Future

The future of hydrogen infrastructure market holds significant growth, driven by the global need to transition to clean and sustainable energy sources. The focus on green hydrogen, produced through electrolysis using renewable energy sources, is likely to increase. As the cost of renewable energy continues to decline, the production of green hydrogen could become more economically viable and environmentally friendly. Besides governments and private sectors are investing heavily in scaling up hydrogen infrastructure, including production, storage, transportation, and distribution networks, to support the growing demand for hydrogen across various sectors.

Material-based hydrogen storage methods are being actively researched and developed to overcome storage challenges and provide viable options for efficient and practical hydrogen storage, particularly in scenarios where conventional storage methods are less suitable. Hydrogen storage using material-based solutions involves using certain materials that can absorb and release hydrogen gas. These materials, known as hydrogen storage materials or hydrogen carriers, provide a way to store hydrogen in a solid or liquid form, which can offer advantages over traditional gaseous or liquid hydrogen storage methods. Thus, in the upcoming years, various hydrogen storage methods will be adopted for the growth of the overall hydrogen infrastructure market.

Europe has been making significant strides in developing hydrogen infrastructure as part of its broader clean energy and decarbonization goals. The European Union (EU) and several individual European countries have been actively promoting hydrogen as a key component of their energy transition strategies.

For instance, The REPowerEU Plan included efforts to minimise dependency on Russian fossil resources and accelerate the green transition. REPowerEU has set a target of 10 million tonnes of domestic renewable hydrogen generation and 10 million tonnes of imports by 2030 in order to accelerate the development of hydrogen projects. In Addition accelerated efforts are needed to install hydrogen infrastructure capable of generating, storing, importing, and transferring 20 million tonnes of hydrogen by 2030, a huge contribution to decarbonizing European economy while ensuring supply security.

Competitive Landscape

The report examines the market participants in the global hydrogen infrastructure market in depth. In order to grow their market share and retain dominating positions in various areas, these companies are using various strategies such as new product releases, partnerships, expansion, joint ventures, agreements, and others. A few of the key players operating in the global hydrogen infrastructure market are:

  • Air Liquide
  • Ballard Power Systems
  • Cummins, Inc.
  • DNV GL
  • Engie SA
  • ITM Power PLC
  • Linde
  • McPhy Energy S.A
  • Nel ASA
  • Plug Power Inc.
  • Shell Group
  • Siemens Energy
  • Other Industry Participants

Global Hydrogen Infrastructure Market Report Coverage

Report Specifications Details
Market Revenue in 2022 US$ 4.9 Billion
Market Size Forecast by 2031 US$ 13.2 Billion
Growth Rate (CAGR) 10%
Historic Data 2015 – 2021
Base Year for Estimation 2022
Forecast Period 2023 – 2031
Report Inclusions Market Size & Estimates, Market Dynamics, Competitive Scenario, Trends, Growth Factors, Market Determinants, Key Investment Segmentation, Product/Service/Solutions Benchmarking
Segments Covered By Production, By Storage, By Delivery
Regions Covered North America, Europe, Asia Pacific, Middle East & Africa, Latin America
Countries Covered U.S., Canada, Mexico, Rest of North America,  France, The UK, Spain, Germany, Italy, Nordic Countries (Denmark, Finland, Iceland, Sweden, Norway), Benelux Union (Belgium, The Netherlands, Luxembourg), Rest of Europe,  China, Japan, India, New Zealand, Australia, South Korea, Southeast Asia (Indonesia, Thailand, Malaysia, Singapore, Rest of Southeast Asia), Rest of Asia Pacific,  Saudi Arabia, UAE, Egypt, Kuwait, South Africa, Rest of Middle East & Africa,  Brazil, Argentina, Rest of Latin America
Key Players Air Liquide, Ballard Power Systems, Cummins, Inc., DNV GL, Engie SA, ITM Power PLC, Linde, McPhy Energy S.A, Nel ASA, Plug Power Inc., Shell Group, Siemens Energy, Other Industry Participants
Customization Scope Customization allows for the inclusion/modification of content pertaining to geographical regions, countries, and specific market segments.
Pricing & Procurement Options Explore purchase options tailored to your specific research requirements
Contact Details Consult With Our Expert

Japan (Toll-Free): – +81 663-386-8111

South Korea (Toll-Free): – +82-808- 703-126

Saudi Arabia (Toll-Free): – +966 800 850 1643

United States: +1 302-232-5106

United Kingdom: +447537105080

E-mail:  askanexpert@thenicheresearch.com


Global Hydrogen Infrastructure Market

By Production

  • Electrolysis
  • Coal Gasification
  • Steam Methane Reforming
  • Others

By Storage

  • Compression
  • Liquefaction
  • Material Based

By Delivery

  • Transportation
  • Refinery
  • Power Generation
  • Hydrogen Refueling Stations

By Region

  • North America (U.S., Canada, Mexico, Rest of North America)
  • Europe (France, The UK, Spain, Germany, Italy, Nordic Countries (Denmark, Finland, Iceland, Sweden, Norway), Benelux Union (Belgium, The Netherlands, Luxembourg), Rest of Europe)
  • Asia Pacific (China, Japan, India, New Zealand, Australia, South Korea, Southeast Asia (Indonesia, Thailand, Malaysia, Singapore, Rest of Southeast Asia), Rest of Asia Pacific)
  • Middle East & Africa (Saudi Arabia, UAE, Egypt, Kuwait, South Africa, Rest of Middle East & Africa)
  • Latin America (Brazil, Argentina, Rest of Latin America)

Report Coverage and Deliverables: 

Common


Table of Contents

.

1.Market Scope
1.1.Market Segmentation
1.2.Years Considered
1.2.1.Historic Years: 2015 – 2021
1.2.2.Base Year: 2022
1.2.3.Forecast Years: 2023 – 2031
2.Key Target Audiences
3.Research Methodology
3.1.Primary Research
3.1.1.Research Questionnaire
3.1.2.Global Percentage Breakdown
3.1.3.Primary Interviews: Key Opinion Leaders (KOLs)
3.2.Secondary Research
3.2.1.Paid Databases
3.2.2.Secondary Sources
3.3.Market Size Estimates
3.3.1.Top-Down Approach
3.3.2.Bottom-Up Approach
3.4.Data Triangulation Methodology
3.5.Research Assumptions
4.Recommendations and Insights from TNR’s Perspective**
5.Holistic Overview of Hydrogen Infrastructure Market
6.Market Synopsis: Hydrogen Infrastructure Market
7.Hydrogen Infrastructure Market Analysis: Qualitative Perspective
7.1.Introduction
7.1.1.Product Definition
7.1.2.Industry Development
7.2.Market Dynamics
7.2.1.Drivers
7.2.2.Restraints
7.2.3.Opportunities
7.3.Trends in Hydrogen Infrastructure Market
7.4.Market Determinants Radar Chart
7.5.Macro-Economic and Micro-Economic Indicators: Hydrogen Infrastructure Market
7.6.Porter’s Five Force Analysis
8.Global Hydrogen Infrastructure Market Analysis and Forecasts, 2023 – 2031
8.1.Overview
8.1.1.Global Hydrogen Infrastructure Market Revenue (US$ Mn)
8.2.Global Hydrogen Infrastructure Market Revenue (US$ Mn) and Forecasts, By Production
8.2.1.Electrolysis
8.2.1.1.Definition
8.2.1.2.Market Estimation and Penetration, 2015 – 2022
8.2.1.3.Market Forecast, 2023 – 2031
8.2.1.4.Compound Annual Growth Rate (CAGR)
8.2.1.5.Regional Bifurcation
8.2.1.5.1.North America
8.2.1.5.1.1.Market Estimation, 2015 – 2022
8.2.1.5.1.2.Market Forecast, 2023 – 2031
8.2.1.5.2.Europe
8.2.1.5.2.1.Market Estimation, 2015 – 2022
8.2.1.5.2.2.Market Forecast, 2023 – 2031
8.2.1.5.3.Asia Pacific
8.2.1.5.3.1.Market Estimation, 2015 – 2022
8.2.1.5.3.2.Market Forecast, 2023 – 2031
8.2.1.5.4.Middle East and Africa
8.2.1.5.4.1.Market Estimation, 2015 – 2022
8.2.1.5.4.2.Market Forecast, 2023 – 2031
8.2.1.5.5.Latin America
8.2.1.5.5.1.Market Estimation, 2015 – 2022
8.2.1.5.5.2.Market Forecast, 2023 – 2031
8.2.2.Coal Gasification
8.2.2.1.Definition
8.2.2.2.Market Estimation and Penetration, 2015 – 2022
8.2.2.3.Market Forecast, 2023 – 2031
8.2.2.4.Compound Annual Growth Rate (CAGR)
8.2.2.5.Regional Bifurcation
8.2.2.5.1.North America
8.2.2.5.1.1.Market Estimation, 2015 – 2022
8.2.2.5.1.2.Market Forecast, 2023 – 2031
8.2.2.5.2.Europe
8.2.2.5.2.1.Market Estimation, 2015 – 2022
8.2.2.5.2.2.Market Forecast, 2023 – 2031
8.2.2.5.3.Asia Pacific
8.2.2.5.3.1.Market Estimation, 2015 – 2022
8.2.2.5.3.2.Market Forecast, 2023 – 2031
8.2.2.5.4.Middle East and Africa
8.2.2.5.4.1.Market Estimation, 2015 – 2022
8.2.2.5.4.2.Market Forecast, 2023 – 2031
8.2.2.5.5.Latin America
8.2.2.5.5.1.Market Estimation, 2015 – 2022
8.2.2.5.5.2.Market Forecast, 2023 – 2031
8.2.3.Steam Methane Reforming
8.2.3.1.Definition
8.2.3.2.Market Estimation and Penetration, 2015 – 2022
8.2.3.3.Market Forecast, 2023 – 2031
8.2.3.4.Compound Annual Growth Rate (CAGR)
8.2.3.5.Regional Bifurcation
8.2.3.5.1.North America
8.2.3.5.1.1.Market Estimation, 2015 – 2022
8.2.3.5.1.2.Market Forecast, 2023 – 2031
8.2.3.5.2.Europe
8.2.3.5.2.1.Market Estimation, 2015 – 2022
8.2.3.5.2.2.Market Forecast, 2023 – 2031
8.2.3.5.3.Asia Pacific
8.2.3.5.3.1.Market Estimation, 2015 – 2022
8.2.3.5.3.2.Market Forecast, 2023 – 2031
8.2.3.5.4.Middle East and Africa
8.2.3.5.4.1.Market Estimation, 2015 – 2022
8.2.3.5.4.2.Market Forecast, 2023 – 2031
8.2.3.5.5.Latin America
8.2.3.5.5.1.Market Estimation, 2015 – 2022
8.2.3.5.5.2.Market Forecast, 2023 – 2031
8.2.4.Others
8.2.4.1.Definition
8.2.4.2.Market Estimation and Penetration, 2015 – 2022
8.2.4.3.Market Forecast, 2023 – 2031
8.2.4.4.Compound Annual Growth Rate (CAGR)
8.2.4.5.Regional Bifurcation
8.2.4.5.1.North America
8.2.4.5.1.1.Market Estimation, 2015 – 2022
8.2.4.5.1.2.Market Forecast, 2023 – 2031
8.2.4.5.2.Europe
8.2.4.5.2.1.Market Estimation, 2015 – 2022
8.2.4.5.2.2.Market Forecast, 2023 – 2031
8.2.4.5.3.Asia Pacific
8.2.4.5.3.1.Market Estimation, 2015 – 2022
8.2.4.5.3.2.Market Forecast, 2023 – 2031
8.2.4.5.4.Middle East and Africa
8.2.4.5.4.1.Market Estimation, 2015 – 2022
8.2.4.5.4.2.Market Forecast, 2023 – 2031
8.2.4.5.5.Latin America
8.2.4.5.5.1.Market Estimation, 2015 – 2022
8.2.4.5.5.2.Market Forecast, 2023 – 2031
8.3.Key Segment for Channeling Investments
8.3.1.By Production
9.Global Hydrogen Infrastructure Market Analysis and Forecasts, 2023 – 2031
9.1.Overview
9.2.Global Hydrogen Infrastructure Market Revenue (US$ Mn) and Forecasts, By Storage
9.2.1.Compression
9.2.1.1.Definition
9.2.1.2.Market Estimation and Penetration, 2015 – 2022
9.2.1.3.Market Forecast, 2023 – 2031
9.2.1.4.Compound Annual Growth Rate (CAGR)
9.2.1.5.Regional Bifurcation
9.2.1.5.1.North America
9.2.1.5.1.1.Market Estimation, 2015 – 2022
9.2.1.5.1.2.Market Forecast, 2023 – 2031
9.2.1.5.2.Europe
9.2.1.5.2.1.Market Estimation, 2015 – 2022
9.2.1.5.2.2.Market Forecast, 2023 – 2031
9.2.1.5.3.Asia Pacific
9.2.1.5.3.1.Market Estimation, 2015 – 2022
9.2.1.5.3.2.Market Forecast, 2023 – 2031
9.2.1.5.4.Middle East and Africa
9.2.1.5.4.1.Market Estimation, 2015 – 2022
9.2.1.5.4.2.Market Forecast, 2023 – 2031
9.2.1.5.5.Latin America
9.2.1.5.5.1.Market Estimation, 2015 – 2022
9.2.1.5.5.2.Market Forecast, 2023 – 2031
9.2.2.Liquefaction
9.2.2.1.Definition
9.2.2.2.Market Estimation and Penetration, 2015 – 2022
9.2.2.3.Market Forecast, 2023 – 2031
9.2.2.4.Compound Annual Growth Rate (CAGR)
9.2.2.5.Regional Bifurcation
9.2.2.5.1.North America
9.2.2.5.1.1.Market Estimation, 2015 – 2022
9.2.2.5.1.2.Market Forecast, 2023 – 2031
9.2.2.5.2.Europe
9.2.2.5.2.1.Market Estimation, 2015 – 2022
9.2.2.5.2.2.Market Forecast, 2023 – 2031
9.2.2.5.3.Asia Pacific
9.2.2.5.3.1.Market Estimation, 2015 – 2022
9.2.2.5.3.2.Market Forecast, 2023 – 2031
9.2.2.5.4.Middle East and Africa
9.2.2.5.4.1.Market Estimation, 2015 – 2022
9.2.2.5.4.2.Market Forecast, 2023 – 2031
9.2.2.5.5.Latin America
9.2.2.5.5.1.Market Estimation, 2015 – 2022
9.2.2.5.5.2.Market Forecast, 2023 – 2031
9.2.3. Material Based
9.2.3.1.Definition
9.2.3.2.Market Estimation and Penetration, 2015 – 2022
9.2.3.3.Market Forecast, 2023 – 2031
9.2.3.4.Compound Annual Growth Rate (CAGR)
9.2.3.5.Regional Bifurcation
9.2.3.5.1.North America
9.2.3.5.1.1.Market Estimation, 2015 – 2022
9.2.3.5.1.2.Market Forecast, 2023 – 2031
9.2.3.5.2.Europe
9.2.3.5.2.1.Market Estimation, 2015 – 2022
9.2.3.5.2.2.Market Forecast, 2023 – 2031
9.2.3.5.3.Asia Pacific
9.2.3.5.3.1.Market Estimation, 2015 – 2022
9.2.3.5.3.2.Market Forecast, 2023 – 2031
9.2.3.5.4.Middle East and Africa
9.2.3.5.4.1.Market Estimation, 2015 – 2022
9.2.3.5.4.2.Market Forecast, 2023 – 2031
9.2.3.5.5.Latin America
9.2.3.5.5.1.Market Estimation, 2015 – 2022
9.2.3.5.5.2.Market Forecast, 2023 – 2031
9.3.Key Segment for Channeling Investments
9.3.1.By Storage
10.Global Hydrogen Infrastructure Market Analysis and Forecasts, 2023 – 2031
10.1.Overview
10.2.Global Hydrogen Infrastructure Market Revenue (US$ Mn) and Forecasts, By Delivery
10.2.1.Transportation
10.2.1.1.Definition
10.2.1.2.Market Estimation and Penetration, 2015 – 2022
10.2.1.3.Market Forecast, 2023 – 2031
10.2.1.4.Compound Annual Growth Rate (CAGR)
10.2.1.5.Regional Bifurcation
10.2.1.5.1.North America
10.2.1.5.1.1.Market Estimation, 2015 – 2022
10.2.1.5.1.2.Market Forecast, 2023 – 2031
10.2.1.5.2.Europe
10.2.1.5.2.1.Market Estimation, 2015 – 2022
10.2.1.5.2.2.Market Forecast, 2023 – 2031
10.2.1.5.3.Asia Pacific
10.2.1.5.3.1.Market Estimation, 2015 – 2022
10.2.1.5.3.2.Market Forecast, 2023 – 2031
10.2.1.5.4.Middle East and Africa
10.2.1.5.4.1.Market Estimation, 2015 – 2022
10.2.1.5.4.2.Market Forecast, 2023 – 2031
10.2.1.5.5.Latin America
10.2.1.5.5.1.Market Estimation, 2015 – 2022
10.2.1.5.5.2.Market Forecast, 2023 – 2031
10.2.2.Refinery
10.2.2.1.Definition
10.2.2.2.Market Estimation and Penetration, 2015 – 2022
10.2.2.3.Market Forecast, 2023 – 2031
10.2.2.4.Compound Annual Growth Rate (CAGR)
10.2.2.5.Regional Bifurcation
10.2.2.5.1.North America
10.2.2.5.1.1.Market Estimation, 2015 – 2022
10.2.2.5.1.2.Market Forecast, 2023 – 2031
10.2.2.5.2.Europe
10.2.2.5.2.1.Market Estimation, 2015 – 2022
10.2.2.5.2.2.Market Forecast, 2023 – 2031
10.2.2.5.3.Asia Pacific
10.2.2.5.3.1.Market Estimation, 2015 – 2022
10.2.2.5.3.2.Market Forecast, 2023 – 2031
10.2.2.5.4.Middle East and Africa
10.2.2.5.4.1.Market Estimation, 2015 – 2022
10.2.2.5.4.2.Market Forecast, 2023 – 2031
10.2.2.5.5.Latin America
10.2.2.5.5.1.Market Estimation, 2015 – 2022
10.2.2.5.5.2.Market Forecast, 2023 – 2031
10.2.3.Power Generation
10.2.3.1.Definition
10.2.3.2.Market Estimation and Penetration, 2015 – 2022
10.2.3.3.Market Forecast, 2023 – 2031
10.2.3.4.Compound Annual Growth Rate (CAGR)
10.2.3.5.Regional Bifurcation
10.2.3.5.1.North America
10.2.3.5.1.1.Market Estimation, 2015 – 2022
10.2.3.5.1.2.Market Forecast, 2023 – 2031
10.2.3.5.2.Europe
10.2.3.5.2.1.Market Estimation, 2015 – 2022
10.2.3.5.2.2.Market Forecast, 2023 – 2031
10.2.3.5.3.Asia Pacific
10.2.3.5.3.1.Market Estimation, 2015 – 2022
10.2.3.5.3.2.Market Forecast, 2023 – 2031
10.2.3.5.4.Middle East and Africa
10.2.3.5.4.1.Market Estimation, 2015 – 2022
10.2.3.5.4.2.Market Forecast, 2023 – 2031
10.2.3.5.5.Latin America
10.2.3.5.5.1.Market Estimation, 2015 – 2022
10.2.3.5.5.2.Market Forecast, 2023 – 2031
10.2.4.Hydrogen Refueling Stations
10.2.4.1.Definition
10.2.4.2.Market Estimation and Penetration, 2015 – 2022
10.2.4.3.Market Forecast, 2023 – 2031
10.2.4.4.Compound Annual Growth Rate (CAGR)
10.2.4.5.Regional Bifurcation
10.2.4.5.1.North America
10.2.4.5.1.1.Market Estimation, 2015 – 2022
10.2.4.5.1.2.Market Forecast, 2023 – 2031
10.2.4.5.2.Europe
10.2.4.5.2.1.Market Estimation, 2015 – 2022
10.2.4.5.2.2.Market Forecast, 2023 – 2031
10.2.4.5.3.Asia Pacific
10.2.4.5.3.1.Market Estimation, 2015 – 2022
10.2.4.5.3.2.Market Forecast, 2023 – 2031
10.2.4.5.4.Middle East and Africa
10.2.4.5.4.1.Market Estimation, 2015 – 2022
10.2.4.5.4.2.Market Forecast, 2023 – 2031
10.2.4.5.5.Latin America
10.2.4.5.5.1.Market Estimation, 2015 – 2022
10.2.4.5.5.2.Market Forecast, 2023 – 2031
10.3.Key Segment for Channeling Investments
10.3.1.By Delivery
11.North America Hydrogen Infrastructure Market Analysis and Forecasts, 2023 – 2031
11.1.Overview
11.1.1.North America Hydrogen Infrastructure Market Revenue (US$ Mn)
11.2.North America Hydrogen Infrastructure Market Revenue (US$ Mn) and Forecasts, By Production
11.2.1.Electrolysis
11.2.2.Coal Gasification
11.2.3.Steam Methane Reforming
11.2.4.Others
11.3.North America Hydrogen Infrastructure Market Revenue (US$ Mn) and Forecasts, By Storage
11.3.1.Compression
11.3.2.Liquefaction
11.3.3. Material Based
11.4.North America Hydrogen Infrastructure Market Revenue (US$ Mn) and Forecasts, By Delivery
11.4.1.Transportation
11.4.2.Refinery
11.4.3.Power Generation
11.4.4.Hydrogen Refueling Stations
11.5.North America Hydrogen Infrastructure Market Revenue (US$ Mn) and Forecasts, By Country
11.5.1.U.S
11.5.1.1.U.S Hydrogen Infrastructure Market Revenue (US$ Mn) and Forecasts, By Production
11.5.1.1.1.Electrolysis
11.5.1.1.2.Coal Gasification
11.5.1.1.3.Steam Methane Reforming
11.5.1.1.4.Others
11.5.1.2.U.S Hydrogen Infrastructure Market Revenue (US$ Mn) and Forecasts, By Storage
11.5.1.2.1.Compression
11.5.1.2.2.Liquefaction
11.5.1.2.3. Material Based
11.5.1.3.U.S Hydrogen Infrastructure Market Revenue (US$ Mn) and Forecasts, By Delivery
11.5.1.3.1.Transportation
11.5.1.3.2.Refinery
11.5.1.3.3.Power Generation
11.5.1.3.4.Hydrogen Refueling Stations
11.5.2.Canada
11.5.2.1.Canada Hydrogen Infrastructure Market Revenue (US$ Mn) and Forecasts, By Production
11.5.2.1.1.Electrolysis
11.5.2.1.2.Coal Gasification
11.5.2.1.3.Steam Methane Reforming
11.5.2.1.4.Others
11.5.2.2.Canada Hydrogen Infrastructure Market Revenue (US$ Mn) and Forecasts, By Storage
11.5.2.2.1.Compression
11.5.2.2.2.Liquefaction
11.5.2.2.3. Material Based
11.5.2.3.Canada Hydrogen Infrastructure Market Revenue (US$ Mn) and Forecasts, By Delivery
11.5.2.3.1.Transportation
11.5.2.3.2.Refinery
11.5.2.3.3.Power Generation
11.5.2.3.4.Hydrogen Refueling Stations
11.5.3.Mexico
11.5.3.1.Mexico Hydrogen Infrastructure Market Revenue (US$ Mn) and Forecasts, By Production
11.5.3.1.1.Electrolysis
11.5.3.1.2.Coal Gasification
11.5.3.1.3.Steam Methane Reforming
11.5.3.1.4.Others
11.5.3.2.Mexico Hydrogen Infrastructure Market Revenue (US$ Mn) and Forecasts, By Storage
11.5.3.2.1.Compression
11.5.3.2.2.Liquefaction
11.5.3.2.3. Material Based
11.5.3.3.Mexico Hydrogen Infrastructure Market Revenue (US$ Mn) and Forecasts, By Delivery
11.5.3.3.1.Transportation
11.5.3.3.2.Refinery
11.5.3.3.3.Power Generation
11.5.3.3.4.Hydrogen Refueling Stations
11.5.4.Rest of North America
11.5.4.1.Rest of North America Hydrogen Infrastructure Market Revenue (US$ Mn) and Forecasts, By Production
11.5.4.1.1.Electrolysis
11.5.4.1.2.Coal Gasification
11.5.4.1.3.Steam Methane Reforming
11.5.4.1.4.Others
11.5.4.2.Rest of North America Hydrogen Infrastructure Market Revenue (US$ Mn) and Forecasts, By Storage
11.5.4.2.1.Compression
11.5.4.2.2.Liquefaction
11.5.4.2.3. Material Based
11.5.4.3.Rest of North America Hydrogen Infrastructure Market Revenue (US$ Mn) and Forecasts, By Delivery
11.5.4.3.1.Transportation
11.5.4.3.2.Refinery
11.5.4.3.3.Power Generation
11.5.4.3.4.Hydrogen Refueling Stations
11.6.Key Segment for Channeling Investments
11.6.1.By Country
11.6.2.By Production
11.6.3.By Storage
11.6.4.By Delivery
12.Europe Hydrogen Infrastructure Market Analysis and Forecasts, 2023 – 2031
12.1.Overview
12.1.1.Europe Hydrogen Infrastructure Market Revenue (US$ Mn)
12.2.Europe Hydrogen Infrastructure Market Revenue (US$ Mn) and Forecasts, By Production
12.2.1.Electrolysis
12.2.2.Coal Gasification
12.2.3.Steam Methane Reforming
12.2.4.Others
12.3.Europe Hydrogen Infrastructure Market Revenue (US$ Mn) and Forecasts, By Storage
12.3.1.Compression
12.3.2.Liquefaction
12.3.3. Material Based
12.4.Europe Hydrogen Infrastructure Market Revenue (US$ Mn) and Forecasts, By Delivery
12.4.1.Transportation
12.4.2.Refinery
12.4.3.Power Generation
12.4.4.Hydrogen Refueling Stations
12.5.Europe Hydrogen Infrastructure Market Revenue (US$ Mn) and Forecasts, By Country
12.5.1.France
12.5.1.1.France Hydrogen Infrastructure Market Revenue (US$ Mn) and Forecasts, By Production
12.5.1.1.1.Electrolysis
12.5.1.1.2.Coal Gasification
12.5.1.1.3.Steam Methane Reforming
12.5.1.1.4.Others
12.5.1.2.France Hydrogen Infrastructure Market Revenue (US$ Mn) and Forecasts, By Storage
12.5.1.2.1.Compression
12.5.1.2.2.Liquefaction
12.5.1.2.3. Material Based
12.5.1.3.France Hydrogen Infrastructure Market Revenue (US$ Mn) and Forecasts, By Delivery
12.5.1.3.1.Transportation
12.5.1.3.2.Refinery
12.5.1.3.3.Power Generation
12.5.1.3.4.Hydrogen Refueling Stations
12.5.2.The UK
12.5.2.1.The UK Hydrogen Infrastructure Market Revenue (US$ Mn) and Forecasts, By Production
12.5.2.1.1.Electrolysis
12.5.2.1.2.Coal Gasification
12.5.2.1.3.Steam Methane Reforming
12.5.2.1.4.Others
12.5.2.2.The UK Hydrogen Infrastructure Market Revenue (US$ Mn) and Forecasts, By Storage
12.5.2.2.1.Compression
12.5.2.2.2.Liquefaction
12.5.2.2.3. Material Based
12.5.2.3.The UK Hydrogen Infrastructure Market Revenue (US$ Mn) and Forecasts, By Delivery
12.5.2.3.1.Transportation
12.5.2.3.2.Refinery
12.5.2.3.3.Power Generation
12.5.2.3.4.Hydrogen Refueling Stations
12.5.3.Spain
12.5.3.1.Spain Hydrogen Infrastructure Market Revenue (US$ Mn) and Forecasts, By Production
12.5.3.1.1.Electrolysis
12.5.3.1.2.Coal Gasification
12.5.3.1.3.Steam Methane Reforming
12.5.3.1.4.Others
12.5.3.2.Spain Hydrogen Infrastructure Market Revenue (US$ Mn) and Forecasts, By Storage
12.5.3.2.1.Compression
12.5.3.2.2.Liquefaction
12.5.3.2.3. Material Based
12.5.3.3.Spain Hydrogen Infrastructure Market Revenue (US$ Mn) and Forecasts, By Delivery
12.5.3.3.1.Transportation
12.5.3.3.2.Refinery
12.5.3.3.3.Power Generation
12.5.3.3.4.Hydrogen Refueling Stations
12.5.4.Germany
12.5.4.1.Germany Hydrogen Infrastructure Market Revenue (US$ Mn) and Forecasts, By Production
12.5.4.1.1.Electrolysis
12.5.4.1.2.Coal Gasification
12.5.4.1.3.Steam Methane Reforming
12.5.4.1.4.Others
12.5.4.2.Germany Hydrogen Infrastructure Market Revenue (US$ Mn) and Forecasts, By Storage
12.5.4.2.1.Compression
12.5.4.2.2.Liquefaction
12.5.4.2.3. Material Based
12.5.4.3.Germany Hydrogen Infrastructure Market Revenue (US$ Mn) and Forecasts, By Delivery
12.5.4.3.1.Transportation
12.5.4.3.2.Refinery
12.5.4.3.3.Power Generation
12.5.4.3.4.Hydrogen Refueling Stations
12.5.5.Italy
12.5.5.1.Italy Hydrogen Infrastructure Market Revenue (US$ Mn) and Forecasts, By Production
12.5.5.1.1.Electrolysis
12.5.5.1.2.Coal Gasification
12.5.5.1.3.Steam Methane Reforming
12.5.5.1.4.Others
12.5.5.2.Italy Hydrogen Infrastructure Market Revenue (US$ Mn) and Forecasts, By Storage
12.5.5.2.1.Compression
12.5.5.2.2.Liquefaction
12.5.5.2.3. Material Based
12.5.5.3.Italy Hydrogen Infrastructure Market Revenue (US$ Mn) and Forecasts, By Delivery
12.5.5.3.1.Transportation
12.5.5.3.2.Refinery
12.5.5.3.3.Power Generation
12.5.5.3.4.Hydrogen Refueling Stations
12.5.6.Nordic Countries
12.5.6.1.Nordic Countries Hydrogen Infrastructure Market Revenue (US$ Mn) and Forecasts, By Production
12.5.6.1.1.Electrolysis
12.5.6.1.2.Coal Gasification
12.5.6.1.3.Steam Methane Reforming
12.5.6.1.4.Others
12.5.6.2.Nordic Countries Hydrogen Infrastructure Market Revenue (US$ Mn) and Forecasts, By Storage
12.5.6.2.1.Compression
12.5.6.2.2.Liquefaction
12.5.6.2.3. Material Based
12.5.6.3.Nordic Countries Hydrogen Infrastructure Market Revenue (US$ Mn) and Forecasts, By Delivery
12.5.6.3.1.Transportation
12.5.6.3.2.Refinery
12.5.6.3.3.Power Generation
12.5.6.3.4.Hydrogen Refueling Stations
12.5.6.4.Nordic Countries Hydrogen Infrastructure Market Revenue (US$ Mn) and Forecasts, By Country
12.5.6.4.1.Denmark
12.5.6.4.2.Finland
12.5.6.4.3.Iceland
12.5.6.4.4.Sweden
12.5.6.4.5.Norway
12.5.7.Benelux Union
12.5.7.1.Benelux Union Hydrogen Infrastructure Market Revenue (US$ Mn) and Forecasts, By Production
12.5.7.1.1.Electrolysis
12.5.7.1.2.Coal Gasification
12.5.7.1.3.Steam Methane Reforming
12.5.7.1.4.Others
12.5.7.2.Benelux Union Hydrogen Infrastructure Market Revenue (US$ Mn) and Forecasts, By Storage
12.5.7.2.1.Compression
12.5.7.2.2.Liquefaction
12.5.7.2.3. Material Based
12.5.7.3.Benelux Union Hydrogen Infrastructure Market Revenue (US$ Mn) and Forecasts, By Delivery
12.5.7.3.1.Transportation
12.5.7.3.2.Refinery
12.5.7.3.3.Power Generation
12.5.7.3.4.Hydrogen Refueling Stations
12.5.7.4.Benelux Union Hydrogen Infrastructure Market Revenue (US$ Mn) and Forecasts, By Country
12.5.7.4.1.Belgium
12.5.7.4.2.The Netherlands
12.5.7.4.3.Luxembourg
12.5.8.Rest of Europe
12.5.8.1.Rest of Europe Hydrogen Infrastructure Market Revenue (US$ Mn) and Forecasts, By Production
12.5.8.1.1.Electrolysis
12.5.8.1.2.Coal Gasification
12.5.8.1.3.Steam Methane Reforming
12.5.8.1.4.Others
12.5.8.2.Rest of Europe Hydrogen Infrastructure Market Revenue (US$ Mn) and Forecasts, By Storage
12.5.8.2.1.Compression
12.5.8.2.2.Liquefaction
12.5.8.2.3. Material Based
12.5.8.3.Rest of Europe Hydrogen Infrastructure Market Revenue (US$ Mn) and Forecasts, By Delivery
12.5.8.3.1.Transportation
12.5.8.3.2.Refinery
12.5.8.3.3.Power Generation
12.5.8.3.4.Hydrogen Refueling Stations
12.6.Key Segment for Channeling Investments
12.6.1.By Country
12.6.2.By Production
12.6.3.By Storage
12.6.4.By Delivery
13.Asia Pacific Hydrogen Infrastructure Market Analysis and Forecasts, 2023 – 2031
13.1.Overview
13.1.1.Asia Pacific Hydrogen Infrastructure Market Revenue (US$ Mn)
13.2.Asia Pacific Hydrogen Infrastructure Market Revenue (US$ Mn) and Forecasts, By Production
13.2.1.Electrolysis
13.2.2.Coal Gasification
13.2.3.Steam Methane Reforming
13.2.4.Others
13.3.Asia Pacific Hydrogen Infrastructure Market Revenue (US$ Mn) and Forecasts, By Storage
13.3.1.Compression
13.3.2.Liquefaction
13.3.3. Material Based
13.4.Asia Pacific Hydrogen Infrastructure Market Revenue (US$ Mn) and Forecasts, By Delivery
13.4.1.Transportation
13.4.2.Refinery
13.4.3.Power Generation
13.4.4.Hydrogen Refueling Stations
13.5.Asia Pacific Hydrogen Infrastructure Market Revenue (US$ Mn) and Forecasts, By Country
13.5.1.China
13.5.1.1.China Hydrogen Infrastructure Market Revenue (US$ Mn) and Forecasts, By Production
13.5.1.1.1.Electrolysis
13.5.1.1.2.Coal Gasification
13.5.1.1.3.Steam Methane Reforming
13.5.1.1.4.Others
13.5.1.2.China Hydrogen Infrastructure Market Revenue (US$ Mn) and Forecasts, By Storage
13.5.1.2.1.Compression
13.5.1.2.2.Liquefaction
13.5.1.2.3. Material Based
13.5.1.3.China Hydrogen Infrastructure Market Revenue (US$ Mn) and Forecasts, By Delivery
13.5.1.3.1.Transportation
13.5.1.3.2.Refinery
13.5.1.3.3.Power Generation
13.5.1.3.4.Hydrogen Refueling Stations
13.5.2.Japan
13.5.2.1.Japan Hydrogen Infrastructure Market Revenue (US$ Mn) and Forecasts, By Production
13.5.2.1.1.Electrolysis
13.5.2.1.2.Coal Gasification
13.5.2.1.3.Steam Methane Reforming
13.5.2.1.4.Others
13.5.2.2.Japan Hydrogen Infrastructure Market Revenue (US$ Mn) and Forecasts, By Storage
13.5.2.2.1.Compression
13.5.2.2.2.Liquefaction
13.5.2.2.3. Material Based
13.5.2.3.Japan Hydrogen Infrastructure Market Revenue (US$ Mn) and Forecasts, By Delivery
13.5.2.3.1.Transportation
13.5.2.3.2.Refinery
13.5.2.3.3.Power Generation
13.5.2.3.4.Hydrogen Refueling Stations
13.5.3.India
13.5.3.1.India Hydrogen Infrastructure Market Revenue (US$ Mn) and Forecasts, By Production
13.5.3.1.1.Electrolysis
13.5.3.1.2.Coal Gasification
13.5.3.1.3.Steam Methane Reforming
13.5.3.1.4.Others
13.5.3.2.India Hydrogen Infrastructure Market Revenue (US$ Mn) and Forecasts, By Storage
13.5.3.2.1.Compression
13.5.3.2.2.Liquefaction
13.5.3.2.3. Material Based
13.5.3.3.India Hydrogen Infrastructure Market Revenue (US$ Mn) and Forecasts, By Delivery
13.5.3.3.1.Transportation
13.5.3.3.2.Refinery
13.5.3.3.3.Power Generation
13.5.3.3.4.Hydrogen Refueling Stations
13.5.4.New Zealand
13.5.4.1.New Zealand Hydrogen Infrastructure Market Revenue (US$ Mn) and Forecasts, By Production
13.5.4.1.1.Electrolysis
13.5.4.1.2.Coal Gasification
13.5.4.1.3.Steam Methane Reforming
13.5.4.1.4.Others
13.5.4.2.New Zealand Hydrogen Infrastructure Market Revenue (US$ Mn) and Forecasts, By Storage
13.5.4.2.1.Compression
13.5.4.2.2.Liquefaction
13.5.4.2.3. Material Based
13.5.4.3.New Zealand Hydrogen Infrastructure Market Revenue (US$ Mn) and Forecasts, By Delivery
13.5.4.3.1.Transportation
13.5.4.3.2.Refinery
13.5.4.3.3.Power Generation
13.5.4.3.4.Hydrogen Refueling Stations
13.5.5.Australia
13.5.5.1.Australia Hydrogen Infrastructure Market Revenue (US$ Mn) and Forecasts, By Production
13.5.5.1.1.Electrolysis
13.5.5.1.2.Coal Gasification
13.5.5.1.3.Steam Methane Reforming
13.5.5.1.4.Others
13.5.5.2.Australia Hydrogen Infrastructure Market Revenue (US$ Mn) and Forecasts, By Storage
13.5.5.2.1.Compression
13.5.5.2.2.Liquefaction
13.5.5.2.3. Material Based
13.5.5.3.Australia Hydrogen Infrastructure Market Revenue (US$ Mn) and Forecasts, By Delivery
13.5.5.3.1.Transportation
13.5.5.3.2.Refinery
13.5.5.3.3.Power Generation
13.5.5.3.4.Hydrogen Refueling Stations
13.5.6.South Korea
13.5.6.1.South Korea Hydrogen Infrastructure Market Revenue (US$ Mn) and Forecasts, By Production
13.5.6.1.1.Electrolysis
13.5.6.1.2.Coal Gasification
13.5.6.1.3.Steam Methane Reforming
13.5.6.1.4.Others
13.5.6.2.South Korea Hydrogen Infrastructure Market Revenue (US$ Mn) and Forecasts, By Storage
13.5.6.2.1.Compression
13.5.6.2.2.Liquefaction
13.5.6.2.3. Material Based
13.5.6.3.South Korea Hydrogen Infrastructure Market Revenue (US$ Mn) and Forecasts, By Delivery
13.5.6.3.1.Transportation
13.5.6.3.2.Refinery
13.5.6.3.3.Power Generation
13.5.6.3.4.Hydrogen Refueling Stations
13.5.7.Southeast Asia
13.5.7.1.Southeast Asia Hydrogen Infrastructure Market Revenue (US$ Mn) and Forecasts, By Production
13.5.7.1.1.Electrolysis
13.5.7.1.2.Coal Gasification
13.5.7.1.3.Steam Methane Reforming
13.5.7.1.4.Others
13.5.7.2.Southeast Asia Hydrogen Infrastructure Market Revenue (US$ Mn) and Forecasts, By Storage
13.5.7.2.1.Compression
13.5.7.2.2.Liquefaction
13.5.7.2.3. Material Based
13.5.7.3.Southeast Asia Hydrogen Infrastructure Market Revenue (US$ Mn) and Forecasts, By Delivery
13.5.7.3.1.Transportation
13.5.7.3.2.Refinery
13.5.7.3.3.Power Generation
13.5.7.3.4.Hydrogen Refueling Stations
13.5.7.4.Southeast Asia Hydrogen Infrastructure Market Revenue (US$ Mn) and Forecasts, By Country
13.5.7.4.1.Indonesia
13.5.7.4.2.Thailand
13.5.7.4.3.Malaysia
13.5.7.4.4.Singapore
13.5.7.4.5.Rest of Southeast Asia
13.5.8.Rest of Asia Pacific
13.5.8.1.Rest of Asia Pacific Hydrogen Infrastructure Market Revenue (US$ Mn) and Forecasts, By Production
13.5.8.1.1.Electrolysis
13.5.8.1.2.Coal Gasification
13.5.8.1.3.Steam Methane Reforming
13.5.8.1.4.Others
13.5.8.2.Rest of Asia Pacific Hydrogen Infrastructure Market Revenue (US$ Mn) and Forecasts, By Storage
13.5.8.2.1.Compression
13.5.8.2.2.Liquefaction
13.5.8.2.3. Material Based
13.5.8.3.Rest of Asia Pacific Hydrogen Infrastructure Market Revenue (US$ Mn) and Forecasts, By Delivery
13.5.8.3.1.Transportation
13.5.8.3.2.Refinery
13.5.8.3.3.Power Generation
13.5.8.3.4.Hydrogen Refueling Stations
13.6.Key Segment for Channeling Investments
13.6.1.By Country
13.6.2.By Production
13.6.3.By Storage
13.6.4.By Delivery
14.Middle East and Africa Hydrogen Infrastructure Market Analysis and Forecasts, 2023 – 2031
14.1.Overview
14.1.1.Middle East and Africa Hydrogen Infrastructure Market Revenue (US$ Mn)
14.2.Middle East and Africa Hydrogen Infrastructure Market Revenue (US$ Mn) and Forecasts, By Production
14.2.1.Electrolysis
14.2.2.Coal Gasification
14.2.3.Steam Methane Reforming
14.2.4.Others
14.3.Middle East and Africa Hydrogen Infrastructure Market Revenue (US$ Mn) and Forecasts, By Storage
14.3.1.Compression
14.3.2.Liquefaction
14.3.3. Material Based
14.4.Middle East and Africa Hydrogen Infrastructure Market Revenue (US$ Mn) and Forecasts, By Delivery
14.4.1.Transportation
14.4.2.Refinery
14.4.3.Power Generation
14.4.4.Hydrogen Refueling Stations
14.5.Middle East and Africa Hydrogen Infrastructure Market Revenue (US$ Mn) and Forecasts, By Country
14.5.1.Saudi Arabia
14.5.1.1.Saudi Arabia Hydrogen Infrastructure Market Revenue (US$ Mn) and Forecasts, By Production
14.5.1.1.1.Electrolysis
14.5.1.1.2.Coal Gasification
14.5.1.1.3.Steam Methane Reforming
14.5.1.1.4.Others
14.5.1.2.Saudi Arabia Hydrogen Infrastructure Market Revenue (US$ Mn) and Forecasts, By Storage
14.5.1.2.1.Compression
14.5.1.2.2.Liquefaction
14.5.1.2.3. Material Based
14.5.1.3.Saudi Arabia Hydrogen Infrastructure Market Revenue (US$ Mn) and Forecasts, By Delivery
14.5.1.3.1.Transportation
14.5.1.3.2.Refinery
14.5.1.3.3.Power Generation
14.5.1.3.4.Hydrogen Refueling Stations
14.5.2.UAE
14.5.2.1.UAE Hydrogen Infrastructure Market Revenue (US$ Mn) and Forecasts, By Production
14.5.2.1.1.Electrolysis
14.5.2.1.2.Coal Gasification
14.5.2.1.3.Steam Methane Reforming
14.5.2.1.4.Others
14.5.2.2.UAE Hydrogen Infrastructure Market Revenue (US$ Mn) and Forecasts, By Storage
14.5.2.2.1.Compression
14.5.2.2.2.Liquefaction
14.5.2.2.3. Material Based
14.5.2.3.UAE Hydrogen Infrastructure Market Revenue (US$ Mn) and Forecasts, By Delivery
14.5.2.3.1.Transportation
14.5.2.3.2.Refinery
14.5.2.3.3.Power Generation
14.5.2.3.4.Hydrogen Refueling Stations
14.5.3.Egypt
14.5.3.1.Egypt Hydrogen Infrastructure Market Revenue (US$ Mn) and Forecasts, By Production
14.5.3.1.1.Electrolysis
14.5.3.1.2.Coal Gasification
14.5.3.1.3.Steam Methane Reforming
14.5.3.1.4.Others
14.5.3.2.Egypt Hydrogen Infrastructure Market Revenue (US$ Mn) and Forecasts, By Storage
14.5.3.2.1.Compression
14.5.3.2.2.Liquefaction
14.5.3.2.3. Material Based
14.5.3.3.Egypt Hydrogen Infrastructure Market Revenue (US$ Mn) and Forecasts, By Delivery
14.5.3.3.1.Transportation
14.5.3.3.2.Refinery
14.5.3.3.3.Power Generation
14.5.3.3.4.Hydrogen Refueling Stations
14.5.4.Kuwait
14.5.4.1.Kuwait Hydrogen Infrastructure Market Revenue (US$ Mn) and Forecasts, By Production
14.5.4.1.1.Electrolysis
14.5.4.1.2.Coal Gasification
14.5.4.1.3.Steam Methane Reforming
14.5.4.1.4.Others
14.5.4.2.Kuwait Hydrogen Infrastructure Market Revenue (US$ Mn) and Forecasts, By Storage
14.5.4.2.1.Compression
14.5.4.2.2.Liquefaction
14.5.4.2.3. Material Based
14.5.4.3.Kuwait Hydrogen Infrastructure Market Revenue (US$ Mn) and Forecasts, By Delivery
14.5.4.3.1.Transportation
14.5.4.3.2.Refinery
14.5.4.3.3.Power Generation
14.5.4.3.4.Hydrogen Refueling Stations
14.5.5.South Africa
14.5.5.1.South Africa Hydrogen Infrastructure Market Revenue (US$ Mn) and Forecasts, By Production
14.5.5.1.1.Electrolysis
14.5.5.1.2.Coal Gasification
14.5.5.1.3.Steam Methane Reforming
14.5.5.1.4.Others
14.5.5.2.South Africa Hydrogen Infrastructure Market Revenue (US$ Mn) and Forecasts, By Storage
14.5.5.2.1.Compression
14.5.5.2.2.Liquefaction
14.5.5.2.3. Material Based
14.5.5.3.South Africa Hydrogen Infrastructure Market Revenue (US$ Mn) and Forecasts, By Delivery
14.5.5.3.1.Transportation
14.5.5.3.2.Refinery
14.5.5.3.3.Power Generation
14.5.5.3.4.Hydrogen Refueling Stations
14.5.6.Rest of Middle East & Africa
14.5.6.1.Rest of Middle East & Africa Hydrogen Infrastructure Market Revenue (US$ Mn) and Forecasts, By Production
14.5.6.1.1.Electrolysis
14.5.6.1.2.Coal Gasification
14.5.6.1.3.Steam Methane Reforming
14.5.6.1.4.Others
14.5.6.2.Rest of Middle East & Africa Hydrogen Infrastructure Market Revenue (US$ Mn) and Forecasts, By Storage
14.5.6.2.1.Compression
14.5.6.2.2.Liquefaction
14.5.6.2.3. Material Based
14.5.6.3.Rest of Middle East & Africa Hydrogen Infrastructure Market Revenue (US$ Mn) and Forecasts, By Delivery
14.5.6.3.1.Transportation
14.5.6.3.2.Refinery
14.5.6.3.3.Power Generation
14.5.6.3.4.Hydrogen Refueling Stations
14.6.Key Segment for Channeling Investments
14.6.1.By Country
14.6.2.By Production
14.6.3.By Storage
14.6.4.By Delivery
15.Latin America Hydrogen Infrastructure Market Analysis and Forecasts, 2023 – 2031
15.1.Overview
15.1.1.Latin America Hydrogen Infrastructure Market Revenue (US$ Mn)
15.2.Latin America Hydrogen Infrastructure Market Revenue (US$ Mn) and Forecasts, By Production
15.2.1.Electrolysis
15.2.2.Coal Gasification
15.2.3.Steam Methane Reforming
15.2.4.Others
15.3.Latin America Hydrogen Infrastructure Market Revenue (US$ Mn) and Forecasts, By Storage
15.3.1.Compression
15.3.2.Liquefaction
15.3.3. Material Based
15.4.Latin America Hydrogen Infrastructure Market Revenue (US$ Mn) and Forecasts, By Delivery
15.4.1.Transportation
15.4.2.Refinery
15.4.3.Power Generation
15.4.4.Hydrogen Refueling Stations
15.5.Latin America Hydrogen Infrastructure Market Revenue (US$ Mn) and Forecasts, By Country
15.5.1.Brazil
15.5.1.1.Brazil Hydrogen Infrastructure Market Revenue (US$ Mn) and Forecasts, By Production
15.5.1.1.1.Electrolysis
15.5.1.1.2.Coal Gasification
15.5.1.1.3.Steam Methane Reforming
15.5.1.1.4.Others
15.5.1.2.Brazil Hydrogen Infrastructure Market Revenue (US$ Mn) and Forecasts, By Storage
15.5.1.2.1.Compression
15.5.1.2.2.Liquefaction
15.5.1.2.3. Material Based
15.5.1.3.Brazil Hydrogen Infrastructure Market Revenue (US$ Mn) and Forecasts, By Delivery
15.5.1.3.1.Transportation
15.5.1.3.2.Refinery
15.5.1.3.3.Power Generation
15.5.1.3.4.Hydrogen Refueling Stations
15.5.2.Argentina
15.5.2.1.Argentina Hydrogen Infrastructure Market Revenue (US$ Mn) and Forecasts, By Production
15.5.2.1.1.Electrolysis
15.5.2.1.2.Coal Gasification
15.5.2.1.3.Steam Methane Reforming
15.5.2.1.4.Others
15.5.2.2.Argentina Hydrogen Infrastructure Market Revenue (US$ Mn) and Forecasts, By Storage
15.5.2.2.1.Compression
15.5.2.2.2.Liquefaction
15.5.2.2.3. Material Based
15.5.2.3.Argentina Hydrogen Infrastructure Market Revenue (US$ Mn) and Forecasts, By Delivery
15.5.2.3.1.Transportation
15.5.2.3.2.Refinery
15.5.2.3.3.Power Generation
15.5.2.3.4.Hydrogen Refueling Stations
15.5.3.Rest of Latin America
15.5.3.1.Rest of Latin America Hydrogen Infrastructure Market Revenue (US$ Mn) and Forecasts, By Production
15.5.3.1.1.Electrolysis
15.5.3.1.2.Coal Gasification
15.5.3.1.3.Steam Methane Reforming
15.5.3.1.4.Others
15.5.3.2.Rest of Latin America Hydrogen Infrastructure Market Revenue (US$ Mn) and Forecasts, By Storage
15.5.3.2.1.Compression
15.5.3.2.2.Liquefaction
15.5.3.2.3. Material Based
15.5.3.3.Rest of Latin America Hydrogen Infrastructure Market Revenue (US$ Mn) and Forecasts, By Delivery
15.5.3.3.1.Transportation
15.5.3.3.2.Refinery
15.5.3.3.3.Power Generation
15.5.3.3.4.Hydrogen Refueling Stations
15.6.Key Segment for Channeling Investments
15.6.1.By Country
15.6.2.By Production
15.6.3.By Storage
15.6.4.By Delivery
16.Competitive Benchmarking
16.1.Market Share Analysis, 2022
16.2.Global Presence and Growth Strategies
16.2.1.Mergers and Acquisitions
16.2.2.Product Launches
16.2.3.Investments Trends
16.2.4.R&D Initiatives
17.Player Profiles
17.1.Air Liquide
17.1.1.Company Details
17.1.2.Company Overview
17.1.3.Product Offerings
17.1.4.Key Developments
17.1.5.Financial Analysis
17.1.6.SWOT Analysis
17.1.7.Business Strategies
17.2.Ballard Power Systems
17.2.1.Company Details
17.2.2.Company Overview
17.2.3.Product Offerings
17.2.4.Key Developments
17.2.5.Financial Analysis
17.2.6.SWOT Analysis
17.2.7.Business Strategies
17.3.Cummins, Inc.
17.3.1.Company Details
17.3.2.Company Overview
17.3.3.Product Offerings
17.3.4.Key Developments
17.3.5.Financial Analysis
17.3.6.SWOT Analysis
17.3.7.Business Strategies
17.4.DNV GL
17.4.1.Company Details
17.4.2.Company Overview
17.4.3.Product Offerings
17.4.4.Key Developments
17.4.5.Financial Analysis
17.4.6.SWOT Analysis
17.4.7.Business Strategies
17.5.Engie SA
17.5.1.Company Details
17.5.2.Company Overview
17.5.3.Product Offerings
17.5.4.Key Developments
17.5.5.Financial Analysis
17.5.6.SWOT Analysis
17.5.7.Business Strategies
17.6.ITM Power PLC
17.6.1.Company Details
17.6.2.Company Overview
17.6.3.Product Offerings
17.6.4.Key Developments
17.6.5.Financial Analysis
17.6.6.SWOT Analysis
17.6.7.Business Strategies
17.7.Linde
17.7.1.Company Details
17.7.2.Company Overview
17.7.3.Product Offerings
17.7.4.Key Developments
17.7.5.Financial Analysis
17.7.6.SWOT Analysis
17.7.7.Business Strategies
17.8.McPhy Energy S.A.
17.8.1.Company Details
17.8.2.Company Overview
17.8.3.Product Offerings
17.8.4.Key Developments
17.8.5.Financial Analysis
17.8.6.SWOT Analysis
17.8.7.Business Strategies
17.9.Nel ASA
17.9.1.Company Details
17.9.2.Company Overview
17.9.3.Product Offerings
17.9.4.Key Developments
17.9.5.Financial Analysis
17.9.6.SWOT Analysis
17.9.7.Business Strategies
17.10.Plug Power Inc.
17.10.1.Company Details
17.10.2.Company Overview
17.10.3.Product Offerings
17.10.4.Key Developments
17.10.5.Financial Analysis
17.10.6.SWOT Analysis
17.10.7.Business Strategies
17.11.Shell
17.11.1.Company Details
17.11.2.Company Overview
17.11.3.Product Offerings
17.11.4.Key Developments
17.11.5.Financial Analysis
17.11.6.SWOT Analysis
17.11.7.Business Strategies
17.12.Siemens Energy
17.12.1.Company Details
17.12.2.Company Overview
17.12.3.Product Offerings
17.12.4.Key Developments
17.12.5.Financial Analysis
17.12.6.SWOT Analysis
17.12.7.Business Strategies
17.13.Other market participants
18.Key Findings

.

Note: This ToC is tentative and can be changed according to the research study conducted during the course of report completion.

.

**Exclusive for Multi-User and Enterprise User.

.

Global Hydrogen Infrastructure Market Segmentation

By Production

 Electrolysis
 Coal Gasification
 Steam Methane Reforming
 Others

By Storage

 Compression
 Liquefaction
  Material Based

By Delivery

 Transportation
 Refinery
 Power Generation
 Hydrogen Refueling Stations

By Region

 North America (U.S., Canada, Mexico, Rest of North America)
 Europe (France, The UK, Spain, Germany, Italy, Nordic Countries (Denmark, Finland, Iceland, Sweden, Norway), Benelux Union (Belgium, The Netherlands, Luxembourg), Rest of Europe)
 Asia Pacific (China, Japan, India, New Zealand, Australia, South Korea, Southeast Asia (Indonesia, Thailand, Malaysia, Singapore, Rest of Southeast Asia), Rest of Asia Pacific)
 Middle East & Africa (Saudi Arabia, UAE, Egypt, Kuwait, South Africa, Rest of Middle East & Africa)
 Latin America (Brazil, Argentina, Rest of Latin America)

**Note: The report covers cross-segmentation analysis by region further into countries

.

The Niche Research approach encompasses both primary and secondary research methods to provide comprehensive insights. While primary research is the cornerstone of our studies, we also incorporate secondary research sources such as company annual reports, premium industry databases, press releases, industry journals, and white papers.

Within our primary research, we actively engage with various industry stakeholders, conducting paid interviews and surveys. Our meticulous analysis extends to every market participant in major countries, allowing us to thoroughly examine their portfolios, calculate market shares, and segment revenues.

Our data collection primarily focuses on individual countries within our research scope, enabling us to estimate regional market sizes. Typically, we employ a bottom-up approach, meticulously tracking trends in different countries. We analyze growth drivers, constraints, technological innovations, and opportunities for each country, ultimately arriving at regional figures.Our process begins by examining the growth prospects of each country. Building upon these insights, we project growth and trends for the entire region. Finally, we utilize our proprietary model to refine estimations and forecasts.

Our data validation standards are integral to ensuring the reliability and accuracy of our research findings. Here’s a breakdown of our data validation processes and the stakeholders we engage with during our primary research:

  • Supply Side Analysis: We initiate a supply side analysis by directly contacting market participants, through telephonic interviews and questionnaires containing both open-ended and close-ended questions. We gather information on their portfolios, segment revenues, developments, and growth strategies.
  • Demand Side Analysis: To gain insights into adoption trends and consumer preferences, we reach out to target customers and users (non-vendors). This information forms a vital part of the qualitative analysis section of our reports, covering market dynamics, adoption trends, consumer behavior, spending patterns, and other related aspects.
  • Consultant Insights: We tap into the expertise of our partner consultants from around the world to obtain their unique viewpoints and perspectives. Their insights contribute to a well-rounded understanding of the markets under investigation.
  • In-House Validation: To ensure data accuracy and reliability, we conduct cross-validation of data points and information through our in-house team of consultants and utilize advanced data modeling tools for thorough verification.

The forecasts we provide are based on a comprehensive assessment of various factors, including:

  • Market Trends and Past Performance (Last Five Years): We accurately analyze market trends and performance data from preceding five years to identify historical patterns and understand the market’s evolution.
  • Historical Performance and Growth of Market Participants: We assess the historical performance and growth trajectories of key market participants. This analysis provides insights into the competitive landscape and individual company strategies.
  • Market Determinants Impact Analysis (Next Eight Years): We conduct a rigorous analysis of the factors that are projected to influence the market over the next eight years. This includes assessing both internal and external determinants that can shape market dynamics.
  • Drivers and Challenges for the Forecast Period:Identify the factors expected to drive market growth during the forecast period, as well as the challenges that the industry may face. This analysis aids in deriving an accurate growth rate projection.
  • New Acquisitions, Collaborations, or Partnerships: We keep a close watch on any new acquisitions, collaborations, or partnerships within the industry. These developments can have a significant impact on market dynamics and competitiveness.
  • Macro and Micro Factors Analysis:A thorough examination of both macro-level factors (e.g., economic trends, regulatory changes) and micro-level factors (e.g., technological advancements, consumer preferences) that may influence the market during the forecast period.
  • End-User Sentiment Analysis: To understand the market from the end-user perspective, we conduct sentiment analysis. This involves assessing the sentiment, preferences, and feedback of the end-users, which can provide valuable insights into market trends.
  • Perspective of Primary Participants: Insights gathered directly from primary research participants play a crucial role in shaping our forecasts. Their perspectives and experiences provide valuable qualitative data.
  • Year-on-Year Growth Trend: We utilize a year-on-year growth trend based on historical market growth and expected future trends. This helps in formulating our growth projections, aligning them with the market’s historical performance.

Research process adopted by TNR involves multiple stages, including data collection, validation, quality checks, and presentation. It’s crucial that the data and information we provide add value to your existing market understanding and expertise. We have also established partnerships with business consulting, research, and survey organizations across regions and globally to collaborate on regional analysis and data validation, ensuring the highest level of accuracy and reliability in our reports.


Procure Comprehensive Study of

Global Hydrogen Infrastructure Market

Online Only

  • Online Access
  • Read Only File
  • Validity 3 Months
  • Print, Copy, Paste & Download
  • PPT, Excel
  • Cost-Free Report in the Next Update
$3300
Buy Now

Single User

  • Access to One User on One System
  • Read Only File
  • Validity 6 Months
  • Limited Print,Copy, Paste
  • PPT, Excel
  • Cost-Free Report in the Next Update
$4200
Buy Now

Multi User

  • Access to Fiver Users
  • PDF File
  • Validity 1 Year
  • Upto FivePrints
  • Cost-Free Report in the Next Update
  • PPT, Excel
$6000
Buy Now

Enterprise User

  • Access to Unlimited Users
  • PDF, PPT, Excel
  • Unlimited Validity, Prints&Downloads
  • 1 Hour Cost-Free & Dedicated Analyst Support
  • 10% Cost-Free Customization
  • Cost-Free Report Update Twice in a Year
  • Recommendations for Business Strategies
  • Authorization to Quote TNR, The Niche Research
$7300
Buy Now

Library Access

  • Online Access to Content Publications
  • Access Player Profiles Online
  • Get Immediate Access to Newly Added Content
  • Acquire 12 PDF Downloads
  • Acquire 5 Excel Data Sets
  • Gain Access to 290+ PDFs of Company Profiles
  • Round-the-clock Email and Phone Assistance
  • Dashboard Usage and Trends
  • Renewal & Upgrade Assistance
  • Assessing Customization Options and Alerts for New Reports
$10788
Buy Now
*Taxes/Fees, if applicable will be added during checkout. All prices in USD

Why TNR The Niche Research?

  • Unwavering Commitment to Excellence

  • Veteran Team of Researchers

  • Accurate and Timely Insights

  • Ethical Practices and Customized Service

  • Uninterrupted Availability Around the Clock

Scroll to Top