Global Liquid Hydrogen Market By Distribution, By End Use Industry, By Region: Global Insights, Growth, Size, Comparative Analysis, Trends and Forecast, 2023 – 2031

  • Industry: Chemicals & Materials
  • Report ID: TNR-110-1016
  • Number of Pages: 420
  • Table/Charts : Yes
  • November, 2023
  • Base Year : 2024
  • No. of Companies : 9+
  • No. of Countries : 29
  • Views : 10118
  • Covid Impact Covered: Yes
  • War Impact Covered: Yes
  • Formats : PDF, Excel, PPT

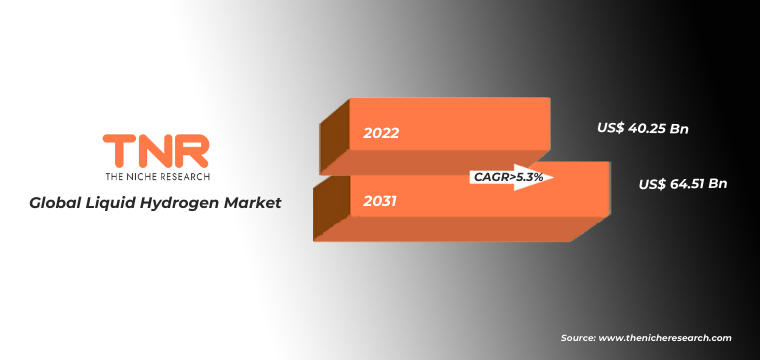
Global Liquid Hydrogen Market Accounted for US$ 40.25 Billion in 2022, Growing at an Estimated CAGR of 5.3% from 2023-2031.

Liquid Hydrogen is a cryogenic, colorless, and odorless form of hydrogen gas cooled to extremely low temperatures, around -423°F (-253°C). It’s stored and transported as a liquid due to its high energy density, making it a crucial component in various applications, including rocket propulsion, hydrogen fuel cells, and as an alternative clean energy source.

In the global liquid hydrogen market by distribution, cryogenic tanks segment holds the largest share. These tanks are widely used for storing and transporting liquid hydrogen due to their efficiency and ability to maintain extremely low temperatures. Cryogenic tank technology has been well-established and trusted in various applications, including industrial processes, rocket propulsion, and as a feedstock for hydrogen production.

Global Liquid Hydrogen Market Revenue & Volume Forecast, (US$ Million & Kilo Tons), 2015 – 2031

COVID-19 Impact Analysis on Global Liquid Hydrogen Market

Pre-COVID-19, the liquid hydrogen market was gradually expanding due to increasing interest in clean energy solutions and advancements in hydrogen technologies. However, the pandemic disrupted supply chains and led to uncertainties, affecting market growth. Post-COVID-19, the focus on decarbonization and renewable energy sources accelerated, reviving the Liquid Hydrogen Market. Investments in green hydrogen production and hydrogen-powered transportation surged as countries aimed to recover with sustainable energy solutions, highlighting the resilience and potential of the market in a post-pandemic world.

One of the key drivers of the liquid hydrogen market is the global transition towards clean energy sources. Hydrogen is gaining prominence as a clean and versatile energy carrier. According to the International Energy Agency (IEA), hydrogen’s use in fuel cells and industrial processes could reduce annual CO2 emissions by up to 830 million tons by 2030. Governments and industries are investing heavily in hydrogen infrastructure and production, with the European Union alone planning to invest €40 billion in hydrogen-related projects. This driver is fueled by the urgency to reduce carbon emissions and combat climate change, making hydrogen an integral part of the clean energy transition.

A significant restraint in the liquid hydrogen market is the cost of production and the need for extensive infrastructure development. The production of green hydrogen, using renewable energy sources, is cost-intensive, hindering its widespread adoption. According to the Hydrogen Council, the cost of green hydrogen production needs to decrease by 50% to 75% to be competitive with other forms of hydrogen. Moreover, establishing a hydrogen distribution network, including pipelines and storage facilities, requires substantial investments. This presents a barrier to entry and widespread deployment, slowing down the market’s growth, especially in regions with limited hydrogen infrastructure.

Among end-use industries, the industrial sector was the dominating segment in the global liquid hydrogen market in 2022. It utilized liquid hydrogen for various industrial processes, including petrochemical production and as a feedstock for hydrogenation reactions. For example, in the chemical industry, liquid hydrogen is used for hydrocracking processes, which refine and upgrade hydrocarbons.

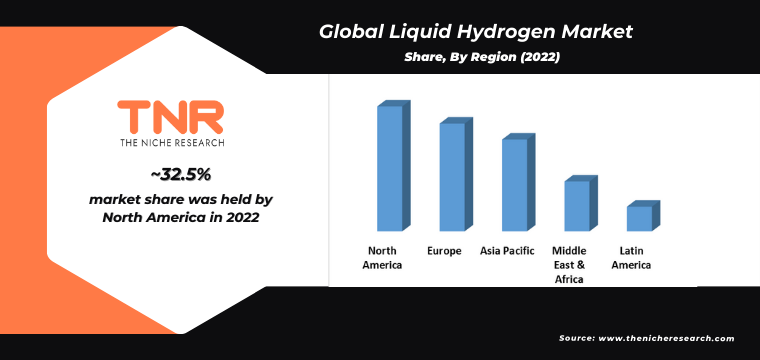
North America accounted for almost 40% of the global liquid hydrogen market in 2022. The region has well-established infrastructure and applications for liquid hydrogen, including aerospace and energy sectors. For instance, the U.S. is a major player in space exploration and utilizes liquid hydrogen as rocket fuel. Additionally, initiatives like the U.S. National Hydrogen and Fuel Cell Roadmap emphasized the strategic importance of hydrogen, supporting its dominance in the market.

Competitive Landscape: Global Liquid Hydrogen Market

  • Air Liquide
  • Air Products and Chemicals, Inc.
  • Cryolor
  • Hylium Industries, Inc.
  • INOX India Limited
  • Iwatani Corporation
  • Linde plc
  • Messer SE & Co. KGaA
  • Plug Power Inc.
  • Other Industry Participants

Global Liquid Hydrogen Market Report Coverage

Report Specifications Details
Market Revenue in 2022 US$ 40.25 Billion
Market Size Forecast by 2031 US$  64.51 Billion
Growth Rate (CAGR) 5.3%
Historic Data 2015 – 2021
Base Year for Estimation 2022
Forecast Period 2023 – 2031
Report Inclusions Market Size & Estimates, Market Dynamics, Competitive Scenario, Trends, Growth Factors, Market Determinants, Key Investment Segmentation, Product/Service/Solutions Benchmarking
Segments Covered By Distribution, By End Use Industry
Regions Covered North America, Europe, Asia Pacific, Middle East & Africa, Latin America
Countries Covered U.S., Canada, Mexico, Rest of North America,  France, The UK, Spain, Germany, Italy, Nordic Countries (Denmark, Finland, Iceland, Sweden, Norway), Benelux Union (Belgium, The Netherlands, Luxembourg), Rest of Europe,  China, Japan, India, New Zealand, Australia, South Korea, Southeast Asia (Indonesia, Thailand, Malaysia, Singapore, Rest of Southeast Asia), Rest of Asia Pacific,  Saudi Arabia, UAE, Egypt, Kuwait, South Africa, Rest of Middle East & Africa,  Brazil, Argentina, Rest of Latin America
Key Players Air Liquide, Air Products and Chemicals, Inc., Cryolor, Hylium Industries, Inc., INOX India Limited, Iwatani Corporation, Linde plc, Messer SE & Co. KGaA, Plug Power Inc., Other Industry Participants
Customization Scope Customization allows for the inclusion/modification of content pertaining to geographical regions, countries, and specific market segments.
Pricing & Procurement Options Explore purchase options tailored to your specific research requirements
Contact Details Consult With Our Expert

Japan (Toll-Free): – +81 663-386-8111

South Korea (Toll-Free): – +82-808- 703-126

Saudi Arabia (Toll-Free): – +966 800 850 1643

United States: +1 302-232-5106

United Kingdom: +447537105080

E-mail:  askanexpert@thenicheresearh.com


Global Liquid Hydrogen Market:

By Distribution

  • Pipelines
  • Cryogenic Tanks
  • Others

By End Use Industry

  • Aerospace
  • Automotive and Transportation
  • Energy and Power
  • Industrial Sector
  • Others

By Region

  • North America (U.S., Canada, Mexico, Rest of North America)
  • Europe (France, The UK, Spain, Germany, Italy, Nordic Countries (Denmark, Finland, Iceland, Sweden, Norway), Benelux Union (Belgium, The Netherlands, Luxembourg), Rest of Europe)
  • Asia Pacific (China, Japan, India, New Zealand, Australia, South Korea, Southeast Asia (Indonesia, Thailand, Malaysia, Singapore, Rest of Southeast Asia), Rest of Asia Pacific)
  • Middle East & Africa (Saudi Arabia, UAE, Egypt, Kuwait, South Africa, Rest of Middle East & Africa)
  • Latin America (Brazil, Argentina, Rest of Latin America)

Report Coverage and Deliverables: LINK


Table of Contents

.

1.Market Scope
1.1.Market Segmentation
1.2.Years Considered
1.2.1.Historic Years: 2015 – 2021
1.2.2.Base Year: 2022
1.2.3.Forecast Years: 2023 – 2031
2.Key Target Audiences
3.Research Methodology
3.1.Primary Research
3.1.1.Research Questionnaire
3.1.2.Global Percentage Breakdown
3.1.3.Primary Interviews: Key Opinion Leaders (KOLs)
3.2.Secondary Research
3.2.1.Paid Databases
3.2.2.Secondary Sources
3.3.Market Size Estimates
3.3.1.Top-Down Approach
3.3.2.Bottom-Up Approach
3.4.Data Triangulation Methodology
3.5.Research Assumptions
4.Recommendations and Insights from TNR’s Perspective**
5.Holistic Overview of Liquid Hydrogen Market
6.Market Synopsis: Liquid Hydrogen Market
7.Liquid Hydrogen Market Analysis: Qualitative Perspective
7.1.Introduction
7.1.1.Product Definition
7.1.2.Industry Development
7.2.Market Dynamics
7.2.1.Drivers
7.2.2.Restraints
7.2.3.Opportunities
7.2.4.Challenges
7.3.Trends in Liquid Hydrogen Market
7.4.Market Determinants Radar Chart
7.5.Macro-Economic and Micro-Economic Indicators: Liquid Hydrogen Market
7.6.Porter’s Five Force Analysis
7.7.Impact of Covid-19 on Liquid Hydrogen Market
8.Global Liquid Hydrogen Market Analysis and Forecasts, 2023 – 2031
8.1.Overview
8.1.1.Global Liquid Hydrogen Market Revenue & Volume (US$ Mn & Kilo Tons)
8.2.Global Liquid Hydrogen Market Revenue & Volume (US$ Mn & Kilo Tons) and Forecasts, By Distribution
8.2.1.Pipelines
8.2.1.1.Definition
8.2.1.2.Market Estimation and Penetration, 2015 – 2022
8.2.1.3.Market Forecast, 2023 – 2031
8.2.1.4.Compound Annual Growth Rate (CAGR)
8.2.1.5.Regional Bifurcation
8.2.1.5.1.North America
8.2.1.5.1.1.Market Estimation, 2015 – 2022
8.2.1.5.1.2.Market Forecast, 2023 – 2031
8.2.1.5.2.Europe
8.2.1.5.2.1.Market Estimation, 2015 – 2022
8.2.1.5.2.2.Market Forecast, 2023 – 2031
8.2.1.5.3.Asia Pacific
8.2.1.5.3.1.Market Estimation, 2015 – 2022
8.2.1.5.3.2.Market Forecast, 2023 – 2031
8.2.1.5.4.Middle East and Africa
8.2.1.5.4.1.Market Estimation, 2015 – 2022
8.2.1.5.4.2.Market Forecast, 2023 – 2031
8.2.1.5.5.Latin America
8.2.1.5.5.1.Market Estimation, 2015 – 2022
8.2.1.5.5.2.Market Forecast, 2023 – 2031
8.2.2.Cryogenic Tanks
8.2.2.1.Definition
8.2.2.2.Market Estimation and Penetration, 2015 – 2022
8.2.2.3.Market Forecast, 2023 – 2031
8.2.2.4.Compound Annual Growth Rate (CAGR)
8.2.2.5.Regional Bifurcation
8.2.2.5.1.North America
8.2.2.5.1.1.Market Estimation, 2015 – 2022
8.2.2.5.1.2.Market Forecast, 2023 – 2031
8.2.2.5.2.Europe
8.2.2.5.2.1.Market Estimation, 2015 – 2022
8.2.2.5.2.2.Market Forecast, 2023 – 2031
8.2.2.5.3.Asia Pacific
8.2.2.5.3.1.Market Estimation, 2015 – 2022
8.2.2.5.3.2.Market Forecast, 2023 – 2031
8.2.2.5.4.Middle East and Africa
8.2.2.5.4.1.Market Estimation, 2015 – 2022
8.2.2.5.4.2.Market Forecast, 2023 – 2031
8.2.2.5.5.Latin America
8.2.2.5.5.1.Market Estimation, 2015 – 2022
8.2.2.5.5.2.Market Forecast, 2023 – 2031
8.2.3.Others
8.2.3.1.Definition
8.2.3.2.Market Estimation and Penetration, 2015 – 2022
8.2.3.3.Market Forecast, 2023 – 2031
8.2.3.4.Compound Annual Growth Rate (CAGR)
8.2.3.5.Regional Bifurcation
8.2.3.5.1.North America
8.2.3.5.1.1.Market Estimation, 2015 – 2022
8.2.3.5.1.2.Market Forecast, 2023 – 2031
8.2.3.5.2.Europe
8.2.3.5.2.1.Market Estimation, 2015 – 2022
8.2.3.5.2.2.Market Forecast, 2023 – 2031
8.2.3.5.3.Asia Pacific
8.2.3.5.3.1.Market Estimation, 2015 – 2022
8.2.3.5.3.2.Market Forecast, 2023 – 2031
8.2.3.5.4.Middle East and Africa
8.2.3.5.4.1.Market Estimation, 2015 – 2022
8.2.3.5.4.2.Market Forecast, 2023 – 2031
8.2.3.5.5.Latin America
8.2.3.5.5.1.Market Estimation, 2015 – 2022
8.2.3.5.5.2.Market Forecast, 2023 – 2031
8.3.Key Segment for Channeling Investments
8.3.1.By Distribution
9.Global Liquid Hydrogen Market Analysis and Forecasts, 2023 – 2031
9.1.Overview
9.2.Global Liquid Hydrogen Market Revenue & Volume (US$ Mn & Kilo Tons) and Forecasts, By End Use Industry
9.2.1.Aerospace
9.2.1.1.Definition
9.2.1.2.Market Estimation and Penetration, 2015 – 2022
9.2.1.3.Market Forecast, 2023 – 2031
9.2.1.4.Compound Annual Growth Rate (CAGR)
9.2.1.5.Regional Bifurcation
9.2.1.5.1.North America
9.2.1.5.1.1.Market Estimation, 2015 – 2022
9.2.1.5.1.2.Market Forecast, 2023 – 2031
9.2.1.5.2.Europe
9.2.1.5.2.1.Market Estimation, 2015 – 2022
9.2.1.5.2.2.Market Forecast, 2023 – 2031
9.2.1.5.3.Asia Pacific
9.2.1.5.3.1.Market Estimation, 2015 – 2022
9.2.1.5.3.2.Market Forecast, 2023 – 2031
9.2.1.5.4.Middle East and Africa
9.2.1.5.4.1.Market Estimation, 2015 – 2022
9.2.1.5.4.2.Market Forecast, 2023 – 2031
9.2.1.5.5.Latin America
9.2.1.5.5.1.Market Estimation, 2015 – 2022
9.2.1.5.5.2.Market Forecast, 2023 – 2031
9.2.2.Automotive and Transportation
9.2.2.1.Definition
9.2.2.2.Market Estimation and Penetration, 2015 – 2022
9.2.2.3.Market Forecast, 2023 – 2031
9.2.2.4.Compound Annual Growth Rate (CAGR)
9.2.2.5.Regional Bifurcation
9.2.2.5.1.North America
9.2.2.5.1.1.Market Estimation, 2015 – 2022
9.2.2.5.1.2.Market Forecast, 2023 – 2031
9.2.2.5.2.Europe
9.2.2.5.2.1.Market Estimation, 2015 – 2022
9.2.2.5.2.2.Market Forecast, 2023 – 2031
9.2.2.5.3.Asia Pacific
9.2.2.5.3.1.Market Estimation, 2015 – 2022
9.2.2.5.3.2.Market Forecast, 2023 – 2031
9.2.2.5.4.Middle East and Africa
9.2.2.5.4.1.Market Estimation, 2015 – 2022
9.2.2.5.4.2.Market Forecast, 2023 – 2031
9.2.2.5.5.Latin America
9.2.2.5.5.1.Market Estimation, 2015 – 2022
9.2.2.5.5.2.Market Forecast, 2023 – 2031
9.2.3.Energy and Power
9.2.3.1.Definition
9.2.3.2.Market Estimation and Penetration, 2015 – 2022
9.2.3.3.Market Forecast, 2023 – 2031
9.2.3.4.Compound Annual Growth Rate (CAGR)
9.2.3.5.Regional Bifurcation
9.2.3.5.1.North America
9.2.3.5.1.1.Market Estimation, 2015 – 2022
9.2.3.5.1.2.Market Forecast, 2023 – 2031
9.2.3.5.2.Europe
9.2.3.5.2.1.Market Estimation, 2015 – 2022
9.2.3.5.2.2.Market Forecast, 2023 – 2031
9.2.3.5.3.Asia Pacific
9.2.3.5.3.1.Market Estimation, 2015 – 2022
9.2.3.5.3.2.Market Forecast, 2023 – 2031
9.2.3.5.4.Middle East and Africa
9.2.3.5.4.1.Market Estimation, 2015 – 2022
9.2.3.5.4.2.Market Forecast, 2023 – 2031
9.2.3.5.5.Latin America
9.2.3.5.5.1.Market Estimation, 2015 – 2022
9.2.3.5.5.2.Market Forecast, 2023 – 2031
9.2.4.Industrial Sector
9.2.4.1.Definition
9.2.4.2.Market Estimation and Penetration, 2015 – 2022
9.2.4.3.Market Forecast, 2023 – 2031
9.2.4.4.Compound Annual Growth Rate (CAGR)
9.2.4.5.Regional Bifurcation
9.2.4.5.1.North America
9.2.4.5.1.1.Market Estimation, 2015 – 2022
9.2.4.5.1.2.Market Forecast, 2023 – 2031
9.2.4.5.2.Europe
9.2.4.5.2.1.Market Estimation, 2015 – 2022
9.2.4.5.2.2.Market Forecast, 2023 – 2031
9.2.4.5.3.Asia Pacific
9.2.4.5.3.1.Market Estimation, 2015 – 2022
9.2.4.5.3.2.Market Forecast, 2023 – 2031
9.2.4.5.4.Middle East and Africa
9.2.4.5.4.1.Market Estimation, 2015 – 2022
9.2.4.5.4.2.Market Forecast, 2023 – 2031
9.2.4.5.5.Latin America
9.2.4.5.5.1.Market Estimation, 2015 – 2022
9.2.4.5.5.2.Market Forecast, 2023 – 2031
9.2.5.Others
9.2.5.1.Definition
9.2.5.2.Market Estimation and Penetration, 2015 – 2022
9.2.5.3.Market Forecast, 2023 – 2031
9.2.5.4.Compound Annual Growth Rate (CAGR)
9.2.5.5.Regional Bifurcation
9.2.5.5.1.North America
9.2.5.5.1.1.Market Estimation, 2015 – 2022
9.2.5.5.1.2.Market Forecast, 2023 – 2031
9.2.5.5.2.Europe
9.2.5.5.2.1.Market Estimation, 2015 – 2022
9.2.5.5.2.2.Market Forecast, 2023 – 2031
9.2.5.5.3.Asia Pacific
9.2.5.5.3.1.Market Estimation, 2015 – 2022
9.2.5.5.3.2.Market Forecast, 2023 – 2031
9.2.5.5.4.Middle East and Africa
9.2.5.5.4.1.Market Estimation, 2015 – 2022
9.2.5.5.4.2.Market Forecast, 2023 – 2031
9.2.5.5.5.Latin America
9.2.5.5.5.1.Market Estimation, 2015 – 2022
9.2.5.5.5.2.Market Forecast, 2023 – 2031
9.3.Key Segment for Channeling Investments
9.3.1.By End Use Industry
10.North America Liquid Hydrogen Market Analysis and Forecasts, 2023 – 2031
10.1.Overview
10.1.1.North America Liquid Hydrogen Market Revenue & Volume (US$ Mn & Kilo Tons)
10.2.North America Liquid Hydrogen Market Revenue & Volume (US$ Mn & Kilo Tons) and Forecasts, By Distribution
10.2.1.Pipelines
10.2.2.Cryogenic Tanks
10.2.3.Others
10.3.North America Liquid Hydrogen Market Revenue & Volume (US$ Mn & Kilo Tons) and Forecasts, By End Use Industry
10.3.1.Aerospace
10.3.2.Automotive and Transportation
10.3.3.Energy and Power
10.3.4.Industrial Sector
10.3.5.Others
10.4.North America Liquid Hydrogen Market Revenue & Volume (US$ Mn & Kilo Tons) and Forecasts, By Country
10.4.1.U.S
10.4.1.1.U.S Liquid Hydrogen Market Revenue & Volume (US$ Mn & Kilo Tons) and Forecasts, By Distribution
10.4.1.1.1.Pipelines
10.4.1.1.2.Cryogenic Tanks
10.4.1.1.3.Others
10.4.1.2.U.S Liquid Hydrogen Market Revenue & Volume (US$ Mn & Kilo Tons) and Forecasts, By End Use Industry
10.4.1.2.1.Aerospace
10.4.1.2.2.Automotive and Transportation
10.4.1.2.3.Energy and Power
10.4.1.2.4.Industrial Sector
10.4.1.2.5.Others
10.4.2.Canada
10.4.2.1.Canada Liquid Hydrogen Market Revenue & Volume (US$ Mn & Kilo Tons) and Forecasts, By Distribution
10.4.2.1.1.Pipelines
10.4.2.1.2.Cryogenic Tanks
10.4.2.1.3.Others
10.4.2.2.Canada Liquid Hydrogen Market Revenue & Volume (US$ Mn & Kilo Tons) and Forecasts, By End Use Industry
10.4.2.2.1.Aerospace
10.4.2.2.2.Automotive and Transportation
10.4.2.2.3.Energy and Power
10.4.2.2.4.Industrial Sector
10.4.2.2.5.Others
10.4.3.Mexico
10.4.3.1.Mexico Liquid Hydrogen Market Revenue & Volume (US$ Mn & Kilo Tons) and Forecasts, By Distribution
10.4.3.1.1.Pipelines
10.4.3.1.2.Cryogenic Tanks
10.4.3.1.3.Others
10.4.3.2.Mexico Liquid Hydrogen Market Revenue & Volume (US$ Mn & Kilo Tons) and Forecasts, By End Use Industry
10.4.3.2.1.Aerospace
10.4.3.2.2.Automotive and Transportation
10.4.3.2.3.Energy and Power
10.4.3.2.4.Industrial Sector
10.4.3.2.5.Others
10.4.4.Rest of North America
10.4.4.1.Rest of North America Liquid Hydrogen Market Revenue & Volume (US$ Mn & Kilo Tons) and Forecasts, By Distribution
10.4.4.1.1.Pipelines
10.4.4.1.2.Cryogenic Tanks
10.4.4.1.3.Others
10.4.4.2.Rest of North America Liquid Hydrogen Market Revenue & Volume (US$ Mn & Kilo Tons) and Forecasts, By End Use Industry
10.4.4.2.1.Aerospace
10.4.4.2.2.Automotive and Transportation
10.4.4.2.3.Energy and Power
10.4.4.2.4.Industrial Sector
10.4.4.2.5.Others
10.5.Key Segment for Channeling Investments
10.5.1.By Country
10.5.2.By Distribution
10.5.3.By End Use Industry
11.Europe Liquid Hydrogen Market Analysis and Forecasts, 2023 – 2031
11.1.Overview
11.1.1.Europe Liquid Hydrogen Market Revenue & Volume (US$ Mn & Kilo Tons)
11.2.Europe Liquid Hydrogen Market Revenue & Volume (US$ Mn & Kilo Tons) and Forecasts, By Distribution
11.2.1.Pipelines
11.2.2.Cryogenic Tanks
11.2.3.Others
11.3.Europe Liquid Hydrogen Market Revenue & Volume (US$ Mn & Kilo Tons) and Forecasts, By End Use Industry
11.3.1.Aerospace
11.3.2.Automotive and Transportation
11.3.3.Energy and Power
11.3.4.Industrial Sector
11.3.5.Others
11.4.Europe Liquid Hydrogen Market Revenue & Volume (US$ Mn & Kilo Tons) and Forecasts, By Country
11.4.1.France
11.4.1.1.France Liquid Hydrogen Market Revenue & Volume (US$ Mn & Kilo Tons) and Forecasts, By Distribution
11.4.1.1.1.Pipelines
11.4.1.1.2.Cryogenic Tanks
11.4.1.1.3.Others
11.4.1.2.France Liquid Hydrogen Market Revenue & Volume (US$ Mn & Kilo Tons) and Forecasts, By End Use Industry
11.4.1.2.1.Aerospace
11.4.1.2.2.Automotive and Transportation
11.4.1.2.3.Energy and Power
11.4.1.2.4.Industrial Sector
11.4.1.2.5.Others
11.4.2.The UK
11.4.2.1.The UK Liquid Hydrogen Market Revenue & Volume (US$ Mn & Kilo Tons) and Forecasts, By Distribution
11.4.2.1.1.Pipelines
11.4.2.1.2.Cryogenic Tanks
11.4.2.1.3.Others
11.4.2.2.The UK Liquid Hydrogen Market Revenue & Volume (US$ Mn & Kilo Tons) and Forecasts, By End Use Industry
11.4.2.2.1.Aerospace
11.4.2.2.2.Automotive and Transportation
11.4.2.2.3.Energy and Power
11.4.2.2.4.Industrial Sector
11.4.2.2.5.Others
11.4.3.Spain
11.4.3.1.Spain Liquid Hydrogen Market Revenue & Volume (US$ Mn & Kilo Tons) and Forecasts, By Distribution
11.4.3.1.1.Pipelines
11.4.3.1.2.Cryogenic Tanks
11.4.3.1.3.Others
11.4.3.2.Spain Liquid Hydrogen Market Revenue & Volume (US$ Mn & Kilo Tons) and Forecasts, By End Use Industry
11.4.3.2.1.Aerospace
11.4.3.2.2.Automotive and Transportation
11.4.3.2.3.Energy and Power
11.4.3.2.4.Industrial Sector
11.4.3.2.5.Others
11.4.4.Germany
11.4.4.1.Germany Liquid Hydrogen Market Revenue & Volume (US$ Mn & Kilo Tons) and Forecasts, By Distribution
11.4.4.1.1.Pipelines
11.4.4.1.2.Cryogenic Tanks
11.4.4.1.3.Others
11.4.4.2.Germany Liquid Hydrogen Market Revenue & Volume (US$ Mn & Kilo Tons) and Forecasts, By End Use Industry
11.4.4.2.1.Aerospace
11.4.4.2.2.Automotive and Transportation
11.4.4.2.3.Energy and Power
11.4.4.2.4.Industrial Sector
11.4.4.2.5.Others
11.4.5.Italy
11.4.5.1.Italy Liquid Hydrogen Market Revenue & Volume (US$ Mn & Kilo Tons) and Forecasts, By Distribution
11.4.5.1.1.Pipelines
11.4.5.1.2.Cryogenic Tanks
11.4.5.1.3.Others
11.4.5.2.Italy Liquid Hydrogen Market Revenue & Volume (US$ Mn & Kilo Tons) and Forecasts, By End Use Industry
11.4.5.2.1.Aerospace
11.4.5.2.2.Automotive and Transportation
11.4.5.2.3.Energy and Power
11.4.5.2.4.Industrial Sector
11.4.5.2.5.Others
11.4.6.Nordic Countries
11.4.6.1.Nordic Countries Liquid Hydrogen Market Revenue & Volume (US$ Mn & Kilo Tons) and Forecasts, By Distribution
11.4.6.1.1.Pipelines
11.4.6.1.2.Cryogenic Tanks
11.4.6.1.3.Others
11.4.6.2.Nordic Countries Liquid Hydrogen Market Revenue & Volume (US$ Mn & Kilo Tons) and Forecasts, By End Use Industry
11.4.6.2.1.Aerospace
11.4.6.2.2.Automotive and Transportation
11.4.6.2.3.Energy and Power
11.4.6.2.4.Industrial Sector
11.4.6.2.5.Others
11.4.6.3.Nordic Countries Liquid Hydrogen Market Revenue & Volume (US$ Mn & Kilo Tons) and Forecasts, By Country
11.4.6.3.1.Denmark
11.4.6.3.2.Finland
11.4.6.3.3.Iceland
11.4.6.3.4.Sweden
11.4.6.3.5.Norway
11.4.7.Benelux Union
11.4.7.1.Benelux Union Liquid Hydrogen Market Revenue & Volume (US$ Mn & Kilo Tons) and Forecasts, By Distribution
11.4.7.1.1.Pipelines
11.4.7.1.2.Cryogenic Tanks
11.4.7.1.3.Others
11.4.7.2.Benelux Union Liquid Hydrogen Market Revenue & Volume (US$ Mn & Kilo Tons) and Forecasts, By End Use Industry
11.4.7.2.1.Aerospace
11.4.7.2.2.Automotive and Transportation
11.4.7.2.3.Energy and Power
11.4.7.2.4.Industrial Sector
11.4.7.2.5.Others
11.4.7.3.Benelux Union Liquid Hydrogen Market Revenue & Volume (US$ Mn & Kilo Tons) and Forecasts, By Country
11.4.7.3.1.Belgium
11.4.7.3.2.The Netherlands
11.4.7.3.3.Luxembourg
11.4.8.Rest of Europe
11.4.8.1.Rest of Europe Liquid Hydrogen Market Revenue & Volume (US$ Mn & Kilo Tons) and Forecasts, By Distribution
11.4.8.1.1.Pipelines
11.4.8.1.2.Cryogenic Tanks
11.4.8.1.3.Others
11.4.8.2.Rest of Europe Liquid Hydrogen Market Revenue & Volume (US$ Mn & Kilo Tons) and Forecasts, By End Use Industry
11.4.8.2.1.Aerospace
11.4.8.2.2.Automotive and Transportation
11.4.8.2.3.Energy and Power
11.4.8.2.4.Industrial Sector
11.4.8.2.5.Others
11.5.Key Segment for Channeling Investments
11.5.1.By Country
11.5.2.By Distribution
11.5.3.By End Use Industry
12.Asia Pacific Liquid Hydrogen Market Analysis and Forecasts, 2023 – 2031
12.1.Overview
12.1.1.Asia Pacific Liquid Hydrogen Market Revenue & Volume (US$ Mn & Kilo Tons)
12.2.Asia Pacific Liquid Hydrogen Market Revenue & Volume (US$ Mn & Kilo Tons) and Forecasts, By Distribution
12.2.1.Pipelines
12.2.2.Cryogenic Tanks
12.2.3.Others
12.3.Asia Pacific Liquid Hydrogen Market Revenue & Volume (US$ Mn & Kilo Tons) and Forecasts, By End Use Industry
12.3.1.Aerospace
12.3.2.Automotive and Transportation
12.3.3.Energy and Power
12.3.4.Industrial Sector
12.3.5.Others
12.4.Asia Pacific Liquid Hydrogen Market Revenue & Volume (US$ Mn & Kilo Tons) and Forecasts, By Country
12.4.1.China
12.4.1.1.China Liquid Hydrogen Market Revenue & Volume (US$ Mn & Kilo Tons) and Forecasts, By Distribution
12.4.1.1.1.Pipelines
12.4.1.1.2.Cryogenic Tanks
12.4.1.1.3.Others
12.4.1.2.China Liquid Hydrogen Market Revenue & Volume (US$ Mn & Kilo Tons) and Forecasts, By End Use Industry
12.4.1.2.1.Aerospace
12.4.1.2.2.Automotive and Transportation
12.4.1.2.3.Energy and Power
12.4.1.2.4.Industrial Sector
12.4.1.2.5.Others
12.4.2.Japan
12.4.2.1.Japan Liquid Hydrogen Market Revenue & Volume (US$ Mn & Kilo Tons) and Forecasts, By Distribution
12.4.2.1.1.Pipelines
12.4.2.1.2.Cryogenic Tanks
12.4.2.1.3.Others
12.4.2.2.Japan Liquid Hydrogen Market Revenue & Volume (US$ Mn & Kilo Tons) and Forecasts, By End Use Industry
12.4.2.2.1.Aerospace
12.4.2.2.2.Automotive and Transportation
12.4.2.2.3.Energy and Power
12.4.2.2.4.Industrial Sector
12.4.2.2.5.Others
12.4.3.India
12.4.3.1.India Liquid Hydrogen Market Revenue & Volume (US$ Mn & Kilo Tons) and Forecasts, By Distribution
12.4.3.1.1.Pipelines
12.4.3.1.2.Cryogenic Tanks
12.4.3.1.3.Others
12.4.3.2.India Liquid Hydrogen Market Revenue & Volume (US$ Mn & Kilo Tons) and Forecasts, By End Use Industry
12.4.3.2.1.Aerospace
12.4.3.2.2.Automotive and Transportation
12.4.3.2.3.Energy and Power
12.4.3.2.4.Industrial Sector
12.4.3.2.5.Others
12.4.4.New Zealand
12.4.4.1.New Zealand Liquid Hydrogen Market Revenue & Volume (US$ Mn & Kilo Tons) and Forecasts, By Distribution
12.4.4.1.1.Pipelines
12.4.4.1.2.Cryogenic Tanks
12.4.4.1.3.Others
12.4.4.2.New Zealand Liquid Hydrogen Market Revenue & Volume (US$ Mn & Kilo Tons) and Forecasts, By End Use Industry
12.4.4.2.1.Aerospace
12.4.4.2.2.Automotive and Transportation
12.4.4.2.3.Energy and Power
12.4.4.2.4.Industrial Sector
12.4.4.2.5.Others
12.4.5.Australia
12.4.5.1.Australia Liquid Hydrogen Market Revenue & Volume (US$ Mn & Kilo Tons) and Forecasts, By Distribution
12.4.5.1.1.Pipelines
12.4.5.1.2.Cryogenic Tanks
12.4.5.1.3.Others
12.4.5.2.Australia Liquid Hydrogen Market Revenue & Volume (US$ Mn & Kilo Tons) and Forecasts, By End Use Industry
12.4.5.2.1.Aerospace
12.4.5.2.2.Automotive and Transportation
12.4.5.2.3.Energy and Power
12.4.5.2.4.Industrial Sector
12.4.5.2.5.Others
12.4.6.South Korea
12.4.6.1.South Korea Liquid Hydrogen Market Revenue & Volume (US$ Mn & Kilo Tons) and Forecasts, By Distribution
12.4.6.1.1.Pipelines
12.4.6.1.2.Cryogenic Tanks
12.4.6.1.3.Others
12.4.6.2.South Korea Liquid Hydrogen Market Revenue & Volume (US$ Mn & Kilo Tons) and Forecasts, By End Use Industry
12.4.6.2.1.Aerospace
12.4.6.2.2.Automotive and Transportation
12.4.6.2.3.Energy and Power
12.4.6.2.4.Industrial Sector
12.4.6.2.5.Others
12.4.7.Southeast Asia
12.4.7.1.Southeast Asia Liquid Hydrogen Market Revenue & Volume (US$ Mn & Kilo Tons) and Forecasts, By Distribution
12.4.7.1.1.Pipelines
12.4.7.1.2.Cryogenic Tanks
12.4.7.1.3.Others
12.4.7.2.Southeast Asia Liquid Hydrogen Market Revenue & Volume (US$ Mn & Kilo Tons) and Forecasts, By End Use Industry
12.4.7.2.1.Aerospace
12.4.7.2.2.Automotive and Transportation
12.4.7.2.3.Energy and Power
12.4.7.2.4.Industrial Sector
12.4.7.2.5.Others
12.4.7.3.Southeast Asia Liquid Hydrogen Market Revenue & Volume (US$ Mn & Kilo Tons) and Forecasts, By Country
12.4.7.3.1.Indonesia
12.4.7.3.2.Thailand
12.4.7.3.3.Malaysia
12.4.7.3.4.Singapore
12.4.7.3.5.Rest of Southeast Asia
12.4.8.Rest of Asia Pacific
12.4.8.1.Rest of Asia Pacific Liquid Hydrogen Market Revenue & Volume (US$ Mn & Kilo Tons) and Forecasts, By Distribution
12.4.8.1.1.Pipelines
12.4.8.1.2.Cryogenic Tanks
12.4.8.1.3.Others
12.4.8.2.Rest of Asia Pacific Liquid Hydrogen Market Revenue & Volume (US$ Mn & Kilo Tons) and Forecasts, By End Use Industry
12.4.8.2.1.Aerospace
12.4.8.2.2.Automotive and Transportation
12.4.8.2.3.Energy and Power
12.4.8.2.4.Industrial Sector
12.4.8.2.5.Others
12.5.Key Segment for Channeling Investments
12.5.1.By Country
12.5.2.By Distribution
12.5.3.By End Use Industry
13.Middle East and Africa Liquid Hydrogen Market Analysis and Forecasts, 2023 – 2031
13.1.Overview
13.1.1.Middle East and Africa Liquid Hydrogen Market Revenue & Volume (US$ Mn & Kilo Tons)
13.2.Middle East and Africa Liquid Hydrogen Market Revenue & Volume (US$ Mn & Kilo Tons) and Forecasts, By Distribution
13.2.1.Pipelines
13.2.2.Cryogenic Tanks
13.2.3.Others
13.3.Middle East and Africa Liquid Hydrogen Market Revenue & Volume (US$ Mn & Kilo Tons) and Forecasts, By End Use Industry
13.3.1.Aerospace
13.3.2.Automotive and Transportation
13.3.3.Energy and Power
13.3.4.Industrial Sector
13.3.5.Others
13.4.Middle East and Africa Liquid Hydrogen Market Revenue & Volume (US$ Mn & Kilo Tons) and Forecasts, By Country
13.4.1.Saudi Arabia
13.4.1.1.Saudi Arabia Liquid Hydrogen Market Revenue & Volume (US$ Mn & Kilo Tons) and Forecasts, By Distribution
13.4.1.1.1.Pipelines
13.4.1.1.2.Cryogenic Tanks
13.4.1.1.3.Others
13.4.1.2.Saudi Arabia Liquid Hydrogen Market Revenue & Volume (US$ Mn & Kilo Tons) and Forecasts, By End Use Industry
13.4.1.2.1.Aerospace
13.4.1.2.2.Automotive and Transportation
13.4.1.2.3.Energy and Power
13.4.1.2.4.Industrial Sector
13.4.1.2.5.Others
13.4.2.UAE
13.4.2.1.UAE Liquid Hydrogen Market Revenue & Volume (US$ Mn & Kilo Tons) and Forecasts, By Distribution
13.4.2.1.1.Pipelines
13.4.2.1.2.Cryogenic Tanks
13.4.2.1.3.Others
13.4.2.2.UAE Liquid Hydrogen Market Revenue & Volume (US$ Mn & Kilo Tons) and Forecasts, By End Use Industry
13.4.2.2.1.Aerospace
13.4.2.2.2.Automotive and Transportation
13.4.2.2.3.Energy and Power
13.4.2.2.4.Industrial Sector
13.4.2.2.5.Others
13.4.3.Egypt
13.4.3.1.Egypt Liquid Hydrogen Market Revenue & Volume (US$ Mn & Kilo Tons) and Forecasts, By Distribution
13.4.3.1.1.Pipelines
13.4.3.1.2.Cryogenic Tanks
13.4.3.1.3.Others
13.4.3.2.Egypt Liquid Hydrogen Market Revenue & Volume (US$ Mn & Kilo Tons) and Forecasts, By End Use Industry
13.4.3.2.1.Aerospace
13.4.3.2.2.Automotive and Transportation
13.4.3.2.3.Energy and Power
13.4.3.2.4.Industrial Sector
13.4.3.2.5.Others
13.4.4.Kuwait
13.4.4.1.Kuwait Liquid Hydrogen Market Revenue & Volume (US$ Mn & Kilo Tons) and Forecasts, By Distribution
13.4.4.1.1.Pipelines
13.4.4.1.2.Cryogenic Tanks
13.4.4.1.3.Others
13.4.4.2.Kuwait Liquid Hydrogen Market Revenue & Volume (US$ Mn & Kilo Tons) and Forecasts, By End Use Industry
13.4.4.2.1.Aerospace
13.4.4.2.2.Automotive and Transportation
13.4.4.2.3.Energy and Power
13.4.4.2.4.Industrial Sector
13.4.4.2.5.Others
13.4.5.South Africa
13.4.5.1.South Africa Liquid Hydrogen Market Revenue & Volume (US$ Mn & Kilo Tons) and Forecasts, By Distribution
13.4.5.1.1.Pipelines
13.4.5.1.2.Cryogenic Tanks
13.4.5.1.3.Others
13.4.5.2.South Africa Liquid Hydrogen Market Revenue & Volume (US$ Mn & Kilo Tons) and Forecasts, By End Use Industry
13.4.5.2.1.Aerospace
13.4.5.2.2.Automotive and Transportation
13.4.5.2.3.Energy and Power
13.4.5.2.4.Industrial Sector
13.4.5.2.5.Others
13.4.6.Rest of Middle East & Africa
13.4.6.1.Rest of Middle East & Africa Liquid Hydrogen Market Revenue & Volume (US$ Mn & Kilo Tons) and Forecasts, By Distribution
13.4.6.1.1.Pipelines
13.4.6.1.2.Cryogenic Tanks
13.4.6.1.3.Others
13.4.6.2.Rest of Middle East & Africa Liquid Hydrogen Market Revenue & Volume (US$ Mn & Kilo Tons) and Forecasts, By End Use Industry
13.4.6.2.1.Aerospace
13.4.6.2.2.Automotive and Transportation
13.4.6.2.3.Energy and Power
13.4.6.2.4.Industrial Sector
13.4.6.2.5.Others
13.5.Key Segment for Channeling Investments
13.5.1.By Country
13.5.2.By Distribution
13.5.3.By End Use Industry
14.Latin America Liquid Hydrogen Market Analysis and Forecasts, 2023 – 2031
14.1.Overview
14.1.1.Latin America Liquid Hydrogen Market Revenue & Volume (US$ Mn & Kilo Tons)
14.2.Latin America Liquid Hydrogen Market Revenue & Volume (US$ Mn & Kilo Tons) and Forecasts, By Distribution
14.2.1.Pipelines
14.2.2.Cryogenic Tanks
14.2.3.Others
14.3.Latin America Liquid Hydrogen Market Revenue & Volume (US$ Mn & Kilo Tons) and Forecasts, By End Use Industry
14.3.1.Aerospace
14.3.2.Automotive and Transportation
14.3.3.Energy and Power
14.3.4.Industrial Sector
14.3.5.Others
14.4.Latin America Liquid Hydrogen Market Revenue & Volume (US$ Mn & Kilo Tons) and Forecasts, By Country
14.4.1.Brazil
14.4.1.1.Brazil Liquid Hydrogen Market Revenue & Volume (US$ Mn & Kilo Tons) and Forecasts, By Distribution
14.4.1.1.1.Pipelines
14.4.1.1.2.Cryogenic Tanks
14.4.1.1.3.Others
14.4.1.2.Brazil Liquid Hydrogen Market Revenue & Volume (US$ Mn & Kilo Tons) and Forecasts, By End Use Industry
14.4.1.2.1.Aerospace
14.4.1.2.2.Automotive and Transportation
14.4.1.2.3.Energy and Power
14.4.1.2.4.Industrial Sector
14.4.1.2.5.Others
14.4.2.Argentina
14.4.2.1.Argentina Liquid Hydrogen Market Revenue & Volume (US$ Mn & Kilo Tons) and Forecasts, By Distribution
14.4.2.1.1.Pipelines
14.4.2.1.2.Cryogenic Tanks
14.4.2.1.3.Others
14.4.2.2.Argentina Liquid Hydrogen Market Revenue & Volume (US$ Mn & Kilo Tons) and Forecasts, By End Use Industry
14.4.2.2.1.Aerospace
14.4.2.2.2.Automotive and Transportation
14.4.2.2.3.Energy and Power
14.4.2.2.4.Industrial Sector
14.4.2.2.5.Others
14.4.3.Rest of Latin America
14.4.3.1.Rest of Latin America Liquid Hydrogen Market Revenue & Volume (US$ Mn & Kilo Tons) and Forecasts, By Distribution
14.4.3.1.1.Pipelines
14.4.3.1.2.Cryogenic Tanks
14.4.3.1.3.Others
14.4.3.2.Rest of Latin America Liquid Hydrogen Market Revenue & Volume (US$ Mn & Kilo Tons) and Forecasts, By End Use Industry
14.4.3.2.1.Aerospace
14.4.3.2.2.Automotive and Transportation
14.4.3.2.3.Energy and Power
14.4.3.2.4.Industrial Sector
14.4.3.2.5.Others
14.5.Key Segment for Channeling Investments
14.5.1.By Country
14.5.2.By Distribution
14.5.3.By End Use Industry
15.Competitive Benchmarking
15.1.Market Share Analysis, 2022
15.2.Global Presence and Growth Strategies
15.2.1.Mergers and Acquisitions
15.2.2.Product Launches
15.2.3.Investments Trends
15.2.4.R&D Initiatives
16.Player Profiles
16.1.Air Liquide
16.1.1.Company Details
16.1.2.Company Overview
16.1.3.Product Offerings
16.1.4.Key Developments
16.1.5.Financial Analysis
16.1.6.SWOT Analysis
16.1.7.Business Strategies
16.2.Air Products and Chemicals, Inc.
16.2.1.Company Details
16.2.2.Company Overview
16.2.3.Product Offerings
16.2.4.Key Developments
16.2.5.Financial Analysis
16.2.6.SWOT Analysis
16.2.7.Business Strategies
16.3.Cryolor
16.3.1.Company Details
16.3.2.Company Overview
16.3.3.Product Offerings
16.3.4.Key Developments
16.3.5.Financial Analysis
16.3.6.SWOT Analysis
16.3.7.Business Strategies
16.4.Hylium Industries, Inc.
16.4.1.Company Details
16.4.2.Company Overview
16.4.3.Product Offerings
16.4.4.Key Developments
16.4.5.Financial Analysis
16.4.6.SWOT Analysis
16.4.7.Business Strategies
16.5.INOX India Limited
16.5.1.Company Details
16.5.2.Company Overview
16.5.3.Product Offerings
16.5.4.Key Developments
16.5.5.Financial Analysis
16.5.6.SWOT Analysis
16.5.7.Business Strategies
16.6.Iwatani Corporation
16.6.1.Company Details
16.6.2.Company Overview
16.6.3.Product Offerings
16.6.4.Key Developments
16.6.5.Financial Analysis
16.6.6.SWOT Analysis
16.6.7.Business Strategies
16.7.Linde plc
16.7.1.Company Details
16.7.2.Company Overview
16.7.3.Product Offerings
16.7.4.Key Developments
16.7.5.Financial Analysis
16.7.6.SWOT Analysis
16.7.7.Business Strategies
16.8.Messer SE & Co. KGaA
16.8.1.Company Details
16.8.2.Company Overview
16.8.3.Product Offerings
16.8.4.Key Developments
16.8.5.Financial Analysis
16.8.6.SWOT Analysis
16.8.7.Business Strategies
16.9.Plug Power Inc.
16.9.1.Company Details
16.9.2.Company Overview
16.9.3.Product Offerings
16.9.4.Key Developments
16.9.5.Financial Analysis
16.9.6.SWOT Analysis
16.9.7.Business Strategies
16.10.Other Market Participants
17.Key Findings

.

**Exclusive for Multi-User and Enterprise User.

Global Liquid Hydrogen Market Segmentation

By Distribution

 Pipelines
 Cryogenic Tanks
 Others

By End Use Industry

 Aerospace
 Automotive and Transportation
 Energy and Power
 Industrial Sector
 Others

By Region

 North America (U.S., Canada, Mexico, Rest of North America)
 Europe (France, The UK, Spain, Germany, Italy, Nordic Countries (Denmark, Finland, Iceland, Sweden, Norway), Benelux Union (Belgium, The Netherlands, Luxembourg), Rest of Europe)
 Asia Pacific (China, Japan, India, New Zealand, Australia, South Korea, Southeast Asia (Indonesia, Thailand, Malaysia, Singapore, Rest of Southeast Asia), Rest of Asia Pacific)
 Middle East & Africa (Saudi Arabia, UAE, Egypt, Kuwait, South Africa, Rest of Middle East & Africa)
 Latin America (Brazil, Argentina, Rest of Latin America)

**Note: The report covers cross-segmentation analysis by region further into countries

The Niche Research approach encompasses both primary and secondary research methods to provide comprehensive insights. While primary research is the cornerstone of our studies, we also incorporate secondary research sources such as company annual reports, premium industry databases, press releases, industry journals, and white papers.

Within our primary research, we actively engage with various industry stakeholders, conducting paid interviews and surveys. Our meticulous analysis extends to every market participant in major countries, allowing us to thoroughly examine their portfolios, calculate market shares, and segment revenues.

Our data collection primarily focuses on individual countries within our research scope, enabling us to estimate regional market sizes. Typically, we employ a bottom-up approach, meticulously tracking trends in different countries. We analyze growth drivers, constraints, technological innovations, and opportunities for each country, ultimately arriving at regional figures.Our process begins by examining the growth prospects of each country. Building upon these insights, we project growth and trends for the entire region. Finally, we utilize our proprietary model to refine estimations and forecasts.

Our data validation standards are integral to ensuring the reliability and accuracy of our research findings. Here’s a breakdown of our data validation processes and the stakeholders we engage with during our primary research:

  • Supply Side Analysis: We initiate a supply side analysis by directly contacting market participants, through telephonic interviews and questionnaires containing both open-ended and close-ended questions. We gather information on their portfolios, segment revenues, developments, and growth strategies.
  • Demand Side Analysis: To gain insights into adoption trends and consumer preferences, we reach out to target customers and users (non-vendors). This information forms a vital part of the qualitative analysis section of our reports, covering market dynamics, adoption trends, consumer behavior, spending patterns, and other related aspects.
  • Consultant Insights: We tap into the expertise of our partner consultants from around the world to obtain their unique viewpoints and perspectives. Their insights contribute to a well-rounded understanding of the markets under investigation.
  • In-House Validation: To ensure data accuracy and reliability, we conduct cross-validation of data points and information through our in-house team of consultants and utilize advanced data modeling tools for thorough verification.

The forecasts we provide are based on a comprehensive assessment of various factors, including:

  • Market Trends and Past Performance (Last Five Years): We accurately analyze market trends and performance data from preceding five years to identify historical patterns and understand the market’s evolution.
  • Historical Performance and Growth of Market Participants: We assess the historical performance and growth trajectories of key market participants. This analysis provides insights into the competitive landscape and individual company strategies.
  • Market Determinants Impact Analysis (Next Eight Years): We conduct a rigorous analysis of the factors that are projected to influence the market over the next eight years. This includes assessing both internal and external determinants that can shape market dynamics.
  • Drivers and Challenges for the Forecast Period:Identify the factors expected to drive market growth during the forecast period, as well as the challenges that the industry may face. This analysis aids in deriving an accurate growth rate projection.
  • New Acquisitions, Collaborations, or Partnerships: We keep a close watch on any new acquisitions, collaborations, or partnerships within the industry. These developments can have a significant impact on market dynamics and competitiveness.
  • Macro and Micro Factors Analysis:A thorough examination of both macro-level factors (e.g., economic trends, regulatory changes) and micro-level factors (e.g., technological advancements, consumer preferences) that may influence the market during the forecast period.
  • End-User Sentiment Analysis: To understand the market from the end-user perspective, we conduct sentiment analysis. This involves assessing the sentiment, preferences, and feedback of the end-users, which can provide valuable insights into market trends.
  • Perspective of Primary Participants: Insights gathered directly from primary research participants play a crucial role in shaping our forecasts. Their perspectives and experiences provide valuable qualitative data.
  • Year-on-Year Growth Trend: We utilize a year-on-year growth trend based on historical market growth and expected future trends. This helps in formulating our growth projections, aligning them with the market’s historical performance.

Research process adopted by TNR involves multiple stages, including data collection, validation, quality checks, and presentation. It’s crucial that the data and information we provide add value to your existing market understanding and expertise. We have also established partnerships with business consulting, research, and survey organizations across regions and globally to collaborate on regional analysis and data validation, ensuring the highest level of accuracy and reliability in our reports.


Procure Comprehensive Study of

Global Liquid Hydrogen Market

Online Only

  • Online Access
  • Read Only File
  • Validity 3 Months
  • Print, Copy, Paste & Download
  • PPT, Excel
  • Cost-Free Report in the Next Update
$3300
Buy Now

Single User

  • Access to One User on One System
  • Read Only File
  • Validity 6 Months
  • Limited Print,Copy, Paste
  • PPT, Excel
  • Cost-Free Report in the Next Update
$4200
Buy Now

Multi User

  • Access to Fiver Users
  • PDF File
  • Validity 1 Year
  • Upto FivePrints
  • Cost-Free Report in the Next Update
  • PPT, Excel
$6000
Buy Now

Enterprise User

  • Access to Unlimited Users
  • PDF, PPT, Excel
  • Unlimited Validity, Prints&Downloads
  • 1 Hour Cost-Free & Dedicated Analyst Support
  • 10% Cost-Free Customization
  • Cost-Free Report Update Twice in a Year
  • Recommendations for Business Strategies
  • Authorization to Quote TNR, The Niche Research
$7300
Buy Now

Library Access

  • Online Access to Content Publications
  • Access Player Profiles Online
  • Get Immediate Access to Newly Added Content
  • Acquire 12 PDF Downloads
  • Acquire 5 Excel Data Sets
  • Gain Access to 290+ PDFs of Company Profiles
  • Round-the-clock Email and Phone Assistance
  • Dashboard Usage and Trends
  • Renewal & Upgrade Assistance
  • Assessing Customization Options and Alerts for New Reports
$10788
Buy Now
*Taxes/Fees, if applicable will be added during checkout. All prices in USD

Why TNR The Niche Research?

  • Unwavering Commitment to Excellence

  • Veteran Team of Researchers

  • Accurate and Timely Insights

  • Ethical Practices and Customized Service

  • Uninterrupted Availability Around the Clock

Scroll to Top