Global Metaverse Market: By Component, By Industry Vertical, By Region & Segmental Insights Trends and Forecast, 2024 – 2034

  • Industry: Technology
  • Report ID: TNR-110-1142
  • Number of Pages: 420
  • Table/Charts : Yes
  • June, 2024
  • Base Year : 2024
  • No. of Companies : 10+
  • No. of Countries : 29
  • Views : 10072
  • Covid Impact Covered: Yes
  • War Impact Covered: Yes
  • Formats : PDF, Excel, PPT

The metaverse is a collective virtual shared space, created by the convergence of virtually enhanced physical reality and physically persistent virtual spaces, including the sum of all virtual worlds, augmented reality, and the internet. It represents a digital universe where users can interact with a computer-generated environment and other users in real-time, using avatars and immersive technologies such as virtual reality (VR) and augmented reality (AR). The metaverse encompasses various digital domains, from virtual gaming worlds and social platforms to virtual workplaces and marketplaces, allowing for diverse activities and interactions. As an evolving concept, the metaverse is driven by advancements in technology, including AI, blockchain, and high-speed internet connectivity. This digital frontier aims to enhance the way we socialize, work, learn, and entertain ourselves, providing an integrated and immersive digital experience that bridges the gap between physical and virtual realities. The metaverse promises to transform numerous industries by enabling new forms of digital interaction and commerce.

The demand for the metaverse is driven by several key factors, including rapid technological advancements, shifting consumer preferences, and increased investment from major tech companies. Innovations in augmented reality (AR) and virtual reality (VR) technologies are making immersive digital experiences more accessible and engaging, attracting a growing user base. Consumers are increasingly seeking new ways to socialize, work, and entertain themselves within digital environments, driven by the pandemic’s acceleration of remote activities and virtual interactions. Additionally, significant investments from tech giants like Meta (formerly Facebook), Microsoft, and Google are fuelling the development of sophisticated metaverse platforms, further expanding their capabilities and appeal. The rise of digital economies, facilitated by blockchain and non-fungible tokens (NFTs), is also propelling demand, as users seek to buy, sell, and trade digital assets within the metaverse. 
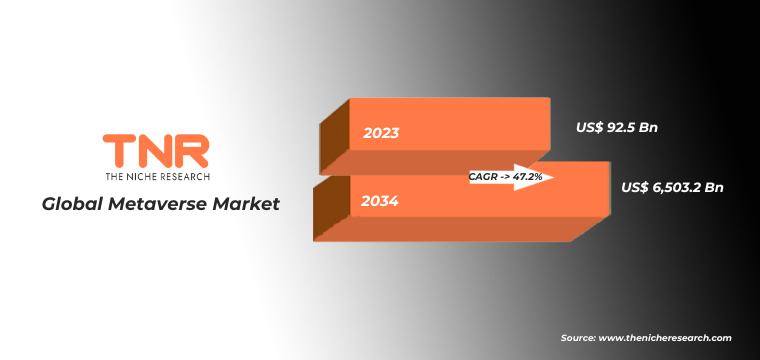
In terms of revenue, the global metaverse market was worth US$ 92.5 Bn in 2023, anticipated to witness CAGR of 47.2% during 2024 – 2034.

Global Metaverse Market Dynamics

Technological Advancements: Continuous innovations in augmented reality (AR), virtual reality (VR), blockchain, and artificial intelligence (AI) are critical drivers, enhancing the immersive experiences and functionality of the metaverse. The rise of cryptocurrencies and non-fungible tokens (NFTs) integrates with the metaverse, enabling new forms of digital ownership, commerce, and virtual economies.

Consumer Demand: There is a growing consumer appetite for immersive digital experiences, from virtual gaming and entertainment to socializing and shopping in virtual environments. This demand propels the development and adoption of metaverse platforms. The COVID-19 pandemic has accelerated the adoption of remote work and virtual collaboration tools, increasing the relevance and utility of metaverse environments for professional and educational purposes.

Investment from Major Tech Companies: Leading technology companies like Meta (Facebook), Google, Microsoft, and Apple are investing heavily in metaverse technologies, accelerating market growth and technological development. The expansion of high-speed internet access and the deployment of 5G networks are vital for supporting the data-intensive applications of the metaverse, enabling smoother and more responsive user experiences.

Cybersecurity and Privacy Concerns: Ensuring the security and privacy of users in the metaverse is a critical challenge, as the potential for data breaches and cyber-attacks increases with the complexity and scale of virtual environments. The need for interoperability between different metaverse platforms and the establishment of industry standards pose both challenges and opportunities for cohesive growth and user experience enhancement.

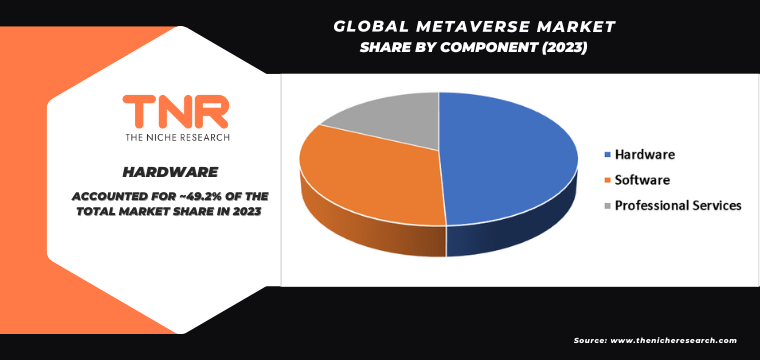
Hardware Segment has Garnered Major Market Share in the Global Metaverse Market During the Forecast Period (2024 – 2034).

The demand for hardware in the metaverse is driven by several critical factors, including advancements in technology, the growing popularity of immersive experiences, and the need for powerful computing capabilities. As the metaverse evolves, it requires sophisticated hardware to support its complex, interactive environments. High-performance devices such as virtual reality (VR) headsets, augmented reality (AR) glasses, and advanced gaming consoles are essential for providing the immersive experiences that users expect. These devices must offer high-resolution displays, seamless connectivity, and intuitive interfaces to ensure an engaging and realistic experience. Additionally, the development of powerful GPUs (graphics processing units) and CPUs (central processing units) is crucial for rendering detailed virtual worlds and supporting real-time interactions. The increasing adoption of 5G technology further enhances the metaverse experience by enabling faster data transmission and lower latency, which are essential for smooth and responsive virtual environments. Furthermore, the rise of remote work and virtual collaboration tools has accelerated the need for advanced hardware to facilitate virtual meetings, training, and social interactions within the metaverse. As consumers and businesses alike seek more immersive and interactive digital experiences, the demand for cutting-edge hardware will continue to grow, driving innovation and investment in the technologies that power the metaverse.

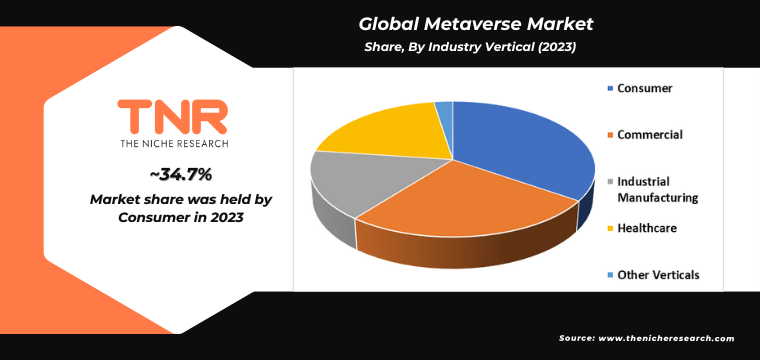
By Industry Vertical Consumer Segment had the Highest Share in the Global Metaverse Market in 2023.

The demand for the metaverse among consumers is driven by several key factors, including the pursuit of immersive digital experiences, advancements in technology, and the increasing integration of virtual spaces in daily life. Consumers are increasingly seeking new forms of entertainment, social interaction, and shopping experiences that go beyond traditional 2D interfaces. The metaverse offers an immersive, interactive environment where users can engage in activities ranging from virtual concerts and gaming to virtual tourism and shopping, creating a dynamic and engaging user experience. Technological advancements in virtual reality (VR), augmented reality (AR), and blockchain are making these experiences more accessible and realistic, enhancing consumer interest. Moreover, the pandemic has accelerated the adoption of virtual platforms for socializing and entertainment, with consumers spending more time online and exploring new digital venues. The gaming industry, which is a significant component of the metaverse, continues to grow, with consumers demanding more sophisticated and immersive gaming experiences. Additionally, the rise of virtual goods and NFTs (non-fungible tokens) allows consumers to own and trade digital assets, adding a new dimension to their online presence and interactions. These factors collectively drive consumer interest and investment in the metaverse, shaping the future of digital experiences and interactions.

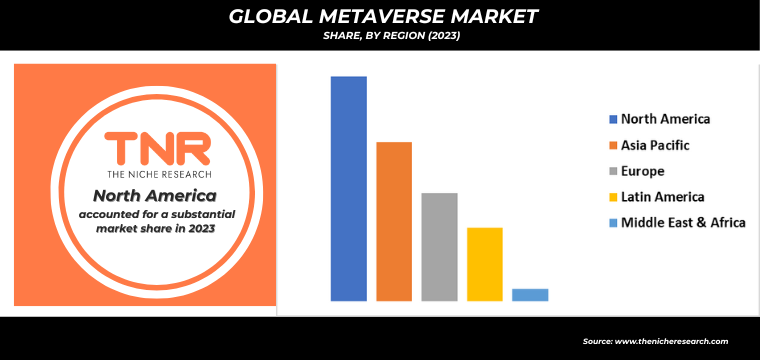
By Region, North America Dominated the Global Metaverse Market in 2023.

In North America, the demand for the metaverse is driven by several key factors, including technological advancements, increased investment from major tech companies, and evolving consumer preferences for immersive digital experiences. Rapid developments in augmented reality (AR), virtual reality (VR), and blockchain technologies are creating robust platforms for metaverse applications, attracting both developers and users. Major tech giants like Meta (formerly Facebook), Microsoft, and Google are heavily investing in metaverse infrastructure, signaling significant growth potential and fostering innovation in this space. Additionally, the shift towards remote work and virtual social interactions, accelerated by the COVID-19 pandemic, has heightened interest in digital environments where people can work, socialize, and entertain themselves seamlessly. Furthermore, the gaming industry, a key component of the metaverse, continues to expand, with increasing demand for immersive, interactive experiences. These drivers collectively fuel the burgeoning interest and development in the metaverse across North America, paving the way for its integration into various aspects of daily life and business.

Competitive Landscape: Global Metaverse Market:

  • Decentraland
  • Epic Games
  • META
  • Microsoft
  • Nextech AR Solutions Inc.
  • NVIDIA Corporation
  • Qualcomm Technologies, Inc.
  • Roblox Corporation
  • Snap Inc.
  • The Sandbox
  • Other Industry Participants

 Global Metaverse Market Scope

Report Specifications Details
Market Revenue in 2023 US$ 92.5 Bn
Market Size Forecast by 2034 US$ 6,503.2 Bn
Growth Rate (CAGR) 47.2%
Historic Data 2016 – 2022
Base Year for Estimation 2023
Forecast Period 2024 – 2034
Report Inclusions Market Size & Estimates, Market Dynamics, Competitive Scenario, Trends, Growth Factors, Market Determinants, Key Investment Segmentation, Product/Service/Solutions Benchmarking
Segments Covered By Component, By Industry Vertical, By Region
Regions Covered North America, Europe, Asia Pacific, Middle East & Africa, Latin America
Countries Covered U.S., Canada, Mexico, Rest of North America,  France, The UK, Spain, Germany, Italy, Nordic Countries (Denmark, Finland, Iceland, Sweden, Norway), Benelux Union (Belgium, The Netherlands, Luxembourg), Rest of Europe,  China, Japan, India, New Zealand, Australia, South Korea, Southeast Asia (Indonesia, Thailand, Malaysia, Singapore, Rest of Southeast Asia), Rest of Asia Pacific,  Saudi Arabia, UAE, Egypt, Kuwait, South Africa, Rest of Middle East & Africa,  Brazil, Argentina, Rest of Latin America
Key Players Decentraland, Epic Games, META, Microsoft, Nextech AR Solutions Inc., NVIDIA Corporation, Qualcomm Technologies, Inc., Roblox Corporation, Snap Inc., The Sandbox
Customization Scope Customization allows for the inclusion/modification of content pertaining to geographical regions, countries, and specific market segments.
Pricing & Procurement Options Explore purchase options tailored to your specific research requirements
Contact Details Consult With Our Expert

Japan (Toll-Free):  +81 663-386-8111

South Korea (Toll-Free):  +82-808- 703-126

Saudi Arabia (Toll-Free):  +966 800-850-1643

United Kingdom: +44 753-710-5080

United States: +1 302-232-5106

E-mail:  askanexpert@thenicheresearch.com


 Global Metaverse Market

By Component

  • Hardware
    • AR devices
      • AR Head-Mounted Displays (HMD)
      • AR smart glasses
      • Smart helmets
      • AR Head-Up Displays (HUD)
    • VR devices
      • VR Head-Mounted Displays (HMD)
      • Gesture-tracking devices and haptics
    • MR devices
    • Displays
      • 3D displays
      • Holographic Displays
      • Virtual Mirrors
    • Software
      • Extended Reality Software
      • Gaming Engines
      • 3D Mapping, Modeling, and Reconstruction
      • Metaverse Platforms
      • Financial Platforms
      • Other Software
    • Professional Services
      • Application Development and System Integration
      • Strategy and business consulting services

By Industry Vertical

  • Consumer
    • Gaming and Social Media
    • Live Entertainment and Events
  • Commercial
    • Retail and eCommerce
    • Education and Corporate
    • Travel and Tourism
    • Real Estate
  • Industrial Manufacturing
  • Healthcare
  • Other verticals

By Region

  • North America (U.S., Canada, Mexico, Rest of North America)
  • Europe (France, The UK, Spain, Germany, Italy, Nordic Countries (Denmark, Finland, Iceland, Sweden, Norway), Benelux Union (Belgium, The Netherlands, Luxembourg), Rest of Europe)
  • Asia Pacific (China, Japan, India, New Zealand, Australia, South Korea, Southeast Asia (Indonesia, Thailand, Malaysia, Singapore, Rest of Southeast Asia), Rest of Asia Pacific)
  • Middle East & Africa (Saudi Arabia, UAE, Egypt, Kuwait, South Africa, Rest of Middle East & Africa)
  • Latin America (Brazil, Argentina, Rest of Latin America)

Report Layout:

Table of Contents

.

1.Market Scope
1.1.Market Segmentation
1.2.Years Considered
1.2.1.Historic Years: 2016 – 2022
1.2.2.Base Year: 2023
1.2.3.Forecast Years: 2024 – 2034
2.Key Target Audiences
3.Research Methodology
3.1.Primary Research
3.1.1.Research Questionnaire
3.1.2.Global Percentage Breakdown
3.1.3.Primary Interviews: Key Opinion Leaders (KOLs)
3.2.Secondary Research
3.2.1.Paid Databases
3.2.2.Secondary Sources
3.3.Market Size Estimates
3.3.1.Top-Down Approach
3.3.2.Bottom-Up Approach
3.4.Data Triangulation Methodology
3.5.Research Assumptions
4.Recommendations and Insights from TNR’s Perspective**
5.Holistic Overview of Metaverse Market
6.Market Synopsis: Metaverse Market
7.Metaverse Market Analysis: Qualitative Perspective
7.1.Introduction
7.1.1.Product Definition
7.1.2.Industry Development
7.2.Market Dynamics
7.2.1.Drivers
7.2.2.Restraints
7.2.3.Opportunities
7.2.4.Challenges
7.3.Trends in Metaverse Market
7.4.Market Determinants Radar Chart
7.5.Macro-Economic and Micro-Economic Indicators: Metaverse Market
7.6.Industry Gross Margin Overview
7.7.Porter’s Five Force Analysis
7.8.Impact of Covid-19 on Metaverse Market
7.9.PESTEL Analysis
7.10.Value Chain Analysis
7.11.Pricing Analysis, By Region (2023)
7.11.1.North America
7.11.2.Europe
7.11.3.Asia Pacific
7.11.4.Middle East and Africa
7.11.5.Latin America
8.Global Metaverse Market Analysis and Forecasts, 2024 – 2034
8.1.Overview
8.1.1.Global Metaverse Market Revenue (US$ Mn)
8.2.Global Metaverse Market Revenue (US$ Mn) and Forecasts, By Component
8.2.1.Hardware (Definition, Market Estimation and Penetration, 2016 – 2023, Market Estimation (2016 – 2023), Market Forecast (2024 – 2034), Compound Annual Growth Rate (CAGR), Regional Bifurcation (North America, Europe, Asia Pacific, Middle East and Africa, Latin America) and Information on AR devices, VR devices, MR devices, Displays)
8.2.1.1.AR devices
8.2.1.1.1.AR Head-Mounted Displays (HMD)
8.2.1.1.2.AR smart glasses
8.2.1.1.3.Smart helmets
8.2.1.1.4.AR Head-Up Displays (HUD)
8.2.1.2.VR devices
8.2.1.2.1.VR Head-Mounted Displays (HMD)
8.2.1.2.2.Gesture-tracking devices and haptics
8.2.1.3.MR devices
8.2.1.4.Displays
8.2.1.4.1.3D displays
8.2.1.4.2.Holographic Displays
8.2.1.4.3.Virtual Mirrors
8.2.2.Software (Definition, Market Estimation and Penetration, 2016 – 2023, Market Estimation (2016 – 2023), Market Forecast (2024 – 2034), Compound Annual Growth Rate (CAGR), Regional Bifurcation (North America, Europe, Asia Pacific, Middle East and Africa, Latin America) and Information on Extended Reality Software, Gaming Engines, 3D Mapping, Modeling, and Reconstruction, Metaverse Platforms, Financial Platforms, Other Software)
8.2.2.1.Extended Reality Software
8.2.2.2.Gaming Engines
8.2.2.3.3D Mapping, Modeling, and Reconstruction
8.2.2.4.Metaverse Platforms
8.2.2.5.Financial Platforms
8.2.2.6.Other Software
8.2.3.Professional Services (Definition, Market Estimation and Penetration, 2016 – 2023, Market Estimation (2016 – 2023), Market Forecast (2024 – 2034), Compound Annual Growth Rate (CAGR), Regional Bifurcation (North America, Europe, Asia Pacific, Middle East and Africa, Latin America) and Information on Application Development and System Integration, Strategy and business consulting services)
8.2.3.1.Application Development and System Integration
8.2.3.2.Strategy and business consulting services
8.3.Key Segment for Channeling Investments
8.3.1.By Component
9.Global Metaverse Market Analysis and Forecasts, 2024 – 2034
9.1.Overview
9.2.Global Metaverse Market Revenue (US$ Mn) and Forecasts, By Industry Vertical
9.2.1.Consumer (Definition, Market Estimation and Penetration, 2016 – 2023, Market Estimation (2016 – 2023), Market Forecast (2024 – 2034), Compound Annual Growth Rate (CAGR), Regional Bifurcation (North America, Europe, Asia Pacific, Middle East and Africa, Latin America) and Information on Gaming and Social Media, Live Entertainment and Events)
9.2.1.1.Gaming and Social Media
9.2.1.2.Live Entertainment and Events
9.2.2.Commercial (Definition, Market Estimation and Penetration, 2016 – 2023, Market Estimation (2016 – 2023), Market Forecast (2024 – 2034), Compound Annual Growth Rate (CAGR), Regional Bifurcation (North America, Europe, Asia Pacific, Middle East and Africa, Latin America) and Information on Retail and eCommerce, Education and Corporate, Travel and Tourism, Real Estate)
9.2.2.1.Retail and eCommerce
9.2.2.2.Education and Corporate
9.2.2.3.Travel and Tourism
9.2.2.4.Real Estate
9.2.3.Industrial Manufacturing
9.2.3.1.Definition
9.2.3.2.Market Estimation and Penetration, 2016 – 2023
9.2.3.3.Market Forecast, 2024 – 2034
9.2.3.4.Compound Annual Growth Rate (CAGR)
9.2.3.5.Regional Bifurcation
9.2.3.5.1.North America
9.2.3.5.1.1.Market Estimation, 2016 – 2023
9.2.3.5.1.2.Market Forecast, 2024 – 2034
9.2.3.5.2.Europe
9.2.3.5.2.1.Market Estimation, 2016 – 2023
9.2.3.5.2.2.Market Forecast, 2024 – 2034
9.2.3.5.3.Asia Pacific
9.2.3.5.3.1.Market Estimation, 2016 – 2023
9.2.3.5.3.2.Market Forecast, 2024 – 2034
9.2.3.5.4.Middle East and Africa
9.2.3.5.4.1.Market Estimation, 2016 – 2023
9.2.3.5.4.2.Market Forecast, 2024 – 2034
9.2.3.5.5.Latin America
9.2.3.5.5.1.Market Estimation, 2016 – 2023
9.2.3.5.5.2.Market Forecast, 2024 – 2034
9.2.4.Healthcare
9.2.4.1.Definition
9.2.4.2.Market Estimation and Penetration, 2016 – 2023
9.2.4.3.Market Forecast, 2024 – 2034
9.2.4.4.Compound Annual Growth Rate (CAGR)
9.2.4.5.Regional Bifurcation
9.2.4.5.1.North America
9.2.4.5.1.1.Market Estimation, 2016 – 2023
9.2.4.5.1.2.Market Forecast, 2024 – 2034
9.2.4.5.2.Europe
9.2.4.5.2.1.Market Estimation, 2016 – 2023
9.2.4.5.2.2.Market Forecast, 2024 – 2034
9.2.4.5.3.Asia Pacific
9.2.4.5.3.1.Market Estimation, 2016 – 2023
9.2.4.5.3.2.Market Forecast, 2024 – 2034
9.2.4.5.4.Middle East and Africa
9.2.4.5.4.1.Market Estimation, 2016 – 2023
9.2.4.5.4.2.Market Forecast, 2024 – 2034
9.2.4.5.5.Latin America
9.2.4.5.5.1.Market Estimation, 2016 – 2023
9.2.4.5.5.2.Market Forecast, 2024 – 2034
9.2.5.Other Verticals
9.2.5.1.Definition
9.2.5.2.Market Estimation and Penetration, 2016 – 2023
9.2.5.3.Market Forecast, 2024 – 2034
9.2.5.4.Compound Annual Growth Rate (CAGR)
9.2.5.5.Regional Bifurcation
9.2.5.5.1.North America
9.2.5.5.1.1.Market Estimation, 2016 – 2023
9.2.5.5.1.2.Market Forecast, 2024 – 2034
9.2.5.5.2.Europe
9.2.5.5.2.1.Market Estimation, 2016 – 2023
9.2.5.5.2.2.Market Forecast, 2024 – 2034
9.2.5.5.3.Asia Pacific
9.2.5.5.3.1.Market Estimation, 2016 – 2023
9.2.5.5.3.2.Market Forecast, 2024 – 2034
9.2.5.5.4.Middle East and Africa
9.2.5.5.4.1.Market Estimation, 2016 – 2023
9.2.5.5.4.2.Market Forecast, 2024 – 2034
9.2.5.5.5.Latin America
9.2.5.5.5.1.Market Estimation, 2016 – 2023
9.2.5.5.5.2.Market Forecast, 2024 – 2034
9.3.Key Segment for Channeling Investments
9.3.1.By Industry Vertical
10.North America Metaverse Market Analysis and Forecasts, 2024 – 2034
10.1.Overview
10.1.1.North America Metaverse Market Revenue (US$ Mn)
10.2.North America Metaverse Market Revenue (US$ Mn) and Forecasts, By Component
10.2.1.Hardware
10.2.1.1.AR devices
10.2.1.1.1.AR Head-Mounted Displays (HMD)
10.2.1.1.2.AR smart glasses
10.2.1.1.3.Smart helmets
10.2.1.1.4.AR Head-Up Displays (HUD)
10.2.1.2.VR devices
10.2.1.2.1.VR Head-Mounted Displays (HMD)
10.2.1.2.2.Gesture-tracking devices and haptics
10.2.1.3.MR devices
10.2.1.4.Displays
10.2.1.4.1.3D displays
10.2.1.4.2.Holographic Displays
10.2.1.4.3.Virtual Mirrors
10.2.2.Software
10.2.2.1.Extended Reality Software
10.2.2.2.Gaming Engines
10.2.2.3.3D Mapping, Modeling, and Reconstruction
10.2.2.4.Metaverse Platforms
10.2.2.5.Financial Platforms
10.2.2.6.Other Software
10.2.3.Professional Services
10.2.3.1.Application Development and System Integration
10.2.3.2.Strategy and business consulting services
10.3.North America Metaverse Market Revenue (US$ Mn) and Forecasts, By Industry Vertical
10.3.1.Consumer
10.3.1.1.Gaming and Social Media
10.3.1.2.Live Entertainment and Events
10.3.2.Commercial
10.3.2.1.Retail and eCommerce
10.3.2.2.Education and Corporate
10.3.2.3.Travel and Tourism
10.3.2.4.Real Estate
10.3.3.Industrial Manufacturing
10.3.4.Healthcare
10.3.5.Other Verticals
10.4.North America Metaverse Market Revenue (US$ Mn) and Forecasts, By Country
10.4.1.U.S
10.4.1.1.U.S Metaverse Market Revenue (US$ Mn) and Forecasts, By Component
10.4.1.1.1.Hardware
10.4.1.1.1.1.AR devices
10.4.1.1.1.1.1.AR Head-Mounted Displays (HMD)
10.4.1.1.1.1.2.AR smart glasses
10.4.1.1.1.1.3.Smart helmets
10.4.1.1.1.1.4.AR Head-Up Displays (HUD)
10.4.1.1.1.2.VR devices
10.4.1.1.1.2.1.VR Head-Mounted Displays (HMD)
10.4.1.1.1.2.2.Gesture-tracking devices and haptics
10.4.1.1.1.3.MR devices
10.4.1.1.1.4.Displays
10.4.1.1.1.4.1.3D displays
10.4.1.1.1.4.2.Holographic Displays
10.4.1.1.1.4.3.Virtual Mirrors
10.4.1.1.2.Software
10.4.1.1.2.1.Extended Reality Software
10.4.1.1.2.2.Gaming Engines
10.4.1.1.2.3.3D Mapping, Modeling, and Reconstruction
10.4.1.1.2.4.Metaverse Platforms
10.4.1.1.2.5.Financial Platforms
10.4.1.1.2.6.Other Software
10.4.1.1.3.Professional Services
10.4.1.1.3.1.Application Development and System Integration
10.4.1.1.3.2.Strategy and business consulting services
10.4.1.2.U.S Metaverse Market Revenue (US$ Mn) and Forecasts, By Industry Vertical
10.4.1.2.1.Consumer
10.4.1.2.1.1.Gaming and Social Media
10.4.1.2.1.2.Live Entertainment and Events
10.4.1.2.2.Commercial
10.4.1.2.2.1.Retail and eCommerce
10.4.1.2.2.2.Education and Corporate
10.4.1.2.2.3.Travel and Tourism
10.4.1.2.2.4.Real Estate
10.4.1.2.3.Industrial Manufacturing
10.4.1.2.4.Healthcare
10.4.1.2.5.Other Verticals
10.4.2.Canada
10.4.2.1.Canada Metaverse Market Revenue (US$ Mn) and Forecasts, By Component
10.4.2.1.1.Hardware
10.4.2.1.1.1.AR devices
10.4.2.1.1.1.1.AR Head-Mounted Displays (HMD)
10.4.2.1.1.1.2.AR smart glasses
10.4.2.1.1.1.3.Smart helmets
10.4.2.1.1.1.4.AR Head-Up Displays (HUD)
10.4.2.1.1.2.VR devices
10.4.2.1.1.2.1.VR Head-Mounted Displays (HMD)
10.4.2.1.1.2.2.Gesture-tracking devices and haptics
10.4.2.1.1.3.MR devices
10.4.2.1.1.4.Displays
10.4.2.1.1.4.1.3D displays
10.4.2.1.1.4.2.Holographic Displays
10.4.2.1.1.4.3.Virtual Mirrors
10.4.2.1.2.Software
10.4.2.1.2.1.Extended Reality Software
10.4.2.1.2.2.Gaming Engines
10.4.2.1.2.3.3D Mapping, Modeling, and Reconstruction
10.4.2.1.2.4.Metaverse Platforms
10.4.2.1.2.5.Financial Platforms
10.4.2.1.2.6.Other Software
10.4.2.1.3.Professional Services
10.4.2.1.3.1.Application Development and System Integration
10.4.2.1.3.2.Strategy and business consulting services
10.4.2.2.Canada Metaverse Market Revenue (US$ Mn) and Forecasts, By Industry Vertical
10.4.2.2.1.Consumer
10.4.2.2.1.1.Gaming and Social Media
10.4.2.2.1.2.Live Entertainment and Events
10.4.2.2.2.Commercial
10.4.2.2.2.1.Retail and eCommerce
10.4.2.2.2.2.Education and Corporate
10.4.2.2.2.3.Travel and Tourism
10.4.2.2.2.4.Real Estate
10.4.2.2.3.Industrial Manufacturing
10.4.2.2.4.Healthcare
10.4.2.2.5.Other Verticals
10.4.3.Mexico
10.4.3.1.Mexico Metaverse Market Revenue (US$ Mn) and Forecasts, By Component
10.4.3.1.1.Hardware
10.4.3.1.1.1.AR devices
10.4.3.1.1.1.1.AR Head-Mounted Displays (HMD)
10.4.3.1.1.1.2.AR smart glasses
10.4.3.1.1.1.3.Smart helmets
10.4.3.1.1.1.4.AR Head-Up Displays (HUD)
10.4.3.1.1.2.VR devices
10.4.3.1.1.2.1.VR Head-Mounted Displays (HMD)
10.4.3.1.1.2.2.Gesture-tracking devices and haptics
10.4.3.1.1.3.MR devices
10.4.3.1.1.4.Displays
10.4.3.1.1.4.1.3D displays
10.4.3.1.1.4.2.Holographic Displays
10.4.3.1.1.4.3.Virtual Mirrors
10.4.3.1.2.Software
10.4.3.1.2.1.Extended Reality Software
10.4.3.1.2.2.Gaming Engines
10.4.3.1.2.3.3D Mapping, Modeling, and Reconstruction
10.4.3.1.2.4.Metaverse Platforms
10.4.3.1.2.5.Financial Platforms
10.4.3.1.2.6.Other Software
10.4.3.1.3.Professional Services
10.4.3.1.3.1.Application Development and System Integration
10.4.3.1.3.2.Strategy and business consulting services
10.4.3.2.Mexico Metaverse Market Revenue (US$ Mn) and Forecasts, By Industry Vertical
10.4.3.2.1.Consumer
10.4.3.2.1.1.Gaming and Social Media
10.4.3.2.1.2.Live Entertainment and Events
10.4.3.2.2.Commercial
10.4.3.2.2.1.Retail and eCommerce
10.4.3.2.2.2.Education and Corporate
10.4.3.2.2.3.Travel and Tourism
10.4.3.2.2.4.Real Estate
10.4.3.2.3.Industrial Manufacturing
10.4.3.2.4.Healthcare
10.4.3.2.5.Other Verticals
10.4.4.Rest of North America
10.4.4.1.Rest of North America Metaverse Market Revenue (US$ Mn) and Forecasts, By Component
10.4.4.1.1.Hardware
10.4.4.1.1.1.AR devices
10.4.4.1.1.1.1.AR Head-Mounted Displays (HMD)
10.4.4.1.1.1.2.AR smart glasses
10.4.4.1.1.1.3.Smart helmets
10.4.4.1.1.1.4.AR Head-Up Displays (HUD)
10.4.4.1.1.2.VR devices
10.4.4.1.1.2.1.VR Head-Mounted Displays (HMD)
10.4.4.1.1.2.2.Gesture-tracking devices and haptics
10.4.4.1.1.3.MR devices
10.4.4.1.1.4.Displays
10.4.4.1.1.4.1.3D displays
10.4.4.1.1.4.2.Holographic Displays
10.4.4.1.1.4.3.Virtual Mirrors
10.4.4.1.2.Software
10.4.4.1.2.1.Extended Reality Software
10.4.4.1.2.2.Gaming Engines
10.4.4.1.2.3.3D Mapping, Modeling, and Reconstruction
10.4.4.1.2.4.Metaverse Platforms
10.4.4.1.2.5.Financial Platforms
10.4.4.1.2.6.Other Software
10.4.4.1.3.Professional Services
10.4.4.1.3.1.Application Development and System Integration
10.4.4.1.3.2.Strategy and business consulting services
10.4.4.2.Rest of North America Metaverse Market Revenue (US$ Mn) and Forecasts, By Industry Vertical
10.4.4.2.1.Consumer
10.4.4.2.1.1.Gaming and Social Media
10.4.4.2.1.2.Live Entertainment and Events
10.4.4.2.2.Commercial
10.4.4.2.2.1.Retail and eCommerce
10.4.4.2.2.2.Education and Corporate
10.4.4.2.2.3.Travel and Tourism
10.4.4.2.2.4.Real Estate
10.4.4.2.3.Industrial Manufacturing
10.4.4.2.4.Healthcare
10.4.4.2.5.Other Verticals
10.5.Key Segment for Channeling Investments
10.5.1.By Country
10.5.2.By Component
10.5.3.By Industry Vertical
11.Europe Metaverse Market Analysis and Forecasts, 2024 – 2034
11.1.Overview
11.1.1.Europe Metaverse Market Revenue (US$ Mn)
11.2.Europe Metaverse Market Revenue (US$ Mn) and Forecasts, By Component
11.2.1.Hardware
11.2.1.1.AR devices
11.2.1.1.1.AR Head-Mounted Displays (HMD)
11.2.1.1.2.AR smart glasses
11.2.1.1.3.Smart helmets
11.2.1.1.4.AR Head-Up Displays (HUD)
11.2.1.2.VR devices
11.2.1.2.1.VR Head-Mounted Displays (HMD)
11.2.1.2.2.Gesture-tracking devices and haptics
11.2.1.3.MR devices
11.2.1.4.Displays
11.2.1.4.1.3D displays
11.2.1.4.2.Holographic Displays
11.2.1.4.3.Virtual Mirrors
11.2.2.Software
11.2.2.1.Extended Reality Software
11.2.2.2.Gaming Engines
11.2.2.3.3D Mapping, Modeling, and Reconstruction
11.2.2.4.Metaverse Platforms
11.2.2.5.Financial Platforms
11.2.2.6.Other Software
11.2.3.Professional Services
11.2.3.1.Application Development and System Integration
11.2.3.2.Strategy and business consulting services
11.3.Europe Metaverse Market Revenue (US$ Mn) and Forecasts, By Industry Vertical
11.3.1.Consumer
11.3.1.1.Gaming and Social Media
11.3.1.2.Live Entertainment and Events
11.3.2.Commercial
11.3.2.1.Retail and eCommerce
11.3.2.2.Education and Corporate
11.3.2.3.Travel and Tourism
11.3.2.4.Real Estate
11.3.3.Industrial Manufacturing
11.3.4.Healthcare
11.3.5.Other Verticals
11.4.Europe Metaverse Market Revenue (US$ Mn) and Forecasts, By Country
11.4.1.France
11.4.1.1.France Metaverse Market Revenue (US$ Mn) and Forecasts, By Component
11.4.1.1.1.Hardware
11.4.1.1.1.1.AR devices
11.4.1.1.1.1.1.AR Head-Mounted Displays (HMD)
11.4.1.1.1.1.2.AR smart glasses
11.4.1.1.1.1.3.Smart helmets
11.4.1.1.1.1.4.AR Head-Up Displays (HUD)
11.4.1.1.1.2.VR devices
11.4.1.1.1.2.1.VR Head-Mounted Displays (HMD)
11.4.1.1.1.2.2.Gesture-tracking devices and haptics
11.4.1.1.1.3.MR devices
11.4.1.1.1.4.Displays
11.4.1.1.1.4.1.3D displays
11.4.1.1.1.4.2.Holographic Displays
11.4.1.1.1.4.3.Virtual Mirrors
11.4.1.1.2.Software
11.4.1.1.2.1.Extended Reality Software
11.4.1.1.2.2.Gaming Engines
11.4.1.1.2.3.3D Mapping, Modeling, and Reconstruction
11.4.1.1.2.4.Metaverse Platforms
11.4.1.1.2.5.Financial Platforms
11.4.1.1.2.6.Other Software
11.4.1.1.3.Professional Services
11.4.1.1.3.1.Application Development and System Integration
11.4.1.1.3.2.Strategy and business consulting services
11.4.1.2.France Metaverse Market Revenue (US$ Mn) and Forecasts, By Industry Vertical
11.4.1.2.1.Consumer
11.4.1.2.1.1.Gaming and Social Media
11.4.1.2.1.2.Live Entertainment and Events
11.4.1.2.2.Commercial
11.4.1.2.2.1.Retail and eCommerce
11.4.1.2.2.2.Education and Corporate
11.4.1.2.2.3.Travel and Tourism
11.4.1.2.2.4.Real Estate
11.4.1.2.3.Industrial Manufacturing
11.4.1.2.4.Healthcare
11.4.1.2.5.Other Verticals
11.4.2.The UK
11.4.2.1.The UK Metaverse Market Revenue (US$ Mn) and Forecasts, By Component
11.4.2.1.1.Hardware
11.4.2.1.1.1.AR devices
11.4.2.1.1.1.1.AR Head-Mounted Displays (HMD)
11.4.2.1.1.1.2.AR smart glasses
11.4.2.1.1.1.3.Smart helmets
11.4.2.1.1.1.4.AR Head-Up Displays (HUD)
11.4.2.1.1.2.VR devices
11.4.2.1.1.2.1.VR Head-Mounted Displays (HMD)
11.4.2.1.1.2.2.Gesture-tracking devices and haptics
11.4.2.1.1.3.MR devices
11.4.2.1.1.4.Displays
11.4.2.1.1.4.1.3D displays
11.4.2.1.1.4.2.Holographic Displays
11.4.2.1.1.4.3.Virtual Mirrors
11.4.2.1.2.Software
11.4.2.1.2.1.Extended Reality Software
11.4.2.1.2.2.Gaming Engines
11.4.2.1.2.3.3D Mapping, Modeling, and Reconstruction
11.4.2.1.2.4.Metaverse Platforms
11.4.2.1.2.5.Financial Platforms
11.4.2.1.2.6.Other Software
11.4.2.1.3.Professional Services
11.4.2.1.3.1.Application Development and System Integration
11.4.2.1.3.2.Strategy and business consulting services
11.4.2.2.The UK Metaverse Market Revenue (US$ Mn) and Forecasts, By Industry Vertical
11.4.2.2.1.Consumer
11.4.2.2.1.1.Gaming and Social Media
11.4.2.2.1.2.Live Entertainment and Events
11.4.2.2.2.Commercial
11.4.2.2.2.1.Retail and eCommerce
11.4.2.2.2.2.Education and Corporate
11.4.2.2.2.3.Travel and Tourism
11.4.2.2.2.4.Real Estate
11.4.2.2.3.Industrial Manufacturing
11.4.2.2.4.Healthcare
11.4.2.2.5.Other Verticals
11.4.3.Spain
11.4.3.1.Spain Metaverse Market Revenue (US$ Mn) and Forecasts, By Component
11.4.3.1.1.Hardware
11.4.3.1.1.1.AR devices
11.4.3.1.1.1.1.AR Head-Mounted Displays (HMD)
11.4.3.1.1.1.2.AR smart glasses
11.4.3.1.1.1.3.Smart helmets
11.4.3.1.1.1.4.AR Head-Up Displays (HUD)
11.4.3.1.1.2.VR devices
11.4.3.1.1.2.1.VR Head-Mounted Displays (HMD)
11.4.3.1.1.2.2.Gesture-tracking devices and haptics
11.4.3.1.1.3.MR devices
11.4.3.1.1.4.Displays
11.4.3.1.1.4.1.3D displays
11.4.3.1.1.4.2.Holographic Displays
11.4.3.1.1.4.3.Virtual Mirrors
11.4.3.1.2.Software
11.4.3.1.2.1.Extended Reality Software
11.4.3.1.2.2.Gaming Engines
11.4.3.1.2.3.3D Mapping, Modeling, and Reconstruction
11.4.3.1.2.4.Metaverse Platforms
11.4.3.1.2.5.Financial Platforms
11.4.3.1.2.6.Other Software
11.4.3.1.3.Professional Services
11.4.3.1.3.1.Application Development and System Integration
11.4.3.1.3.2.Strategy and business consulting services
11.4.3.2.Spain Metaverse Market Revenue (US$ Mn) and Forecasts, By Industry Vertical
11.4.3.2.1.Consumer
11.4.3.2.1.1.Gaming and Social Media
11.4.3.2.1.2.Live Entertainment and Events
11.4.3.2.2.Commercial
11.4.3.2.2.1.Retail and eCommerce
11.4.3.2.2.2.Education and Corporate
11.4.3.2.2.3.Travel and Tourism
11.4.3.2.2.4.Real Estate
11.4.3.2.3.Industrial Manufacturing
11.4.3.2.4.Healthcare
11.4.3.2.5.Other Verticals
11.4.4.Germany
11.4.4.1.Germany Metaverse Market Revenue (US$ Mn) and Forecasts, By Component
11.4.4.1.1.Hardware
11.4.4.1.1.1.AR devices
11.4.4.1.1.1.1.AR Head-Mounted Displays (HMD)
11.4.4.1.1.1.2.AR smart glasses
11.4.4.1.1.1.3.Smart helmets
11.4.4.1.1.1.4.AR Head-Up Displays (HUD)
11.4.4.1.1.2.VR devices
11.4.4.1.1.2.1.VR Head-Mounted Displays (HMD)
11.4.4.1.1.2.2.Gesture-tracking devices and haptics
11.4.4.1.1.3.MR devices
11.4.4.1.1.4.Displays
11.4.4.1.1.4.1.3D displays
11.4.4.1.1.4.2.Holographic Displays
11.4.4.1.1.4.3.Virtual Mirrors
11.4.4.1.2.Software
11.4.4.1.2.1.Extended Reality Software
11.4.4.1.2.2.Gaming Engines
11.4.4.1.2.3.3D Mapping, Modeling, and Reconstruction
11.4.4.1.2.4.Metaverse Platforms
11.4.4.1.2.5.Financial Platforms
11.4.4.1.2.6.Other Software
11.4.4.1.3.Professional Services
11.4.4.1.3.1.Application Development and System Integration
11.4.4.1.3.2.Strategy and business consulting services
11.4.4.2.Germany Metaverse Market Revenue (US$ Mn) and Forecasts, By Industry Vertical
11.4.4.2.1.Consumer
11.4.4.2.1.1.Gaming and Social Media
11.4.4.2.1.2.Live Entertainment and Events
11.4.4.2.2.Commercial
11.4.4.2.2.1.Retail and eCommerce
11.4.4.2.2.2.Education and Corporate
11.4.4.2.2.3.Travel and Tourism
11.4.4.2.2.4.Real Estate
11.4.4.2.3.Industrial Manufacturing
11.4.4.2.4.Healthcare
11.4.4.2.5.Other Verticals
11.4.5.Italy
11.4.5.1.Italy Metaverse Market Revenue (US$ Mn) and Forecasts, By Component
11.4.5.1.1.Hardware
11.4.5.1.1.1.AR devices
11.4.5.1.1.1.1.AR Head-Mounted Displays (HMD)
11.4.5.1.1.1.2.AR smart glasses
11.4.5.1.1.1.3.Smart helmets
11.4.5.1.1.1.4.AR Head-Up Displays (HUD)
11.4.5.1.1.2.VR devices
11.4.5.1.1.2.1.VR Head-Mounted Displays (HMD)
11.4.5.1.1.2.2.Gesture-tracking devices and haptics
11.4.5.1.1.3.MR devices
11.4.5.1.1.4.Displays
11.4.5.1.1.4.1.3D displays
11.4.5.1.1.4.2.Holographic Displays
11.4.5.1.1.4.3.Virtual Mirrors
11.4.5.1.2.Software
11.4.5.1.2.1.Extended Reality Software
11.4.5.1.2.2.Gaming Engines
11.4.5.1.2.3.3D Mapping, Modeling, and Reconstruction
11.4.5.1.2.4.Metaverse Platforms
11.4.5.1.2.5.Financial Platforms
11.4.5.1.2.6.Other Software
11.4.5.1.3.Professional Services
11.4.5.1.3.1.Application Development and System Integration
11.4.5.1.3.2.Strategy and business consulting services
11.4.5.2.Italy Metaverse Market Revenue (US$ Mn) and Forecasts, By Industry Vertical
11.4.5.2.1.Consumer
11.4.5.2.1.1.Gaming and Social Media
11.4.5.2.1.2.Live Entertainment and Events
11.4.5.2.2.Commercial
11.4.5.2.2.1.Retail and eCommerce
11.4.5.2.2.2.Education and Corporate
11.4.5.2.2.3.Travel and Tourism
11.4.5.2.2.4.Real Estate
11.4.5.2.3.Industrial Manufacturing
11.4.5.2.4.Healthcare
11.4.5.2.5.Other Verticals
11.4.6.Nordic Countries
11.4.6.1.Nordic Countries Metaverse Market Revenue (US$ Mn) and Forecasts, By Component
11.4.6.1.1.Hardware
11.4.6.1.1.1.AR devices
11.4.6.1.1.1.1.AR Head-Mounted Displays (HMD)
11.4.6.1.1.1.2.AR smart glasses
11.4.6.1.1.1.3.Smart helmets
11.4.6.1.1.1.4.AR Head-Up Displays (HUD)
11.4.6.1.1.2.VR devices
11.4.6.1.1.2.1.VR Head-Mounted Displays (HMD)
11.4.6.1.1.2.2.Gesture-tracking devices and haptics
11.4.6.1.1.3.MR devices
11.4.6.1.1.4.Displays
11.4.6.1.1.4.1.3D displays
11.4.6.1.1.4.2.Holographic Displays
11.4.6.1.1.4.3.Virtual Mirrors
11.4.6.1.2.Software
11.4.6.1.2.1.Extended Reality Software
11.4.6.1.2.2.Gaming Engines
11.4.6.1.2.3.3D Mapping, Modeling, and Reconstruction
11.4.6.1.2.4.Metaverse Platforms
11.4.6.1.2.5.Financial Platforms
11.4.6.1.2.6.Other Software
11.4.6.1.3.Professional Services
11.4.6.1.3.1.Application Development and System Integration
11.4.6.1.3.2.Strategy and business consulting services
11.4.6.2.Nordic Countries Metaverse Market Revenue (US$ Mn) and Forecasts, By Industry Vertical
11.4.6.2.1.Consumer
11.4.6.2.1.1.Gaming and Social Media
11.4.6.2.1.2.Live Entertainment and Events
11.4.6.2.2.Commercial
11.4.6.2.2.1.Retail and eCommerce
11.4.6.2.2.2.Education and Corporate
11.4.6.2.2.3.Travel and Tourism
11.4.6.2.2.4.Real Estate
11.4.6.2.3.Industrial Manufacturing
11.4.6.2.4.Healthcare
11.4.6.2.5.Other Verticals
11.4.6.3.Nordic Countries Metaverse Market Revenue (US$ Mn) and Forecasts, By Country
11.4.6.3.1.Denmark
11.4.6.3.2.Finland
11.4.6.3.3.Iceland
11.4.6.3.4.Sweden
11.4.6.3.5.Norway
11.4.7.Benelux Union
11.4.7.1.Benelux Union Metaverse Market Revenue (US$ Mn) and Forecasts, By Component
11.4.7.1.1.Hardware
11.4.7.1.1.1.AR devices
11.4.7.1.1.1.1.AR Head-Mounted Displays (HMD)
11.4.7.1.1.1.2.AR smart glasses
11.4.7.1.1.1.3.Smart helmets
11.4.7.1.1.1.4.AR Head-Up Displays (HUD)
11.4.7.1.1.2.VR devices
11.4.7.1.1.2.1.VR Head-Mounted Displays (HMD)
11.4.7.1.1.2.2.Gesture-tracking devices and haptics
11.4.7.1.1.3.MR devices
11.4.7.1.1.4.Displays
11.4.7.1.1.4.1.3D displays
11.4.7.1.1.4.2.Holographic Displays
11.4.7.1.1.4.3.Virtual Mirrors
11.4.7.1.2.Software
11.4.7.1.2.1.Extended Reality Software
11.4.7.1.2.2.Gaming Engines
11.4.7.1.2.3.3D Mapping, Modeling, and Reconstruction
11.4.7.1.2.4.Metaverse Platforms
11.4.7.1.2.5.Financial Platforms
11.4.7.1.2.6.Other Software
11.4.7.1.3.Professional Services
11.4.7.1.3.1.Application Development and System Integration
11.4.7.1.3.2.Strategy and business consulting services
11.4.7.2.Benelux Union Metaverse Market Revenue (US$ Mn) and Forecasts, By Industry Vertical
11.4.7.2.1.Consumer
11.4.7.2.1.1.Gaming and Social Media
11.4.7.2.1.2.Live Entertainment and Events
11.4.7.2.2.Commercial
11.4.7.2.2.1.Retail and eCommerce
11.4.7.2.2.2.Education and Corporate
11.4.7.2.2.3.Travel and Tourism
11.4.7.2.2.4.Real Estate
11.4.7.2.3.Industrial Manufacturing
11.4.7.2.4.Healthcare
11.4.7.2.5.Other Verticals
11.4.7.3.Benelux Union Metaverse Market Revenue (US$ Mn) and Forecasts, By Country
11.4.7.3.1.Belgium
11.4.7.3.2.The Netherlands
11.4.7.3.3.Luxembourg
11.4.8.Rest of Europe
11.4.8.1.Rest of Europe Metaverse Market Revenue (US$ Mn) and Forecasts, By Component
11.4.8.1.1.Hardware
11.4.8.1.1.1.AR devices
11.4.8.1.1.1.1.AR Head-Mounted Displays (HMD)
11.4.8.1.1.1.2.AR smart glasses
11.4.8.1.1.1.3.Smart helmets
11.4.8.1.1.1.4.AR Head-Up Displays (HUD)
11.4.8.1.1.2.VR devices
11.4.8.1.1.2.1.VR Head-Mounted Displays (HMD)
11.4.8.1.1.2.2.Gesture-tracking devices and haptics
11.4.8.1.1.3.MR devices
11.4.8.1.1.4.Displays
11.4.8.1.1.4.1.3D displays
11.4.8.1.1.4.2.Holographic Displays
11.4.8.1.1.4.3.Virtual Mirrors
11.4.8.1.2.Software
11.4.8.1.2.1.Extended Reality Software
11.4.8.1.2.2.Gaming Engines
11.4.8.1.2.3.3D Mapping, Modeling, and Reconstruction
11.4.8.1.2.4.Metaverse Platforms
11.4.8.1.2.5.Financial Platforms
11.4.8.1.2.6.Other Software
11.4.8.1.3.Professional Services
11.4.8.1.3.1.Application Development and System Integration
11.4.8.1.3.2.Strategy and business consulting services
11.4.8.2.Rest of Europe Metaverse Market Revenue (US$ Mn) and Forecasts, By Industry Vertical
11.4.8.2.1.Consumer
11.4.8.2.1.1.Gaming and Social Media
11.4.8.2.1.2.Live Entertainment and Events
11.4.8.2.2.Commercial
11.4.8.2.2.1.Retail and eCommerce
11.4.8.2.2.2.Education and Corporate
11.4.8.2.2.3.Travel and Tourism
11.4.8.2.2.4.Real Estate
11.4.8.2.3.Industrial Manufacturing
11.4.8.2.4.Healthcare
11.4.8.2.5.Other Verticals
11.5.Key Segment for Channeling Investments
11.5.1.By Country
11.5.2.By Component
11.5.3.By Industry Vertical
12.Asia Pacific Metaverse Market Analysis and Forecasts, 2024 – 2034
12.1.Overview
12.1.1.Asia Pacific Metaverse Market Revenue (US$ Mn)
12.2.Asia Pacific Metaverse Market Revenue (US$ Mn) and Forecasts, By Component
12.2.1.Hardware
12.2.1.1.AR devices
12.2.1.1.1.AR Head-Mounted Displays (HMD)
12.2.1.1.2.AR smart glasses
12.2.1.1.3.Smart helmets
12.2.1.1.4.AR Head-Up Displays (HUD)
12.2.1.2.VR devices
12.2.1.2.1.VR Head-Mounted Displays (HMD)
12.2.1.2.2.Gesture-tracking devices and haptics
12.2.1.3.MR devices
12.2.1.4.Displays
12.2.1.4.1.3D displays
12.2.1.4.2.Holographic Displays
12.2.1.4.3.Virtual Mirrors
12.2.2.Software
12.2.2.1.Extended Reality Software
12.2.2.2.Gaming Engines
12.2.2.3.3D Mapping, Modeling, and Reconstruction
12.2.2.4.Metaverse Platforms
12.2.2.5.Financial Platforms
12.2.2.6.Other Software
12.2.3.Professional Services
12.2.3.1.Application Development and System Integration
12.2.3.2.Strategy and business consulting services
12.3.Asia Pacific Metaverse Market Revenue (US$ Mn) and Forecasts, By Industry Vertical
12.3.1.Consumer
12.3.1.1.Gaming and Social Media
12.3.1.2.Live Entertainment and Events
12.3.2.Commercial
12.3.2.1.Retail and eCommerce
12.3.2.2.Education and Corporate
12.3.2.3.Travel and Tourism
12.3.2.4.Real Estate
12.3.3.Industrial Manufacturing
12.3.4.Healthcare
12.3.5.Other Verticals
12.4.Asia Pacific Metaverse Market Revenue (US$ Mn) and Forecasts, By Country
12.4.1.China
12.4.1.1.China Metaverse Market Revenue (US$ Mn) and Forecasts, By Component
12.4.1.1.1.Hardware
12.4.1.1.1.1.AR devices
12.4.1.1.1.1.1.AR Head-Mounted Displays (HMD)
12.4.1.1.1.1.2.AR smart glasses
12.4.1.1.1.1.3.Smart helmets
12.4.1.1.1.1.4.AR Head-Up Displays (HUD)
12.4.1.1.1.2.VR devices
12.4.1.1.1.2.1.VR Head-Mounted Displays (HMD)
12.4.1.1.1.2.2.Gesture-tracking devices and haptics
12.4.1.1.1.3.MR devices
12.4.1.1.1.4.Displays
12.4.1.1.1.4.1.3D displays
12.4.1.1.1.4.2.Holographic Displays
12.4.1.1.1.4.3.Virtual Mirrors
12.4.1.1.2.Software
12.4.1.1.2.1.Extended Reality Software
12.4.1.1.2.2.Gaming Engines
12.4.1.1.2.3.3D Mapping, Modeling, and Reconstruction
12.4.1.1.2.4.Metaverse Platforms
12.4.1.1.2.5.Financial Platforms
12.4.1.1.2.6.Other Software
12.4.1.1.3.Professional Services
12.4.1.1.3.1.Application Development and System Integration
12.4.1.1.3.2.Strategy and business consulting services
12.4.1.2.China Metaverse Market Revenue (US$ Mn) and Forecasts, By Industry Vertical
12.4.1.2.1.Consumer
12.4.1.2.1.1.Gaming and Social Media
12.4.1.2.1.2.Live Entertainment and Events
12.4.1.2.2.Commercial
12.4.1.2.2.1.Retail and eCommerce
12.4.1.2.2.2.Education and Corporate
12.4.1.2.2.3.Travel and Tourism
12.4.1.2.2.4.Real Estate
12.4.1.2.3.Industrial Manufacturing
12.4.1.2.4.Healthcare
12.4.1.2.5.Other Verticals
12.4.2.Japan
12.4.2.1.Japan Metaverse Market Revenue (US$ Mn) and Forecasts, By Component
12.4.2.1.1.Hardware
12.4.2.1.1.1.AR devices
12.4.2.1.1.1.1.AR Head-Mounted Displays (HMD)
12.4.2.1.1.1.2.AR smart glasses
12.4.2.1.1.1.3.Smart helmets
12.4.2.1.1.1.4.AR Head-Up Displays (HUD)
12.4.2.1.1.2.VR devices
12.4.2.1.1.2.1.VR Head-Mounted Displays (HMD)
12.4.2.1.1.2.2.Gesture-tracking devices and haptics
12.4.2.1.1.3.MR devices
12.4.2.1.1.4.Displays
12.4.2.1.1.4.1.3D displays
12.4.2.1.1.4.2.Holographic Displays
12.4.2.1.1.4.3.Virtual Mirrors
12.4.2.1.2.Software
12.4.2.1.2.1.Extended Reality Software
12.4.2.1.2.2.Gaming Engines
12.4.2.1.2.3.3D Mapping, Modeling, and Reconstruction
12.4.2.1.2.4.Metaverse Platforms
12.4.2.1.2.5.Financial Platforms
12.4.2.1.2.6.Other Software
12.4.2.1.3.Professional Services
12.4.2.1.3.1.Application Development and System Integration
12.4.2.1.3.2.Strategy and business consulting services
12.4.2.2.Japan Metaverse Market Revenue (US$ Mn) and Forecasts, By Industry Vertical
12.4.2.2.1.Consumer
12.4.2.2.1.1.Gaming and Social Media
12.4.2.2.1.2.Live Entertainment and Events
12.4.2.2.2.Commercial
12.4.2.2.2.1.Retail and eCommerce
12.4.2.2.2.2.Education and Corporate
12.4.2.2.2.3.Travel and Tourism
12.4.2.2.2.4.Real Estate
12.4.2.2.3.Industrial Manufacturing
12.4.2.2.4.Healthcare
12.4.2.2.5.Other Verticals
12.4.3.India
12.4.3.1.India Metaverse Market Revenue (US$ Mn) and Forecasts, By Component
12.4.3.1.1.Hardware
12.4.3.1.1.1.AR devices
12.4.3.1.1.1.1.AR Head-Mounted Displays (HMD)
12.4.3.1.1.1.2.AR smart glasses
12.4.3.1.1.1.3.Smart helmets
12.4.3.1.1.1.4.AR Head-Up Displays (HUD)
12.4.3.1.1.2.VR devices
12.4.3.1.1.2.1.VR Head-Mounted Displays (HMD)
12.4.3.1.1.2.2.Gesture-tracking devices and haptics
12.4.3.1.1.3.MR devices
12.4.3.1.1.4.Displays
12.4.3.1.1.4.1.3D displays
12.4.3.1.1.4.2.Holographic Displays
12.4.3.1.1.4.3.Virtual Mirrors
12.4.3.1.2.Software
12.4.3.1.2.1.Extended Reality Software
12.4.3.1.2.2.Gaming Engines
12.4.3.1.2.3.3D Mapping, Modeling, and Reconstruction
12.4.3.1.2.4.Metaverse Platforms
12.4.3.1.2.5.Financial Platforms
12.4.3.1.2.6.Other Software
12.4.3.1.3.Professional Services
12.4.3.1.3.1.Application Development and System Integration
12.4.3.1.3.2.Strategy and business consulting services
12.4.3.2.India Metaverse Market Revenue (US$ Mn) and Forecasts, By Industry Vertical
12.4.3.2.1.Consumer
12.4.3.2.1.1.Gaming and Social Media
12.4.3.2.1.2.Live Entertainment and Events
12.4.3.2.2.Commercial
12.4.3.2.2.1.Retail and eCommerce
12.4.3.2.2.2.Education and Corporate
12.4.3.2.2.3.Travel and Tourism
12.4.3.2.2.4.Real Estate
12.4.3.2.3.Industrial Manufacturing
12.4.3.2.4.Healthcare
12.4.3.2.5.Other Verticals
12.4.4.New Zealand
12.4.4.1.New Zealand Metaverse Market Revenue (US$ Mn) and Forecasts, By Component
12.4.4.1.1.Hardware
12.4.4.1.1.1.AR devices
12.4.4.1.1.1.1.AR Head-Mounted Displays (HMD)
12.4.4.1.1.1.2.AR smart glasses
12.4.4.1.1.1.3.Smart helmets
12.4.4.1.1.1.4.AR Head-Up Displays (HUD)
12.4.4.1.1.2.VR devices
12.4.4.1.1.2.1.VR Head-Mounted Displays (HMD)
12.4.4.1.1.2.2.Gesture-tracking devices and haptics
12.4.4.1.1.3.MR devices
12.4.4.1.1.4.Displays
12.4.4.1.1.4.1.3D displays
12.4.4.1.1.4.2.Holographic Displays
12.4.4.1.1.4.3.Virtual Mirrors
12.4.4.1.2.Software
12.4.4.1.2.1.Extended Reality Software
12.4.4.1.2.2.Gaming Engines
12.4.4.1.2.3.3D Mapping, Modeling, and Reconstruction
12.4.4.1.2.4.Metaverse Platforms
12.4.4.1.2.5.Financial Platforms
12.4.4.1.2.6.Other Software
12.4.4.1.3.Professional Services
12.4.4.1.3.1.Application Development and System Integration
12.4.4.1.3.2.Strategy and business consulting services
12.4.4.2.New Zealand Metaverse Market Revenue (US$ Mn) and Forecasts, By Industry Vertical
12.4.4.2.1.Consumer
12.4.4.2.1.1.Gaming and Social Media
12.4.4.2.1.2.Live Entertainment and Events
12.4.4.2.2.Commercial
12.4.4.2.2.1.Retail and eCommerce
12.4.4.2.2.2.Education and Corporate
12.4.4.2.2.3.Travel and Tourism
12.4.4.2.2.4.Real Estate
12.4.4.2.3.Industrial Manufacturing
12.4.4.2.4.Healthcare
12.4.4.2.5.Other Verticals
12.4.5.Australia
12.4.5.1.Australia Metaverse Market Revenue (US$ Mn) and Forecasts, By Component
12.4.5.1.1.Hardware
12.4.5.1.1.1.AR devices
12.4.5.1.1.1.1.AR Head-Mounted Displays (HMD)
12.4.5.1.1.1.2.AR smart glasses
12.4.5.1.1.1.3.Smart helmets
12.4.5.1.1.1.4.AR Head-Up Displays (HUD)
12.4.5.1.1.2.VR devices
12.4.5.1.1.2.1.VR Head-Mounted Displays (HMD)
12.4.5.1.1.2.2.Gesture-tracking devices and haptics
12.4.5.1.1.3.MR devices
12.4.5.1.1.4.Displays
12.4.5.1.1.4.1.3D displays
12.4.5.1.1.4.2.Holographic Displays
12.4.5.1.1.4.3.Virtual Mirrors
12.4.5.1.2.Software
12.4.5.1.2.1.Extended Reality Software
12.4.5.1.2.2.Gaming Engines
12.4.5.1.2.3.3D Mapping, Modeling, and Reconstruction
12.4.5.1.2.4.Metaverse Platforms
12.4.5.1.2.5.Financial Platforms
12.4.5.1.2.6.Other Software
12.4.5.1.3.Professional Services
12.4.5.1.3.1.Application Development and System Integration
12.4.5.1.3.2.Strategy and business consulting services
12.4.5.2.Australia Metaverse Market Revenue (US$ Mn) and Forecasts, By Industry Vertical
12.4.5.2.1.Consumer
12.4.5.2.1.1.Gaming and Social Media
12.4.5.2.1.2.Live Entertainment and Events
12.4.5.2.2.Commercial
12.4.5.2.2.1.Retail and eCommerce
12.4.5.2.2.2.Education and Corporate
12.4.5.2.2.3.Travel and Tourism
12.4.5.2.2.4.Real Estate
12.4.5.2.3.Industrial Manufacturing
12.4.5.2.4.Healthcare
12.4.5.2.5.Other Verticals
12.4.6.South Korea
12.4.6.1.South Korea Metaverse Market Revenue (US$ Mn) and Forecasts, By Component
12.4.6.1.1.Hardware
12.4.6.1.1.1.AR devices
12.4.6.1.1.1.1.AR Head-Mounted Displays (HMD)
12.4.6.1.1.1.2.AR smart glasses
12.4.6.1.1.1.3.Smart helmets
12.4.6.1.1.1.4.AR Head-Up Displays (HUD)
12.4.6.1.1.2.VR devices
12.4.6.1.1.2.1.VR Head-Mounted Displays (HMD)
12.4.6.1.1.2.2.Gesture-tracking devices and haptics
12.4.6.1.1.3.MR devices
12.4.6.1.1.4.Displays
12.4.6.1.1.4.1.3D displays
12.4.6.1.1.4.2.Holographic Displays
12.4.6.1.1.4.3.Virtual Mirrors
12.4.6.1.2.Software
12.4.6.1.2.1.Extended Reality Software
12.4.6.1.2.2.Gaming Engines
12.4.6.1.2.3.3D Mapping, Modeling, and Reconstruction
12.4.6.1.2.4.Metaverse Platforms
12.4.6.1.2.5.Financial Platforms
12.4.6.1.2.6.Other Software
12.4.6.1.3.Professional Services
12.4.6.1.3.1.Application Development and System Integration
12.4.6.1.3.2.Strategy and business consulting services
12.4.6.2.South Korea Metaverse Market Revenue (US$ Mn) and Forecasts, By Industry Vertical
12.4.6.2.1.Consumer
12.4.6.2.1.1.Gaming and Social Media
12.4.6.2.1.2.Live Entertainment and Events
12.4.6.2.2.Commercial
12.4.6.2.2.1.Retail and eCommerce
12.4.6.2.2.2.Education and Corporate
12.4.6.2.2.3.Travel and Tourism
12.4.6.2.2.4.Real Estate
12.4.6.2.3.Industrial Manufacturing
12.4.6.2.4.Healthcare
12.4.6.2.5.Other Verticals
12.4.7.Southeast Asia
12.4.7.1.Southeast Asia Metaverse Market Revenue (US$ Mn) and Forecasts, By Component
12.4.7.1.1.Hardware
12.4.7.1.1.1.AR devices
12.4.7.1.1.1.1.AR Head-Mounted Displays (HMD)
12.4.7.1.1.1.2.AR smart glasses
12.4.7.1.1.1.3.Smart helmets
12.4.7.1.1.1.4.AR Head-Up Displays (HUD)
12.4.7.1.1.2.VR devices
12.4.7.1.1.2.1.VR Head-Mounted Displays (HMD)
12.4.7.1.1.2.2.Gesture-tracking devices and haptics
12.4.7.1.1.3.MR devices
12.4.7.1.1.4.Displays
12.4.7.1.1.4.1.3D displays
12.4.7.1.1.4.2.Holographic Displays
12.4.7.1.1.4.3.Virtual Mirrors
12.4.7.1.2.Software
12.4.7.1.2.1.Extended Reality Software
12.4.7.1.2.2.Gaming Engines
12.4.7.1.2.3.3D Mapping, Modeling, and Reconstruction
12.4.7.1.2.4.Metaverse Platforms
12.4.7.1.2.5.Financial Platforms
12.4.7.1.2.6.Other Software
12.4.7.1.3.Professional Services
12.4.7.1.3.1.Application Development and System Integration
12.4.7.1.3.2.Strategy and business consulting services
12.4.7.2.Southeast Asia Metaverse Market Revenue (US$ Mn) and Forecasts, By Industry Vertical
12.4.7.2.1.Consumer
12.4.7.2.1.1.Gaming and Social Media
12.4.7.2.1.2.Live Entertainment and Events
12.4.7.2.2.Commercial
12.4.7.2.2.1.Retail and eCommerce
12.4.7.2.2.2.Education and Corporate
12.4.7.2.2.3.Travel and Tourism
12.4.7.2.2.4.Real Estate
12.4.7.2.3.Industrial Manufacturing
12.4.7.2.4.Healthcare
12.4.7.2.5.Other Verticals
12.4.7.3.Southeast Asia Metaverse Market Revenue (US$ Mn) and Forecasts, By Country
12.4.7.3.1.Indonesia
12.4.7.3.2.Thailand
12.4.7.3.3.Malaysia
12.4.7.3.4.Singapore
12.4.7.3.5.Rest of Southeast Asia
12.4.8.Rest of Asia Pacific
12.4.8.1.Rest of Asia Pacific Metaverse Market Revenue (US$ Mn) and Forecasts, By Component
12.4.8.1.1.Hardware
12.4.8.1.1.1.AR devices
12.4.8.1.1.1.1.AR Head-Mounted Displays (HMD)
12.4.8.1.1.1.2.AR smart glasses
12.4.8.1.1.1.3.Smart helmets
12.4.8.1.1.1.4.AR Head-Up Displays (HUD)
12.4.8.1.1.2.VR devices
12.4.8.1.1.2.1.VR Head-Mounted Displays (HMD)
12.4.8.1.1.2.2.Gesture-tracking devices and haptics
12.4.8.1.1.3.MR devices
12.4.8.1.1.4.Displays
12.4.8.1.1.4.1.3D displays
12.4.8.1.1.4.2.Holographic Displays
12.4.8.1.1.4.3.Virtual Mirrors
12.4.8.1.2.Software
12.4.8.1.2.1.Extended Reality Software
12.4.8.1.2.2.Gaming Engines
12.4.8.1.2.3.3D Mapping, Modeling, and Reconstruction
12.4.8.1.2.4.Metaverse Platforms
12.4.8.1.2.5.Financial Platforms
12.4.8.1.2.6.Other Software
12.4.8.1.3.Professional Services
12.4.8.1.3.1.Application Development and System Integration
12.4.8.1.3.2.Strategy and business consulting services
12.4.8.2.Rest of Asia Pacific Metaverse Market Revenue (US$ Mn) and Forecasts, By Industry Vertical
12.4.8.2.1.Consumer
12.4.8.2.1.1.Gaming and Social Media
12.4.8.2.1.2.Live Entertainment and Events
12.4.8.2.2.Commercial
12.4.8.2.2.1.Retail and eCommerce
12.4.8.2.2.2.Education and Corporate
12.4.8.2.2.3.Travel and Tourism
12.4.8.2.2.4.Real Estate
12.4.8.2.3.Industrial Manufacturing
12.4.8.2.4.Healthcare
12.4.8.2.5.Other Verticals
12.5.Key Segment for Channeling Investments
12.5.1.By Country
12.5.2.By Component
12.5.3.By Industry Vertical
13.Middle East and Africa Metaverse Market Analysis and Forecasts, 2024 – 2034
13.1.Overview
13.1.1.Middle East and Africa Metaverse Market Revenue (US$ Mn)
13.2.Middle East and Africa Metaverse Market Revenue (US$ Mn) and Forecasts, By Component
13.2.1.Hardware
13.2.1.1.AR devices
13.2.1.1.1.AR Head-Mounted Displays (HMD)
13.2.1.1.2.AR smart glasses
13.2.1.1.3.Smart helmets
13.2.1.1.4.AR Head-Up Displays (HUD)
13.2.1.2.VR devices
13.2.1.2.1.VR Head-Mounted Displays (HMD)
13.2.1.2.2.Gesture-tracking devices and haptics
13.2.1.3.MR devices
13.2.1.4.Displays
13.2.1.4.1.3D displays
13.2.1.4.2.Holographic Displays
13.2.1.4.3.Virtual Mirrors
13.2.2.Software
13.2.2.1.Extended Reality Software
13.2.2.2.Gaming Engines
13.2.2.3.3D Mapping, Modeling, and Reconstruction
13.2.2.4.Metaverse Platforms
13.2.2.5.Financial Platforms
13.2.2.6.Other Software
13.2.3.Professional Services
13.2.3.1.Application Development and System Integration
13.2.3.2.Strategy and business consulting services
13.3.Middle East and Africa Metaverse Market Revenue (US$ Mn) and Forecasts, By Industry Vertical
13.3.1.Consumer
13.3.1.1.Gaming and Social Media
13.3.1.2.Live Entertainment and Events
13.3.2.Commercial
13.3.2.1.Retail and eCommerce
13.3.2.2.Education and Corporate
13.3.2.3.Travel and Tourism
13.3.2.4.Real Estate
13.3.3.Industrial Manufacturing
13.3.4.Healthcare
13.3.5.Other Verticals
13.4.Middle East and Africa Metaverse Market Revenue (US$ Mn) and Forecasts, By Country
13.4.1.Saudi Arabia
13.4.1.1.Saudi Arabia Metaverse Market Revenue (US$ Mn) and Forecasts, By Component
13.4.1.1.1.Hardware
13.4.1.1.1.1.AR devices
13.4.1.1.1.1.1.AR Head-Mounted Displays (HMD)
13.4.1.1.1.1.2.AR smart glasses
13.4.1.1.1.1.3.Smart helmets
13.4.1.1.1.1.4.AR Head-Up Displays (HUD)
13.4.1.1.1.2.VR devices
13.4.1.1.1.2.1.VR Head-Mounted Displays (HMD)
13.4.1.1.1.2.2.Gesture-tracking devices and haptics
13.4.1.1.1.3.MR devices
13.4.1.1.1.4.Displays
13.4.1.1.1.4.1.3D displays
13.4.1.1.1.4.2.Holographic Displays
13.4.1.1.1.4.3.Virtual Mirrors
13.4.1.1.2.Software
13.4.1.1.2.1.Extended Reality Software
13.4.1.1.2.2.Gaming Engines
13.4.1.1.2.3.3D Mapping, Modeling, and Reconstruction
13.4.1.1.2.4.Metaverse Platforms
13.4.1.1.2.5.Financial Platforms
13.4.1.1.2.6.Other Software
13.4.1.1.3.Professional Services
13.4.1.1.3.1.Application Development and System Integration
13.4.1.1.3.2.Strategy and business consulting services
13.4.1.2.Saudi Arabia Metaverse Market Revenue (US$ Mn) and Forecasts, By Industry Vertical
13.4.1.2.1.Consumer
13.4.1.2.1.1.Gaming and Social Media
13.4.1.2.1.2.Live Entertainment and Events
13.4.1.2.2.Commercial
13.4.1.2.2.1.Retail and eCommerce
13.4.1.2.2.2.Education and Corporate
13.4.1.2.2.3.Travel and Tourism
13.4.1.2.2.4.Real Estate
13.4.1.2.3.Industrial Manufacturing
13.4.1.2.4.Healthcare
13.4.1.2.5.Other Verticals
13.4.2.UAE
13.4.2.1.UAE Metaverse Market Revenue (US$ Mn) and Forecasts, By Component
13.4.2.1.1.Hardware
13.4.2.1.1.1.AR devices
13.4.2.1.1.1.1.AR Head-Mounted Displays (HMD)
13.4.2.1.1.1.2.AR smart glasses
13.4.2.1.1.1.3.Smart helmets
13.4.2.1.1.1.4.AR Head-Up Displays (HUD)
13.4.2.1.1.2.VR devices
13.4.2.1.1.2.1.VR Head-Mounted Displays (HMD)
13.4.2.1.1.2.2.Gesture-tracking devices and haptics
13.4.2.1.1.3.MR devices
13.4.2.1.1.4.Displays
13.4.2.1.1.4.1.3D displays
13.4.2.1.1.4.2.Holographic Displays
13.4.2.1.1.4.3.Virtual Mirrors
13.4.2.1.2.Software
13.4.2.1.2.1.Extended Reality Software
13.4.2.1.2.2.Gaming Engines
13.4.2.1.2.3.3D Mapping, Modeling, and Reconstruction
13.4.2.1.2.4.Metaverse Platforms
13.4.2.1.2.5.Financial Platforms
13.4.2.1.2.6.Other Software
13.4.2.1.3.Professional Services
13.4.2.1.3.1.Application Development and System Integration
13.4.2.1.3.2.Strategy and business consulting services
13.4.2.2.UAE Metaverse Market Revenue (US$ Mn) and Forecasts, By Industry Vertical
13.4.2.2.1.Consumer
13.4.2.2.1.1.Gaming and Social Media
13.4.2.2.1.2.Live Entertainment and Events
13.4.2.2.2.Commercial
13.4.2.2.2.1.Retail and eCommerce
13.4.2.2.2.2.Education and Corporate
13.4.2.2.2.3.Travel and Tourism
13.4.2.2.2.4.Real Estate
13.4.2.2.3.Industrial Manufacturing
13.4.2.2.4.Healthcare
13.4.2.2.5.Other Verticals
13.4.3.Egypt
13.4.3.1.Egypt Metaverse Market Revenue (US$ Mn) and Forecasts, By Component
13.4.3.1.1.Hardware
13.4.3.1.1.1.AR devices
13.4.3.1.1.1.1.AR Head-Mounted Displays (HMD)
13.4.3.1.1.1.2.AR smart glasses
13.4.3.1.1.1.3.Smart helmets
13.4.3.1.1.1.4.AR Head-Up Displays (HUD)
13.4.3.1.1.2.VR devices
13.4.3.1.1.2.1.VR Head-Mounted Displays (HMD)
13.4.3.1.1.2.2.Gesture-tracking devices and haptics
13.4.3.1.1.3.MR devices
13.4.3.1.1.4.Displays
13.4.3.1.1.4.1.3D displays
13.4.3.1.1.4.2.Holographic Displays
13.4.3.1.1.4.3.Virtual Mirrors
13.4.3.1.2.Software
13.4.3.1.2.1.Extended Reality Software
13.4.3.1.2.2.Gaming Engines
13.4.3.1.2.3.3D Mapping, Modeling, and Reconstruction
13.4.3.1.2.4.Metaverse Platforms
13.4.3.1.2.5.Financial Platforms
13.4.3.1.2.6.Other Software
13.4.3.1.3.Professional Services
13.4.3.1.3.1.Application Development and System Integration
13.4.3.1.3.2.Strategy and business consulting services
13.4.3.2.Egypt Metaverse Market Revenue (US$ Mn) and Forecasts, By Industry Vertical
13.4.3.2.1.Consumer
13.4.3.2.1.1.Gaming and Social Media
13.4.3.2.1.2.Live Entertainment and Events
13.4.3.2.2.Commercial
13.4.3.2.2.1.Retail and eCommerce
13.4.3.2.2.2.Education and Corporate
13.4.3.2.2.3.Travel and Tourism
13.4.3.2.2.4.Real Estate
13.4.3.2.3.Industrial Manufacturing
13.4.3.2.4.Healthcare
13.4.3.2.5.Other Verticals
13.4.4.Kuwait
13.4.4.1.Kuwait Metaverse Market Revenue (US$ Mn) and Forecasts, By Component
13.4.4.1.1.Hardware
13.4.4.1.1.1.AR devices
13.4.4.1.1.1.1.AR Head-Mounted Displays (HMD)
13.4.4.1.1.1.2.AR smart glasses
13.4.4.1.1.1.3.Smart helmets
13.4.4.1.1.1.4.AR Head-Up Displays (HUD)
13.4.4.1.1.2.VR devices
13.4.4.1.1.2.1.VR Head-Mounted Displays (HMD)
13.4.4.1.1.2.2.Gesture-tracking devices and haptics
13.4.4.1.1.3.MR devices
13.4.4.1.1.4.Displays
13.4.4.1.1.4.1.3D displays
13.4.4.1.1.4.2.Holographic Displays
13.4.4.1.1.4.3.Virtual Mirrors
13.4.4.1.2.Software
13.4.4.1.2.1.Extended Reality Software
13.4.4.1.2.2.Gaming Engines
13.4.4.1.2.3.3D Mapping, Modeling, and Reconstruction
13.4.4.1.2.4.Metaverse Platforms
13.4.4.1.2.5.Financial Platforms
13.4.4.1.2.6.Other Software
13.4.4.1.3.Professional Services
13.4.4.1.3.1.Application Development and System Integration
13.4.4.1.3.2.Strategy and business consulting services
13.4.4.2.Kuwait Metaverse Market Revenue (US$ Mn) and Forecasts, By Industry Vertical
13.4.4.2.1.Consumer
13.4.4.2.1.1.Gaming and Social Media
13.4.4.2.1.2.Live Entertainment and Events
13.4.4.2.2.Commercial
13.4.4.2.2.1.Retail and eCommerce
13.4.4.2.2.2.Education and Corporate
13.4.4.2.2.3.Travel and Tourism
13.4.4.2.2.4.Real Estate
13.4.4.2.3.Industrial Manufacturing
13.4.4.2.4.Healthcare
13.4.4.2.5.Other Verticals
13.4.5.South Africa
13.4.5.1.South Africa Metaverse Market Revenue (US$ Mn) and Forecasts, By Component
13.4.5.1.1.Hardware
13.4.5.1.1.1.AR devices
13.4.5.1.1.1.1.AR Head-Mounted Displays (HMD)
13.4.5.1.1.1.2.AR smart glasses
13.4.5.1.1.1.3.Smart helmets
13.4.5.1.1.1.4.AR Head-Up Displays (HUD)
13.4.5.1.1.2.VR devices
13.4.5.1.1.2.1.VR Head-Mounted Displays (HMD)
13.4.5.1.1.2.2.Gesture-tracking devices and haptics
13.4.5.1.1.3.MR devices
13.4.5.1.1.4.Displays
13.4.5.1.1.4.1.3D displays
13.4.5.1.1.4.2.Holographic Displays
13.4.5.1.1.4.3.Virtual Mirrors
13.4.5.1.2.Software
13.4.5.1.2.1.Extended Reality Software
13.4.5.1.2.2.Gaming Engines
13.4.5.1.2.3.3D Mapping, Modeling, and Reconstruction
13.4.5.1.2.4.Metaverse Platforms
13.4.5.1.2.5.Financial Platforms
13.4.5.1.2.6.Other Software
13.4.5.1.3.Professional Services
13.4.5.1.3.1.Application Development and System Integration
13.4.5.1.3.2.Strategy and business consulting services
13.4.5.2.South Africa Metaverse Market Revenue (US$ Mn) and Forecasts, By Industry Vertical
13.4.5.2.1.Consumer
13.4.5.2.1.1.Gaming and Social Media
13.4.5.2.1.2.Live Entertainment and Events
13.4.5.2.2.Commercial
13.4.5.2.2.1.Retail and eCommerce
13.4.5.2.2.2.Education and Corporate
13.4.5.2.2.3.Travel and Tourism
13.4.5.2.2.4.Real Estate
13.4.5.2.3.Industrial Manufacturing
13.4.5.2.4.Healthcare
13.4.5.2.5.Other Verticals
13.4.6.Rest of Middle East & Africa
13.4.6.1.Rest of Middle East & Africa Metaverse Market Revenue (US$ Mn) and Forecasts, By Component
13.4.6.1.1.Hardware
13.4.6.1.1.1.AR devices
13.4.6.1.1.1.1.AR Head-Mounted Displays (HMD)
13.4.6.1.1.1.2.AR smart glasses
13.4.6.1.1.1.3.Smart helmets
13.4.6.1.1.1.4.AR Head-Up Displays (HUD)
13.4.6.1.1.2.VR devices
13.4.6.1.1.2.1.VR Head-Mounted Displays (HMD)
13.4.6.1.1.2.2.Gesture-tracking devices and haptics
13.4.6.1.1.3.MR devices
13.4.6.1.1.4.Displays
13.4.6.1.1.4.1.3D displays
13.4.6.1.1.4.2.Holographic Displays
13.4.6.1.1.4.3.Virtual Mirrors
13.4.6.1.2.Software
13.4.6.1.2.1.Extended Reality Software
13.4.6.1.2.2.Gaming Engines
13.4.6.1.2.3.3D Mapping, Modeling, and Reconstruction
13.4.6.1.2.4.Metaverse Platforms
13.4.6.1.2.5.Financial Platforms
13.4.6.1.2.6.Other Software
13.4.6.1.3.Professional Services
13.4.6.1.3.1.Application Development and System Integration
13.4.6.1.3.2.Strategy and business consulting services
13.4.6.2.Rest of Middle East & Africa Metaverse Market Revenue (US$ Mn) and Forecasts, By Industry Vertical
13.4.6.2.1.Consumer
13.4.6.2.1.1.Gaming and Social Media
13.4.6.2.1.2.Live Entertainment and Events
13.4.6.2.2.Commercial
13.4.6.2.2.1.Retail and eCommerce
13.4.6.2.2.2.Education and Corporate
13.4.6.2.2.3.Travel and Tourism
13.4.6.2.2.4.Real Estate
13.4.6.2.3.Industrial Manufacturing
13.4.6.2.4.Healthcare
13.4.6.2.5.Other Verticals
13.5.Key Segment for Channeling Investments
13.5.1.By Country
13.5.2.By Component
13.5.3.By Industry Vertical
14.Latin America Metaverse Market Analysis and Forecasts, 2024 – 2034
14.1.Overview
14.1.1.Latin America Metaverse Market Revenue (US$ Mn)
14.2.Latin America Metaverse Market Revenue (US$ Mn) and Forecasts, By Component
14.2.1.Hardware
14.2.1.1.AR devices
14.2.1.1.1.AR Head-Mounted Displays (HMD)
14.2.1.1.2.AR smart glasses
14.2.1.1.3.Smart helmets
14.2.1.1.4.AR Head-Up Displays (HUD)
14.2.1.2.VR devices
14.2.1.2.1.VR Head-Mounted Displays (HMD)
14.2.1.2.2.Gesture-tracking devices and haptics
14.2.1.3.MR devices
14.2.1.4.Displays
14.2.1.4.1.3D displays
14.2.1.4.2.Holographic Displays
14.2.1.4.3.Virtual Mirrors
14.2.2.Software
14.2.2.1.Extended Reality Software
14.2.2.2.Gaming Engines
14.2.2.3.3D Mapping, Modeling, and Reconstruction
14.2.2.4.Metaverse Platforms
14.2.2.5.Financial Platforms
14.2.2.6.Other Software
14.2.3.Professional Services
14.2.3.1.Application Development and System Integration
14.2.3.2.Strategy and business consulting services
14.3.Latin America Metaverse Market Revenue (US$ Mn) and Forecasts, By Industry Vertical
14.3.1.Consumer
14.3.1.1.Gaming and Social Media
14.3.1.2.Live Entertainment and Events
14.3.2.Commercial
14.3.2.1.Retail and eCommerce
14.3.2.2.Education and Corporate
14.3.2.3.Travel and Tourism
14.3.2.4.Real Estate
14.3.3.Industrial Manufacturing
14.3.4.Healthcare
14.3.5.Other Verticals
14.4.Latin America Metaverse Market Revenue (US$ Mn) and Forecasts, By Country
14.4.1.Brazil
14.4.1.1.Brazil Metaverse Market Revenue (US$ Mn) and Forecasts, By Component
14.4.1.1.1.Hardware
14.4.1.1.1.1.AR devices
14.4.1.1.1.1.1.AR Head-Mounted Displays (HMD)
14.4.1.1.1.1.2.AR smart glasses
14.4.1.1.1.1.3.Smart helmets
14.4.1.1.1.1.4.AR Head-Up Displays (HUD)
14.4.1.1.1.2.VR devices
14.4.1.1.1.2.1.VR Head-Mounted Displays (HMD)
14.4.1.1.1.2.2.Gesture-tracking devices and haptics
14.4.1.1.1.3.MR devices
14.4.1.1.1.4.Displays
14.4.1.1.1.4.1.3D displays
14.4.1.1.1.4.2.Holographic Displays
14.4.1.1.1.4.3.Virtual Mirrors
14.4.1.1.2.Software
14.4.1.1.2.1.Extended Reality Software
14.4.1.1.2.2.Gaming Engines
14.4.1.1.2.3.3D Mapping, Modeling, and Reconstruction
14.4.1.1.2.4.Metaverse Platforms
14.4.1.1.2.5.Financial Platforms
14.4.1.1.2.6.Other Software
14.4.1.1.3.Professional Services
14.4.1.1.3.1.Application Development and System Integration
14.4.1.1.3.2.Strategy and business consulting services
14.4.1.2.Brazil Metaverse Market Revenue (US$ Mn) and Forecasts, By Industry Vertical
14.4.1.2.1.Consumer
14.4.1.2.1.1.Gaming and Social Media
14.4.1.2.1.2.Live Entertainment and Events
14.4.1.2.2.Commercial
14.4.1.2.2.1.Retail and eCommerce
14.4.1.2.2.2.Education and Corporate
14.4.1.2.2.3.Travel and Tourism
14.4.1.2.2.4.Real Estate
14.4.1.2.3.Industrial Manufacturing
14.4.1.2.4.Healthcare
14.4.1.2.5.Other Verticals
14.4.2.Argentina
14.4.2.1.Argentina Metaverse Market Revenue (US$ Mn) and Forecasts, By Component
14.4.2.1.1.Hardware
14.4.2.1.1.1.AR devices
14.4.2.1.1.1.1.AR Head-Mounted Displays (HMD)
14.4.2.1.1.1.2.AR smart glasses
14.4.2.1.1.1.3.Smart helmets
14.4.2.1.1.1.4.AR Head-Up Displays (HUD)
14.4.2.1.1.2.VR devices
14.4.2.1.1.2.1.VR Head-Mounted Displays (HMD)
14.4.2.1.1.2.2.Gesture-tracking devices and haptics
14.4.2.1.1.3.MR devices
14.4.2.1.1.4.Displays
14.4.2.1.1.4.1.3D displays
14.4.2.1.1.4.2.Holographic Displays
14.4.2.1.1.4.3.Virtual Mirrors
14.4.2.1.2.Software
14.4.2.1.2.1.Extended Reality Software
14.4.2.1.2.2.Gaming Engines
14.4.2.1.2.3.3D Mapping, Modeling, and Reconstruction
14.4.2.1.2.4.Metaverse Platforms
14.4.2.1.2.5.Financial Platforms
14.4.2.1.2.6.Other Software
14.4.2.1.3.Professional Services
14.4.2.1.3.1.Application Development and System Integration
14.4.2.1.3.2.Strategy and business consulting services
14.4.2.2.Argentina Metaverse Market Revenue (US$ Mn) and Forecasts, By Industry Vertical
14.4.2.2.1.Consumer
14.4.2.2.1.1.Gaming and Social Media
14.4.2.2.1.2.Live Entertainment and Events
14.4.2.2.2.Commercial
14.4.2.2.2.1.Retail and eCommerce
14.4.2.2.2.2.Education and Corporate
14.4.2.2.2.3.Travel and Tourism
14.4.2.2.2.4.Real Estate
14.4.2.2.3.Industrial Manufacturing
14.4.2.2.4.Healthcare
14.4.2.2.5.Other Verticals
14.4.3.Rest of Latin America
14.4.3.1.Rest of Latin America Metaverse Market Revenue (US$ Mn) and Forecasts, By Component
14.4.3.1.1.Hardware
14.4.3.1.1.1.AR devices
14.4.3.1.1.1.1.AR Head-Mounted Displays (HMD)
14.4.3.1.1.1.2.AR smart glasses
14.4.3.1.1.1.3.Smart helmets
14.4.3.1.1.1.4.AR Head-Up Displays (HUD)
14.4.3.1.1.2.VR devices
14.4.3.1.1.2.1.VR Head-Mounted Displays (HMD)
14.4.3.1.1.2.2.Gesture-tracking devices and haptics
14.4.3.1.1.3.MR devices
14.4.3.1.1.4.Displays
14.4.3.1.1.4.1.3D displays
14.4.3.1.1.4.2.Holographic Displays
14.4.3.1.1.4.3.Virtual Mirrors
14.4.3.1.2.Software
14.4.3.1.2.1.Extended Reality Software
14.4.3.1.2.2.Gaming Engines
14.4.3.1.2.3.3D Mapping, Modeling, and Reconstruction
14.4.3.1.2.4.Metaverse Platforms
14.4.3.1.2.5.Financial Platforms
14.4.3.1.2.6.Other Software
14.4.3.1.3.Professional Services
14.4.3.1.3.1.Application Development and System Integration
14.4.3.1.3.2.Strategy and business consulting services
14.4.3.2.Rest of Latin America Metaverse Market Revenue (US$ Mn) and Forecasts, By Industry Vertical
14.4.3.2.1.Consumer
14.4.3.2.1.1.Gaming and Social Media
14.4.3.2.1.2.Live Entertainment and Events
14.4.3.2.2.Commercial
14.4.3.2.2.1.Retail and eCommerce
14.4.3.2.2.2.Education and Corporate
14.4.3.2.2.3.Travel and Tourism
14.4.3.2.2.4.Real Estate
14.4.3.2.3.Industrial Manufacturing
14.4.3.2.4.Healthcare
14.4.3.2.5.Other Verticals
14.5.Key Segment for Channeling Investments
14.5.1.By Country
14.5.2.By Component
14.5.3.By Industry Vertical
15.Competitive Benchmarking
15.1.Brand Benchmarking
15.2.Market Share Analysis, 2023
15.3.Global Presence and Growth Strategies
15.3.1.Mergers and Acquisitions
15.3.2.Product Launches
15.3.3.Investments Trends
15.3.4.R&D Initiatives
16.Player Profiles
16.1.Decentraland
16.1.1.Company Details
16.1.2.Company Overview
16.1.3.Product Offerings
16.1.4.Key Developments
16.1.5.Financial Analysis
16.1.6.SWOT Analysis
16.1.7.Business Strategies
16.2.Epic Games
16.2.1.Company Details
16.2.2.Company Overview
16.2.3.Product Offerings
16.2.4.Key Developments
16.2.5.Financial Analysis
16.2.6.SWOT Analysis
16.2.7.Business Strategies
16.3.META
16.3.1.Company Details
16.3.2.Company Overview
16.3.3.Product Offerings
16.3.4.Key Developments
16.3.5.Financial Analysis
16.3.6.SWOT Analysis
16.3.7.Business Strategies
16.4.Microsoft
16.4.1.Company Details
16.4.2.Company Overview
16.4.3.Product Offerings
16.4.4.Key Developments
16.4.5.Financial Analysis
16.4.6.SWOT Analysis
16.4.7.Business Strategies
16.5.Nextech AR Solutions Inc.
16.5.1.Company Details
16.5.2.Company Overview
16.5.3.Product Offerings
16.5.4.Key Developments
16.5.5.Financial Analysis
16.5.6.SWOT Analysis
16.5.7.Business Strategies
16.6.NVIDIA Corporation
16.6.1.Company Details
16.6.2.Company Overview
16.6.3.Product Offerings
16.6.4.Key Developments
16.6.5.Financial Analysis
16.6.6.SWOT Analysis
16.6.7.Business Strategies
16.7.Qualcomm Technologies, Inc.
16.7.1.Company Details
16.7.2.Company Overview
16.7.3.Product Offerings
16.7.4.Key Developments
16.7.5.Financial Analysis
16.7.6.SWOT Analysis
16.7.7.Business Strategies
16.8.Roblox Corporation
16.8.1.Company Details
16.8.2.Company Overview
16.8.3.Product Offerings
16.8.4.Key Developments
16.8.5.Financial Analysis
16.8.6.SWOT Analysis
16.8.7.Business Strategies
16.9.Snap Inc.
16.9.1.Company Details
16.9.2.Company Overview
16.9.3.Product Offerings
16.9.4.Key Developments
16.9.5.Financial Analysis
16.9.6.SWOT Analysis
16.9.7.Business Strategies
16.10.The Sandbox
16.10.1.Company Details
16.10.2.Company Overview
16.10.3.Product Offerings
16.10.4.Key Developments
16.10.5.Financial Analysis
16.10.6.SWOT Analysis
16.10.7.Business Strategies
16.11.Other Industry Participants
17.Key Findings

.

.

Note: This ToC is tentative and can be changed according to the research study conducted during the course of report completion.

.

**Exclusive for Multi-User and Enterprise User.

Global Metaverse Market

By Component

  • Hardware
    • AR devices
      • AR Head-Mounted Displays (HMD)
      • AR smart glasses
      • Smart helmets
      • AR Head-Up Displays (HUD)
    • VR devices
      • VR Head-Mounted Displays (HMD)
      • Gesture-tracking devices and haptics
    • MR devices
    • Displays
      • 3D displays
      • Holographic Displays
      • Virtual Mirrors
    • Software
      • Extended Reality Software
      • Gaming Engines
      • 3D Mapping, Modeling, and Reconstruction
      • Metaverse Platforms
      • Financial Platforms
      • Other Software
    • Professional Services
      • Application Development and System Integration
      • Strategy and business consulting services

By Industry Vertical

  • Consumer
    • Gaming and Social Media
    • Live Entertainment and Events
  • Commercial
    • Retail and eCommerce
    • Education and Corporate
    • Travel and Tourism
    • Real Estate
  • Industrial Manufacturing
  • Healthcare
  • Other verticals

By Region

  • North America (U.S., Canada, Mexico, Rest of North America)
  • Europe (France, The UK, Spain, Germany, Italy, Nordic Countries (Denmark, Finland, Iceland, Sweden, Norway), Benelux Union (Belgium, The Netherlands, Luxembourg), Rest of Europe)
  • Asia Pacific (China, Japan, India, New Zealand, Australia, South Korea, Southeast Asia (Indonesia, Thailand, Malaysia, Singapore, Rest of Southeast Asia), Rest of Asia Pacific)
  • Middle East & Africa (Saudi Arabia, UAE, Egypt, Kuwait, South Africa, Rest of Middle East & Africa)
  • Latin America (Brazil, Argentina, Rest of Latin America)

The Niche Research approach encompasses both primary and secondary research methods to provide comprehensive insights. While primary research is the cornerstone of our studies, we also incorporate secondary research sources such as company annual reports, premium industry databases, press releases, industry journals, and white papers.

Within our primary research, we actively engage with various industry stakeholders, conducting paid interviews and surveys. Our meticulous analysis extends to every market participant in major countries, allowing us to thoroughly examine their portfolios, calculate market shares, and segment revenues.

Our data collection primarily focuses on individual countries within our research scope, enabling us to estimate regional market sizes. Typically, we employ a bottom-up approach, meticulously tracking trends in different countries. We analyze growth drivers, constraints, technological innovations, and opportunities for each country, ultimately arriving at regional figures.Our process begins by examining the growth prospects of each country. Building upon these insights, we project growth and trends for the entire region. Finally, we utilize our proprietary model to refine estimations and forecasts.

Our data validation standards are integral to ensuring the reliability and accuracy of our research findings. Here’s a breakdown of our data validation processes and the stakeholders we engage with during our primary research:

  • Supply Side Analysis: We initiate a supply side analysis by directly contacting market participants, through telephonic interviews and questionnaires containing both open-ended and close-ended questions. We gather information on their portfolios, segment revenues, developments, and growth strategies.
  • Demand Side Analysis: To gain insights into adoption trends and consumer preferences, we reach out to target customers and users (non-vendors). This information forms a vital part of the qualitative analysis section of our reports, covering market dynamics, adoption trends, consumer behavior, spending patterns, and other related aspects.
  • Consultant Insights: We tap into the expertise of our partner consultants from around the world to obtain their unique viewpoints and perspectives. Their insights contribute to a well-rounded understanding of the markets under investigation.
  • In-House Validation: To ensure data accuracy and reliability, we conduct cross-validation of data points and information through our in-house team of consultants and utilize advanced data modeling tools for thorough verification.

The forecasts we provide are based on a comprehensive assessment of various factors, including:

  • Market Trends and Past Performance (Last Five Years): We accurately analyze market trends and performance data from preceding five years to identify historical patterns and understand the market’s evolution.
  • Historical Performance and Growth of Market Participants: We assess the historical performance and growth trajectories of key market participants. This analysis provides insights into the competitive landscape and individual company strategies.
  • Market Determinants Impact Analysis (Next Eight Years): We conduct a rigorous analysis of the factors that are projected to influence the market over the next eight years. This includes assessing both internal and external determinants that can shape market dynamics.
  • Drivers and Challenges for the Forecast Period:Identify the factors expected to drive market growth during the forecast period, as well as the challenges that the industry may face. This analysis aids in deriving an accurate growth rate projection.
  • New Acquisitions, Collaborations, or Partnerships: We keep a close watch on any new acquisitions, collaborations, or partnerships within the industry. These developments can have a significant impact on market dynamics and competitiveness.
  • Macro and Micro Factors Analysis:A thorough examination of both macro-level factors (e.g., economic trends, regulatory changes) and micro-level factors (e.g., technological advancements, consumer preferences) that may influence the market during the forecast period.
  • End-User Sentiment Analysis: To understand the market from the end-user perspective, we conduct sentiment analysis. This involves assessing the sentiment, preferences, and feedback of the end-users, which can provide valuable insights into market trends.
  • Perspective of Primary Participants: Insights gathered directly from primary research participants play a crucial role in shaping our forecasts. Their perspectives and experiences provide valuable qualitative data.
  • Year-on-Year Growth Trend: We utilize a year-on-year growth trend based on historical market growth and expected future trends. This helps in formulating our growth projections, aligning them with the market’s historical performance.

Research process adopted by TNR involves multiple stages, including data collection, validation, quality checks, and presentation. It’s crucial that the data and information we provide add value to your existing market understanding and expertise. We have also established partnerships with business consulting, research, and survey organizations across regions and globally to collaborate on regional analysis and data validation, ensuring the highest level of accuracy and reliability in our reports.


Procure Comprehensive Study of

Global Metaverse Market

Online Only

  • Online Access
  • Read Only File
  • Validity 3 Months
  • Print, Copy, Paste & Download
  • PPT, Excel
  • Cost-Free Report in the Next Update
$3300
Buy Now

Single User

  • Access to One User on One System
  • Read Only File
  • Validity 6 Months
  • Limited Print,Copy, Paste
  • PPT, Excel
  • Cost-Free Report in the Next Update
$4200
Buy Now

Multi User

  • Access to Fiver Users
  • PDF File
  • Validity 1 Year
  • Upto FivePrints
  • Cost-Free Report in the Next Update
  • PPT, Excel
$6000
Buy Now

Enterprise User

  • Access to Unlimited Users
  • PDF, PPT, Excel
  • Unlimited Validity, Prints&Downloads
  • 1 Hour Cost-Free & Dedicated Analyst Support
  • 10% Cost-Free Customization
  • Cost-Free Report Update Twice in a Year
  • Recommendations for Business Strategies
  • Authorization to Quote TNR, The Niche Research
$7300
Buy Now

Library Access

  • Online Access to Content Publications
  • Access Player Profiles Online
  • Get Immediate Access to Newly Added Content
  • Acquire 12 PDF Downloads
  • Acquire 5 Excel Data Sets
  • Gain Access to 290+ PDFs of Company Profiles
  • Round-the-clock Email and Phone Assistance
  • Dashboard Usage and Trends
  • Renewal & Upgrade Assistance
  • Assessing Customization Options and Alerts for New Reports
$10788
Buy Now
*Taxes/Fees, if applicable will be added during checkout. All prices in USD

Why TNR The Niche Research?

  • Unwavering Commitment to Excellence

  • Veteran Team of Researchers

  • Accurate and Timely Insights

  • Ethical Practices and Customized Service

  • Uninterrupted Availability Around the Clock

Scroll to Top