Global Mobile Application Market By Type, By Application, By Region: Global Insights, Growth, Size, Comparative Analysis, Trends and Forecast, 2023 – 2031

  • Industry: Technology
  • Report ID: TNR-110-1017
  • Number of Pages: 420
  • Table/Charts : Yes
  • November, 2023
  • Base Year : 2024
  • No. of Companies : 9+
  • No. of Countries : 29
  • Views : 10091
  • Covid Impact Covered: Yes
  • War Impact Covered: Yes
  • Formats : PDF, Excel, PPT

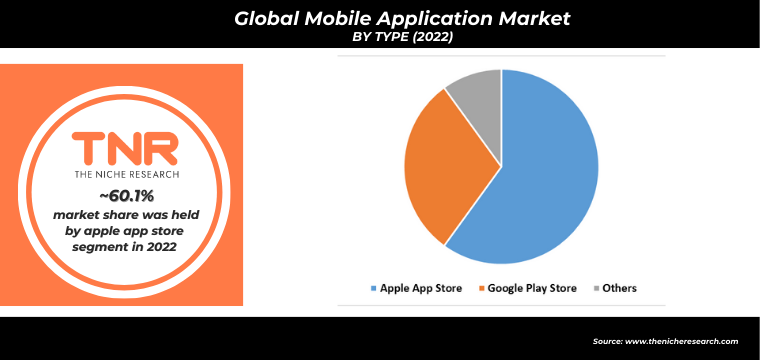
Global Mobile Application Market was Worth US$ 206.15 Billion in 2022, Growing at an Estimated CAGR of 14.2% from 2023-2031.

A mobile application, commonly known as a mobile app, is a software program designed specifically for use on mobile devices such as smartphones and tablets. These apps offer a wide range of functionalities, from entertainment and productivity to communication and utility, enhancing the user’s experience and addressing various needs on the go.

Google Play Store holds dominance in the global mobile application market. It offers a vast selection of Android apps and is used on a wide range of mobile devices. According to the study, in the second quarter of 2021, Google Play Store had over 3 million apps available for download, surpassing the Apple App Store. Android’s broader global presence contributes to Google Play’s dominance.

Global Mobile Application Market Revenue & Forecast, (US$ Million), 2015 – 2031

COVID-19 Impact Analysis on Global Mobile Application Market

Pre-COVID-19, the mobile application market was already on an upward trajectory, driven by increasing smartphone adoption and digitalization trends. However, the pandemic accelerated its growth significantly. As lockdowns and remote work became the norm, mobile apps facilitated remote collaboration, online shopping, entertainment, and healthcare services. Post-COVID-19, the market retained this momentum as digital habits formed during the pandemic continued, and businesses continued to invest in mobile app development to meet evolving consumer and business needs, underscoring the enduring significance of mobile apps in the “new normal.”

A primary driver is the changing consumer behavior driven by convenience in the global mobile application market. The increased reliance on mobile devices for daily activities, such as shopping, communication, and entertainment, fuels the demand for mobile applications. A survey found that in 2020, users spent an average of 4.2 hours per day on mobile apps. This shift in behavior creates opportunities for app developers to cater to users’ needs and preferences, fostering market growth. A significant restraint is the saturation of app marketplaces. With millions of apps available, standing out and attracting users becomes challenging. The competition for visibility is intense, making it difficult for new and lesser-known apps to gain traction. According to a survey, around 25% of installed apps are never used more than once. This underscores the challenge of sustaining user engagement and achieving profitability amid a crowded app ecosystem, posing a barrier for many app developers.

Social media and entertainment applications segment held the largest share in the global mobile application market in 2022. Apps like Facebook, Instagram, TikTok, and streaming services like Netflix and YouTube enjoyed massive user bases and engagement. These apps benefited from the increasing screen time and the need for digital socialization, content consumption, and entertainment, particularly during the COVID-19 pandemic.

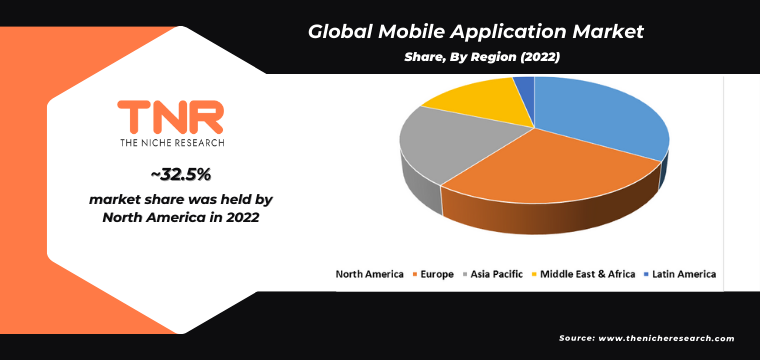
North America accounted for a substantial market share in the global mobile application market in 2022. According to a study, In the U.S., app downloads reached over 31 billion in 2021, showcasing the nation’s substantial app consumption. Notably, Silicon Valley and tech giants like Apple and Google contribute to North America’s dominance in app development and distribution. The region also boasts a robust digital ecosystem, with users increasingly reliant on apps for social media, entertainment, and productivity.

Competitive Landscape: Global Mobile Application Market

  • Apple Inc.
  • CA Technologies
  • China Mobile Limited
  • Cognizant
  • Google
  • Hewlett Packard Enterprise Development LP
  • IBM
  • Intellectsoft US
  • Microsoft
  • Verbat Technologies
  • Other Industry Participants

Global Mobile Application Market Report Coverage

Report Specifications Details
Market Revenue in 2022 US$ 206.15 Billion
Market Size Forecast by 2031 US$ 671.58 Billion
Growth Rate (CAGR) 14.2%
Historic Data 2015 – 2021
Base Year for Estimation 2022
Forecast Period 2023 – 2031
Report Inclusions Market Size & Estimates, Market Dynamics, Competitive Scenario, Trends, Growth Factors, Market Determinants, Key Investment Segmentation, Product/Service/Solutions Benchmarking
Segments Covered By Type, By Application
Regions Covered North America, Europe, Asia Pacific, Middle East & Africa, Latin America
Countries Covered U.S., Canada, Mexico, Rest of North America,  France, The UK, Spain, Germany, Italy, Nordic Countries (Denmark, Finland, Iceland, Sweden, Norway), Benelux Union (Belgium, The Netherlands, Luxembourg), Rest of Europe,  China, Japan, India, New Zealand, Australia, South Korea, Southeast Asia (Indonesia, Thailand, Malaysia, Singapore, Rest of Southeast Asia), Rest of Asia Pacific,  Saudi Arabia, UAE, Egypt, Kuwait, South Africa, Rest of Middle East & Africa,  Brazil, Argentina, Rest of Latin America
Key Players Apple Inc., CA Technologies, China Mobile Limited, Cognizant, Google, Hewlett Packard Enterprise Development LP, IBM, Intellectsoft US, Microsoft, Verbat Technologies, Other Industry Participants
Customization Scope Customization allows for the inclusion/modification of content pertaining to geographical regions, countries, and specific market segments.
Pricing & Procurement Options Explore purchase options tailored to your specific research requirements
Contact Details Consult With Our Expert

Japan (Toll-Free): – +81 663-386-8111

South Korea (Toll-Free): – +82-808- 703-126

Saudi Arabia (Toll-Free): – +966 800 850 1643

United States: +1 302-232-5106

United Kingdom: +447537105080

E-mail:  askanexpert@thenicheresearh.com


Global Mobile Application Market:

By Type

  • Apple App Store
  • Google Play Store
  • Others

By Application

  • Gaming
  • Social Media and Entertainment
  • Health and Fitness
  • Travel and Hospitality
  • Retail and E-Commerce
  • Learning and Education
  • Others

By Region

  • North America (U.S., Canada, Mexico, Rest of North America)
  • Europe (France, The UK, Spain, Germany, Italy, Nordic Countries (Denmark, Finland, Iceland, Sweden, Norway), Benelux Union (Belgium, The Netherlands, Luxembourg), Rest of Europe)
  • Asia Pacific (China, Japan, India, New Zealand, Australia, South Korea, Southeast Asia (Indonesia, Thailand, Malaysia, Singapore, Rest of Southeast Asia), Rest of Asia Pacific)
  • Middle East & Africa (Saudi Arabia, UAE, Egypt, Kuwait, South Africa, Rest of Middle East & Africa)
  • Latin America (Brazil, Argentina, Rest of Latin America)

Report Coverage and Deliverables: LINK


Table of Contents

.

1.Market Scope
1.1.Market Segmentation

1.2.Years Considered
1.2.1.Historic Years: 2015 – 2021

1.2.2.Base Year: 2022

1.2.3.Forecast Years: 2023 – 2031

2.Key Target Audiences

3.Research Methodology
3.1.Primary Research
3.1.1.Research Questionnaire

3.1.2.Global Percentage Breakdown

3.1.3.Primary Interviews: Key Opinion Leaders (KOLs)

3.2.Secondary Research
3.2.1.Paid Databases

3.2.2.Secondary Sources

3.3.Market Size Estimates
3.3.1.Top-Down Approach

3.3.2.Bottom-Up Approach

3.4.Data Triangulation Methodology

3.5.Research Assumptions

4.Recommendations and Insights from TNR’s Perspective**

5.Holistic Overview of Mobile Application Market

6.Market Synopsis: Mobile Application Market

7.Mobile Application Market Analysis: Qualitative Perspective
7.1.Introduction
7.1.1.Product Definition

7.1.2.Industry Development

7.2.Market Dynamics
7.2.1.Drivers

7.2.2.Restraints

7.2.3.Opportunities

7.2.4.Challenges

7.3.Trends in Mobile Application Market

7.4.Market Determinants Radar Chart

7.5.Macro-Economic and Micro-Economic Indicators: Mobile Application Market

7.6.Porter’s Five Force Analysis

7.7.Impact of Covid-19 on Mobile Application Market

7.8.PESTEL Analysis

8.Global Mobile Application Market Analysis and Forecasts, 2023 – 2031
8.1.Overview
8.1.1.Global Mobile Application Market Revenue (US$ Mn)

8.2.Global Mobile Application Market Revenue (US$ Mn) and Forecasts, By Type
8.2.1.Apple App Store
8.2.1.1.Definition

8.2.1.2.Market Estimation and Penetration, 2015 – 2022

8.2.1.3.Market Forecast, 2023 – 2031

8.2.1.4.Compound Annual Growth Rate (CAGR)

8.2.1.5.Regional Bifurcation
8.2.1.5.1.North America
8.2.1.5.1.1.Market Estimation, 2015 – 2022

8.2.1.5.1.2.Market Forecast, 2023 – 2031

8.2.1.5.2.Europe
8.2.1.5.2.1.Market Estimation, 2015 – 2022

8.2.1.5.2.2.Market Forecast, 2023 – 2031

8.2.1.5.3.Asia Pacific
8.2.1.5.3.1.Market Estimation, 2015 – 2022

8.2.1.5.3.2.Market Forecast, 2023 – 2031

8.2.1.5.4.Middle East and Africa
8.2.1.5.4.1.Market Estimation, 2015 – 2022

8.2.1.5.4.2.Market Forecast, 2023 – 2031

8.2.1.5.5.Latin America
8.2.1.5.5.1.Market Estimation, 2015 – 2022

8.2.1.5.5.2.Market Forecast, 2023 – 2031

8.2.2.Google Play Store
8.2.2.1.Definition

8.2.2.2.Market Estimation and Penetration, 2015 – 2022

8.2.2.3.Market Forecast, 2023 – 2031

8.2.2.4.Compound Annual Growth Rate (CAGR)

8.2.2.5.Regional Bifurcation
8.2.2.5.1.North America
8.2.2.5.1.1.Market Estimation, 2015 – 2022

8.2.2.5.1.2.Market Forecast, 2023 – 2031

8.2.2.5.2.Europe
8.2.2.5.2.1.Market Estimation, 2015 – 2022

8.2.2.5.2.2.Market Forecast, 2023 – 2031

8.2.2.5.3.Asia Pacific
8.2.2.5.3.1.Market Estimation, 2015 – 2022

8.2.2.5.3.2.Market Forecast, 2023 – 2031

8.2.2.5.4.Middle East and Africa
8.2.2.5.4.1.Market Estimation, 2015 – 2022

8.2.2.5.4.2.Market Forecast, 2023 – 2031

8.2.2.5.5.Latin America
8.2.2.5.5.1.Market Estimation, 2015 – 2022

8.2.2.5.5.2.Market Forecast, 2023 – 2031

8.2.3.Others
8.2.3.1.Definition

8.2.3.2.Market Estimation and Penetration, 2015 – 2022

8.2.3.3.Market Forecast, 2023 – 2031

8.2.3.4.Compound Annual Growth Rate (CAGR)

8.2.3.5.Regional Bifurcation
8.2.3.5.1.North America
8.2.3.5.1.1.Market Estimation, 2015 – 2022

8.2.3.5.1.2.Market Forecast, 2023 – 2031

8.2.3.5.2.Europe
8.2.3.5.2.1.Market Estimation, 2015 – 2022

8.2.3.5.2.2.Market Forecast, 2023 – 2031

8.2.3.5.3.Asia Pacific
8.2.3.5.3.1.Market Estimation, 2015 – 2022

8.2.3.5.3.2.Market Forecast, 2023 – 2031

8.2.3.5.4.Middle East and Africa
8.2.3.5.4.1.Market Estimation, 2015 – 2022

8.2.3.5.4.2.Market Forecast, 2023 – 2031

8.2.3.5.5.Latin America
8.2.3.5.5.1.Market Estimation, 2015 – 2022

8.2.3.5.5.2.Market Forecast, 2023 – 2031

8.3.Key Segment for Channeling Investments
8.3.1.By Type

9.Global Mobile Application Market Analysis and Forecasts, 2023 – 2031
9.1.Overview

9.2.Global Mobile Application Market Revenue (US$ Mn) and Forecasts, By Application
9.2.1.Gaming
9.2.1.1.Definition

9.2.1.2.Market Estimation and Penetration, 2015 – 2022

9.2.1.3.Market Forecast, 2023 – 2031

9.2.1.4.Compound Annual Growth Rate (CAGR)

9.2.1.5.Regional Bifurcation
9.2.1.5.1.North America
9.2.1.5.1.1.Market Estimation, 2015 – 2022

9.2.1.5.1.2.Market Forecast, 2023 – 2031

9.2.1.5.2.Europe
9.2.1.5.2.1.Market Estimation, 2015 – 2022

9.2.1.5.2.2.Market Forecast, 2023 – 2031

9.2.1.5.3.Asia Pacific
9.2.1.5.3.1.Market Estimation, 2015 – 2022

9.2.1.5.3.2.Market Forecast, 2023 – 2031

9.2.1.5.4.Middle East and Africa
9.2.1.5.4.1.Market Estimation, 2015 – 2022

9.2.1.5.4.2.Market Forecast, 2023 – 2031

9.2.1.5.5.Latin America
9.2.1.5.5.1.Market Estimation, 2015 – 2022

9.2.1.5.5.2.Market Forecast, 2023 – 2031

9.2.2.Social Media and Entertainment
9.2.2.1.Definition

9.2.2.2.Market Estimation and Penetration, 2015 – 2022

9.2.2.3.Market Forecast, 2023 – 2031

9.2.2.4.Compound Annual Growth Rate (CAGR)

9.2.2.5.Regional Bifurcation
9.2.2.5.1.North America
9.2.2.5.1.1.Market Estimation, 2015 – 2022

9.2.2.5.1.2.Market Forecast, 2023 – 2031

9.2.2.5.2.Europe
9.2.2.5.2.1.Market Estimation, 2015 – 2022

9.2.2.5.2.2.Market Forecast, 2023 – 2031

9.2.2.5.3.Asia Pacific
9.2.2.5.3.1.Market Estimation, 2015 – 2022

9.2.2.5.3.2.Market Forecast, 2023 – 2031

9.2.2.5.4.Middle East and Africa
9.2.2.5.4.1.Market Estimation, 2015 – 2022

9.2.2.5.4.2.Market Forecast, 2023 – 2031

9.2.2.5.5.Latin America
9.2.2.5.5.1.Market Estimation, 2015 – 2022

9.2.2.5.5.2.Market Forecast, 2023 – 2031

9.2.3.Health and Fitness
9.2.3.1.Definition

9.2.3.2.Market Estimation and Penetration, 2015 – 2022

9.2.3.3.Market Forecast, 2023 – 2031

9.2.3.4.Compound Annual Growth Rate (CAGR)

9.2.3.5.Regional Bifurcation
9.2.3.5.1.North America
9.2.3.5.1.1.Market Estimation, 2015 – 2022

9.2.3.5.1.2.Market Forecast, 2023 – 2031

9.2.3.5.2.Europe
9.2.3.5.2.1.Market Estimation, 2015 – 2022

9.2.3.5.2.2.Market Forecast, 2023 – 2031

9.2.3.5.3.Asia Pacific
9.2.3.5.3.1.Market Estimation, 2015 – 2022

9.2.3.5.3.2.Market Forecast, 2023 – 2031

9.2.3.5.4.Middle East and Africa
9.2.3.5.4.1.Market Estimation, 2015 – 2022

9.2.3.5.4.2.Market Forecast, 2023 – 2031

9.2.3.5.5.Latin America
9.2.3.5.5.1.Market Estimation, 2015 – 2022

9.2.3.5.5.2.Market Forecast, 2023 – 2031

9.2.4.Travel and Hospitality
9.2.4.1.Definition

9.2.4.2.Market Estimation and Penetration, 2015 – 2022

9.2.4.3.Market Forecast, 2023 – 2031

9.2.4.4.Compound Annual Growth Rate (CAGR)

9.2.4.5.Regional Bifurcation
9.2.4.5.1.North America
9.2.4.5.1.1.Market Estimation, 2015 – 2022

9.2.4.5.1.2.Market Forecast, 2023 – 2031

9.2.4.5.2.Europe
9.2.4.5.2.1.Market Estimation, 2015 – 2022

9.2.4.5.2.2.Market Forecast, 2023 – 2031

9.2.4.5.3.Asia Pacific
9.2.4.5.3.1.Market Estimation, 2015 – 2022

9.2.4.5.3.2.Market Forecast, 2023 – 2031

9.2.4.5.4.Middle East and Africa
9.2.4.5.4.1.Market Estimation, 2015 – 2022

9.2.4.5.4.2.Market Forecast, 2023 – 2031

9.2.4.5.5.Latin America
9.2.4.5.5.1.Market Estimation, 2015 – 2022

9.2.4.5.5.2.Market Forecast, 2023 – 2031

9.2.5.Retail and E-Commerce
9.2.5.1.Definition

9.2.5.2.Market Estimation and Penetration, 2015 – 2022

9.2.5.3.Market Forecast, 2023 – 2031

9.2.5.4.Compound Annual Growth Rate (CAGR)

9.2.5.5.Regional Bifurcation
9.2.5.5.1.North America
9.2.5.5.1.1.Market Estimation, 2015 – 2022

9.2.5.5.1.2.Market Forecast, 2023 – 2031

9.2.5.5.2.Europe
9.2.5.5.2.1.Market Estimation, 2015 – 2022

9.2.5.5.2.2.Market Forecast, 2023 – 2031

9.2.5.5.3.Asia Pacific
9.2.5.5.3.1.Market Estimation, 2015 – 2022

9.2.5.5.3.2.Market Forecast, 2023 – 2031

9.2.5.5.4.Middle East and Africa
9.2.5.5.4.1.Market Estimation, 2015 – 2022

9.2.5.5.4.2.Market Forecast, 2023 – 2031

9.2.5.5.5.Latin America
9.2.5.5.5.1.Market Estimation, 2015 – 2022

9.2.5.5.5.2.Market Forecast, 2023 – 2031

9.2.6.Learning and Education
9.2.6.1.Definition

9.2.6.2.Market Estimation and Penetration, 2015 – 2022

9.2.6.3.Market Forecast, 2023 – 2031

9.2.6.4.Compound Annual Growth Rate (CAGR)

9.2.6.5.Regional Bifurcation
9.2.6.5.1.North America
9.2.6.5.1.1.Market Estimation, 2015 – 2022

9.2.6.5.1.2.Market Forecast, 2023 – 2031

9.2.6.5.2.Europe
9.2.6.5.2.1.Market Estimation, 2015 – 2022

9.2.6.5.2.2.Market Forecast, 2023 – 2031

9.2.6.5.3.Asia Pacific
9.2.6.5.3.1.Market Estimation, 2015 – 2022

9.2.6.5.3.2.Market Forecast, 2023 – 2031

9.2.6.5.4.Middle East and Africa
9.2.6.5.4.1.Market Estimation, 2015 – 2022

9.2.6.5.4.2.Market Forecast, 2023 – 2031

9.2.6.5.5.Latin America
9.2.6.5.5.1.Market Estimation, 2015 – 2022

9.2.6.5.5.2.Market Forecast, 2023 – 2031

9.2.7.Others
9.2.7.1.Definition

9.2.7.2.Market Estimation and Penetration, 2015 – 2022

9.2.7.3.Market Forecast, 2023 – 2031

9.2.7.4.Compound Annual Growth Rate (CAGR)

9.2.7.5.Regional Bifurcation
9.2.7.5.1.North America
9.2.7.5.1.1.Market Estimation, 2015 – 2022

9.2.7.5.1.2.Market Forecast, 2023 – 2031

9.2.7.5.2.Europe
9.2.7.5.2.1.Market Estimation, 2015 – 2022

9.2.7.5.2.2.Market Forecast, 2023 – 2031

9.2.7.5.3.Asia Pacific
9.2.7.5.3.1.Market Estimation, 2015 – 2022

9.2.7.5.3.2.Market Forecast, 2023 – 2031

9.2.7.5.4.Middle East and Africa
9.2.7.5.4.1.Market Estimation, 2015 – 2022

9.2.7.5.4.2.Market Forecast, 2023 – 2031

9.2.7.5.5.Latin America
9.2.7.5.5.1.Market Estimation, 2015 – 2022

9.2.7.5.5.2.Market Forecast, 2023 – 2031

9.3.Key Segment for Channeling Investments
9.3.1.By Application

10.North America Mobile Application Market Analysis and Forecasts, 2023 – 2031
10.1.Overview
10.1.1.North America Mobile Application Market Revenue (US$ Mn)

10.2.North America Mobile Application Market Revenue (US$ Mn) and Forecasts, By Type
10.2.1.Apple App Store

10.2.2.Google Play Store

10.2.3.Others

10.3.North America Mobile Application Market Revenue (US$ Mn) and Forecasts, By Application
10.3.1.Gaming

10.3.2.Social Media and Entertainment

10.3.3.Health and Fitness

10.3.4.Travel and Hospitality

10.3.5.Retail and E-Commerce

10.3.6.Learning and Education

10.3.7.Others

10.4.North America Mobile Application Market Revenue (US$ Mn) and Forecasts, By Country
10.4.1.U.S
10.4.1.1.U.S Mobile Application Market Revenue (US$ Mn) and Forecasts, By Type
10.4.1.1.1.Apple App Store

10.4.1.1.2.Google Play Store

10.4.1.1.3.Others

10.4.1.2.U.S Mobile Application Market Revenue (US$ Mn) and Forecasts, By Application
10.4.1.2.1.Gaming

10.4.1.2.2.Social Media and Entertainment

10.4.1.2.3.Health and Fitness

10.4.1.2.4.Travel and Hospitality

10.4.1.2.5.Retail and E-Commerce

10.4.1.2.6.Learning and Education

10.4.1.2.7.Others

10.4.2.Canada
10.4.2.1.Canada Mobile Application Market Revenue (US$ Mn) and Forecasts, By Type
10.4.2.1.1.Apple App Store

10.4.2.1.2.Google Play Store

10.4.2.1.3.Others

10.4.2.2.Canada Mobile Application Market Revenue (US$ Mn) and Forecasts, By Application
10.4.2.2.1.Gaming

10.4.2.2.2.Social Media and Entertainment

10.4.2.2.3.Health and Fitness

10.4.2.2.4.Travel and Hospitality

10.4.2.2.5.Retail and E-Commerce

10.4.2.2.6.Learning and Education

10.4.2.2.7.Others

10.4.3.Mexico
10.4.3.1.Mexico Mobile Application Market Revenue (US$ Mn) and Forecasts, By Type
10.4.3.1.1.Apple App Store

10.4.3.1.2.Google Play Store

10.4.3.1.3.Others

10.4.3.2.Mexico Mobile Application Market Revenue (US$ Mn) and Forecasts, By Application
10.4.3.2.1.Gaming

10.4.3.2.2.Social Media and Entertainment

10.4.3.2.3.Health and Fitness

10.4.3.2.4.Travel and Hospitality

10.4.3.2.5.Retail and E-Commerce

10.4.3.2.6.Learning and Education

10.4.3.2.7.Others

10.4.4.Rest of North America
10.4.4.1.Rest of North America Mobile Application Market Revenue (US$ Mn) and Forecasts, By Type
10.4.4.1.1.Apple App Store

10.4.4.1.2.Google Play Store

10.4.4.1.3.Others

10.4.4.2.Rest of North America Mobile Application Market Revenue (US$ Mn) and Forecasts, By Application
10.4.4.2.1.Gaming

10.4.4.2.2.Social Media and Entertainment

10.4.4.2.3.Health and Fitness

10.4.4.2.4.Travel and Hospitality

10.4.4.2.5.Retail and E-Commerce

10.4.4.2.6.Learning and Education

10.4.4.2.7.Others

10.5.Key Segment for Channeling Investments
10.5.1.By Country

10.5.2.By Type

10.5.3.By Application

11.Europe Mobile Application Market Analysis and Forecasts, 2023 – 2031
11.1.Overview
11.1.1.Europe Mobile Application Market Revenue (US$ Mn)

11.2.Europe Mobile Application Market Revenue (US$ Mn) and Forecasts, By Type
11.2.1.Apple App Store

11.2.2.Google Play Store

11.2.3.Others

11.3.Europe Mobile Application Market Revenue (US$ Mn) and Forecasts, By Application
11.3.1.Gaming

11.3.2.Social Media and Entertainment

11.3.3.Health and Fitness

11.3.4.Travel and Hospitality

11.3.5.Retail and E-Commerce

11.3.6.Learning and Education

11.3.7.Others

11.4.Europe Mobile Application Market Revenue (US$ Mn) and Forecasts, By Country
11.4.1.France
11.4.1.1.France Mobile Application Market Revenue (US$ Mn) and Forecasts, By Type
11.4.1.1.1.Apple App Store

11.4.1.1.2.Google Play Store

11.4.1.1.3.Others

11.4.1.2.France Mobile Application Market Revenue (US$ Mn) and Forecasts, By Application
11.4.1.2.1.Gaming

11.4.1.2.2.Social Media and Entertainment

11.4.1.2.3.Health and Fitness

11.4.1.2.4.Travel and Hospitality

11.4.1.2.5.Retail and E-Commerce

11.4.1.2.6.Learning and Education

11.4.1.2.7.Others

11.4.2.The UK
11.4.2.1.The UK Mobile Application Market Revenue (US$ Mn) and Forecasts, By Type
11.4.2.1.1.Apple App Store

11.4.2.1.2.Google Play Store

11.4.2.1.3.Others

11.4.2.2.The UK Mobile Application Market Revenue (US$ Mn) and Forecasts, By Application
11.4.2.2.1.Gaming

11.4.2.2.2.Social Media and Entertainment

11.4.2.2.3.Health and Fitness

11.4.2.2.4.Travel and Hospitality

11.4.2.2.5.Retail and E-Commerce

11.4.2.2.6.Learning and Education

11.4.2.2.7.Others

11.4.3.Spain
11.4.3.1.Spain Mobile Application Market Revenue (US$ Mn) and Forecasts, By Type
11.4.3.1.1.Apple App Store

11.4.3.1.2.Google Play Store

11.4.3.1.3.Others

11.4.3.2.Spain Mobile Application Market Revenue (US$ Mn) and Forecasts, By Application
11.4.3.2.1.Gaming

11.4.3.2.2.Social Media and Entertainment

11.4.3.2.3.Health and Fitness

11.4.3.2.4.Travel and Hospitality

11.4.3.2.5.Retail and E-Commerce

11.4.3.2.6.Learning and Education

11.4.3.2.7.Others

11.4.4.Germany
11.4.4.1.Germany Mobile Application Market Revenue (US$ Mn) and Forecasts, By Type
11.4.4.1.1.Apple App Store

11.4.4.1.2.Google Play Store

11.4.4.1.3.Others

11.4.4.2.Germany Mobile Application Market Revenue (US$ Mn) and Forecasts, By Application
11.4.4.2.1.Gaming

11.4.4.2.2.Social Media and Entertainment

11.4.4.2.3.Health and Fitness

11.4.4.2.4.Travel and Hospitality

11.4.4.2.5.Retail and E-Commerce

11.4.4.2.6.Learning and Education

11.4.4.2.7.Others

11.4.5.Italy
11.4.5.1.Italy Mobile Application Market Revenue (US$ Mn) and Forecasts, By Type
11.4.5.1.1.Apple App Store

11.4.5.1.2.Google Play Store

11.4.5.1.3.Others

11.4.5.2.Italy Mobile Application Market Revenue (US$ Mn) and Forecasts, By Application
11.4.5.2.1.Gaming

11.4.5.2.2.Social Media and Entertainment

11.4.5.2.3.Health and Fitness

11.4.5.2.4.Travel and Hospitality

11.4.5.2.5.Retail and E-Commerce

11.4.5.2.6.Learning and Education

11.4.5.2.7.Others

11.4.6.Nordic Countries
11.4.6.1.Nordic Countries Mobile Application Market Revenue (US$ Mn) and Forecasts, By Type
11.4.6.1.1.Apple App Store

11.4.6.1.2.Google Play Store

11.4.6.1.3.Others

11.4.6.2.Nordic Countries Mobile Application Market Revenue (US$ Mn) and Forecasts, By Application
11.4.6.2.1.Gaming

11.4.6.2.2.Social Media and Entertainment

11.4.6.2.3.Health and Fitness

11.4.6.2.4.Travel and Hospitality

11.4.6.2.5.Retail and E-Commerce

11.4.6.2.6.Learning and Education

11.4.6.2.7.Others

11.4.6.3.Nordic Countries Mobile Application Market Revenue (US$ Mn) and Forecasts, By Country
11.4.6.3.1.Denmark

11.4.6.3.2.Finland

11.4.6.3.3.Iceland

11.4.6.3.4.Sweden

11.4.6.3.5.Norway

11.4.7.Benelux Union
11.4.7.1.Benelux Union Mobile Application Market Revenue (US$ Mn) and Forecasts, By Type
11.4.7.1.1.Apple App Store

11.4.7.1.2.Google Play Store

11.4.7.1.3.Others

11.4.7.2.Benelux Union Mobile Application Market Revenue (US$ Mn) and Forecasts, By Application
11.4.7.2.1.Gaming

11.4.7.2.2.Social Media and Entertainment

11.4.7.2.3.Health and Fitness

11.4.7.2.4.Travel and Hospitality

11.4.7.2.5.Retail and E-Commerce

11.4.7.2.6.Learning and Education

11.4.7.2.7.Others

11.4.7.3.Benelux Union Mobile Application Market Revenue (US$ Mn) and Forecasts, By Country
11.4.7.3.1.Belgium

11.4.7.3.2.The Netherlands

11.4.7.3.3.Luxembourg

11.4.8.Rest of Europe
11.4.8.1.Rest of Europe Mobile Application Market Revenue (US$ Mn) and Forecasts, By Type
11.4.8.1.1.Apple App Store

11.4.8.1.2.Google Play Store

11.4.8.1.3.Others

11.4.8.2.Rest of Europe Mobile Application Market Revenue (US$ Mn) and Forecasts, By Application
11.4.8.2.1.Gaming

11.4.8.2.2.Social Media and Entertainment

11.4.8.2.3.Health and Fitness

11.4.8.2.4.Travel and Hospitality

11.4.8.2.5.Retail and E-Commerce

11.4.8.2.6.Learning and Education

11.4.8.2.7.Others

11.5.Key Segment for Channeling Investments
11.5.1.By Country

11.5.2.By Type

11.5.3.By Application

12.Asia Pacific Mobile Application Market Analysis and Forecasts, 2023 – 2031
12.1.Overview
12.1.1.Asia Pacific Mobile Application Market Revenue (US$ Mn)

12.2.Asia Pacific Mobile Application Market Revenue (US$ Mn) and Forecasts, By Type
12.2.1.Apple App Store

12.2.2.Google Play Store

12.2.3.Others

12.3.Asia Pacific Mobile Application Market Revenue (US$ Mn) and Forecasts, By Application
12.3.1.Gaming

12.3.2.Social Media and Entertainment

12.3.3.Health and Fitness

12.3.4.Travel and Hospitality

12.3.5.Retail and E-Commerce

12.3.6.Learning and Education

12.3.7.Others

12.4.Asia Pacific Mobile Application Market Revenue (US$ Mn) and Forecasts, By Country
12.4.1.China
12.4.1.1.China Mobile Application Market Revenue (US$ Mn) and Forecasts, By Type
12.4.1.1.1.Apple App Store

12.4.1.1.2.Google Play Store

12.4.1.1.3.Others

12.4.1.2.China Mobile Application Market Revenue (US$ Mn) and Forecasts, By Application
12.4.1.2.1.Gaming

12.4.1.2.2.Social Media and Entertainment

12.4.1.2.3.Health and Fitness

12.4.1.2.4.Travel and Hospitality

12.4.1.2.5.Retail and E-Commerce

12.4.1.2.6.Learning and Education

12.4.1.2.7.Others

12.4.2.Japan
12.4.2.1.Japan Mobile Application Market Revenue (US$ Mn) and Forecasts, By Type
12.4.2.1.1.Apple App Store

12.4.2.1.2.Google Play Store

12.4.2.1.3.Others

12.4.2.2.Japan Mobile Application Market Revenue (US$ Mn) and Forecasts, By Application
12.4.2.2.1.Gaming

12.4.2.2.2.Social Media and Entertainment

12.4.2.2.3.Health and Fitness

12.4.2.2.4.Travel and Hospitality

12.4.2.2.5.Retail and E-Commerce

12.4.2.2.6.Learning and Education

12.4.2.2.7.Others

12.4.3.India
12.4.3.1.India Mobile Application Market Revenue (US$ Mn) and Forecasts, By Type
12.4.3.1.1.Apple App Store

12.4.3.1.2.Google Play Store

12.4.3.1.3.Others

12.4.3.2.India Mobile Application Market Revenue (US$ Mn) and Forecasts, By Application
12.4.3.2.1.Gaming

12.4.3.2.2.Social Media and Entertainment

12.4.3.2.3.Health and Fitness

12.4.3.2.4.Travel and Hospitality

12.4.3.2.5.Retail and E-Commerce

12.4.3.2.6.Learning and Education

12.4.3.2.7.Others

12.4.4.New Zealand
12.4.4.1.New Zealand Mobile Application Market Revenue (US$ Mn) and Forecasts, By Type
12.4.4.1.1.Apple App Store

12.4.4.1.2.Google Play Store

12.4.4.1.3.Others

12.4.4.2.New Zealand Mobile Application Market Revenue (US$ Mn) and Forecasts, By Application
12.4.4.2.1.Gaming

12.4.4.2.2.Social Media and Entertainment

12.4.4.2.3.Health and Fitness

12.4.4.2.4.Travel and Hospitality

12.4.4.2.5.Retail and E-Commerce

12.4.4.2.6.Learning and Education

12.4.4.2.7.Others

12.4.5.Australia
12.4.5.1.Australia Mobile Application Market Revenue (US$ Mn) and Forecasts, By Type
12.4.5.1.1.Apple App Store

12.4.5.1.2.Google Play Store

12.4.5.1.3.Others

12.4.5.2.Australia Mobile Application Market Revenue (US$ Mn) and Forecasts, By Application
12.4.5.2.1.Gaming

12.4.5.2.2.Social Media and Entertainment

12.4.5.2.3.Health and Fitness

12.4.5.2.4.Travel and Hospitality

12.4.5.2.5.Retail and E-Commerce

12.4.5.2.6.Learning and Education

12.4.5.2.7.Others

12.4.6.South Korea
12.4.6.1.South Korea Mobile Application Market Revenue (US$ Mn) and Forecasts, By Type
12.4.6.1.1.Apple App Store

12.4.6.1.2.Google Play Store

12.4.6.1.3.Others

12.4.6.2.South Korea Mobile Application Market Revenue (US$ Mn) and Forecasts, By Application
12.4.6.2.1.Gaming

12.4.6.2.2.Social Media and Entertainment

12.4.6.2.3.Health and Fitness

12.4.6.2.4.Travel and Hospitality

12.4.6.2.5.Retail and E-Commerce

12.4.6.2.6.Learning and Education

12.4.6.2.7.Others

12.4.7.Southeast Asia
12.4.7.1.Southeast Asia Mobile Application Market Revenue (US$ Mn) and Forecasts, By Type
12.4.7.1.1.Apple App Store

12.4.7.1.2.Google Play Store

12.4.7.1.3.Others

12.4.7.2.Southeast Asia Mobile Application Market Revenue (US$ Mn) and Forecasts, By Application
12.4.7.2.1.Gaming

12.4.7.2.2.Social Media and Entertainment

12.4.7.2.3.Health and Fitness

12.4.7.2.4.Travel and Hospitality

12.4.7.2.5.Retail and E-Commerce

12.4.7.2.6.Learning and Education

12.4.7.2.7.Others

12.4.7.3.Southeast Asia Mobile Application Market Revenue (US$ Mn) and Forecasts, By Country
12.4.7.3.1.Indonesia

12.4.7.3.2.Thailand

12.4.7.3.3.Malaysia

12.4.7.3.4.Singapore

12.4.7.3.5.Rest of Southeast Asia

12.4.8.Rest of Asia Pacific
12.4.8.1.Rest of Asia Pacific Mobile Application Market Revenue (US$ Mn) and Forecasts, By Type
12.4.8.1.1.Apple App Store

12.4.8.1.2.Google Play Store

12.4.8.1.3.Others

12.4.8.2.Rest of Asia Pacific Mobile Application Market Revenue (US$ Mn) and Forecasts, By Application
12.4.8.2.1.Gaming

12.4.8.2.2.Social Media and Entertainment

12.4.8.2.3.Health and Fitness

12.4.8.2.4.Travel and Hospitality

12.4.8.2.5.Retail and E-Commerce

12.4.8.2.6.Learning and Education

12.4.8.2.7.Others

12.5.Key Segment for Channeling Investments
12.5.1.By Country

12.5.2.By Type

12.5.3.By Application

13.Middle East and Africa Mobile Application Market Analysis and Forecasts, 2023 – 2031
13.1.Overview
13.1.1.Middle East and Africa Mobile Application Market Revenue (US$ Mn)

13.2.Middle East and Africa Mobile Application Market Revenue (US$ Mn) and Forecasts, By Type
13.2.1.Apple App Store

13.2.2.Google Play Store

13.2.3.Others

13.3.Middle East and Africa Mobile Application Market Revenue (US$ Mn) and Forecasts, By Application
13.3.1.Gaming

13.3.2.Social Media and Entertainment

13.3.3.Health and Fitness

13.3.4.Travel and Hospitality

13.3.5.Retail and E-Commerce

13.3.6.Learning and Education

13.3.7.Others

13.4.Middle East and Africa Mobile Application Market Revenue (US$ Mn) and Forecasts, By Country
13.4.1.Saudi Arabia
13.4.1.1.Saudi Arabia Mobile Application Market Revenue (US$ Mn) and Forecasts, By Type
13.4.1.1.1.Apple App Store

13.4.1.1.2.Google Play Store

13.4.1.1.3.Others

13.4.1.2.Saudi Arabia Mobile Application Market Revenue (US$ Mn) and Forecasts, By Application
13.4.1.2.1.Gaming

13.4.1.2.2.Social Media and Entertainment

13.4.1.2.3.Health and Fitness

13.4.1.2.4.Travel and Hospitality

13.4.1.2.5.Retail and E-Commerce

13.4.1.2.6.Learning and Education

13.4.1.2.7.Others

13.4.2.UAE
13.4.2.1.UAE Mobile Application Market Revenue (US$ Mn) and Forecasts, By Type
13.4.2.1.1.Apple App Store

13.4.2.1.2.Google Play Store

13.4.2.1.3.Others

13.4.2.2.UAE Mobile Application Market Revenue (US$ Mn) and Forecasts, By Application
13.4.2.2.1.Gaming

13.4.2.2.2.Social Media and Entertainment

13.4.2.2.3.Health and Fitness

13.4.2.2.4.Travel and Hospitality

13.4.2.2.5.Retail and E-Commerce

13.4.2.2.6.Learning and Education

13.4.2.2.7.Others

13.4.3.Egypt
13.4.3.1.Egypt Mobile Application Market Revenue (US$ Mn) and Forecasts, By Type
13.4.3.1.1.Apple App Store

13.4.3.1.2.Google Play Store

13.4.3.1.3.Others

13.4.3.2.Egypt Mobile Application Market Revenue (US$ Mn) and Forecasts, By Application
13.4.3.2.1.Gaming

13.4.3.2.2.Social Media and Entertainment

13.4.3.2.3.Health and Fitness

13.4.3.2.4.Travel and Hospitality

13.4.3.2.5.Retail and E-Commerce

13.4.3.2.6.Learning and Education

13.4.3.2.7.Others

13.4.4.Kuwait
13.4.4.1.Kuwait Mobile Application Market Revenue (US$ Mn) and Forecasts, By Type
13.4.4.1.1.Apple App Store

13.4.4.1.2.Google Play Store

13.4.4.1.3.Others

13.4.4.2.Kuwait Mobile Application Market Revenue (US$ Mn) and Forecasts, By Application
13.4.4.2.1.Gaming

13.4.4.2.2.Social Media and Entertainment

13.4.4.2.3.Health and Fitness

13.4.4.2.4.Travel and Hospitality

13.4.4.2.5.Retail and E-Commerce

13.4.4.2.6.Learning and Education

13.4.4.2.7.Others

13.4.5.South Africa
13.4.5.1.South Africa Mobile Application Market Revenue (US$ Mn) and Forecasts, By Type
13.4.5.1.1.Apple App Store

13.4.5.1.2.Google Play Store

13.4.5.1.3.Others

13.4.5.2.South Africa Mobile Application Market Revenue (US$ Mn) and Forecasts, By Application
13.4.5.2.1.Gaming

13.4.5.2.2.Social Media and Entertainment

13.4.5.2.3.Health and Fitness

13.4.5.2.4.Travel and Hospitality

13.4.5.2.5.Retail and E-Commerce

13.4.5.2.6.Learning and Education

13.4.5.2.7.Others

13.4.6.Rest of Middle East & Africa
13.4.6.1.Rest of Middle East & Africa Mobile Application Market Revenue (US$ Mn) and Forecasts, By Type
13.4.6.1.1.Apple App Store

13.4.6.1.2.Google Play Store

13.4.6.1.3.Others

13.4.6.2.Rest of Middle East & Africa Mobile Application Market Revenue (US$ Mn) and Forecasts, By Application
13.4.6.2.1.Gaming

13.4.6.2.2.Social Media and Entertainment

13.4.6.2.3.Health and Fitness

13.4.6.2.4.Travel and Hospitality

13.4.6.2.5.Retail and E-Commerce

13.4.6.2.6.Learning and Education

13.4.6.2.7.Others

13.5.Key Segment for Channeling Investments
13.5.1.By Country

13.5.2.By Type

13.5.3.By Application

14.Latin America Mobile Application Market Analysis and Forecasts, 2023 – 2031
14.1.Overview
14.1.1.Latin America Mobile Application Market Revenue (US$ Mn)

14.2.Latin America Mobile Application Market Revenue (US$ Mn) and Forecasts, By Type
14.2.1.Apple App Store

14.2.2.Google Play Store

14.2.3.Others

14.3.Latin America Mobile Application Market Revenue (US$ Mn) and Forecasts, By Application
14.3.1.Gaming

14.3.2.Social Media and Entertainment

14.3.3.Health and Fitness

14.3.4.Travel and Hospitality

14.3.5.Retail and E-Commerce

14.3.6.Learning and Education

14.3.7.Others

14.4.Latin America Mobile Application Market Revenue (US$ Mn) and Forecasts, By Country
14.4.1.Brazil
14.4.1.1.Brazil Mobile Application Market Revenue (US$ Mn) and Forecasts, By Type
14.4.1.1.1.Apple App Store

14.4.1.1.2.Google Play Store

14.4.1.1.3.Others

14.4.1.2.Brazil Mobile Application Market Revenue (US$ Mn) and Forecasts, By Application
14.4.1.2.1.Gaming

14.4.1.2.2.Social Media and Entertainment

14.4.1.2.3.Health and Fitness

14.4.1.2.4.Travel and Hospitality

14.4.1.2.5.Retail and E-Commerce

14.4.1.2.6.Learning and Education

14.4.1.2.7.Others

14.4.2.Argentina
14.4.2.1.Argentina Mobile Application Market Revenue (US$ Mn) and Forecasts, By Type
14.4.2.1.1.Apple App Store

14.4.2.1.2.Google Play Store

14.4.2.1.3.Others

14.4.2.2.Argentina Mobile Application Market Revenue (US$ Mn) and Forecasts, By Application
14.4.2.2.1.Gaming

14.4.2.2.2.Social Media and Entertainment

14.4.2.2.3.Health and Fitness

14.4.2.2.4.Travel and Hospitality

14.4.2.2.5.Retail and E-Commerce

14.4.2.2.6.Learning and Education

14.4.2.2.7.Others

14.4.3.Rest of Latin America
14.4.3.1.Rest of Latin America Mobile Application Market Revenue (US$ Mn) and Forecasts, By Type
14.4.3.1.1.Apple App Store

14.4.3.1.2.Google Play Store

14.4.3.1.3.Others

14.4.3.2.Rest of Latin America Mobile Application Market Revenue (US$ Mn) and Forecasts, By Application
14.4.3.2.1.Gaming

14.4.3.2.2.Social Media and Entertainment

14.4.3.2.3.Health and Fitness

14.4.3.2.4.Travel and Hospitality

14.4.3.2.5.Retail and E-Commerce

14.4.3.2.6.Learning and Education

14.4.3.2.7.Others

14.5.Key Segment for Channeling Investments
14.5.1.By Country

14.5.2.By Type

14.5.3.By Application

15.Competitive Benchmarking
15.1.Market Share Analysis, 2022

15.2.Global Presence and Growth Strategies
15.2.1.Mergers and Acquisitions

15.2.2.Product Launches

15.2.3.Investments Trends

15.2.4.R&D Initiatives

16.Player Profiles
16.1.Apple Inc.
16.1.1.Company Details

16.1.2.Company Overview

16.1.3.Product Offerings

16.1.4.Key Developments

16.1.5.Financial Analysis

16.1.6.SWOT Analysis

16.1.7.Business Strategies

16.2.CA Technologies
16.2.1.Company Details

16.2.2.Company Overview

16.2.3.Product Offerings

16.2.4.Key Developments

16.2.5.Financial Analysis

16.2.6.SWOT Analysis

16.2.7.Business Strategies

16.3.China Mobile Limited
16.3.1.Company Details

16.3.2.Company Overview

16.3.3.Product Offerings

16.3.4.Key Developments

16.3.5.Financial Analysis

16.3.6.SWOT Analysis

16.3.7.Business Strategies

16.4.Cognizant
16.4.1.Company Details

16.4.2.Company Overview

16.4.3.Product Offerings

16.4.4.Key Developments

16.4.5.Financial Analysis

16.4.6.SWOT Analysis

16.4.7.Business Strategies

16.5.Google
16.5.1.Company Details

16.5.2.Company Overview

16.5.3.Product Offerings

16.5.4.Key Developments

16.5.5.Financial Analysis

16.5.6.SWOT Analysis

16.5.7.Business Strategies

16.6.Hewlett Packard Enterprise Development LP
16.6.1.Company Details

16.6.2.Company Overview

16.6.3.Product Offerings

16.6.4.Key Developments

16.6.5.Financial Analysis

16.6.6.SWOT Analysis

16.6.7.Business Strategies

16.7.IBM
16.7.1.Company Details

16.7.2.Company Overview

16.7.3.Product Offerings

16.7.4.Key Developments

16.7.5.Financial Analysis

16.7.6.SWOT Analysis

16.7.7.Business Strategies

16.8.Intellectsoft US
16.8.1.Company Details

16.8.2.Company Overview

16.8.3.Product Offerings

16.8.4.Key Developments

16.8.5.Financial Analysis

16.8.6.SWOT Analysis

16.8.7.Business Strategies

16.9.Microsoft
16.9.1.Company Details

16.9.2.Company Overview

16.9.3.Product Offerings

16.9.4.Key Developments

16.9.5.Financial Analysis

16.9.6.SWOT Analysis

16.9.7.Business Strategies

16.10.Verbat Technologies
16.10.1.Company Details

16.10.2.Company Overview

16.10.3.Product Offerings

16.10.4.Key Developments

16.10.5.Financial Analysis

16.10.6.SWOT Analysis

16.10.7.Business Strategies

16.11.Other Market Participants

17.Key Findings

.

**Exclusive for Multi-User and Enterprise User.

Global Mobile Application Market Segmentation

By Type

 Apple App Store

 Google Play Store

 Others

By Application

 Gaming

 Social Media and Entertainment

 Health and Fitness

 Travel and Hospitality

 Retail and E-Commerce

 Learning and Education

 Others

By Region

 North America (U.S., Canada, Mexico, Rest of North America)

 Europe (France, The UK, Spain, Germany, Italy, Nordic Countries (Denmark, Finland, Iceland, Sweden, Norway), Benelux Union (Belgium, The Netherlands, Luxembourg), Rest of Europe)

 Asia Pacific (China, Japan, India, New Zealand, Australia, South Korea, Southeast Asia (Indonesia, Thailand, Malaysia, Singapore, Rest of Southeast Asia), Rest of Asia Pacific)

 Middle East & Africa (Saudi Arabia, UAE, Egypt, Kuwait, South Africa, Rest of Middle East & Africa)

 Latin America (Brazil, Argentina, Rest of Latin America)

**Note: The report covers cross-segmentation analysis by region further into countries

.

The Niche Research approach encompasses both primary and secondary research methods to provide comprehensive insights. While primary research is the cornerstone of our studies, we also incorporate secondary research sources such as company annual reports, premium industry databases, press releases, industry journals, and white papers.

Within our primary research, we actively engage with various industry stakeholders, conducting paid interviews and surveys. Our meticulous analysis extends to every market participant in major countries, allowing us to thoroughly examine their portfolios, calculate market shares, and segment revenues.

Our data collection primarily focuses on individual countries within our research scope, enabling us to estimate regional market sizes. Typically, we employ a bottom-up approach, meticulously tracking trends in different countries. We analyze growth drivers, constraints, technological innovations, and opportunities for each country, ultimately arriving at regional figures.Our process begins by examining the growth prospects of each country. Building upon these insights, we project growth and trends for the entire region. Finally, we utilize our proprietary model to refine estimations and forecasts.

Our data validation standards are integral to ensuring the reliability and accuracy of our research findings. Here’s a breakdown of our data validation processes and the stakeholders we engage with during our primary research:

  • Supply Side Analysis: We initiate a supply side analysis by directly contacting market participants, through telephonic interviews and questionnaires containing both open-ended and close-ended questions. We gather information on their portfolios, segment revenues, developments, and growth strategies.
  • Demand Side Analysis: To gain insights into adoption trends and consumer preferences, we reach out to target customers and users (non-vendors). This information forms a vital part of the qualitative analysis section of our reports, covering market dynamics, adoption trends, consumer behavior, spending patterns, and other related aspects.
  • Consultant Insights: We tap into the expertise of our partner consultants from around the world to obtain their unique viewpoints and perspectives. Their insights contribute to a well-rounded understanding of the markets under investigation.
  • In-House Validation: To ensure data accuracy and reliability, we conduct cross-validation of data points and information through our in-house team of consultants and utilize advanced data modeling tools for thorough verification.

The forecasts we provide are based on a comprehensive assessment of various factors, including:

  • Market Trends and Past Performance (Last Five Years): We accurately analyze market trends and performance data from preceding five years to identify historical patterns and understand the market’s evolution.
  • Historical Performance and Growth of Market Participants: We assess the historical performance and growth trajectories of key market participants. This analysis provides insights into the competitive landscape and individual company strategies.
  • Market Determinants Impact Analysis (Next Eight Years): We conduct a rigorous analysis of the factors that are projected to influence the market over the next eight years. This includes assessing both internal and external determinants that can shape market dynamics.
  • Drivers and Challenges for the Forecast Period:Identify the factors expected to drive market growth during the forecast period, as well as the challenges that the industry may face. This analysis aids in deriving an accurate growth rate projection.
  • New Acquisitions, Collaborations, or Partnerships: We keep a close watch on any new acquisitions, collaborations, or partnerships within the industry. These developments can have a significant impact on market dynamics and competitiveness.
  • Macro and Micro Factors Analysis:A thorough examination of both macro-level factors (e.g., economic trends, regulatory changes) and micro-level factors (e.g., technological advancements, consumer preferences) that may influence the market during the forecast period.
  • End-User Sentiment Analysis: To understand the market from the end-user perspective, we conduct sentiment analysis. This involves assessing the sentiment, preferences, and feedback of the end-users, which can provide valuable insights into market trends.
  • Perspective of Primary Participants: Insights gathered directly from primary research participants play a crucial role in shaping our forecasts. Their perspectives and experiences provide valuable qualitative data.
  • Year-on-Year Growth Trend: We utilize a year-on-year growth trend based on historical market growth and expected future trends. This helps in formulating our growth projections, aligning them with the market’s historical performance.

Research process adopted by TNR involves multiple stages, including data collection, validation, quality checks, and presentation. It’s crucial that the data and information we provide add value to your existing market understanding and expertise. We have also established partnerships with business consulting, research, and survey organizations across regions and globally to collaborate on regional analysis and data validation, ensuring the highest level of accuracy and reliability in our reports.


Procure Comprehensive Study of

Global Mobile Application Market

Online Only

  • Online Access
  • Read Only File
  • Validity 3 Months
  • Print, Copy, Paste & Download
  • PPT, Excel
  • Cost-Free Report in the Next Update
$3300
Buy Now

Single User

  • Access to One User on One System
  • Read Only File
  • Validity 6 Months
  • Limited Print,Copy, Paste
  • PPT, Excel
  • Cost-Free Report in the Next Update
$4200
Buy Now

Multi User

  • Access to Fiver Users
  • PDF File
  • Validity 1 Year
  • Upto FivePrints
  • Cost-Free Report in the Next Update
  • PPT, Excel
$6000
Buy Now

Enterprise User

  • Access to Unlimited Users
  • PDF, PPT, Excel
  • Unlimited Validity, Prints&Downloads
  • 1 Hour Cost-Free & Dedicated Analyst Support
  • 10% Cost-Free Customization
  • Cost-Free Report Update Twice in a Year
  • Recommendations for Business Strategies
  • Authorization to Quote TNR, The Niche Research
$7300
Buy Now

Library Access

  • Online Access to Content Publications
  • Access Player Profiles Online
  • Get Immediate Access to Newly Added Content
  • Acquire 12 PDF Downloads
  • Acquire 5 Excel Data Sets
  • Gain Access to 290+ PDFs of Company Profiles
  • Round-the-clock Email and Phone Assistance
  • Dashboard Usage and Trends
  • Renewal & Upgrade Assistance
  • Assessing Customization Options and Alerts for New Reports
$10788
Buy Now
*Taxes/Fees, if applicable will be added during checkout. All prices in USD

Why TNR The Niche Research?

  • Unwavering Commitment to Excellence

  • Veteran Team of Researchers

  • Accurate and Timely Insights

  • Ethical Practices and Customized Service

  • Uninterrupted Availability Around the Clock

Scroll to Top