Global Mobile Medical Imaging Market, By Product Type, By Imaging Technology, By Application, By End User, By Region & Segmental Insights Trends and Forecast, 2024 – 2034

  • Industry: Healthcare
  • Report ID: TNR-110-1321
  • Number of Pages: 420
  • Table/Charts : Yes
  • October, 2024
  • Base Year : 2024
  • No. of Companies : 10+
  • No. of Countries : 29
  • Views : 10030
  • Covid Impact Covered: Yes
  • War Impact Covered: Yes
  • Formats : PDF, Excel, PPT

Mobile medical imaging refers to the use of portable devices to capture diagnostic images, such as X-rays, MRIs, CT scans, and ultrasounds, outside of traditional healthcare settings. This technology is crucial for providing medical care in remote areas, emergency situations, or nursing homes, where patients may not have easy access to hospitals. It offers real-time diagnostics, enabling quicker decision-making and treatment.

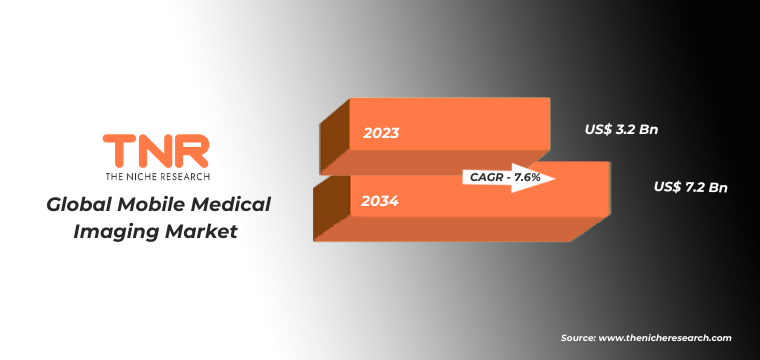
For example, during the COVID-19 pandemic in 2020, mobile X-ray units were widely deployed to diagnose lung infections without patients needing to visit overcrowded hospitals. Similarly, ambulances equipped with mobile imaging units allow paramedics to assess stroke victims on-site, improving outcomes. As of 2023, the global mobile medical imaging market continues to grow, driven by advancements in technology and rising demand for remote healthcare solutions. “In Terms of Revenue, the Global Mobile Medical Imaging Market was Worth US$ 3.2 Bn in 2023, Anticipated to Witness CAGR of 7.6% During 2024 – 2034.

Use Case Description Example Year
Emergency Medical Services (EMS) Mobile imaging units, such as portable ultrasound and X-ray machines, are used in ambulances for quick assessments and diagnostics. The use of portable ultrasound in ambulances allows paramedics to assess cardiac conditions on-site, enhancing patient management before hospital arrival. 2022
Rural and Remote Healthcare Mobile medical imaging brings essential diagnostic services to underserved areas, improving healthcare access. Mindray’s portable ultrasound devices have been deployed in rural clinics across China, ensuring that patients receive timely care without needing to travel far. 2023
Outpatient Services Hospitals and clinics use mobile imaging units to provide diagnostic services for outpatient visits, minimizing wait times. The University of Iowa Hospitals adopted mobile MRI services to streamline outpatient care and improve patient access to imaging. 2022
Sports Medicine Mobile imaging is used on-site at sporting events to quickly diagnose injuries and facilitate immediate care. Mobile MRI units have been employed at major sports events, such as the Olympics, to assess athletes’ injuries and ensure prompt treatment. 2021
Disaster Response and Humanitarian Aid Mobile imaging helps in disaster-stricken areas to assess injuries and provide immediate medical care. After natural disasters, mobile X-ray and CT machines are deployed in affected regions to evaluate trauma cases, as seen after the 2020 Beirut explosion. 2020
Pediatric Care Mobile imaging units can be used in pediatric settings to provide comfort and reduce anxiety in young patients. Portable ultrasound systems are used in pediatric emergency departments to quickly assess conditions while minimizing the need for patient transport. 2023
Long-term Care Facilities Mobile imaging allows for regular monitoring of residents in nursing homes or assisted living facilities. Portable X-ray machines are used in long-term care facilities to reduce the need for transporting elderly patients, enhancing comfort and convenience. 2022
Telemedicine Integration Mobile imaging units equipped with telemedicine capabilities enable remote consultations and diagnostics. Mobile ultrasound systems that connect with telehealth platforms allow specialists to review images in real-time, aiding diagnosis for patients in remote areas. 2023

Growth Drivers in the Global Mobile Medical Imaging Market

  • Growing Demand for Point-of-Care Diagnostics:

One key growth driver of the global mobile medical imaging market is the rising demand for point-of-care diagnostics, particularly in remote and underserved areas. Mobile imaging devices enable healthcare providers to offer diagnostic services in places where traditional imaging infrastructure is limited. For example, mobile ultrasound units are increasingly used in rural clinics across Africa, allowing expectant mothers to receive prenatal care without traveling long distances. In 2023, point-of-care imaging is being adopted in emergency situations, such as in disaster-hit areas, where fast, accurate diagnoses are critical. This trend is pushing healthcare systems worldwide to invest in portable imaging solutions to improve patient outcomes and accessibility.

  • Technological Advancements in Portable Imaging Devices:

Advancements in portable imaging technology are driving the growth of the mobile medical imaging market. With continuous innovation, mobile imaging devices like X-rays and MRIs have become lighter, more efficient, and capable of delivering high-quality images. For instance, in 2021, GE Healthcare launched a portable MRI system that provides detailed brain scans in emergency rooms, helping reduce diagnosis time for stroke patients. The integration of AI and cloud-based solutions has also enhanced the efficiency of these devices, allowing faster image analysis and remote consultations. These technological improvements are essential in meeting the rising demand for quick, accessible medical imaging worldwide.

Global Mobile Medical Imaging Market Segmental Analysis-

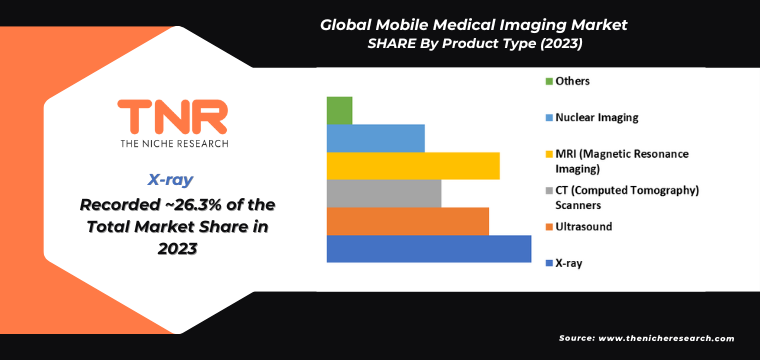
In 2023, the X-ray segment by product type led the global mobile medical imaging market, capturing a revenue share of 26.3%. The dominance of mobile X-rays is driven by their widespread use in diverse healthcare settings, including emergency rooms, nursing homes, and remote areas. For example, mobile X-ray units are frequently used in ambulances to diagnose fractures and chest injuries on-site, enabling faster treatment. During the COVID-19 pandemic, these devices became essential for diagnosing lung conditions without requiring patients to visit hospitals. Additionally, mobile X-rays offer lower operational costs and are easy to transport, making them a popular choice for point-of-care diagnostics.

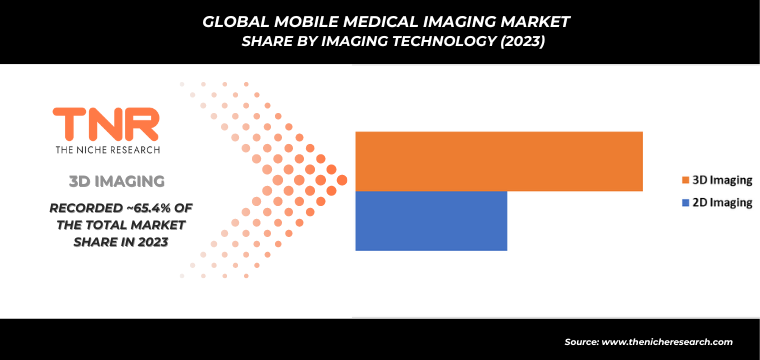
In 2023, 3D imaging technology dominated the global mobile medical imaging market, capturing a revenue share of 65.4%, surpassing 2D imaging. This shift is attributed to the superior clarity and depth that 3D imaging provides, enhancing diagnostic accuracy. For example, mobile 3D imaging systems are widely used in orthopedic clinics to capture detailed bone structures, enabling better surgical planning. In dental practices, 3D imaging offers precise views of teeth and jaw structures for implant procedures. Additionally, 3D imaging in mobile devices is revolutionizing cancer diagnostics by providing clearer views of tumor structures, allowing more effective treatment planning and improving patient outcomes.

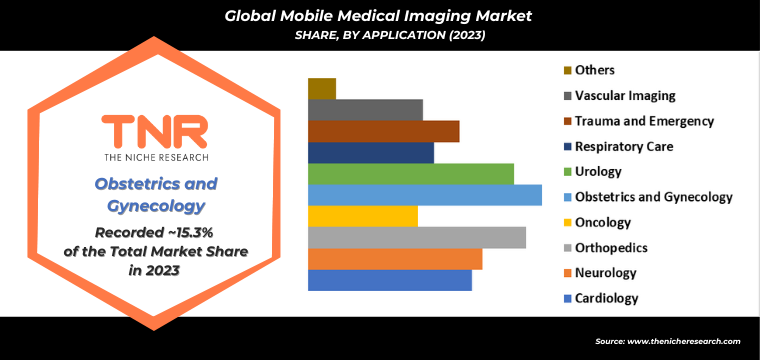
In 2023, the urology segment emerged as the fastest-growing application in the global mobile medical imaging market, accounting for a revenue share of 13.5%. This growth is driven by the increasing demand for portable ultrasound and X-ray systems in diagnosing urological conditions such as kidney stones, prostate issues, and bladder disorders. Mobile imaging allows for rapid, non-invasive diagnostics, especially in outpatient settings or during home visits. For example, portable ultrasound devices are used to assess kidney function in remote areas without the need for hospital visits. Additionally, mobile imaging enables urologists to monitor patient conditions more frequently, improving early detection and personalized treatment plans.

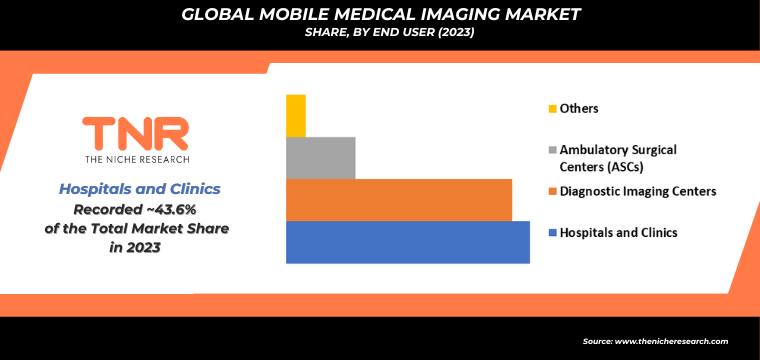
In 2023, diagnostic imaging centers secured the second leading position in the global mobile medical imaging market, holding a revenue share of 40.5%. These centers are increasingly adopting mobile imaging solutions to meet the rising demand for flexible, on-site diagnostics. For instance, mobile MRI and CT scanners allow imaging centers to serve patients in rural or underserved areas without requiring costly fixed installations. During the pandemic, diagnostic centers relied heavily on mobile X-ray units for COVID-19 lung assessments, reducing hospital congestion. Additionally, mobile imaging improves patient convenience, enabling faster diagnoses and reducing the need for hospital visits, which has contributed to its growing adoption.

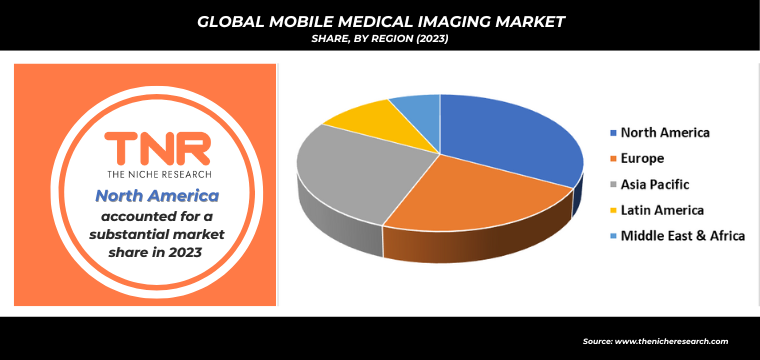
In 2023, Europe strengthened its position in the global mobile medical imaging market, accounting for a revenue share of 22.9%. This growth is driven by advancements in healthcare infrastructure and increasing demand for mobile diagnostic solutions across the region. For example, mobile imaging units are widely used in rural areas of countries like Germany and France, where access to traditional imaging facilities is limited. Additionally, European healthcare systems are integrating mobile X-ray and ultrasound devices in home care settings to monitor elderly patients and manage chronic conditions more efficiently. The adoption of mobile imaging during the COVID-19 pandemic further highlighted its value in Europe’s healthcare landscape.

Competitive Landscape

Some of the players operating in the mobile medical imaging market are

  • Allengers Medical Systems
  • Analogic Corporation
  • Butterfly Network, Inc.
  • Canon Medical Systems
  • Carestream Health
  • Fujifilm Holdings Corporation
  • GE Healthcare
  • Hologic, Inc.
  • Konica Minolta Healthcare
  • Mindray Medical International Limited
  • Philips Healthcare
  • Samsung Medison
  • Shimadzu Corporation
  • Siemens Healthineers
  • Ziehm Imaging
  • Other Industry Participants

Recent Developments:

  • Launch of the Portable Ultrasound System by Philips (April 2023):

In April 2023, Philips announced the launch of its latest portable ultrasound system, the Philips Lumify. This handheld device enables healthcare providers to perform ultrasound imaging directly at the point of care, including in remote and emergency settings. The Lumify system integrates with mobile devices for real-time sharing of images and reports, facilitating quick consultations and enhancing patient management. This development marks a significant advancement in mobile medical imaging, making high-quality diagnostic imaging more accessible.

  • Introduction of AI-Powered Mobile X-ray Units by GE Healthcare (June 2023):

In June 2023, GE Healthcare unveiled its AI-powered mobile X-ray unit, the Revolution Maxima, designed to enhance diagnostic accuracy and workflow efficiency. This mobile imaging system incorporates artificial intelligence to assist radiologists in interpreting images quickly, identifying critical conditions such as pneumonia or fractures. The Revolution Maxima can be used in various settings, including emergency departments and outpatient clinics, providing rapid diagnostics that improve patient outcomes and streamline operations.

Global Mobile Medical Imaging Market Scope:

Report Specifications Details
Market Revenue in 2023 US$ 3.2 Bn
Market Size Forecast by 2034 US$ 7.2 Bn
Growth Rate (CAGR) 7.6%
Historic Data 2016 – 2022
Base Year for Estimation 2023
Forecast Period 2024 – 2034
Report Inclusions Market Size & Estimates, Market Dynamics, Competitive Scenario, Trends, Growth Factors, Market Determinants, Key Investment Segmentation, Product/Service/Solutions Benchmarking
Segments Covered By Product Type, By Imaging Technology, By Application, By End User, By Region
Regions Covered North America, Europe, Asia Pacific, Middle East & Africa, Latin America
Countries Covered U.S., Canada, Mexico, Rest of North America,  France, The UK, Spain, Germany, Italy, Nordic Countries (Denmark, Finland, Iceland, Sweden, Norway), Benelux Union (Belgium, The Netherlands, Luxembourg), Rest of Europe,  China, Japan, India, New Zealand, Australia, South Korea, Southeast Asia (Indonesia, Thailand, Malaysia, Singapore, Rest of Southeast Asia), Rest of Asia Pacific,  Saudi Arabia, UAE, Egypt, Kuwait, South Africa, Rest of Middle East & Africa,  Brazil, Argentina, Rest of Latin America
Key Players Allengers Medical Systems, Analogic Corporation, Butterfly Network, Inc., Canon Medical Systems, Carestream Health, Fujifilm Holdings Corporation, GE Healthcare, Hologic, Inc., Konica Minolta Healthcare, Mindray Medical International Limited, Philips Healthcare, Samsung Medison, Shimadzu Corporation, Siemens Healthineers, Ziehm Imaging
Customization Scope Customization allows for the inclusion/modification of content pertaining to geographical regions, countries, and specific market segments.
Pricing & Procurement Options Explore purchase options tailored to your specific research requirements
Contact Details Consult With Our Expert

Japan (Toll-Free):  +81 663-386-8111

South Korea (Toll-Free):  +82-808- 703-126

Saudi Arabia (Toll-Free):  +966 800-850-1643

United Kingdom: +44 753-710-5080

United States: +1 302-232-5106

E-mail:  askanexpert@thenicheresearch.com


Global Mobile Medical Imaging Market

By Product Type

  • X-ray
  • Ultrasound
  • CT (Computed Tomography) Scanners
  • MRI (Magnetic Resonance Imaging)
  • Nuclear Imaging
  • Others

By Imaging Technology

  • 2D Imaging
  • 3D Imaging

By Application

  • Cardiology
  • Neurology
  • Orthopedics
  • Oncology
  • Obstetrics and Gynecology
  • Urology
  • Respiratory Care
  • Trauma and Emergency
  • Vascular Imaging
  • Others

By End User

  • Hospitals and Clinics
  • Diagnostic Imaging Centers
  • Ambulatory Surgical Centers (ASCs)
  • Others

By Region

  • North America (U.S., Canada, Mexico, Rest of North America)
  • Europe (France, The UK, Spain, Germany, Italy, Nordic Countries (Denmark, Finland, Iceland, Sweden, Norway), Benelux Union (Belgium, The Netherlands, Luxembourg), Rest of Europe)
  • Asia Pacific (China, Japan, India, New Zealand, Australia, South Korea, Southeast Asia (Indonesia, Thailand, Malaysia, Singapore, Rest of Southeast Asia), Rest of Asia Pacific)
  • Middle East & Africa (Saudi Arabia, UAE, Egypt, Kuwait, South Africa, Rest of Middle East & Africa)
  • Latin America (Brazil, Argentina, Rest of Latin America)

Report Layout:

Table of Contents

.

1.Market Scope
1.1.Market Segmentation
1.2.Years Considered
1.2.1.Historic Years: 2016 – 2022
1.2.2.Base Year: 2023
1.2.3.Forecast Years: 2024 – 2034
2.Key Target Audiences
3.Research Methodology
3.1.Primary Research
3.1.1.Research Questionnaire
3.1.2.Global Percentage Breakdown
3.1.3.Primary Interviews: Key Opinion Leaders (KOLs)
3.2.Secondary Research
3.2.1.Paid Databases
3.2.2.Secondary Sources
3.3.Market Size Estimates
3.3.1.Top-Down Approach
3.3.2.Bottom-Up Approach
3.4.Data Triangulation Methodology
3.5.Research Assumptions
4.Recommendations and Insights from TNR’s Perspective**
5.Holistic Overview of Mobile Medical Imaging Market
6.Market Synopsis: Mobile Medical Imaging Market
7.Mobile Medical Imaging Market Analysis: Qualitative Perspective
7.1.Introduction
7.1.1.Product Definition
7.1.2.Industry Development
7.2.Market Dynamics
7.2.1.Drivers
7.2.2.Restraints
7.2.3.Opportunities
7.2.4.Challenges
7.3.Trends in Mobile Medical Imaging Market
7.4.Market Determinants Radar Chart
7.5.Macro-Economic and Micro-Economic Indicators: Mobile Medical Imaging Market
7.6.Industry Gross Margin Overview
7.7.Porter’s Five Force Analysis
7.8.Impact of Covid-19 on Mobile Medical Imaging Market
7.9.PESTEL Analysis
7.10.Value Chain Analysis
7.11.Pricing Analysis, By Region (2023)
7.11.1.North America
7.11.2.Europe
7.11.3.Asia Pacific
7.11.4.Middle East and Africa
7.11.5.Latin America
8.Global Mobile Medical Imaging Market Analysis and Forecasts, 2024 – 2034
8.1.Overview
8.1.1.Global Mobile Medical Imaging Market Revenue (US$ Mn)
8.2.Global Mobile Medical Imaging Market Revenue (US$ Mn) and Forecasts, By Product Type
8.2.1.X-ray
8.2.1.1.Definition
8.2.1.2.Market Estimation and Penetration, 2016 – 2023
8.2.1.3.Market Forecast, 2024 – 2034
8.2.1.4.Compound Annual Growth Rate (CAGR)
8.2.1.5.Regional Bifurcation
8.2.1.5.1.North America
8.2.1.5.1.1.Market Estimation, 2016 – 2023
8.2.1.5.1.2.Market Forecast, 2024 – 2034
8.2.1.5.2.Europe
8.2.1.5.2.1.Market Estimation, 2016 – 2023
8.2.1.5.2.2.Market Forecast, 2024 – 2034
8.2.1.5.3.Asia Pacific
8.2.1.5.3.1.Market Estimation, 2016 – 2023
8.2.1.5.3.2.Market Forecast, 2024 – 2034
8.2.1.5.4.Middle East and Africa
8.2.1.5.4.1.Market Estimation, 2016 – 2023
8.2.1.5.4.2.Market Forecast, 2024 – 2034
8.2.1.5.5.Latin America
8.2.1.5.5.1.Market Estimation, 2016 – 2023
8.2.1.5.5.2.Market Forecast, 2024 – 2034
8.2.2.Ultrasound
8.2.2.1.Definition
8.2.2.2.Market Estimation and Penetration, 2016 – 2023
8.2.2.3.Market Forecast, 2024 – 2034
8.2.2.4.Compound Annual Growth Rate (CAGR)
8.2.2.5.Regional Bifurcation
8.2.2.5.1.North America
8.2.2.5.1.1.Market Estimation, 2016 – 2023
8.2.2.5.1.2.Market Forecast, 2024 – 2034
8.2.2.5.2.Europe
8.2.2.5.2.1.Market Estimation, 2016 – 2023
8.2.2.5.2.2.Market Forecast, 2024 – 2034
8.2.2.5.3.Asia Pacific
8.2.2.5.3.1.Market Estimation, 2016 – 2023
8.2.2.5.3.2.Market Forecast, 2024 – 2034
8.2.2.5.4.Middle East and Africa
8.2.2.5.4.1.Market Estimation, 2016 – 2023
8.2.2.5.4.2.Market Forecast, 2024 – 2034
8.2.2.5.5.Latin America
8.2.2.5.5.1.Market Estimation, 2016 – 2023
8.2.2.5.5.2.Market Forecast, 2024 – 2034
8.2.3.CT (Computed Tomography) Scanners
8.2.3.1.Definition
8.2.3.2.Market Estimation and Penetration, 2016 – 2023
8.2.3.3.Market Forecast, 2024 – 2034
8.2.3.4.Compound Annual Growth Rate (CAGR)
8.2.3.5.Regional Bifurcation
8.2.3.5.1.North America
8.2.3.5.1.1.Market Estimation, 2016 – 2023
8.2.3.5.1.2.Market Forecast, 2024 – 2034
8.2.3.5.2.Europe
8.2.3.5.2.1.Market Estimation, 2016 – 2023
8.2.3.5.2.2.Market Forecast, 2024 – 2034
8.2.3.5.3.Asia Pacific
8.2.3.5.3.1.Market Estimation, 2016 – 2023
8.2.3.5.3.2.Market Forecast, 2024 – 2034
8.2.3.5.4.Middle East and Africa
8.2.3.5.4.1.Market Estimation, 2016 – 2023
8.2.3.5.4.2.Market Forecast, 2024 – 2034
8.2.3.5.5.Latin America
8.2.3.5.5.1.Market Estimation, 2016 – 2023
8.2.3.5.5.2.Market Forecast, 2024 – 2034
8.2.4.MRI (Magnetic Resonance Imaging)
8.2.4.1.Definition
8.2.4.2.Market Estimation and Penetration, 2016 – 2023
8.2.4.3.Market Forecast, 2024 – 2034
8.2.4.4.Compound Annual Growth Rate (CAGR)
8.2.4.5.Regional Bifurcation
8.2.4.5.1.North America
8.2.4.5.1.1.Market Estimation, 2016 – 2023
8.2.4.5.1.2.Market Forecast, 2024 – 2034
8.2.4.5.2.Europe
8.2.4.5.2.1.Market Estimation, 2016 – 2023
8.2.4.5.2.2.Market Forecast, 2024 – 2034
8.2.4.5.3.Asia Pacific
8.2.4.5.3.1.Market Estimation, 2016 – 2023
8.2.4.5.3.2.Market Forecast, 2024 – 2034
8.2.4.5.4.Middle East and Africa
8.2.4.5.4.1.Market Estimation, 2016 – 2023
8.2.4.5.4.2.Market Forecast, 2024 – 2034
8.2.4.5.5.Latin America
8.2.4.5.5.1.Market Estimation, 2016 – 2023
8.2.4.5.5.2.Market Forecast, 2024 – 2034
8.2.5.Nuclear Imaging
8.2.5.1.Definition
8.2.5.2.Market Estimation and Penetration, 2016 – 2023
8.2.5.3.Market Forecast, 2024 – 2034
8.2.5.4.Compound Annual Growth Rate (CAGR)
8.2.5.5.Regional Bifurcation
8.2.5.5.1.North America
8.2.5.5.1.1.Market Estimation, 2016 – 2023
8.2.5.5.1.2.Market Forecast, 2024 – 2034
8.2.5.5.2.Europe
8.2.5.5.2.1.Market Estimation, 2016 – 2023
8.2.5.5.2.2.Market Forecast, 2024 – 2034
8.2.5.5.3.Asia Pacific
8.2.5.5.3.1.Market Estimation, 2016 – 2023
8.2.5.5.3.2.Market Forecast, 2024 – 2034
8.2.5.5.4.Middle East and Africa
8.2.5.5.4.1.Market Estimation, 2016 – 2023
8.2.5.5.4.2.Market Forecast, 2024 – 2034
8.2.5.5.5.Latin America
8.2.5.5.5.1.Market Estimation, 2016 – 2023
8.2.5.5.5.2.Market Forecast, 2024 – 2034
8.2.6.Others
8.2.6.1.Definition
8.2.6.2.Market Estimation and Penetration, 2016 – 2023
8.2.6.3.Market Forecast, 2024 – 2034
8.2.6.4.Compound Annual Growth Rate (CAGR)
8.2.6.5.Regional Bifurcation
8.2.6.5.1.North America
8.2.6.5.1.1.Market Estimation, 2016 – 2023
8.2.6.5.1.2.Market Forecast, 2024 – 2034
8.2.6.5.2.Europe
8.2.6.5.2.1.Market Estimation, 2016 – 2023
8.2.6.5.2.2.Market Forecast, 2024 – 2034
8.2.6.5.3.Asia Pacific
8.2.6.5.3.1.Market Estimation, 2016 – 2023
8.2.6.5.3.2.Market Forecast, 2024 – 2034
8.2.6.5.4.Middle East and Africa
8.2.6.5.4.1.Market Estimation, 2016 – 2023
8.2.6.5.4.2.Market Forecast, 2024 – 2034
8.2.6.5.5.Latin America
8.2.6.5.5.1.Market Estimation, 2016 – 2023
8.2.6.5.5.2.Market Forecast, 2024 – 2034
8.3.Key Segment for Channeling Investments
8.3.1.By Product Type
9.Global Mobile Medical Imaging Market Analysis and Forecasts, 2024 – 2034
9.1.Overview
9.2.Global Mobile Medical Imaging Market Revenue (US$ Mn) and Forecasts, By Imaging Technology
9.2.1.2D Imaging
9.2.1.1.Definition
9.2.1.2.Market Estimation and Penetration, 2016 – 2023
9.2.1.3.Market Forecast, 2024 – 2034
9.2.1.4.Compound Annual Growth Rate (CAGR)
9.2.1.5.Regional Bifurcation
9.2.1.5.1.North America
9.2.1.5.1.1.Market Estimation, 2016 – 2023
9.2.1.5.1.2.Market Forecast, 2024 – 2034
9.2.1.5.2.Europe
9.2.1.5.2.1.Market Estimation, 2016 – 2023
9.2.1.5.2.2.Market Forecast, 2024 – 2034
9.2.1.5.3.Asia Pacific
9.2.1.5.3.1.Market Estimation, 2016 – 2023
9.2.1.5.3.2.Market Forecast, 2024 – 2034
9.2.1.5.4.Middle East and Africa
9.2.1.5.4.1.Market Estimation, 2016 – 2023
9.2.1.5.4.2.Market Forecast, 2024 – 2034
9.2.1.5.5.Latin America
9.2.1.5.5.1.Market Estimation, 2016 – 2023
9.2.1.5.5.2.Market Forecast, 2024 – 2034
9.2.2.3D Imaging
9.2.2.1.Definition
9.2.2.2.Market Estimation and Penetration, 2016 – 2023
9.2.2.3.Market Forecast, 2024 – 2034
9.2.2.4.Compound Annual Growth Rate (CAGR)
9.2.2.5.Regional Bifurcation
9.2.2.5.1.North America
9.2.2.5.1.1.Market Estimation, 2016 – 2023
9.2.2.5.1.2.Market Forecast, 2024 – 2034
9.2.2.5.2.Europe
9.2.2.5.2.1.Market Estimation, 2016 – 2023
9.2.2.5.2.2.Market Forecast, 2024 – 2034
9.2.2.5.3.Asia Pacific
9.2.2.5.3.1.Market Estimation, 2016 – 2023
9.2.2.5.3.2.Market Forecast, 2024 – 2034
9.2.2.5.4.Middle East and Africa
9.2.2.5.4.1.Market Estimation, 2016 – 2023
9.2.2.5.4.2.Market Forecast, 2024 – 2034
9.2.2.5.5.Latin America
9.2.2.5.5.1.Market Estimation, 2016 – 2023
9.2.2.5.5.2.Market Forecast, 2024 – 2034
9.3.Key Segment for Channeling Investments
9.3.1.By Imaging Technology
10.Global Mobile Medical Imaging Market Analysis and Forecasts, 2024 – 2034
10.1.Overview
10.2.Global Mobile Medical Imaging Market Revenue (US$ Mn) and Forecasts, By Application
10.2.1.Cardiology
10.2.1.1.Definition
10.2.1.2.Market Estimation and Penetration, 2016 – 2023
10.2.1.3.Market Forecast, 2024 – 2034
10.2.1.4.Compound Annual Growth Rate (CAGR)
10.2.1.5.Regional Bifurcation
10.2.1.5.1.North America
10.2.1.5.1.1.Market Estimation, 2016 – 2023
10.2.1.5.1.2.Market Forecast, 2024 – 2034
10.2.1.5.2.Europe
10.2.1.5.2.1.Market Estimation, 2016 – 2023
10.2.1.5.2.2.Market Forecast, 2024 – 2034
10.2.1.5.3.Asia Pacific
10.2.1.5.3.1.Market Estimation, 2016 – 2023
10.2.1.5.3.2.Market Forecast, 2024 – 2034
10.2.1.5.4.Middle East and Africa
10.2.1.5.4.1.Market Estimation, 2016 – 2023
10.2.1.5.4.2.Market Forecast, 2024 – 2034
10.2.1.5.5.Latin America
10.2.1.5.5.1.Market Estimation, 2016 – 2023
10.2.1.5.5.2.Market Forecast, 2024 – 2034
10.2.2.Neurology
10.2.2.1.Definition
10.2.2.2.Market Estimation and Penetration, 2016 – 2023
10.2.2.3.Market Forecast, 2024 – 2034
10.2.2.4.Compound Annual Growth Rate (CAGR)
10.2.2.5.Regional Bifurcation
10.2.2.5.1.North America
10.2.2.5.1.1.Market Estimation, 2016 – 2023
10.2.2.5.1.2.Market Forecast, 2024 – 2034
10.2.2.5.2.Europe
10.2.2.5.2.1.Market Estimation, 2016 – 2023
10.2.2.5.2.2.Market Forecast, 2024 – 2034
10.2.2.5.3.Asia Pacific
10.2.2.5.3.1.Market Estimation, 2016 – 2023
10.2.2.5.3.2.Market Forecast, 2024 – 2034
10.2.2.5.4.Middle East and Africa
10.2.2.5.4.1.Market Estimation, 2016 – 2023
10.2.2.5.4.2.Market Forecast, 2024 – 2034
10.2.2.5.5.Latin America
10.2.2.5.5.1.Market Estimation, 2016 – 2023
10.2.2.5.5.2.Market Forecast, 2024 – 2034
10.2.3.Orthopedics
10.2.3.1.Definition
10.2.3.2.Market Estimation and Penetration, 2016 – 2023
10.2.3.3.Market Forecast, 2024 – 2034
10.2.3.4.Compound Annual Growth Rate (CAGR)
10.2.3.5.Regional Bifurcation
10.2.3.5.1.North America
10.2.3.5.1.1.Market Estimation, 2016 – 2023
10.2.3.5.1.2.Market Forecast, 2024 – 2034
10.2.3.5.2.Europe
10.2.3.5.2.1.Market Estimation, 2016 – 2023
10.2.3.5.2.2.Market Forecast, 2024 – 2034
10.2.3.5.3.Asia Pacific
10.2.3.5.3.1.Market Estimation, 2016 – 2023
10.2.3.5.3.2.Market Forecast, 2024 – 2034
10.2.3.5.4.Middle East and Africa
10.2.3.5.4.1.Market Estimation, 2016 – 2023
10.2.3.5.4.2.Market Forecast, 2024 – 2034
10.2.3.5.5.Latin America
10.2.3.5.5.1.Market Estimation, 2016 – 2023
10.2.3.5.5.2.Market Forecast, 2024 – 2034
10.2.4.Oncology
10.2.4.1.Definition
10.2.4.2.Market Estimation and Penetration, 2016 – 2023
10.2.4.3.Market Forecast, 2024 – 2034
10.2.4.4.Compound Annual Growth Rate (CAGR)
10.2.4.5.Regional Bifurcation
10.2.4.5.1.North America
10.2.4.5.1.1.Market Estimation, 2016 – 2023
10.2.4.5.1.2.Market Forecast, 2024 – 2034
10.2.4.5.2.Europe
10.2.4.5.2.1.Market Estimation, 2016 – 2023
10.2.4.5.2.2.Market Forecast, 2024 – 2034
10.2.4.5.3.Asia Pacific
10.2.4.5.3.1.Market Estimation, 2016 – 2023
10.2.4.5.3.2.Market Forecast, 2024 – 2034
10.2.4.5.4.Middle East and Africa
10.2.4.5.4.1.Market Estimation, 2016 – 2023
10.2.4.5.4.2.Market Forecast, 2024 – 2034
10.2.4.5.5.Latin America
10.2.4.5.5.1.Market Estimation, 2016 – 2023
10.2.4.5.5.2.Market Forecast, 2024 – 2034
10.2.5.Obstetrics and Gynecology
10.2.5.1.Definition
10.2.5.2.Market Estimation and Penetration, 2016 – 2023
10.2.5.3.Market Forecast, 2024 – 2034
10.2.5.4.Compound Annual Growth Rate (CAGR)
10.2.5.5.Regional Bifurcation
10.2.5.5.1.North America
10.2.5.5.1.1.Market Estimation, 2016 – 2023
10.2.5.5.1.2.Market Forecast, 2024 – 2034
10.2.5.5.2.Europe
10.2.5.5.2.1.Market Estimation, 2016 – 2023
10.2.5.5.2.2.Market Forecast, 2024 – 2034
10.2.5.5.3.Asia Pacific
10.2.5.5.3.1.Market Estimation, 2016 – 2023
10.2.5.5.3.2.Market Forecast, 2024 – 2034
10.2.5.5.4.Middle East and Africa
10.2.5.5.4.1.Market Estimation, 2016 – 2023
10.2.5.5.4.2.Market Forecast, 2024 – 2034
10.2.5.5.5.Latin America
10.2.5.5.5.1.Market Estimation, 2016 – 2023
10.2.5.5.5.2.Market Forecast, 2024 – 2034
10.2.6.Urology
10.2.6.1.Definition
10.2.6.2.Market Estimation and Penetration, 2016 – 2023
10.2.6.3.Market Forecast, 2024 – 2034
10.2.6.4.Compound Annual Growth Rate (CAGR)
10.2.6.5.Regional Bifurcation
10.2.6.5.1.North America
10.2.6.5.1.1.Market Estimation, 2016 – 2023
10.2.6.5.1.2.Market Forecast, 2024 – 2034
10.2.6.5.2.Europe
10.2.6.5.2.1.Market Estimation, 2016 – 2023
10.2.6.5.2.2.Market Forecast, 2024 – 2034
10.2.6.5.3.Asia Pacific
10.2.6.5.3.1.Market Estimation, 2016 – 2023
10.2.6.5.3.2.Market Forecast, 2024 – 2034
10.2.6.5.4.Middle East and Africa
10.2.6.5.4.1.Market Estimation, 2016 – 2023
10.2.6.5.4.2.Market Forecast, 2024 – 2034
10.2.6.5.5.Latin America
10.2.6.5.5.1.Market Estimation, 2016 – 2023
10.2.6.5.5.2.Market Forecast, 2024 – 2034
10.2.7.Respiratory Care
10.2.7.1.Definition
10.2.7.2.Market Estimation and Penetration, 2016 – 2023
10.2.7.3.Market Forecast, 2024 – 2034
10.2.7.4.Compound Annual Growth Rate (CAGR)
10.2.7.5.Regional Bifurcation
10.2.7.5.1.North America
10.2.7.5.1.1.Market Estimation, 2016 – 2023
10.2.7.5.1.2.Market Forecast, 2024 – 2034
10.2.7.5.2.Europe
10.2.7.5.2.1.Market Estimation, 2016 – 2023
10.2.7.5.2.2.Market Forecast, 2024 – 2034
10.2.7.5.3.Asia Pacific
10.2.7.5.3.1.Market Estimation, 2016 – 2023
10.2.7.5.3.2.Market Forecast, 2024 – 2034
10.2.7.5.4.Middle East and Africa
10.2.7.5.4.1.Market Estimation, 2016 – 2023
10.2.7.5.4.2.Market Forecast, 2024 – 2034
10.2.7.5.5.Latin America
10.2.7.5.5.1.Market Estimation, 2016 – 2023
10.2.7.5.5.2.Market Forecast, 2024 – 2034
10.2.8.Trauma and Emergency
10.2.8.1.Definition
10.2.8.2.Market Estimation and Penetration, 2016 – 2023
10.2.8.3.Market Forecast, 2024 – 2034
10.2.8.4.Compound Annual Growth Rate (CAGR)
10.2.8.5.Regional Bifurcation
10.2.8.5.1.North America
10.2.8.5.1.1.Market Estimation, 2016 – 2023
10.2.8.5.1.2.Market Forecast, 2024 – 2034
10.2.8.5.2.Europe
10.2.8.5.2.1.Market Estimation, 2016 – 2023
10.2.8.5.2.2.Market Forecast, 2024 – 2034
10.2.8.5.3.Asia Pacific
10.2.8.5.3.1.Market Estimation, 2016 – 2023
10.2.8.5.3.2.Market Forecast, 2024 – 2034
10.2.8.5.4.Middle East and Africa
10.2.8.5.4.1.Market Estimation, 2016 – 2023
10.2.8.5.4.2.Market Forecast, 2024 – 2034
10.2.8.5.5.Latin America
10.2.8.5.5.1.Market Estimation, 2016 – 2023
10.2.8.5.5.2.Market Forecast, 2024 – 2034
10.2.9.Vascular Imaging
10.2.9.1.Definition
10.2.9.2.Market Estimation and Penetration, 2016 – 2023
10.2.9.3.Market Forecast, 2024 – 2034
10.2.9.4.Compound Annual Growth Rate (CAGR)
10.2.9.5.Regional Bifurcation
10.2.9.5.1.North America
10.2.9.5.1.1.Market Estimation, 2016 – 2023
10.2.9.5.1.2.Market Forecast, 2024 – 2034
10.2.9.5.2.Europe
10.2.9.5.2.1.Market Estimation, 2016 – 2023
10.2.9.5.2.2.Market Forecast, 2024 – 2034
10.2.9.5.3.Asia Pacific
10.2.9.5.3.1.Market Estimation, 2016 – 2023
10.2.9.5.3.2.Market Forecast, 2024 – 2034
10.2.9.5.4.Middle East and Africa
10.2.9.5.4.1.Market Estimation, 2016 – 2023
10.2.9.5.4.2.Market Forecast, 2024 – 2034
10.2.9.5.5.Latin America
10.2.9.5.5.1.Market Estimation, 2016 – 2023
10.2.9.5.5.2.Market Forecast, 2024 – 2034
10.2.10.Others
10.2.10.1.Definition
10.2.10.2.Market Estimation and Penetration, 2016 – 2023
10.2.10.3.Market Forecast, 2024 – 2034
10.2.10.4.Compound Annual Growth Rate (CAGR)
10.2.10.5.Regional Bifurcation
10.2.10.5.1.North America
10.2.10.5.1.1.Market Estimation, 2016 – 2023
10.2.10.5.1.2.Market Forecast, 2024 – 2034
10.2.10.5.2.Europe
10.2.10.5.2.1.Market Estimation, 2016 – 2023
10.2.10.5.2.2.Market Forecast, 2024 – 2034
10.2.10.5.3.Asia Pacific
10.2.10.5.3.1.Market Estimation, 2016 – 2023
10.2.10.5.3.2.Market Forecast, 2024 – 2034
10.2.10.5.4.Middle East and Africa
10.2.10.5.4.1.Market Estimation, 2016 – 2023
10.2.10.5.4.2.Market Forecast, 2024 – 2034
10.2.10.5.5.Latin America
10.2.10.5.5.1.Market Estimation, 2016 – 2023
10.2.10.5.5.2.Market Forecast, 2024 – 2034
10.3.Key Segment for Channeling Investments
10.3.1.By Application
11.Global Mobile Medical Imaging Market Analysis and Forecasts, 2024 – 2034
11.1.Overview
11.2.Global Mobile Medical Imaging Market Revenue (US$ Mn) and Forecasts, By End User
11.2.1.Hospitals and Clinics
11.2.1.1.Definition
11.2.1.2.Market Estimation and Penetration, 2016 – 2023
11.2.1.3.Market Forecast, 2024 – 2034
11.2.1.4.Compound Annual Growth Rate (CAGR)
11.2.1.5.Regional Bifurcation
11.2.1.5.1.North America
11.2.1.5.1.1.Market Estimation, 2016 – 2023
11.2.1.5.1.2.Market Forecast, 2024 – 2034
11.2.1.5.2.Europe
11.2.1.5.2.1.Market Estimation, 2016 – 2023
11.2.1.5.2.2.Market Forecast, 2024 – 2034
11.2.1.5.3.Asia Pacific
11.2.1.5.3.1.Market Estimation, 2016 – 2023
11.2.1.5.3.2.Market Forecast, 2024 – 2034
11.2.1.5.4.Middle East and Africa
11.2.1.5.4.1.Market Estimation, 2016 – 2023
11.2.1.5.4.2.Market Forecast, 2024 – 2034
11.2.1.5.5.Latin America
11.2.1.5.5.1.Market Estimation, 2016 – 2023
11.2.1.5.5.2.Market Forecast, 2024 – 2034
11.2.2.Diagnostic Imaging Centers
11.2.2.1.Definition
11.2.2.2.Market Estimation and Penetration, 2016 – 2023
11.2.2.3.Market Forecast, 2024 – 2034
11.2.2.4.Compound Annual Growth Rate (CAGR)
11.2.2.5.Regional Bifurcation
11.2.2.5.1.North America
11.2.2.5.1.1.Market Estimation, 2016 – 2023
11.2.2.5.1.2.Market Forecast, 2024 – 2034
11.2.2.5.2.Europe
11.2.2.5.2.1.Market Estimation, 2016 – 2023
11.2.2.5.2.2.Market Forecast, 2024 – 2034
11.2.2.5.3.Asia Pacific
11.2.2.5.3.1.Market Estimation, 2016 – 2023
11.2.2.5.3.2.Market Forecast, 2024 – 2034
11.2.2.5.4.Middle East and Africa
11.2.2.5.4.1.Market Estimation, 2016 – 2023
11.2.2.5.4.2.Market Forecast, 2024 – 2034
11.2.2.5.5.Latin America
11.2.2.5.5.1.Market Estimation, 2016 – 2023
11.2.2.5.5.2.Market Forecast, 2024 – 2034
11.2.3.Ambulatory Surgical Centers (ASCs)
11.2.3.1.Definition
11.2.3.2.Market Estimation and Penetration, 2016 – 2023
11.2.3.3.Market Forecast, 2024 – 2034
11.2.3.4.Compound Annual Growth Rate (CAGR)
11.2.3.5.Regional Bifurcation
11.2.3.5.1.North America
11.2.3.5.1.1.Market Estimation, 2016 – 2023
11.2.3.5.1.2.Market Forecast, 2024 – 2034
11.2.3.5.2.Europe
11.2.3.5.2.1.Market Estimation, 2016 – 2023
11.2.3.5.2.2.Market Forecast, 2024 – 2034
11.2.3.5.3.Asia Pacific
11.2.3.5.3.1.Market Estimation, 2016 – 2023
11.2.3.5.3.2.Market Forecast, 2024 – 2034
11.2.3.5.4.Middle East and Africa
11.2.3.5.4.1.Market Estimation, 2016 – 2023
11.2.3.5.4.2.Market Forecast, 2024 – 2034
11.2.3.5.5.Latin America
11.2.3.5.5.1.Market Estimation, 2016 – 2023
11.2.3.5.5.2.Market Forecast, 2024 – 2034
11.2.4.Others
11.2.4.1.Definition
11.2.4.2.Market Estimation and Penetration, 2016 – 2023
11.2.4.3.Market Forecast, 2024 – 2034
11.2.4.4.Compound Annual Growth Rate (CAGR)
11.2.4.5.Regional Bifurcation
11.2.4.5.1.North America
11.2.4.5.1.1.Market Estimation, 2016 – 2023
11.2.4.5.1.2.Market Forecast, 2024 – 2034
11.2.4.5.2.Europe
11.2.4.5.2.1.Market Estimation, 2016 – 2023
11.2.4.5.2.2.Market Forecast, 2024 – 2034
11.2.4.5.3.Asia Pacific
11.2.4.5.3.1.Market Estimation, 2016 – 2023
11.2.4.5.3.2.Market Forecast, 2024 – 2034
11.2.4.5.4.Middle East and Africa
11.2.4.5.4.1.Market Estimation, 2016 – 2023
11.2.4.5.4.2.Market Forecast, 2024 – 2034
11.2.4.5.5.Latin America
11.2.4.5.5.1.Market Estimation, 2016 – 2023
11.2.4.5.5.2.Market Forecast, 2024 – 2034
11.3.Key Segment for Channeling Investments
11.3.1.By End User
12.North America Mobile Medical Imaging Market Analysis and Forecasts, 2024 – 2034
12.1.Overview
12.1.1.North America Mobile Medical Imaging Market Revenue (US$ Mn)
12.2.North America Mobile Medical Imaging Market Revenue (US$ Mn) and Forecasts, By Product Type
12.2.1.X-ray
12.2.2.Ultrasound
12.2.3.CT (Computed Tomography) Scanners
12.2.4.MRI (Magnetic Resonance Imaging)
12.2.5.Nuclear Imaging
12.2.6.Others
12.3.North America Mobile Medical Imaging Market Revenue (US$ Mn) and Forecasts, By Imaging Technology
12.3.1.2D Imaging
12.3.2.3D Imaging
12.4.North America Mobile Medical Imaging Market Revenue (US$ Mn) and Forecasts, By Application
12.4.1.Cardiology
12.4.2.Neurology
12.4.3.Orthopedics
12.4.4.Oncology
12.4.5.Obstetrics and Gynecology
12.4.6.Urology
12.4.7.Respiratory Care
12.4.8.Trauma and Emergency
12.4.9.Vascular Imaging
12.4.10.Others
12.5.North America Mobile Medical Imaging Market Revenue (US$ Mn) and Forecasts, By End User
12.5.1.Hospitals and Clinics
12.5.2.Diagnostic Imaging Centers
12.5.3.Ambulatory Surgical Centers (ASCs)
12.5.4.Others
12.6.North America Mobile Medical Imaging Market Revenue (US$ Mn) and Forecasts, By Country
12.6.1.U.S
12.6.1.1.U.S Mobile Medical Imaging Market Revenue (US$ Mn) and Forecasts, By Product Type
12.6.1.1.1.X-ray
12.6.1.1.2.Ultrasound
12.6.1.1.3.CT (Computed Tomography) Scanners
12.6.1.1.4.MRI (Magnetic Resonance Imaging)
12.6.1.1.5.Nuclear Imaging
12.6.1.1.6.Others
12.6.1.2.U.S Mobile Medical Imaging Market Revenue (US$ Mn) and Forecasts, By Imaging Technology
12.6.1.2.1.2D Imaging
12.6.1.2.2.3D Imaging
12.6.1.3.U.S Mobile Medical Imaging Market Revenue (US$ Mn) and Forecasts, By Application
12.6.1.3.1.Cardiology
12.6.1.3.2.Neurology
12.6.1.3.3.Orthopedics
12.6.1.3.4.Oncology
12.6.1.3.5.Obstetrics and Gynecology
12.6.1.3.6.Urology
12.6.1.3.7.Respiratory Care
12.6.1.3.8.Trauma and Emergency
12.6.1.3.9.Vascular Imaging
12.6.1.3.10.Others
12.6.1.4.U.S Mobile Medical Imaging Market Revenue (US$ Mn) and Forecasts, By End User
12.6.1.4.1.Hospitals and Clinics
12.6.1.4.2.Diagnostic Imaging Centers
12.6.1.4.3.Ambulatory Surgical Centers (ASCs)
12.6.1.4.4.Others
12.6.2.Canada
12.6.2.1.Canada Mobile Medical Imaging Market Revenue (US$ Mn) and Forecasts, By Product Type
12.6.2.1.1.X-ray
12.6.2.1.2.Ultrasound
12.6.2.1.3.CT (Computed Tomography) Scanners
12.6.2.1.4.MRI (Magnetic Resonance Imaging)
12.6.2.1.5.Nuclear Imaging
12.6.2.1.6.Others
12.6.2.2.Canada Mobile Medical Imaging Market Revenue (US$ Mn) and Forecasts, By Imaging Technology
12.6.2.2.1.2D Imaging
12.6.2.2.2.3D Imaging
12.6.2.3.Canada Mobile Medical Imaging Market Revenue (US$ Mn) and Forecasts, By Application
12.6.2.3.1.Cardiology
12.6.2.3.2.Neurology
12.6.2.3.3.Orthopedics
12.6.2.3.4.Oncology
12.6.2.3.5.Obstetrics and Gynecology
12.6.2.3.6.Urology
12.6.2.3.7.Respiratory Care
12.6.2.3.8.Trauma and Emergency
12.6.2.3.9.Vascular Imaging
12.6.2.3.10.Others
12.6.2.4.Canada Mobile Medical Imaging Market Revenue (US$ Mn) and Forecasts, By End User
12.6.2.4.1.Hospitals and Clinics
12.6.2.4.2.Diagnostic Imaging Centers
12.6.2.4.3.Ambulatory Surgical Centers (ASCs)
12.6.2.4.4.Others
12.6.3.Mexico
12.6.3.1.Mexico Mobile Medical Imaging Market Revenue (US$ Mn) and Forecasts, By Product Type
12.6.3.1.1.X-ray
12.6.3.1.2.Ultrasound
12.6.3.1.3.CT (Computed Tomography) Scanners
12.6.3.1.4.MRI (Magnetic Resonance Imaging)
12.6.3.1.5.Nuclear Imaging
12.6.3.1.6.Others
12.6.3.2.Mexico Mobile Medical Imaging Market Revenue (US$ Mn) and Forecasts, By Imaging Technology
12.6.3.2.1.2D Imaging
12.6.3.2.2.3D Imaging
12.6.3.3.Mexico Mobile Medical Imaging Market Revenue (US$ Mn) and Forecasts, By Application
12.6.3.3.1.Cardiology
12.6.3.3.2.Neurology
12.6.3.3.3.Orthopedics
12.6.3.3.4.Oncology
12.6.3.3.5.Obstetrics and Gynecology
12.6.3.3.6.Urology
12.6.3.3.7.Respiratory Care
12.6.3.3.8.Trauma and Emergency
12.6.3.3.9.Vascular Imaging
12.6.3.3.10.Others
12.6.3.4.Mexico Mobile Medical Imaging Market Revenue (US$ Mn) and Forecasts, By End User
12.6.3.4.1.Hospitals and Clinics
12.6.3.4.2.Diagnostic Imaging Centers
12.6.3.4.3.Ambulatory Surgical Centers (ASCs)
12.6.3.4.4.Others
12.6.4.Rest of North America
12.6.4.1.Rest of North America Mobile Medical Imaging Market Revenue (US$ Mn) and Forecasts, By Product Type
12.6.4.1.1.X-ray
12.6.4.1.2.Ultrasound
12.6.4.1.3.CT (Computed Tomography) Scanners
12.6.4.1.4.MRI (Magnetic Resonance Imaging)
12.6.4.1.5.Nuclear Imaging
12.6.4.1.6.Others
12.6.4.2.Rest of North America Mobile Medical Imaging Market Revenue (US$ Mn) and Forecasts, By Imaging Technology
12.6.4.2.1.2D Imaging
12.6.4.2.2.3D Imaging
12.6.4.3.Rest of North America Mobile Medical Imaging Market Revenue (US$ Mn) and Forecasts, By Application
12.6.4.3.1.Cardiology
12.6.4.3.2.Neurology
12.6.4.3.3.Orthopedics
12.6.4.3.4.Oncology
12.6.4.3.5.Obstetrics and Gynecology
12.6.4.3.6.Urology
12.6.4.3.7.Respiratory Care
12.6.4.3.8.Trauma and Emergency
12.6.4.3.9.Vascular Imaging
12.6.4.3.10.Others
12.6.4.4.Rest of North America Mobile Medical Imaging Market Revenue (US$ Mn) and Forecasts, By End User
12.6.4.4.1.Hospitals and Clinics
12.6.4.4.2.Diagnostic Imaging Centers
12.6.4.4.3.Ambulatory Surgical Centers (ASCs)
12.6.4.4.4.Others
12.7.Key Segment for Channeling Investments
12.7.1.By Country
12.7.2.By Product Type
12.7.3.By Imaging Technology
12.7.4.By Application
12.7.5.By End User
13.Europe Mobile Medical Imaging Market Analysis and Forecasts, 2024 – 2034
13.1.Overview
13.1.1.Europe Mobile Medical Imaging Market Revenue (US$ Mn)
13.2.Europe Mobile Medical Imaging Market Revenue (US$ Mn) and Forecasts, By Product Type
13.2.1.X-ray
13.2.2.Ultrasound
13.2.3.CT (Computed Tomography) Scanners
13.2.4.MRI (Magnetic Resonance Imaging)
13.2.5.Nuclear Imaging
13.2.6.Others
13.3.Europe Mobile Medical Imaging Market Revenue (US$ Mn) and Forecasts, By Imaging Technology
13.3.1.2D Imaging
13.3.2.3D Imaging
13.4.Europe Mobile Medical Imaging Market Revenue (US$ Mn) and Forecasts, By Application
13.4.1.Cardiology
13.4.2.Neurology
13.4.3.Orthopedics
13.4.4.Oncology
13.4.5.Obstetrics and Gynecology
13.4.6.Urology
13.4.7.Respiratory Care
13.4.8.Trauma and Emergency
13.4.9.Vascular Imaging
13.4.10.Others
13.5.Europe Mobile Medical Imaging Market Revenue (US$ Mn) and Forecasts, By End User
13.5.1.Hospitals and Clinics
13.5.2.Diagnostic Imaging Centers
13.5.3.Ambulatory Surgical Centers (ASCs)
13.5.4.Others
13.6.Europe Mobile Medical Imaging Market Revenue (US$ Mn) and Forecasts, By Country
13.6.1.France
13.6.1.1.France Mobile Medical Imaging Market Revenue (US$ Mn) and Forecasts, By Product Type
13.6.1.1.1.X-ray
13.6.1.1.2.Ultrasound
13.6.1.1.3.CT (Computed Tomography) Scanners
13.6.1.1.4.MRI (Magnetic Resonance Imaging)
13.6.1.1.5.Nuclear Imaging
13.6.1.1.6.Others
13.6.1.2.France Mobile Medical Imaging Market Revenue (US$ Mn) and Forecasts, By Imaging Technology
13.6.1.2.1.2D Imaging
13.6.1.2.2.3D Imaging
13.6.1.3.France Mobile Medical Imaging Market Revenue (US$ Mn) and Forecasts, By Application
13.6.1.3.1.Cardiology
13.6.1.3.2.Neurology
13.6.1.3.3.Orthopedics
13.6.1.3.4.Oncology
13.6.1.3.5.Obstetrics and Gynecology
13.6.1.3.6.Urology
13.6.1.3.7.Respiratory Care
13.6.1.3.8.Trauma and Emergency
13.6.1.3.9.Vascular Imaging
13.6.1.3.10.Others
13.6.1.4.France Mobile Medical Imaging Market Revenue (US$ Mn) and Forecasts, By End User
13.6.1.4.1.Hospitals and Clinics
13.6.1.4.2.Diagnostic Imaging Centers
13.6.1.4.3.Ambulatory Surgical Centers (ASCs)
13.6.1.4.4.Others
13.6.2.The UK
13.6.2.1.The UK Mobile Medical Imaging Market Revenue (US$ Mn) and Forecasts, By Product Type
13.6.2.1.1.X-ray
13.6.2.1.2.Ultrasound
13.6.2.1.3.CT (Computed Tomography) Scanners
13.6.2.1.4.MRI (Magnetic Resonance Imaging)
13.6.2.1.5.Nuclear Imaging
13.6.2.1.6.Others
13.6.2.2.The UK Mobile Medical Imaging Market Revenue (US$ Mn) and Forecasts, By Imaging Technology
13.6.2.2.1.2D Imaging
13.6.2.2.2.3D Imaging
13.6.2.3.The UK Mobile Medical Imaging Market Revenue (US$ Mn) and Forecasts, By Application
13.6.2.3.1.Cardiology
13.6.2.3.2.Neurology
13.6.2.3.3.Orthopedics
13.6.2.3.4.Oncology
13.6.2.3.5.Obstetrics and Gynecology
13.6.2.3.6.Urology
13.6.2.3.7.Respiratory Care
13.6.2.3.8.Trauma and Emergency
13.6.2.3.9.Vascular Imaging
13.6.2.3.10.Others
13.6.2.4.The UK Mobile Medical Imaging Market Revenue (US$ Mn) and Forecasts, By End User
13.6.2.4.1.Hospitals and Clinics
13.6.2.4.2.Diagnostic Imaging Centers
13.6.2.4.3.Ambulatory Surgical Centers (ASCs)
13.6.2.4.4.Others
13.6.3.Spain
13.6.3.1.Spain Mobile Medical Imaging Market Revenue (US$ Mn) and Forecasts, By Product Type
13.6.3.1.1.X-ray
13.6.3.1.2.Ultrasound
13.6.3.1.3.CT (Computed Tomography) Scanners
13.6.3.1.4.MRI (Magnetic Resonance Imaging)
13.6.3.1.5.Nuclear Imaging
13.6.3.1.6.Others
13.6.3.2.Spain Mobile Medical Imaging Market Revenue (US$ Mn) and Forecasts, By Imaging Technology
13.6.3.2.1.2D Imaging
13.6.3.2.2.3D Imaging
13.6.3.3.Spain Mobile Medical Imaging Market Revenue (US$ Mn) and Forecasts, By Application
13.6.3.3.1.Cardiology
13.6.3.3.2.Neurology
13.6.3.3.3.Orthopedics
13.6.3.3.4.Oncology
13.6.3.3.5.Obstetrics and Gynecology
13.6.3.3.6.Urology
13.6.3.3.7.Respiratory Care
13.6.3.3.8.Trauma and Emergency
13.6.3.3.9.Vascular Imaging
13.6.3.3.10.Others
13.6.3.4.Spain Mobile Medical Imaging Market Revenue (US$ Mn) and Forecasts, By End User
13.6.3.4.1.Hospitals and Clinics
13.6.3.4.2.Diagnostic Imaging Centers
13.6.3.4.3.Ambulatory Surgical Centers (ASCs)
13.6.3.4.4.Others
13.6.4.Germany
13.6.4.1.Germany Mobile Medical Imaging Market Revenue (US$ Mn) and Forecasts, By Product Type
13.6.4.1.1.X-ray
13.6.4.1.2.Ultrasound
13.6.4.1.3.CT (Computed Tomography) Scanners
13.6.4.1.4.MRI (Magnetic Resonance Imaging)
13.6.4.1.5.Nuclear Imaging
13.6.4.1.6.Others
13.6.4.2.Germany Mobile Medical Imaging Market Revenue (US$ Mn) and Forecasts, By Imaging Technology
13.6.4.2.1.2D Imaging
13.6.4.2.2.3D Imaging
13.6.4.3.Germany Mobile Medical Imaging Market Revenue (US$ Mn) and Forecasts, By Application
13.6.4.3.1.Cardiology
13.6.4.3.2.Neurology
13.6.4.3.3.Orthopedics
13.6.4.3.4.Oncology
13.6.4.3.5.Obstetrics and Gynecology
13.6.4.3.6.Urology
13.6.4.3.7.Respiratory Care
13.6.4.3.8.Trauma and Emergency
13.6.4.3.9.Vascular Imaging
13.6.4.3.10.Others
13.6.4.4.Germany Mobile Medical Imaging Market Revenue (US$ Mn) and Forecasts, By End User
13.6.4.4.1.Hospitals and Clinics
13.6.4.4.2.Diagnostic Imaging Centers
13.6.4.4.3.Ambulatory Surgical Centers (ASCs)
13.6.4.4.4.Others
13.6.5.Italy
13.6.5.1.Italy Mobile Medical Imaging Market Revenue (US$ Mn) and Forecasts, By Product Type
13.6.5.1.1.X-ray
13.6.5.1.2.Ultrasound
13.6.5.1.3.CT (Computed Tomography) Scanners
13.6.5.1.4.MRI (Magnetic Resonance Imaging)
13.6.5.1.5.Nuclear Imaging
13.6.5.1.6.Others
13.6.5.2.Italy Mobile Medical Imaging Market Revenue (US$ Mn) and Forecasts, By Imaging Technology
13.6.5.2.1.2D Imaging
13.6.5.2.2.3D Imaging
13.6.5.3.Italy Mobile Medical Imaging Market Revenue (US$ Mn) and Forecasts, By Application
13.6.5.3.1.Cardiology
13.6.5.3.2.Neurology
13.6.5.3.3.Orthopedics
13.6.5.3.4.Oncology
13.6.5.3.5.Obstetrics and Gynecology
13.6.5.3.6.Urology
13.6.5.3.7.Respiratory Care
13.6.5.3.8.Trauma and Emergency
13.6.5.3.9.Vascular Imaging
13.6.5.3.10.Others
13.6.5.4.Italy Mobile Medical Imaging Market Revenue (US$ Mn) and Forecasts, By End User
13.6.5.4.1.Hospitals and Clinics
13.6.5.4.2.Diagnostic Imaging Centers
13.6.5.4.3.Ambulatory Surgical Centers (ASCs)
13.6.5.4.4.Others
13.6.6.Nordic Countries
13.6.6.1.Nordic Countries Mobile Medical Imaging Market Revenue (US$ Mn) and Forecasts, By Product Type
13.6.6.1.1.X-ray
13.6.6.1.2.Ultrasound
13.6.6.1.3.CT (Computed Tomography) Scanners
13.6.6.1.4.MRI (Magnetic Resonance Imaging)
13.6.6.1.5.Nuclear Imaging
13.6.6.1.6.Others
13.6.6.2.Nordic Countries Mobile Medical Imaging Market Revenue (US$ Mn) and Forecasts, By Imaging Technology
13.6.6.2.1.2D Imaging
13.6.6.2.2.3D Imaging
13.6.6.3.Nordic Countries Mobile Medical Imaging Market Revenue (US$ Mn) and Forecasts, By Application
13.6.6.3.1.Cardiology
13.6.6.3.2.Neurology
13.6.6.3.3.Orthopedics
13.6.6.3.4.Oncology
13.6.6.3.5.Obstetrics and Gynecology
13.6.6.3.6.Urology
13.6.6.3.7.Respiratory Care
13.6.6.3.8.Trauma and Emergency
13.6.6.3.9.Vascular Imaging
13.6.6.3.10.Others
13.6.6.4.Nordic Countries Mobile Medical Imaging Market Revenue (US$ Mn) and Forecasts, By End User
13.6.6.4.1.Hospitals and Clinics
13.6.6.4.2.Diagnostic Imaging Centers
13.6.6.4.3.Ambulatory Surgical Centers (ASCs)
13.6.6.4.4.Others
13.6.6.5.Nordic Countries Mobile Medical Imaging Market Revenue (US$ Mn) and Forecasts, By Country
13.6.6.5.1.Denmark
13.6.6.5.2.Finland
13.6.6.5.3.Iceland
13.6.6.5.4.Sweden
13.6.6.5.5.Norway
13.6.7.Benelux Union
13.6.7.1.Benelux Union Mobile Medical Imaging Market Revenue (US$ Mn) and Forecasts, By Product Type
13.6.7.1.1.X-ray
13.6.7.1.2.Ultrasound
13.6.7.1.3.CT (Computed Tomography) Scanners
13.6.7.1.4.MRI (Magnetic Resonance Imaging)
13.6.7.1.5.Nuclear Imaging
13.6.7.1.6.Others
13.6.7.2.Benelux Union Mobile Medical Imaging Market Revenue (US$ Mn) and Forecasts, By Imaging Technology
13.6.7.2.1.2D Imaging
13.6.7.2.2.3D Imaging
13.6.7.3.Benelux Union Mobile Medical Imaging Market Revenue (US$ Mn) and Forecasts, By Application
13.6.7.3.1.Cardiology
13.6.7.3.2.Neurology
13.6.7.3.3.Orthopedics
13.6.7.3.4.Oncology
13.6.7.3.5.Obstetrics and Gynecology
13.6.7.3.6.Urology
13.6.7.3.7.Respiratory Care
13.6.7.3.8.Trauma and Emergency
13.6.7.3.9.Vascular Imaging
13.6.7.3.10.Others
13.6.7.4.Benelux Union Mobile Medical Imaging Market Revenue (US$ Mn) and Forecasts, By End User
13.6.7.4.1.Hospitals and Clinics
13.6.7.4.2.Diagnostic Imaging Centers
13.6.7.4.3.Ambulatory Surgical Centers (ASCs)
13.6.7.4.4.Others
13.6.7.5.Benelux Union Mobile Medical Imaging Market Revenue (US$ Mn) and Forecasts, By Country
13.6.7.5.1.Belgium
13.6.7.5.2.The Netherlands
13.6.7.5.3.Luxembourg
13.6.8.Rest of Europe
13.6.8.1.Rest of Europe Mobile Medical Imaging Market Revenue (US$ Mn) and Forecasts, By Product Type
13.6.8.1.1.X-ray
13.6.8.1.2.Ultrasound
13.6.8.1.3.CT (Computed Tomography) Scanners
13.6.8.1.4.MRI (Magnetic Resonance Imaging)
13.6.8.1.5.Nuclear Imaging
13.6.8.1.6.Others
13.6.8.2.Rest of Europe Mobile Medical Imaging Market Revenue (US$ Mn) and Forecasts, By Imaging Technology
13.6.8.2.1.2D Imaging
13.6.8.2.2.3D Imaging
13.6.8.3.Rest of Europe Mobile Medical Imaging Market Revenue (US$ Mn) and Forecasts, By Application
13.6.8.3.1.Cardiology
13.6.8.3.2.Neurology
13.6.8.3.3.Orthopedics
13.6.8.3.4.Oncology
13.6.8.3.5.Obstetrics and Gynecology
13.6.8.3.6.Urology
13.6.8.3.7.Respiratory Care
13.6.8.3.8.Trauma and Emergency
13.6.8.3.9.Vascular Imaging
13.6.8.3.10.Others
13.6.8.4.Rest of Europe Mobile Medical Imaging Market Revenue (US$ Mn) and Forecasts, By End User
13.6.8.4.1.Hospitals and Clinics
13.6.8.4.2.Diagnostic Imaging Centers
13.6.8.4.3.Ambulatory Surgical Centers (ASCs)
13.6.8.4.4.Others
13.7.Key Segment for Channeling Investments
13.7.1.By Country
13.7.2.By Product Type
13.7.3.By Imaging Technology
13.7.4.By Application
13.7.5.By End User
14.Asia Pacific Mobile Medical Imaging Market Analysis and Forecasts, 2024 – 2034
14.1.Overview
14.1.1.Asia Pacific Mobile Medical Imaging Market Revenue (US$ Mn)
14.2.Asia Pacific Mobile Medical Imaging Market Revenue (US$ Mn) and Forecasts, By Product Type
14.2.1.X-ray
14.2.2.Ultrasound
14.2.3.CT (Computed Tomography) Scanners
14.2.4.MRI (Magnetic Resonance Imaging)
14.2.5.Nuclear Imaging
14.2.6.Others
14.3.Asia Pacific Mobile Medical Imaging Market Revenue (US$ Mn) and Forecasts, By Imaging Technology
14.3.1.2D Imaging
14.3.2.3D Imaging
14.4.Asia Pacific Mobile Medical Imaging Market Revenue (US$ Mn) and Forecasts, By Application
14.4.1.Cardiology
14.4.2.Neurology
14.4.3.Orthopedics
14.4.4.Oncology
14.4.5.Obstetrics and Gynecology
14.4.6.Urology
14.4.7.Respiratory Care
14.4.8.Trauma and Emergency
14.4.9.Vascular Imaging
14.4.10.Others
14.5.Asia Pacific Mobile Medical Imaging Market Revenue (US$ Mn) and Forecasts, By End User
14.5.1.Hospitals and Clinics
14.5.2.Diagnostic Imaging Centers
14.5.3.Ambulatory Surgical Centers (ASCs)
14.5.4.Others
14.6.Asia Pacific Mobile Medical Imaging Market Revenue (US$ Mn) and Forecasts, By Country
14.6.1.China
14.6.1.1.China Mobile Medical Imaging Market Revenue (US$ Mn) and Forecasts, By Product Type
14.6.1.1.1.X-ray
14.6.1.1.2.Ultrasound
14.6.1.1.3.CT (Computed Tomography) Scanners
14.6.1.1.4.MRI (Magnetic Resonance Imaging)
14.6.1.1.5.Nuclear Imaging
14.6.1.1.6.Others
14.6.1.2.China Mobile Medical Imaging Market Revenue (US$ Mn) and Forecasts, By Imaging Technology
14.6.1.2.1.2D Imaging
14.6.1.2.2.3D Imaging
14.6.1.3.China Mobile Medical Imaging Market Revenue (US$ Mn) and Forecasts, By Application
14.6.1.3.1.Cardiology
14.6.1.3.2.Neurology
14.6.1.3.3.Orthopedics
14.6.1.3.4.Oncology
14.6.1.3.5.Obstetrics and Gynecology
14.6.1.3.6.Urology
14.6.1.3.7.Respiratory Care
14.6.1.3.8.Trauma and Emergency
14.6.1.3.9.Vascular Imaging
14.6.1.3.10.Others
14.6.1.4.China Mobile Medical Imaging Market Revenue (US$ Mn) and Forecasts, By End User
14.6.1.4.1.Hospitals and Clinics
14.6.1.4.2.Diagnostic Imaging Centers
14.6.1.4.3.Ambulatory Surgical Centers (ASCs)
14.6.1.4.4.Others
14.6.2.Japan
14.6.2.1.Japan Mobile Medical Imaging Market Revenue (US$ Mn) and Forecasts, By Product Type
14.6.2.1.1.X-ray
14.6.2.1.2.Ultrasound
14.6.2.1.3.CT (Computed Tomography) Scanners
14.6.2.1.4.MRI (Magnetic Resonance Imaging)
14.6.2.1.5.Nuclear Imaging
14.6.2.1.6.Others
14.6.2.2.Japan Mobile Medical Imaging Market Revenue (US$ Mn) and Forecasts, By Imaging Technology
14.6.2.2.1.2D Imaging
14.6.2.2.2.3D Imaging
14.6.2.3.Japan Mobile Medical Imaging Market Revenue (US$ Mn) and Forecasts, By Application
14.6.2.3.1.Cardiology
14.6.2.3.2.Neurology
14.6.2.3.3.Orthopedics
14.6.2.3.4.Oncology
14.6.2.3.5.Obstetrics and Gynecology
14.6.2.3.6.Urology
14.6.2.3.7.Respiratory Care
14.6.2.3.8.Trauma and Emergency
14.6.2.3.9.Vascular Imaging
14.6.2.3.10.Others
14.6.2.4.Japan Mobile Medical Imaging Market Revenue (US$ Mn) and Forecasts, By End User
14.6.2.4.1.Hospitals and Clinics
14.6.2.4.2.Diagnostic Imaging Centers
14.6.2.4.3.Ambulatory Surgical Centers (ASCs)
14.6.2.4.4.Others
14.6.3.India
14.6.3.1.India Mobile Medical Imaging Market Revenue (US$ Mn) and Forecasts, By Product Type
14.6.3.1.1.X-ray
14.6.3.1.2.Ultrasound
14.6.3.1.3.CT (Computed Tomography) Scanners
14.6.3.1.4.MRI (Magnetic Resonance Imaging)
14.6.3.1.5.Nuclear Imaging
14.6.3.1.6.Others
14.6.3.2.India Mobile Medical Imaging Market Revenue (US$ Mn) and Forecasts, By Imaging Technology
14.6.3.2.1.2D Imaging
14.6.3.2.2.3D Imaging
14.6.3.3.India Mobile Medical Imaging Market Revenue (US$ Mn) and Forecasts, By Application
14.6.3.3.1.Cardiology
14.6.3.3.2.Neurology
14.6.3.3.3.Orthopedics
14.6.3.3.4.Oncology
14.6.3.3.5.Obstetrics and Gynecology
14.6.3.3.6.Urology
14.6.3.3.7.Respiratory Care
14.6.3.3.8.Trauma and Emergency
14.6.3.3.9.Vascular Imaging
14.6.3.3.10.Others
14.6.3.4.India Mobile Medical Imaging Market Revenue (US$ Mn) and Forecasts, By End User
14.6.3.4.1.Hospitals and Clinics
14.6.3.4.2.Diagnostic Imaging Centers
14.6.3.4.3.Ambulatory Surgical Centers (ASCs)
14.6.3.4.4.Others
14.6.4.New Zealand
14.6.4.1.New Zealand Mobile Medical Imaging Market Revenue (US$ Mn) and Forecasts, By Product Type
14.6.4.1.1.X-ray
14.6.4.1.2.Ultrasound
14.6.4.1.3.CT (Computed Tomography) Scanners
14.6.4.1.4.MRI (Magnetic Resonance Imaging)
14.6.4.1.5.Nuclear Imaging
14.6.4.1.6.Others
14.6.4.2.New Zealand Mobile Medical Imaging Market Revenue (US$ Mn) and Forecasts, By Imaging Technology
14.6.4.2.1.2D Imaging
14.6.4.2.2.3D Imaging
14.6.4.3.New Zealand Mobile Medical Imaging Market Revenue (US$ Mn) and Forecasts, By Application
14.6.4.3.1.Cardiology
14.6.4.3.2.Neurology
14.6.4.3.3.Orthopedics
14.6.4.3.4.Oncology
14.6.4.3.5.Obstetrics and Gynecology
14.6.4.3.6.Urology
14.6.4.3.7.Respiratory Care
14.6.4.3.8.Trauma and Emergency
14.6.4.3.9.Vascular Imaging
14.6.4.3.10.Others
14.6.4.4.New Zealand Mobile Medical Imaging Market Revenue (US$ Mn) and Forecasts, By End User
14.6.4.4.1.Hospitals and Clinics
14.6.4.4.2.Diagnostic Imaging Centers
14.6.4.4.3.Ambulatory Surgical Centers (ASCs)
14.6.4.4.4.Others
14.6.5.Australia
14.6.5.1.Australia Mobile Medical Imaging Market Revenue (US$ Mn) and Forecasts, By Product Type
14.6.5.1.1.X-ray
14.6.5.1.2.Ultrasound
14.6.5.1.3.CT (Computed Tomography) Scanners
14.6.5.1.4.MRI (Magnetic Resonance Imaging)
14.6.5.1.5.Nuclear Imaging
14.6.5.1.6.Others
14.6.5.2.Australia Mobile Medical Imaging Market Revenue (US$ Mn) and Forecasts, By Imaging Technology
14.6.5.2.1.2D Imaging
14.6.5.2.2.3D Imaging
14.6.5.3.Australia Mobile Medical Imaging Market Revenue (US$ Mn) and Forecasts, By Application
14.6.5.3.1.Cardiology
14.6.5.3.2.Neurology
14.6.5.3.3.Orthopedics
14.6.5.3.4.Oncology
14.6.5.3.5.Obstetrics and Gynecology
14.6.5.3.6.Urology
14.6.5.3.7.Respiratory Care
14.6.5.3.8.Trauma and Emergency
14.6.5.3.9.Vascular Imaging
14.6.5.3.10.Others
14.6.5.4.Australia Mobile Medical Imaging Market Revenue (US$ Mn) and Forecasts, By End User
14.6.5.4.1.Hospitals and Clinics
14.6.5.4.2.Diagnostic Imaging Centers
14.6.5.4.3.Ambulatory Surgical Centers (ASCs)
14.6.5.4.4.Others
14.6.6.South Korea
14.6.6.1.South Korea Mobile Medical Imaging Market Revenue (US$ Mn) and Forecasts, By Product Type
14.6.6.1.1.X-ray
14.6.6.1.2.Ultrasound
14.6.6.1.3.CT (Computed Tomography) Scanners
14.6.6.1.4.MRI (Magnetic Resonance Imaging)
14.6.6.1.5.Nuclear Imaging
14.6.6.1.6.Others
14.6.6.2.South Korea Mobile Medical Imaging Market Revenue (US$ Mn) and Forecasts, By Imaging Technology
14.6.6.2.1.2D Imaging
14.6.6.2.2.3D Imaging
14.6.6.3.South Korea Mobile Medical Imaging Market Revenue (US$ Mn) and Forecasts, By Application
14.6.6.3.1.Cardiology
14.6.6.3.2.Neurology
14.6.6.3.3.Orthopedics
14.6.6.3.4.Oncology
14.6.6.3.5.Obstetrics and Gynecology
14.6.6.3.6.Urology
14.6.6.3.7.Respiratory Care
14.6.6.3.8.Trauma and Emergency
14.6.6.3.9.Vascular Imaging
14.6.6.3.10.Others
14.6.6.4.South Korea Mobile Medical Imaging Market Revenue (US$ Mn) and Forecasts, By End User
14.6.6.4.1.Hospitals and Clinics
14.6.6.4.2.Diagnostic Imaging Centers
14.6.6.4.3.Ambulatory Surgical Centers (ASCs)
14.6.6.4.4.Others
14.6.7.Southeast Asia
14.6.7.1.Southeast Asia Mobile Medical Imaging Market Revenue (US$ Mn) and Forecasts, By Product Type
14.6.7.1.1.X-ray
14.6.7.1.2.Ultrasound
14.6.7.1.3.CT (Computed Tomography) Scanners
14.6.7.1.4.MRI (Magnetic Resonance Imaging)
14.6.7.1.5.Nuclear Imaging
14.6.7.1.6.Others
14.6.7.2.Southeast Asia Mobile Medical Imaging Market Revenue (US$ Mn) and Forecasts, By Imaging Technology
14.6.7.2.1.2D Imaging
14.6.7.2.2.3D Imaging
14.6.7.3.Southeast Asia Mobile Medical Imaging Market Revenue (US$ Mn) and Forecasts, By Application
14.6.7.3.1.Cardiology
14.6.7.3.2.Neurology
14.6.7.3.3.Orthopedics
14.6.7.3.4.Oncology
14.6.7.3.5.Obstetrics and Gynecology
14.6.7.3.6.Urology
14.6.7.3.7.Respiratory Care
14.6.7.3.8.Trauma and Emergency
14.6.7.3.9.Vascular Imaging
14.6.7.3.10.Others
14.6.7.4.Southeast Asia Mobile Medical Imaging Market Revenue (US$ Mn) and Forecasts, By End User
14.6.7.4.1.Hospitals and Clinics
14.6.7.4.2.Diagnostic Imaging Centers
14.6.7.4.3.Ambulatory Surgical Centers (ASCs)
14.6.7.4.4.Others
14.6.7.5.Southeast Asia Mobile Medical Imaging Market Revenue (US$ Mn) and Forecasts, By Country
14.6.7.5.1.Indonesia
14.6.7.5.2.Thailand
14.6.7.5.3.Malaysia
14.6.7.5.4.Singapore
14.6.7.5.5.Rest of Southeast Asia
14.6.8.Rest of Asia Pacific
14.6.8.1.Rest of Asia Pacific Mobile Medical Imaging Market Revenue (US$ Mn) and Forecasts, By Product Type
14.6.8.1.1.X-ray
14.6.8.1.2.Ultrasound
14.6.8.1.3.CT (Computed Tomography) Scanners
14.6.8.1.4.MRI (Magnetic Resonance Imaging)
14.6.8.1.5.Nuclear Imaging
14.6.8.1.6.Others
14.6.8.2.Rest of Asia Pacific Mobile Medical Imaging Market Revenue (US$ Mn) and Forecasts, By Imaging Technology
14.6.8.2.1.2D Imaging
14.6.8.2.2.3D Imaging
14.6.8.3.Rest of Asia Pacific Mobile Medical Imaging Market Revenue (US$ Mn) and Forecasts, By Application
14.6.8.3.1.Cardiology
14.6.8.3.2.Neurology
14.6.8.3.3.Orthopedics
14.6.8.3.4.Oncology
14.6.8.3.5.Obstetrics and Gynecology
14.6.8.3.6.Urology
14.6.8.3.7.Respiratory Care
14.6.8.3.8.Trauma and Emergency
14.6.8.3.9.Vascular Imaging
14.6.8.3.10.Others
14.6.8.4.Rest of Asia Pacific Mobile Medical Imaging Market Revenue (US$ Mn) and Forecasts, By End User
14.6.8.4.1.Hospitals and Clinics
14.6.8.4.2.Diagnostic Imaging Centers
14.6.8.4.3.Ambulatory Surgical Centers (ASCs)
14.6.8.4.4.Others
14.7.Key Segment for Channeling Investments
14.7.1.By Country
14.7.2.By Product Type
14.7.3.By Imaging Technology
14.7.4.By Application
14.7.5.By End User
15.Middle East and Africa Mobile Medical Imaging Market Analysis and Forecasts, 2024 – 2034
15.1.Overview
15.1.1.Middle East and Africa Mobile Medical Imaging Market Revenue (US$ Mn)
15.2.Middle East and Africa Mobile Medical Imaging Market Revenue (US$ Mn) and Forecasts, By Product Type
15.2.1.X-ray
15.2.2.Ultrasound
15.2.3.CT (Computed Tomography) Scanners
15.2.4.MRI (Magnetic Resonance Imaging)
15.2.5.Nuclear Imaging
15.2.6.Others
15.3.Middle East and Africa Mobile Medical Imaging Market Revenue (US$ Mn) and Forecasts, By Imaging Technology
15.3.1.2D Imaging
15.3.2.3D Imaging
15.4.Middle East and Africa Mobile Medical Imaging Market Revenue (US$ Mn) and Forecasts, By Application
15.4.1.Cardiology
15.4.2.Neurology
15.4.3.Orthopedics
15.4.4.Oncology
15.4.5.Obstetrics and Gynecology
15.4.6.Urology
15.4.7.Respiratory Care
15.4.8.Trauma and Emergency
15.4.9.Vascular Imaging
15.4.10.Others
15.5.Middle East and Africa Mobile Medical Imaging Market Revenue (US$ Mn) and Forecasts, By End User
15.5.1.Hospitals and Clinics
15.5.2.Diagnostic Imaging Centers
15.5.3.Ambulatory Surgical Centers (ASCs)
15.5.4.Others
15.6.Middle East and Africa Mobile Medical Imaging Market Revenue (US$ Mn) and Forecasts, By Country
15.6.1.Saudi Arabia
15.6.1.1.Saudi Arabia Mobile Medical Imaging Market Revenue (US$ Mn) and Forecasts, By Product Type
15.6.1.1.1.X-ray
15.6.1.1.2.Ultrasound
15.6.1.1.3.CT (Computed Tomography) Scanners
15.6.1.1.4.MRI (Magnetic Resonance Imaging)
15.6.1.1.5.Nuclear Imaging
15.6.1.1.6.Others
15.6.1.2.Saudi Arabia Mobile Medical Imaging Market Revenue (US$ Mn) and Forecasts, By Imaging Technology
15.6.1.2.1.2D Imaging
15.6.1.2.2.3D Imaging
15.6.1.3.Saudi Arabia Mobile Medical Imaging Market Revenue (US$ Mn) and Forecasts, By Application
15.6.1.3.1.Cardiology
15.6.1.3.2.Neurology
15.6.1.3.3.Orthopedics
15.6.1.3.4.Oncology
15.6.1.3.5.Obstetrics and Gynecology
15.6.1.3.6.Urology
15.6.1.3.7.Respiratory Care
15.6.1.3.8.Trauma and Emergency
15.6.1.3.9.Vascular Imaging
15.6.1.3.10.Others
15.6.1.4.Saudi Arabia Mobile Medical Imaging Market Revenue (US$ Mn) and Forecasts, By End User
15.6.1.4.1.Hospitals and Clinics
15.6.1.4.2.Diagnostic Imaging Centers
15.6.1.4.3.Ambulatory Surgical Centers (ASCs)
15.6.1.4.4.Others
15.6.2.UAE
15.6.2.1.UAE Mobile Medical Imaging Market Revenue (US$ Mn) and Forecasts, By Product Type
15.6.2.1.1.X-ray
15.6.2.1.2.Ultrasound
15.6.2.1.3.CT (Computed Tomography) Scanners
15.6.2.1.4.MRI (Magnetic Resonance Imaging)
15.6.2.1.5.Nuclear Imaging
15.6.2.1.6.Others
15.6.2.2.UAE Mobile Medical Imaging Market Revenue (US$ Mn) and Forecasts, By Imaging Technology
15.6.2.2.1.2D Imaging
15.6.2.2.2.3D Imaging
15.6.2.3.UAE Mobile Medical Imaging Market Revenue (US$ Mn) and Forecasts, By Application
15.6.2.3.1.Cardiology
15.6.2.3.2.Neurology
15.6.2.3.3.Orthopedics
15.6.2.3.4.Oncology
15.6.2.3.5.Obstetrics and Gynecology
15.6.2.3.6.Urology
15.6.2.3.7.Respiratory Care
15.6.2.3.8.Trauma and Emergency
15.6.2.3.9.Vascular Imaging
15.6.2.3.10.Others
15.6.2.4.UAE Mobile Medical Imaging Market Revenue (US$ Mn) and Forecasts, By End User
15.6.2.4.1.Hospitals and Clinics
15.6.2.4.2.Diagnostic Imaging Centers
15.6.2.4.3.Ambulatory Surgical Centers (ASCs)
15.6.2.4.4.Others
15.6.3.Egypt
15.6.3.1.Egypt Mobile Medical Imaging Market Revenue (US$ Mn) and Forecasts, By Product Type
15.6.3.1.1.X-ray
15.6.3.1.2.Ultrasound
15.6.3.1.3.CT (Computed Tomography) Scanners
15.6.3.1.4.MRI (Magnetic Resonance Imaging)
15.6.3.1.5.Nuclear Imaging
15.6.3.1.6.Others
15.6.3.2.Egypt Mobile Medical Imaging Market Revenue (US$ Mn) and Forecasts, By Imaging Technology
15.6.3.2.1.2D Imaging
15.6.3.2.2.3D Imaging
15.6.3.3.Egypt Mobile Medical Imaging Market Revenue (US$ Mn) and Forecasts, By Application
15.6.3.3.1.Cardiology
15.6.3.3.2.Neurology
15.6.3.3.3.Orthopedics
15.6.3.3.4.Oncology
15.6.3.3.5.Obstetrics and Gynecology
15.6.3.3.6.Urology
15.6.3.3.7.Respiratory Care
15.6.3.3.8.Trauma and Emergency
15.6.3.3.9.Vascular Imaging
15.6.3.3.10.Others
15.6.3.4.Egypt Mobile Medical Imaging Market Revenue (US$ Mn) and Forecasts, By End User
15.6.3.4.1.Hospitals and Clinics
15.6.3.4.2.Diagnostic Imaging Centers
15.6.3.4.3.Ambulatory Surgical Centers (ASCs)
15.6.3.4.4.Others
15.6.4.Kuwait
15.6.4.1.Kuwait Mobile Medical Imaging Market Revenue (US$ Mn) and Forecasts, By Product Type
15.6.4.1.1.X-ray
15.6.4.1.2.Ultrasound
15.6.4.1.3.CT (Computed Tomography) Scanners
15.6.4.1.4.MRI (Magnetic Resonance Imaging)
15.6.4.1.5.Nuclear Imaging
15.6.4.1.6.Others
15.6.4.2.Kuwait Mobile Medical Imaging Market Revenue (US$ Mn) and Forecasts, By Imaging Technology
15.6.4.2.1.2D Imaging
15.6.4.2.2.3D Imaging
15.6.4.3.Kuwait Mobile Medical Imaging Market Revenue (US$ Mn) and Forecasts, By Application
15.6.4.3.1.Cardiology
15.6.4.3.2.Neurology
15.6.4.3.3.Orthopedics
15.6.4.3.4.Oncology
15.6.4.3.5.Obstetrics and Gynecology
15.6.4.3.6.Urology
15.6.4.3.7.Respiratory Care
15.6.4.3.8.Trauma and Emergency
15.6.4.3.9.Vascular Imaging
15.6.4.3.10.Others
15.6.4.4.Kuwait Mobile Medical Imaging Market Revenue (US$ Mn) and Forecasts, By End User
15.6.4.4.1.Hospitals and Clinics
15.6.4.4.2.Diagnostic Imaging Centers
15.6.4.4.3.Ambulatory Surgical Centers (ASCs)
15.6.4.4.4.Others
15.6.5.South Africa
15.6.5.1.South Africa Mobile Medical Imaging Market Revenue (US$ Mn) and Forecasts, By Product Type
15.6.5.1.1.X-ray
15.6.5.1.2.Ultrasound
15.6.5.1.3.CT (Computed Tomography) Scanners
15.6.5.1.4.MRI (Magnetic Resonance Imaging)
15.6.5.1.5.Nuclear Imaging
15.6.5.1.6.Others
15.6.5.2.South Africa Mobile Medical Imaging Market Revenue (US$ Mn) and Forecasts, By Imaging Technology
15.6.5.2.1.2D Imaging
15.6.5.2.2.3D Imaging
15.6.5.3.South Africa Mobile Medical Imaging Market Revenue (US$ Mn) and Forecasts, By Application
15.6.5.3.1.Cardiology
15.6.5.3.2.Neurology
15.6.5.3.3.Orthopedics
15.6.5.3.4.Oncology
15.6.5.3.5.Obstetrics and Gynecology
15.6.5.3.6.Urology
15.6.5.3.7.Respiratory Care
15.6.5.3.8.Trauma and Emergency
15.6.5.3.9.Vascular Imaging
15.6.5.3.10.Others
15.6.5.4.South Africa Mobile Medical Imaging Market Revenue (US$ Mn) and Forecasts, By End User
15.6.5.4.1.Hospitals and Clinics
15.6.5.4.2.Diagnostic Imaging Centers
15.6.5.4.3.Ambulatory Surgical Centers (ASCs)
15.6.5.4.4.Others
15.6.6.Rest of Middle East & Africa
15.6.6.1.Rest of Middle East & Africa Mobile Medical Imaging Market Revenue (US$ Mn) and Forecasts, By Product Type
15.6.6.1.1.X-ray
15.6.6.1.2.Ultrasound
15.6.6.1.3.CT (Computed Tomography) Scanners
15.6.6.1.4.MRI (Magnetic Resonance Imaging)
15.6.6.1.5.Nuclear Imaging
15.6.6.1.6.Others
15.6.6.2.Rest of Middle East & Africa Mobile Medical Imaging Market Revenue (US$ Mn) and Forecasts, By Imaging Technology
15.6.6.2.1.2D Imaging
15.6.6.2.2.3D Imaging
15.6.6.3.Rest of Middle East & Africa Mobile Medical Imaging Market Revenue (US$ Mn) and Forecasts, By Application
15.6.6.3.1.Cardiology
15.6.6.3.2.Neurology
15.6.6.3.3.Orthopedics
15.6.6.3.4.Oncology
15.6.6.3.5.Obstetrics and Gynecology
15.6.6.3.6.Urology
15.6.6.3.7.Respiratory Care
15.6.6.3.8.Trauma and Emergency
15.6.6.3.9.Vascular Imaging
15.6.6.3.10.Others
15.6.6.4.Rest of Middle East & Africa Mobile Medical Imaging Market Revenue (US$ Mn) and Forecasts, By End User
15.6.6.4.1.Hospitals and Clinics
15.6.6.4.2.Diagnostic Imaging Centers
15.6.6.4.3.Ambulatory Surgical Centers (ASCs)
15.6.6.4.4.Others
15.7.Key Segment for Channeling Investments
15.7.1.By Country
15.7.2.By Product Type
15.7.3.By Imaging Technology
15.7.4.By Application
15.7.5.By End User
16.Latin America Mobile Medical Imaging Market Analysis and Forecasts, 2024 – 2034
16.1.Overview
16.1.1.Latin America Mobile Medical Imaging Market Revenue (US$ Mn)
16.2.Latin America Mobile Medical Imaging Market Revenue (US$ Mn) and Forecasts, By Product Type
16.2.1.X-ray
16.2.2.Ultrasound
16.2.3.CT (Computed Tomography) Scanners
16.2.4.MRI (Magnetic Resonance Imaging)
16.2.5.Nuclear Imaging
16.2.6.Others
16.3.Latin America Mobile Medical Imaging Market Revenue (US$ Mn) and Forecasts, By Imaging Technology
16.3.1.2D Imaging
16.3.2.3D Imaging
16.4.Latin America Mobile Medical Imaging Market Revenue (US$ Mn) and Forecasts, By Application
16.4.1.Cardiology
16.4.2.Neurology
16.4.3.Orthopedics
16.4.4.Oncology
16.4.5.Obstetrics and Gynecology
16.4.6.Urology
16.4.7.Respiratory Care
16.4.8.Trauma and Emergency
16.4.9.Vascular Imaging
16.4.10.Others
16.5.Latin America Mobile Medical Imaging Market Revenue (US$ Mn) and Forecasts, By End User
16.5.1.Hospitals and Clinics
16.5.2.Diagnostic Imaging Centers
16.5.3.Ambulatory Surgical Centers (ASCs)
16.5.4.Others
16.6.Latin America Mobile Medical Imaging Market Revenue (US$ Mn) and Forecasts, By Country
16.6.1.Brazil
16.6.1.1.Brazil Mobile Medical Imaging Market Revenue (US$ Mn) and Forecasts, By Product Type
16.6.1.1.1.X-ray
16.6.1.1.2.Ultrasound
16.6.1.1.3.CT (Computed Tomography) Scanners
16.6.1.1.4.MRI (Magnetic Resonance Imaging)
16.6.1.1.5.Nuclear Imaging
16.6.1.1.6.Others
16.6.1.2.Brazil Mobile Medical Imaging Market Revenue (US$ Mn) and Forecasts, By Imaging Technology
16.6.1.2.1.2D Imaging
16.6.1.2.2.3D Imaging
16.6.1.3.Brazil Mobile Medical Imaging Market Revenue (US$ Mn) and Forecasts, By Application
16.6.1.3.1.Cardiology
16.6.1.3.2.Neurology
16.6.1.3.3.Orthopedics
16.6.1.3.4.Oncology
16.6.1.3.5.Obstetrics and Gynecology
16.6.1.3.6.Urology
16.6.1.3.7.Respiratory Care
16.6.1.3.8.Trauma and Emergency
16.6.1.3.9.Vascular Imaging
16.6.1.3.10.Others
16.6.1.4.Brazil Mobile Medical Imaging Market Revenue (US$ Mn) and Forecasts, By End User
16.6.1.4.1.Hospitals and Clinics
16.6.1.4.2.Diagnostic Imaging Centers
16.6.1.4.3.Ambulatory Surgical Centers (ASCs)
16.6.1.4.4.Others
16.6.2.Argentina
16.6.2.1.Argentina Mobile Medical Imaging Market Revenue (US$ Mn) and Forecasts, By Product Type
16.6.2.1.1.X-ray
16.6.2.1.2.Ultrasound
16.6.2.1.3.CT (Computed Tomography) Scanners
16.6.2.1.4.MRI (Magnetic Resonance Imaging)
16.6.2.1.5.Nuclear Imaging
16.6.2.1.6.Others
16.6.2.2.Argentina Mobile Medical Imaging Market Revenue (US$ Mn) and Forecasts, By Imaging Technology
16.6.2.2.1.2D Imaging
16.6.2.2.2.3D Imaging
16.6.2.3.Argentina Mobile Medical Imaging Market Revenue (US$ Mn) and Forecasts, By Application
16.6.2.3.1.Cardiology
16.6.2.3.2.Neurology
16.6.2.3.3.Orthopedics
16.6.2.3.4.Oncology
16.6.2.3.5.Obstetrics and Gynecology
16.6.2.3.6.Urology
16.6.2.3.7.Respiratory Care
16.6.2.3.8.Trauma and Emergency
16.6.2.3.9.Vascular Imaging
16.6.2.3.10.Others
16.6.2.4.Argentina Mobile Medical Imaging Market Revenue (US$ Mn) and Forecasts, By End User
16.6.2.4.1.Hospitals and Clinics
16.6.2.4.2.Diagnostic Imaging Centers
16.6.2.4.3.Ambulatory Surgical Centers (ASCs)
16.6.2.4.4.Others
16.6.3.Rest of Latin America
16.6.3.1.Rest of Latin America Mobile Medical Imaging Market Revenue (US$ Mn) and Forecasts, By Product Type
16.6.3.1.1.X-ray
16.6.3.1.2.Ultrasound
16.6.3.1.3.CT (Computed Tomography) Scanners
16.6.3.1.4.MRI (Magnetic Resonance Imaging)
16.6.3.1.5.Nuclear Imaging
16.6.3.1.6.Others
16.6.3.2.Rest of Latin America Mobile Medical Imaging Market Revenue (US$ Mn) and Forecasts, By Imaging Technology
16.6.3.2.1.2D Imaging
16.6.3.2.2.3D Imaging
16.6.3.3.Rest of Latin America Mobile Medical Imaging Market Revenue (US$ Mn) and Forecasts, By Application
16.6.3.3.1.Cardiology
16.6.3.3.2.Neurology
16.6.3.3.3.Orthopedics
16.6.3.3.4.Oncology
16.6.3.3.5.Obstetrics and Gynecology
16.6.3.3.6.Urology
16.6.3.3.7.Respiratory Care
16.6.3.3.8.Trauma and Emergency
16.6.3.3.9.Vascular Imaging
16.6.3.3.10.Others
16.6.3.4.Rest of Latin America Mobile Medical Imaging Market Revenue (US$ Mn) and Forecasts, By End User
16.6.3.4.1.Hospitals and Clinics
16.6.3.4.2.Diagnostic Imaging Centers
16.6.3.4.3.Ambulatory Surgical Centers (ASCs)
16.6.3.4.4.Others
16.7.Key Segment for Channeling Investments
16.7.1.By Country
16.7.2.By Product Type
16.7.3.By Imaging Technology
16.7.4.By Application
16.7.5.By End User
17.Competitive Benchmarking
17.1.Brand Benchmarking
17.2.Market Share Analysis, 2023
17.3.Global Presence and Growth Strategies
17.3.1.Mergers and Acquisitions
17.3.2.Product Launches
17.3.3.Investments Trends
17.3.4.R&D Initiatives
18.Player Profiles
18.1.Allengers Medical Systems
18.1.1.Company Details
18.1.2.Company Overview
18.1.3.Product Offerings
18.1.4.Key Developments
18.1.5.Financial Analysis
18.1.6.SWOT Analysis
18.1.7.Business Strategies
18.2.Analogic Corporation
18.2.1.Company Details
18.2.2.Company Overview
18.2.3.Product Offerings
18.2.4.Key Developments
18.2.5.Financial Analysis
18.2.6.SWOT Analysis
18.2.7.Business Strategies
18.3.Butterfly Network, Inc.
18.3.1.Company Details
18.3.2.Company Overview
18.3.3.Product Offerings
18.3.4.Key Developments
18.3.5.Financial Analysis
18.3.6.SWOT Analysis
18.3.7.Business Strategies
18.4.Canon Medical Systems
18.4.1.Company Details
18.4.2.Company Overview
18.4.3.Product Offerings
18.4.4.Key Developments
18.4.5.Financial Analysis
18.4.6.SWOT Analysis
18.4.7.Business Strategies
18.5.Carestream Health
18.5.1.Company Details
18.5.2.Company Overview
18.5.3.Product Offerings
18.5.4.Key Developments
18.5.5.Financial Analysis
18.5.6.SWOT Analysis
18.5.7.Business Strategies
18.6.Fujifilm Holdings Corporation
18.6.1.Company Details
18.6.2.Company Overview
18.6.3.Product Offerings
18.6.4.Key Developments
18.6.5.Financial Analysis
18.6.6.SWOT Analysis
18.6.7.Business Strategies
18.7.GE Healthcare
18.7.1.Company Details
18.7.2.Company Overview
18.7.3.Product Offerings
18.7.4.Key Developments
18.7.5.Financial Analysis
18.7.6.SWOT Analysis
18.7.7.Business Strategies
18.8.Hologic, Inc.
18.8.1.Company Details
18.8.2.Company Overview
18.8.3.Product Offerings
18.8.4.Key Developments
18.8.5.Financial Analysis
18.8.6.SWOT Analysis
18.8.7.Business Strategies
18.9.Konica Minolta Healthcare
18.9.1.Company Details
18.9.2.Company Overview
18.9.3.Product Offerings
18.9.4.Key Developments
18.9.5.Financial Analysis
18.9.6.SWOT Analysis
18.9.7.Business Strategies
18.10.Mindray Medical International Limited
18.10.1.Company Details
18.10.2.Company Overview
18.10.3.Product Offerings
18.10.4.Key Developments
18.10.5.Financial Analysis
18.10.6.SWOT Analysis
18.10.7.Business Strategies
18.11.Philips Healthcare
18.11.1.Company Details
18.11.2.Company Overview
18.11.3.Product Offerings
18.11.4.Key Developments
18.11.5.Financial Analysis
18.11.6.SWOT Analysis
18.11.7.Business Strategies
18.12.Samsung Medison
18.12.1.Company Details
18.12.2.Company Overview
18.12.3.Product Offerings
18.12.4.Key Developments
18.12.5.Financial Analysis
18.12.6.SWOT Analysis
18.12.7.Business Strategies
18.13.Shimadzu Corporation
18.13.1.Company Details
18.13.2.Company Overview
18.13.3.Product Offerings
18.13.4.Key Developments
18.13.5.Financial Analysis
18.13.6.SWOT Analysis
18.13.7.Business Strategies
18.14.Siemens Healthineers
18.14.1.Company Details
18.14.2.Company Overview
18.14.3.Product Offerings
18.14.4.Key Developments
18.14.5.Financial Analysis
18.14.6.SWOT Analysis
18.14.7.Business Strategies
18.15.Ziehm Imaging
18.15.1.Company Details
18.15.2.Company Overview
18.15.3.Product Offerings
18.15.4.Key Developments
18.15.5.Financial Analysis
18.15.6.SWOT Analysis
18.15.7.Business Strategies
18.16.Other Industry Participants
19.Key Findings

.

Note: This ToC is tentative and can be changed according to the research study conducted during the course of report completion.

**Exclusive for Multi-User and Enterprise User.

Global Mobile Medical Imaging Market

By Product Type

  • X-ray
  • Ultrasound
  • CT (Computed Tomography) Scanners
  • MRI (Magnetic Resonance Imaging)
  • Nuclear Imaging
  • Others

By Imaging Technology

  • 2D Imaging
  • 3D Imaging

By Application

  • Cardiology
  • Neurology
  • Orthopedics
  • Oncology
  • Obstetrics and Gynecology
  • Urology
  • Respiratory Care
  • Trauma and Emergency
  • Vascular Imaging
  • Others

By End User

  • Hospitals and Clinics
  • Diagnostic Imaging Centers
  • Ambulatory Surgical Centers (ASCs)
  • Others

By Region

  • North America (U.S., Canada, Mexico, Rest of North America)
  • Europe (France, The UK, Spain, Germany, Italy, Nordic Countries (Denmark, Finland, Iceland, Sweden, Norway), Benelux Union (Belgium, The Netherlands, Luxembourg), Rest of Europe)
  • Asia Pacific (China, Japan, India, New Zealand, Australia, South Korea, Southeast Asia (Indonesia, Thailand, Malaysia, Singapore, Rest of Southeast Asia), Rest of Asia Pacific)
  • Middle East & Africa (Saudi Arabia, UAE, Egypt, Kuwait, South Africa, Rest of Middle East & Africa)
  • Latin America (Brazil, Argentina, Rest of Latin America)

The Niche Research approach encompasses both primary and secondary research methods to provide comprehensive insights. While primary research is the cornerstone of our studies, we also incorporate secondary research sources such as company annual reports, premium industry databases, press releases, industry journals, and white papers.

Within our primary research, we actively engage with various industry stakeholders, conducting paid interviews and surveys. Our meticulous analysis extends to every market participant in major countries, allowing us to thoroughly examine their portfolios, calculate market shares, and segment revenues.

Our data collection primarily focuses on individual countries within our research scope, enabling us to estimate regional market sizes. Typically, we employ a bottom-up approach, meticulously tracking trends in different countries. We analyze growth drivers, constraints, technological innovations, and opportunities for each country, ultimately arriving at regional figures.Our process begins by examining the growth prospects of each country. Building upon these insights, we project growth and trends for the entire region. Finally, we utilize our proprietary model to refine estimations and forecasts.

Our data validation standards are integral to ensuring the reliability and accuracy of our research findings. Here’s a breakdown of our data validation processes and the stakeholders we engage with during our primary research:

  • Supply Side Analysis: We initiate a supply side analysis by directly contacting market participants, through telephonic interviews and questionnaires containing both open-ended and close-ended questions. We gather information on their portfolios, segment revenues, developments, and growth strategies.
  • Demand Side Analysis: To gain insights into adoption trends and consumer preferences, we reach out to target customers and users (non-vendors). This information forms a vital part of the qualitative analysis section of our reports, covering market dynamics, adoption trends, consumer behavior, spending patterns, and other related aspects.
  • Consultant Insights: We tap into the expertise of our partner consultants from around the world to obtain their unique viewpoints and perspectives. Their insights contribute to a well-rounded understanding of the markets under investigation.
  • In-House Validation: To ensure data accuracy and reliability, we conduct cross-validation of data points and information through our in-house team of consultants and utilize advanced data modeling tools for thorough verification.

The forecasts we provide are based on a comprehensive assessment of various factors, including:

  • Market Trends and Past Performance (Last Five Years): We accurately analyze market trends and performance data from preceding five years to identify historical patterns and understand the market’s evolution.
  • Historical Performance and Growth of Market Participants: We assess the historical performance and growth trajectories of key market participants. This analysis provides insights into the competitive landscape and individual company strategies.
  • Market Determinants Impact Analysis (Next Eight Years): We conduct a rigorous analysis of the factors that are projected to influence the market over the next eight years. This includes assessing both internal and external determinants that can shape market dynamics.
  • Drivers and Challenges for the Forecast Period:Identify the factors expected to drive market growth during the forecast period, as well as the challenges that the industry may face. This analysis aids in deriving an accurate growth rate projection.
  • New Acquisitions, Collaborations, or Partnerships: We keep a close watch on any new acquisitions, collaborations, or partnerships within the industry. These developments can have a significant impact on market dynamics and competitiveness.
  • Macro and Micro Factors Analysis:A thorough examination of both macro-level factors (e.g., economic trends, regulatory changes) and micro-level factors (e.g., technological advancements, consumer preferences) that may influence the market during the forecast period.
  • End-User Sentiment Analysis: To understand the market from the end-user perspective, we conduct sentiment analysis. This involves assessing the sentiment, preferences, and feedback of the end-users, which can provide valuable insights into market trends.
  • Perspective of Primary Participants: Insights gathered directly from primary research participants play a crucial role in shaping our forecasts. Their perspectives and experiences provide valuable qualitative data.
  • Year-on-Year Growth Trend: We utilize a year-on-year growth trend based on historical market growth and expected future trends. This helps in formulating our growth projections, aligning them with the market’s historical performance.

Research process adopted by TNR involves multiple stages, including data collection, validation, quality checks, and presentation. It’s crucial that the data and information we provide add value to your existing market understanding and expertise. We have also established partnerships with business consulting, research, and survey organizations across regions and globally to collaborate on regional analysis and data validation, ensuring the highest level of accuracy and reliability in our reports.


Procure Comprehensive Study of

Global Mobile Medical Imaging Market

Online Only

  • Online Access
  • Read Only File
  • Validity 3 Months
  • Print, Copy, Paste & Download
  • PPT, Excel
  • Cost-Free Report in the Next Update
$3300
Buy Now

Single User

  • Access to One User on One System
  • Read Only File
  • Validity 6 Months
  • Limited Print,Copy, Paste
  • PPT, Excel
  • Cost-Free Report in the Next Update
$4200
Buy Now

Multi User

  • Access to Fiver Users
  • PDF File
  • Validity 1 Year
  • Upto FivePrints
  • Cost-Free Report in the Next Update
  • PPT, Excel
$6000
Buy Now

Enterprise User

  • Access to Unlimited Users
  • PDF, PPT, Excel
  • Unlimited Validity, Prints&Downloads
  • 1 Hour Cost-Free & Dedicated Analyst Support
  • 10% Cost-Free Customization
  • Cost-Free Report Update Twice in a Year
  • Recommendations for Business Strategies
  • Authorization to Quote TNR, The Niche Research
$7300
Buy Now

Library Access

  • Online Access to Content Publications
  • Access Player Profiles Online
  • Get Immediate Access to Newly Added Content
  • Acquire 12 PDF Downloads
  • Acquire 5 Excel Data Sets
  • Gain Access to 290+ PDFs of Company Profiles
  • Round-the-clock Email and Phone Assistance
  • Dashboard Usage and Trends
  • Renewal & Upgrade Assistance
  • Assessing Customization Options and Alerts for New Reports
$10788
Buy Now
*Taxes/Fees, if applicable will be added during checkout. All prices in USD

Why TNR The Niche Research?

  • Unwavering Commitment to Excellence

  • Veteran Team of Researchers

  • Accurate and Timely Insights

  • Ethical Practices and Customized Service

  • Uninterrupted Availability Around the Clock

Scroll to Top