Global Ophthalmic Operating Tables Market By Product, By End User, By Region & Segmental Insights Trends and Forecast, 2023 – 2034

  • Industry: Healthcare
  • Report ID: TNR-110-1057
  • Number of Pages: 420
  • Table/Charts : Yes
  • March, 2024
  • Base Year : 2024
  • No. of Companies : 10+
  • No. of Countries : 29
  • Views : 10111
  • Covid Impact Covered: Yes
  • War Impact Covered: Yes
  • Formats : PDF, Excel, PPT

Ophthalmic operating tables market is witnessing substantial growth due to advancements in ophthalmic surgical procedures and rising demand for efficient surgical equipment. These specialized tables are designed to cater to the unique requirements of eye surgeries, providing precise positioning and enhanced access for surgeons. Technological innovations, such as electrically controlled adjustments, improved patient safety features, and integration with imaging systems, contribute to market expansion.

The growing prevalence of eye disorders, coupled with an aging population, drives the demand for ophthalmic surgeries, further propelling market growth. Additionally, increased healthcare infrastructure development and rising investments in medical facilities worldwide foster the adoption of advanced ophthalmic operating tables, shaping a promising landscape for manufacturers and stakeholders in this dynamic market. In terms of revenue, the global ophthalmic operating tables market was worth US$ 170.2 Mn in 2023, anticipated to witness a CAGR of 4.9% During 2024 – 2034.

Global Ophthalmic Operating Tables Market Revenue & Forecast, (US$ Million), 2016 – 2034 

Trends in the Global Ophthalmic Operating Tables Market

  • Global ophthalmic operating tables market is experiencing a surge in technological advancements, with a focus on digital integration. Tables equipped with advanced imaging systems, robotic assistance, and seamless connectivity are enhancing surgical precision. Surgeons benefit from real-time data, contributing to better decision-making during ophthalmic procedures. This trend underscores the industry’s commitment to cutting-edge solutions that improve patient outcomes and overall surgical efficiency.
  • A prominent trend in the ophthalmic operating tables market is the shift towards patient-centric design and ergonomic features. Manufacturers are prioritizing tables that offer optimal positioning for surgeons while ensuring patient comfort and safety. These designs enhance accessibility, reduce procedure times, and contribute to a more positive patient experience. This trend aligns with the growing emphasis on personalized and efficient healthcare solutions, driving the demand for ophthalmic operating tables that prioritize both surgical precision and patient well-being.

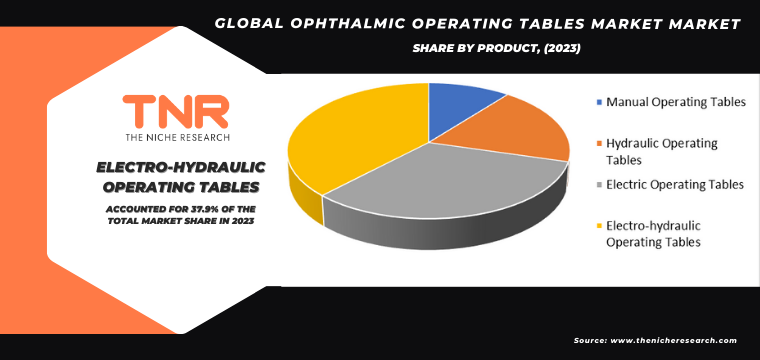
Electric operating tables has gained popularity in recent years and is anticipated to be the fastest-growing segment in the global market during the forecast period.

The increasing popularity of electric operating tables in the global market for ophthalmic operating tables is driven by their transformative impact on surgical precision, ease of use, and patient outcomes. Electric tables offer versatile and precise positioning, allowing surgeons to make intricate adjustments with minimal effort. This adaptability is crucial in ophthalmic surgeries where precision is paramount.

Additionally, electric tables enhance workflow efficiency, reducing procedure times and improving overall surgical productivity. The integration of advanced control systems and automation further contributes to the appeal of electric tables, providing surgeons with intuitive interfaces and enhancing overall operational convenience. As healthcare facilities prioritize advanced technologies, the demand for electric operating tables is anticipated to surge, making them the fastest-growing segment in the ophthalmic operating tables market during the forecast period.

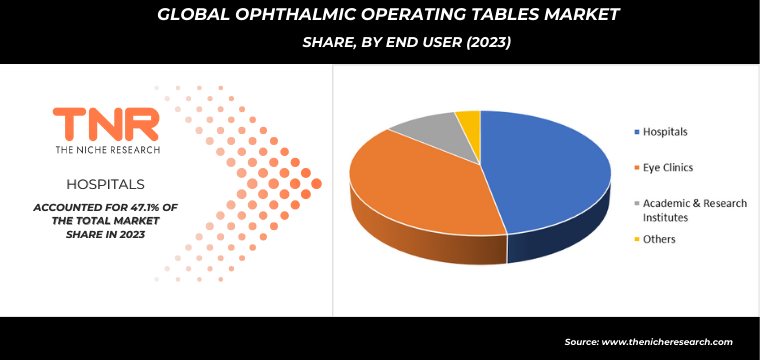
The hospitals segment had the highest share in the global ophthalmic operating tables market in 2023. The dominance of the hospitals segment in the global ophthalmic operating tables market in 2023 can be attributed to several factors. Hospitals serve as primary centers for comprehensive eye care and ophthalmic surgeries, necessitating a robust infrastructure equipped with advanced surgical equipment. Ophthalmic operating tables play a pivotal role in facilitating precise and efficient eye surgeries, and hospitals, being major healthcare institutions, prioritize investing in cutting-edge technologies to enhance patient care.

Moreover, hospitals often handle a diverse range of ophthalmic procedures, from routine surgeries to complex interventions, requiring versatile operating tables that can accommodate various surgical needs. The high patient influx and the demand for specialized ophthalmic services in hospital settings contribute to the substantial market share. Additionally, the stringent regulatory standards and accreditation requirements for hospitals drive the adoption of advanced equipment, positioning them as key contributors to the global ophthalmic operating tables market share.

Asia Pacific region is poised to experience the fastest growth in the global ophthalmic operating tables market during the forecast period, primarily due to a confluence of factors. Rapid economic development, increasing healthcare infrastructure investments, and a rising prevalence of eye disorders in countries like China and India are propelling the demand for advanced ophthalmic surgical equipment. Additionally, a growing aging population in the region contributes to a higher incidence of age-related eye conditions, fostering the need for sophisticated surgical interventions.

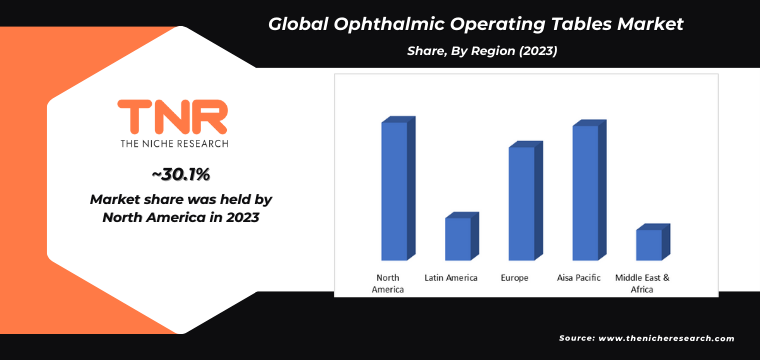
Moreover, governmental initiatives to improve healthcare accessibility and affordability, coupled with a surge in healthcare expenditure, further drive the adoption of cutting-edge ophthalmic technologies. This combination of demographic trends and supportive healthcare policies positions the Asia Pacific as a key growth engine for the ophthalmic operating tables market in the coming years.

Competitive Landscape

The competitive landscape of the ophthalmic operating tables market is characterized by intense rivalry among key players, fostering innovation and strategic collaborations. Market leaders focus on technological advancements, product differentiation, and expanding global footprints to maintain a competitive edge. Robust research and development activities contribute to the dynamic and evolving nature of the industry.

Some of the players operating in the ophthalmic operating tables market are

  • Advin Health Care
  • Akrus
  • Alcon
  • ANA MED
  • AR EL TIBBI URUNLER
  • BENQ Medical Technology
  • Bicakcilar
  • BiHealthcare
  • Ergo Tec
  • Frastema
  • Gladius Medical KFT
  • Howell Medical
  • Meditech
  • Merivaara
  • Ningbo Techart Medical Equipment
  • OPT SurgiSystems
  • Palakkad Surgical Industries
  • Seeuco Electronics Technology
  • Shree Hospital Equipments
  • Strongman Medline
  • Takara Belmont Corporation
  • TECHNOMED
  • TM Tigers
  • UFSK International OSYS
  • US Ophthalmic
  • Others

Global Ophthalmic Operating Tables Market: Key Takeaways

Report Specifications Details
Market Revenue in 2023 US$ 170.2 Mn
Market Size Forecast by 2034 US$ 288.0 Mn
Growth Rate (CAGR) 4.9%
Historic Data 2016 – 2022
Base Year for Estimation 2023
Forecast Period 2024 – 2034
Report Inclusions Market Size & Estimates, Market Dynamics, Competitive Scenario, Trends, Growth Factors, Market Determinants, Key Investment Segmentation, Product/Service/Solutions Benchmarking
Segments Covered By Product, By End User
Regions Covered North America, Europe, Asia Pacific, Middle East & Africa, Latin America
Countries Covered U.S., Canada, Mexico, Rest of North America,  France, The UK, Spain, Germany, Italy, Nordic Countries (Denmark, Finland, Iceland, Sweden, Norway), Benelux Union (Belgium, The Netherlands, Luxembourg), Rest of Europe,  China, Japan, India, New Zealand, Australia, South Korea, Southeast Asia (Indonesia, Thailand, Malaysia, Singapore, Rest of Southeast Asia), Rest of Asia Pacific,  Saudi Arabia, UAE, Egypt, Kuwait, South Africa, Rest of Middle East & Africa,  Brazil, Argentina, Rest of Latin America
Key Players Advin Health Care, Akrus, Alcon, ANA MED, AR EL TIBBI URUNLER Turkey, BENQ Medical Technology, Bicakcilar Turkey, BiHealthcare, Ergo Tec, Frastema, Gladius Medical KFT, Howell Medical, Meditech, Merivaara, Ningbo Techart Medical Equipment, OPT SurgiSystems, Palakkad Surgical Industries, Seeuco Electronics Technology, Shree Hospital Equipments, Strongman Medline, Takara Belmont Corporation, TECHNOMED. TM Tigers, UFSK International OSYS, US Ophthalmic, Other Market Participants
Customization Scope Customization allows for the inclusion/modification of content pertaining to geographical regions, countries, and specific market segments.
Pricing & Procurement Options Explore purchase options tailored to your specific research requirements
Contact Details Consult With Our Expert

Japan (Toll-Free):  +81 663-386-8111

South Korea (Toll-Free):  +82-808- 703-126

Saudi Arabia (Toll-Free):  +966 800-850-1643

United Kingdom: +44 753-710-5080

United States: +1 302-232-5106

E-mail:  askanexpert@thenicheresearch.com


Global Ophthalmic Operating Tables Market Scope

By Product

  • Manual Operating Tables
  • Hydraulic Operating Tables
  • Electric Operating Tables
  • Electro-hydraulic Operating Tables

By End User

  • Hospitals
  • Eye Clinics
  • Academic & Research Institutes
  • Others

By Region

  • North America (U.S., Canada, Mexico, Rest of North America)
  • Europe (France, The UK, Spain, Germany, Italy, Nordic Countries (Denmark, Finland, Iceland, Sweden, Norway), Benelux Union (Belgium, The Netherlands, Luxembourg), Rest of Europe)
  • Asia Pacific (China, Japan, India, New Zealand, Australia, South Korea, Southeast Asia (Indonesia, Thailand, Malaysia, Singapore, Rest of Southeast Asia), Rest of Asia Pacific)
  • Middle East & Africa (Saudi Arabia, UAE, Egypt, Kuwait, South Africa, Rest of Middle East & Africa)
  • Latin America (Brazil, Argentina, Rest of Latin America)

Report Coverage

Table of Contents

.

1.Market Scope
1.1.Market Segmentation
1.2.Years Considered
1.2.1.Historic Years: 2016 – 2022
1.2.2.Base Year: 2023
1.2.3.Forecast Years: 2024 – 2034
2.Key Target Audiences
3.Research Methodology
3.1.Primary Research
3.1.1.Research Questionnaire
3.1.2.Global Percentage Breakdown
3.1.3.Primary Interviews: Key Opinion Leaders (KOLs)
3.2.Secondary Research
3.2.1.Paid Databases
3.2.2.Secondary Sources
3.3.Market Size Estimates
3.3.1.Top-Down Approach
3.3.2.Bottom-Up Approach
3.4.Data Triangulation Methodology
3.5.Research Assumptions
4.Recommendations and Insights from TNR’s Perspective**
5.Holistic Overview of Ophthalmic Operating Tables Market
6.Market Synopsis: Ophthalmic Operating Tables Market
7.Ophthalmic Operating Tables Market Analysis: Qualitative Perspective
7.1.Introduction
7.1.1.Product Definition
7.1.2.Industry Development
7.2.Market Dynamics
7.2.1.Drivers
7.2.2.Restraints
7.2.3.Opportunities
7.2.4.Challenges
7.3.Trends in Ophthalmic Operating Tables Market
7.4.Market Determinants Radar Chart
7.5.Macro-Economic and Micro-Economic Indicators: Ophthalmic Operating Tables Market
7.6.Industry Gross Margin Overview
7.7.Porter’s Five Force Analysis
7.8.Impact of Covid-19 on Ophthalmic Operating Tables Market
7.9.PESTEL Analysis
7.10.Value Chain Analysis
7.11.Pricing Analysis, By Region (2023)
7.11.1.North America
7.11.2.Europe
7.11.3.Asia Pacific
7.11.4.Middle East and Africa
7.11.5.Latin America
8.Global Ophthalmic Operating Tables Market Analysis and Forecasts, 2024 – 2034
8.1.Overview
8.1.1.Global Ophthalmic Operating Tables Market Revenue (US$ Mn)
8.2.Global Ophthalmic Operating Tables Market Revenue (US$ Mn) and Forecasts, By Product
8.2.1.Manual Operating Tables
8.2.1.1.Definition
8.2.1.2.Market Estimation and Penetration, 2016 – 2023
8.2.1.3.Market Forecast, 2024 – 2034
8.2.1.4.Compound Annual Growth Rate (CAGR)
8.2.1.5.Regional Bifurcation
8.2.1.5.1.North America
8.2.1.5.1.1.Market Estimation, 2016 – 2023
8.2.1.5.1.2.Market Forecast, 2024 – 2034
8.2.1.5.2.Europe
8.2.1.5.2.1.Market Estimation, 2016 – 2023
8.2.1.5.2.2.Market Forecast, 2024 – 2034
8.2.1.5.3.Asia Pacific
8.2.1.5.3.1.Market Estimation, 2016 – 2023
8.2.1.5.3.2.Market Forecast, 2024 – 2034
8.2.1.5.4.Middle East and Africa
8.2.1.5.4.1.Market Estimation, 2016 – 2023
8.2.1.5.4.2.Market Forecast, 2024 – 2034
8.2.1.5.5.Latin America
8.2.1.5.5.1.Market Estimation, 2016 – 2023
8.2.1.5.5.2.Market Forecast, 2024 – 2034
8.2.2.Hydraulic Operating Tables
8.2.2.1.Definition
8.2.2.2.Market Estimation and Penetration, 2016 – 2023
8.2.2.3.Market Forecast, 2024 – 2034
8.2.2.4.Compound Annual Growth Rate (CAGR)
8.2.2.5.Regional Bifurcation
8.2.2.5.1.North America
8.2.2.5.1.1.Market Estimation, 2016 – 2023
8.2.2.5.1.2.Market Forecast, 2024 – 2034
8.2.2.5.2.Europe
8.2.2.5.2.1.Market Estimation, 2016 – 2023
8.2.2.5.2.2.Market Forecast, 2024 – 2034
8.2.2.5.3.Asia Pacific
8.2.2.5.3.1.Market Estimation, 2016 – 2023
8.2.2.5.3.2.Market Forecast, 2024 – 2034
8.2.2.5.4.Middle East and Africa
8.2.2.5.4.1.Market Estimation, 2016 – 2023
8.2.2.5.4.2.Market Forecast, 2024 – 2034
8.2.2.5.5.Latin America
8.2.2.5.5.1.Market Estimation, 2016 – 2023
8.2.2.5.5.2.Market Forecast, 2024 – 2034
8.2.3.Electric Operating Tables
8.2.3.1.Definition
8.2.3.2.Market Estimation and Penetration, 2016 – 2023
8.2.3.3.Market Forecast, 2024 – 2034
8.2.3.4.Compound Annual Growth Rate (CAGR)
8.2.3.5.Regional Bifurcation
8.2.3.5.1.North America
8.2.3.5.1.1.Market Estimation, 2016 – 2023
8.2.3.5.1.2.Market Forecast, 2024 – 2034
8.2.3.5.2.Europe
8.2.3.5.2.1.Market Estimation, 2016 – 2023
8.2.3.5.2.2.Market Forecast, 2024 – 2034
8.2.3.5.3.Asia Pacific
8.2.3.5.3.1.Market Estimation, 2016 – 2023
8.2.3.5.3.2.Market Forecast, 2024 – 2034
8.2.3.5.4.Middle East and Africa
8.2.3.5.4.1.Market Estimation, 2016 – 2023
8.2.3.5.4.2.Market Forecast, 2024 – 2034
8.2.3.5.5.Latin America
8.2.3.5.5.1.Market Estimation, 2016 – 2023
8.2.3.5.5.2.Market Forecast, 2024 – 2034
8.2.4.Electro-hydraulic Operating Tables
8.2.4.1.Definition
8.2.4.2.Market Estimation and Penetration, 2016 – 2023
8.2.4.3.Market Forecast, 2024 – 2034
8.2.4.4.Compound Annual Growth Rate (CAGR)
8.2.4.5.Regional Bifurcation
8.2.4.5.1.North America
8.2.4.5.1.1.Market Estimation, 2016 – 2023
8.2.4.5.1.2.Market Forecast, 2024 – 2034
8.2.4.5.2.Europe
8.2.4.5.2.1.Market Estimation, 2016 – 2023
8.2.4.5.2.2.Market Forecast, 2024 – 2034
8.2.4.5.3.Asia Pacific
8.2.4.5.3.1.Market Estimation, 2016 – 2023
8.2.4.5.3.2.Market Forecast, 2024 – 2034
8.2.4.5.4.Middle East and Africa
8.2.4.5.4.1.Market Estimation, 2016 – 2023
8.2.4.5.4.2.Market Forecast, 2024 – 2034
8.2.4.5.5.Latin America
8.2.4.5.5.1.Market Estimation, 2016 – 2023
8.2.4.5.5.2.Market Forecast, 2024 – 2034
8.3.Key Segment for Channeling Investments
8.3.1.By Product
9.Global Ophthalmic Operating Tables Market Analysis and Forecasts, 2024 – 2034
9.1.Overview
9.2.Global Ophthalmic Operating Tables Market Revenue (US$ Mn) and Forecasts, By End User
9.2.1.Hospitals
9.2.1.1.Definition
9.2.1.2.Market Estimation and Penetration, 2016 – 2023
9.2.1.3.Market Forecast, 2024 – 2034
9.2.1.4.Compound Annual Growth Rate (CAGR)
9.2.1.5.Regional Bifurcation
9.2.1.5.1.North America
9.2.1.5.1.1.Market Estimation, 2016 – 2023
9.2.1.5.1.2.Market Forecast, 2024 – 2034
9.2.1.5.2.Europe
9.2.1.5.2.1.Market Estimation, 2016 – 2023
9.2.1.5.2.2.Market Forecast, 2024 – 2034
9.2.1.5.3.Asia Pacific
9.2.1.5.3.1.Market Estimation, 2016 – 2023
9.2.1.5.3.2.Market Forecast, 2024 – 2034
9.2.1.5.4.Middle East and Africa
9.2.1.5.4.1.Market Estimation, 2016 – 2023
9.2.1.5.4.2.Market Forecast, 2024 – 2034
9.2.1.5.5.Latin America
9.2.1.5.5.1.Market Estimation, 2016 – 2023
9.2.1.5.5.2.Market Forecast, 2024 – 2034
9.2.2.Eye Clinics
9.2.2.1.Definition
9.2.2.2.Market Estimation and Penetration, 2016 – 2023
9.2.2.3.Market Forecast, 2024 – 2034
9.2.2.4.Compound Annual Growth Rate (CAGR)
9.2.2.5.Regional Bifurcation
9.2.2.5.1.North America
9.2.2.5.1.1.Market Estimation, 2016 – 2023
9.2.2.5.1.2.Market Forecast, 2024 – 2034
9.2.2.5.2.Europe
9.2.2.5.2.1.Market Estimation, 2016 – 2023
9.2.2.5.2.2.Market Forecast, 2024 – 2034
9.2.2.5.3.Asia Pacific
9.2.2.5.3.1.Market Estimation, 2016 – 2023
9.2.2.5.3.2.Market Forecast, 2024 – 2034
9.2.2.5.4.Middle East and Africa
9.2.2.5.4.1.Market Estimation, 2016 – 2023
9.2.2.5.4.2.Market Forecast, 2024 – 2034
9.2.2.5.5.Latin America
9.2.2.5.5.1.Market Estimation, 2016 – 2023
9.2.2.5.5.2.Market Forecast, 2024 – 2034
9.2.3.Academic and Research Institutes
9.2.3.1.Definition
9.2.3.2.Market Estimation and Penetration, 2016 – 2023
9.2.3.3.Market Forecast, 2024 – 2034
9.2.3.4.Compound Annual Growth Rate (CAGR)
9.2.3.5.Regional Bifurcation
9.2.3.5.1.North America
9.2.3.5.1.1.Market Estimation, 2016 – 2023
9.2.3.5.1.2.Market Forecast, 2024 – 2034
9.2.3.5.2.Europe
9.2.3.5.2.1.Market Estimation, 2016 – 2023
9.2.3.5.2.2.Market Forecast, 2024 – 2034
9.2.3.5.3.Asia Pacific
9.2.3.5.3.1.Market Estimation, 2016 – 2023
9.2.3.5.3.2.Market Forecast, 2024 – 2034
9.2.3.5.4.Middle East and Africa
9.2.3.5.4.1.Market Estimation, 2016 – 2023
9.2.3.5.4.2.Market Forecast, 2024 – 2034
9.2.3.5.5.Latin America
9.2.3.5.5.1.Market Estimation, 2016 – 2023
9.2.3.5.5.2.Market Forecast, 2024 – 2034
9.2.4.Others
9.2.4.1.Definition
9.2.4.2.Market Estimation and Penetration, 2016 – 2023
9.2.4.3.Market Forecast, 2024 – 2034
9.2.4.4.Compound Annual Growth Rate (CAGR)
9.2.4.5.Regional Bifurcation
9.2.4.5.1.North America
9.2.4.5.1.1.Market Estimation, 2016 – 2023
9.2.4.5.1.2.Market Forecast, 2024 – 2034
9.2.4.5.2.Europe
9.2.4.5.2.1.Market Estimation, 2016 – 2023
9.2.4.5.2.2.Market Forecast, 2024 – 2034
9.2.4.5.3.Asia Pacific
9.2.4.5.3.1.Market Estimation, 2016 – 2023
9.2.4.5.3.2.Market Forecast, 2024 – 2034
9.2.4.5.4.Middle East and Africa
9.2.4.5.4.1.Market Estimation, 2016 – 2023
9.2.4.5.4.2.Market Forecast, 2024 – 2034
9.2.4.5.5.Latin America
9.2.4.5.5.1.Market Estimation, 2016 – 2023
9.2.4.5.5.2.Market Forecast, 2024 – 2034
9.3.Key Segment for Channeling Investments
9.3.1.By End User
10.North America Ophthalmic Operating Tables Market Analysis and Forecasts, 2024 – 2034
10.1.Overview
10.1.1.North America Ophthalmic Operating Tables Market Revenue (US$ Mn)
10.2.North America Ophthalmic Operating Tables Market Revenue (US$ Mn) and Forecasts, By Product
10.2.1.Manual Operating Tables
10.2.2.Hydraulic Operating Tables
10.2.3.Electric Operating Tables
10.2.4.Electro-hydraulic Operating Tables
10.3.North America Ophthalmic Operating Tables Market Revenue (US$ Mn) and Forecasts, By End User
10.3.1.Hospitals
10.3.2.Eye Clinics
10.3.3.Academic and Research Institutes
10.3.4.Others
10.4.North America Ophthalmic Operating Tables Market Revenue (US$ Mn) and Forecasts, By Country
10.4.1.U.S
10.4.1.1.U.S Ophthalmic Operating Tables Market Revenue (US$ Mn) and Forecasts, By Product
10.4.1.1.1.Manual Operating Tables
10.4.1.1.2.Hydraulic Operating Tables
10.4.1.1.3.Electric Operating Tables
10.4.1.1.4.Electro-hydraulic Operating Tables
10.4.1.2.U.S Ophthalmic Operating Tables Market Revenue (US$ Mn) and Forecasts, By End User
10.4.1.2.1.Hospitals
10.4.1.2.2.Eye Clinics
10.4.1.2.3.Academic and Research Institutes
10.4.1.2.4.Others
10.4.2.Canada
10.4.2.1.Canada Ophthalmic Operating Tables Market Revenue (US$ Mn) and Forecasts, By Product
10.4.2.1.1.Manual Operating Tables
10.4.2.1.2.Hydraulic Operating Tables
10.4.2.1.3.Electric Operating Tables
10.4.2.1.4.Electro-hydraulic Operating Tables
10.4.2.2.Canada Ophthalmic Operating Tables Market Revenue (US$ Mn) and Forecasts, By End User
10.4.2.2.1.Hospitals
10.4.2.2.2.Eye Clinics
10.4.2.2.3.Academic and Research Institutes
10.4.2.2.4.Others
10.4.3.Mexico
10.4.3.1.Mexico Ophthalmic Operating Tables Market Revenue (US$ Mn) and Forecasts, By Product
10.4.3.1.1.Manual Operating Tables
10.4.3.1.2.Hydraulic Operating Tables
10.4.3.1.3.Electric Operating Tables
10.4.3.1.4.Electro-hydraulic Operating Tables
10.4.3.2.Mexico Ophthalmic Operating Tables Market Revenue (US$ Mn) and Forecasts, By End User
10.4.3.2.1.Hospitals
10.4.3.2.2.Eye Clinics
10.4.3.2.3.Academic and Research Institutes
10.4.3.2.4.Others
10.4.4.Rest of North America
10.4.4.1.Rest of North America Ophthalmic Operating Tables Market Revenue (US$ Mn) and Forecasts, By Product
10.4.4.1.1.Manual Operating Tables
10.4.4.1.2.Hydraulic Operating Tables
10.4.4.1.3.Electric Operating Tables
10.4.4.1.4.Electro-hydraulic Operating Tables
10.4.4.2.Rest of North America Ophthalmic Operating Tables Market Revenue (US$ Mn) and Forecasts, By End User
10.4.4.2.1.Hospitals
10.4.4.2.2.Eye Clinics
10.4.4.2.3.Academic and Research Institutes
10.4.4.2.4.Others
10.5.Key Segment for Channeling Investments
10.5.1.By Country
10.5.2.By Product
10.5.3.By End User
11.Europe Ophthalmic Operating Tables Market Analysis and Forecasts, 2024 – 2034
11.1.Overview
11.1.1.Europe Ophthalmic Operating Tables Market Revenue (US$ Mn)
11.2.Europe Ophthalmic Operating Tables Market Revenue (US$ Mn) and Forecasts, By Product
11.2.1.Manual Operating Tables
11.2.2.Hydraulic Operating Tables
11.2.3.Electric Operating Tables
11.2.4.Electro-hydraulic Operating Tables
11.3.Europe Ophthalmic Operating Tables Market Revenue (US$ Mn) and Forecasts, By End User
11.3.1.Hospitals
11.3.2.Eye Clinics
11.3.3.Academic and Research Institutes
11.3.4.Others
11.4.Europe Ophthalmic Operating Tables Market Revenue (US$ Mn) and Forecasts, By Country
11.4.1.France
11.4.1.1.France Ophthalmic Operating Tables Market Revenue (US$ Mn) and Forecasts, By Product
11.4.1.1.1.Manual Operating Tables
11.4.1.1.2.Hydraulic Operating Tables
11.4.1.1.3.Electric Operating Tables
11.4.1.1.4.Electro-hydraulic Operating Tables
11.4.1.2.France Ophthalmic Operating Tables Market Revenue (US$ Mn) and Forecasts, By End User
11.4.1.2.1.Hospitals
11.4.1.2.2.Eye Clinics
11.4.1.2.3.Academic and Research Institutes
11.4.1.2.4.Others
11.4.2.The UK
11.4.2.1.The UK Ophthalmic Operating Tables Market Revenue (US$ Mn) and Forecasts, By Product
11.4.2.1.1.Manual Operating Tables
11.4.2.1.2.Hydraulic Operating Tables
11.4.2.1.3.Electric Operating Tables
11.4.2.1.4.Electro-hydraulic Operating Tables
11.4.2.2.The UK Ophthalmic Operating Tables Market Revenue (US$ Mn) and Forecasts, By End User
11.4.2.2.1.Hospitals
11.4.2.2.2.Eye Clinics
11.4.2.2.3.Academic and Research Institutes
11.4.2.2.4.Others
11.4.3.Spain
11.4.3.1.Spain Ophthalmic Operating Tables Market Revenue (US$ Mn) and Forecasts, By Product
11.4.3.1.1.Manual Operating Tables
11.4.3.1.2.Hydraulic Operating Tables
11.4.3.1.3.Electric Operating Tables
11.4.3.1.4.Electro-hydraulic Operating Tables
11.4.3.2.Spain Ophthalmic Operating Tables Market Revenue (US$ Mn) and Forecasts, By End User
11.4.3.2.1.Hospitals
11.4.3.2.2.Eye Clinics
11.4.3.2.3.Academic and Research Institutes
11.4.3.2.4.Others
11.4.4.Germany
11.4.4.1.Germany Ophthalmic Operating Tables Market Revenue (US$ Mn) and Forecasts, By Product
11.4.4.1.1.Manual Operating Tables
11.4.4.1.2.Hydraulic Operating Tables
11.4.4.1.3.Electric Operating Tables
11.4.4.1.4.Electro-hydraulic Operating Tables
11.4.4.2.Germany Ophthalmic Operating Tables Market Revenue (US$ Mn) and Forecasts, By End User
11.4.4.2.1.Hospitals
11.4.4.2.2.Eye Clinics
11.4.4.2.3.Academic and Research Institutes
11.4.4.2.4.Others
11.4.5.Italy
11.4.5.1.Italy Ophthalmic Operating Tables Market Revenue (US$ Mn) and Forecasts, By Product
11.4.5.1.1.Manual Operating Tables
11.4.5.1.2.Hydraulic Operating Tables
11.4.5.1.3.Electric Operating Tables
11.4.5.1.4.Electro-hydraulic Operating Tables
11.4.5.2.Italy Ophthalmic Operating Tables Market Revenue (US$ Mn) and Forecasts, By End User
11.4.5.2.1.Hospitals
11.4.5.2.2.Eye Clinics
11.4.5.2.3.Academic and Research Institutes
11.4.5.2.4.Others
11.4.6.Nordic Countries
11.4.6.1.Nordic Countries Ophthalmic Operating Tables Market Revenue (US$ Mn) and Forecasts, By Product
11.4.6.1.1.Manual Operating Tables
11.4.6.1.2.Hydraulic Operating Tables
11.4.6.1.3.Electric Operating Tables
11.4.6.1.4.Electro-hydraulic Operating Tables
11.4.6.2.Nordic Countries Ophthalmic Operating Tables Market Revenue (US$ Mn) and Forecasts, By End User
11.4.6.2.1.Hospitals
11.4.6.2.2.Eye Clinics
11.4.6.2.3.Academic and Research Institutes
11.4.6.2.4.Others
11.4.6.3.Nordic Countries Ophthalmic Operating Tables Market Revenue (US$ Mn) and Forecasts, By Country
11.4.6.3.1.Denmark
11.4.6.3.2.Finland
11.4.6.3.3.Iceland
11.4.6.3.4.Sweden
11.4.6.3.5.Norway
11.4.7.Benelux Union
11.4.7.1.Benelux Union Ophthalmic Operating Tables Market Revenue (US$ Mn) and Forecasts, By Product
11.4.7.1.1.Manual Operating Tables
11.4.7.1.2.Hydraulic Operating Tables
11.4.7.1.3.Electric Operating Tables
11.4.7.1.4.Electro-hydraulic Operating Tables
11.4.7.2.Benelux Union Ophthalmic Operating Tables Market Revenue (US$ Mn) and Forecasts, By End User
11.4.7.2.1.Hospitals
11.4.7.2.2.Eye Clinics
11.4.7.2.3.Academic and Research Institutes
11.4.7.2.4.Others
11.4.7.3.Benelux Union Ophthalmic Operating Tables Market Revenue (US$ Mn) and Forecasts, By Country
11.4.7.3.1.Belgium
11.4.7.3.2.The Netherlands
11.4.7.3.3.Luxembourg
11.4.8.Rest of Europe
11.4.8.1.Rest of Europe Ophthalmic Operating Tables Market Revenue (US$ Mn) and Forecasts, By Product
11.4.8.1.1.Manual Operating Tables
11.4.8.1.2.Hydraulic Operating Tables
11.4.8.1.3.Electric Operating Tables
11.4.8.1.4.Electro-hydraulic Operating Tables
11.4.8.2.Rest of Europe Ophthalmic Operating Tables Market Revenue (US$ Mn) and Forecasts, By End User
11.4.8.2.1.Hospitals
11.4.8.2.2.Eye Clinics
11.4.8.2.3.Academic and Research Institutes
11.4.8.2.4.Others
11.5.Key Segment for Channeling Investments
11.5.1.By Country
11.5.2.By Product
11.5.3.By End User
12.Asia Pacific Ophthalmic Operating Tables Market Analysis and Forecasts, 2024 – 2034
12.1.Overview
12.1.1.Asia Pacific Ophthalmic Operating Tables Market Revenue (US$ Mn)
12.2.Asia Pacific Ophthalmic Operating Tables Market Revenue (US$ Mn) and Forecasts, By Product
12.2.1.Manual Operating Tables
12.2.2.Hydraulic Operating Tables
12.2.3.Electric Operating Tables
12.2.4.Electro-hydraulic Operating Tables
12.3.Asia Pacific Ophthalmic Operating Tables Market Revenue (US$ Mn) and Forecasts, By End User
12.3.1.Hospitals
12.3.2.Eye Clinics
12.3.3.Academic and Research Institutes
12.3.4.Others
12.4.Asia Pacific Ophthalmic Operating Tables Market Revenue (US$ Mn) and Forecasts, By Country
12.4.1.China
12.4.1.1.China Ophthalmic Operating Tables Market Revenue (US$ Mn) and Forecasts, By Product
12.4.1.1.1.Manual Operating Tables
12.4.1.1.2.Hydraulic Operating Tables
12.4.1.1.3.Electric Operating Tables
12.4.1.1.4.Electro-hydraulic Operating Tables
12.4.1.2.China Ophthalmic Operating Tables Market Revenue (US$ Mn) and Forecasts, By End User
12.4.1.2.1.Hospitals
12.4.1.2.2.Eye Clinics
12.4.1.2.3.Academic and Research Institutes
12.4.1.2.4.Others
12.4.2.Japan
12.4.2.1.Japan Ophthalmic Operating Tables Market Revenue (US$ Mn) and Forecasts, By Product
12.4.2.1.1.Manual Operating Tables
12.4.2.1.2.Hydraulic Operating Tables
12.4.2.1.3.Electric Operating Tables
12.4.2.1.4.Electro-hydraulic Operating Tables
12.4.2.2.Japan Ophthalmic Operating Tables Market Revenue (US$ Mn) and Forecasts, By End User
12.4.2.2.1.Hospitals
12.4.2.2.2.Eye Clinics
12.4.2.2.3.Academic and Research Institutes
12.4.2.2.4.Others
12.4.3.India
12.4.3.1.India Ophthalmic Operating Tables Market Revenue (US$ Mn) and Forecasts, By Product
12.4.3.1.1.Manual Operating Tables
12.4.3.1.2.Hydraulic Operating Tables
12.4.3.1.3.Electric Operating Tables
12.4.3.1.4.Electro-hydraulic Operating Tables
12.4.3.2.India Ophthalmic Operating Tables Market Revenue (US$ Mn) and Forecasts, By End User
12.4.3.2.1.Hospitals
12.4.3.2.2.Eye Clinics
12.4.3.2.3.Academic and Research Institutes
12.4.3.2.4.Others
12.4.4.New Zealand
12.4.4.1.New Zealand Ophthalmic Operating Tables Market Revenue (US$ Mn) and Forecasts, By Product
12.4.4.1.1.Manual Operating Tables
12.4.4.1.2.Hydraulic Operating Tables
12.4.4.1.3.Electric Operating Tables
12.4.4.1.4.Electro-hydraulic Operating Tables
12.4.4.2.New Zealand Ophthalmic Operating Tables Market Revenue (US$ Mn) and Forecasts, By End User
12.4.4.2.1.Hospitals
12.4.4.2.2.Eye Clinics
12.4.4.2.3.Academic and Research Institutes
12.4.4.2.4.Others
12.4.5.Australia
12.4.5.1.Australia Ophthalmic Operating Tables Market Revenue (US$ Mn) and Forecasts, By Product
12.4.5.1.1.Manual Operating Tables
12.4.5.1.2.Hydraulic Operating Tables
12.4.5.1.3.Electric Operating Tables
12.4.5.1.4.Electro-hydraulic Operating Tables
12.4.5.2.Australia Ophthalmic Operating Tables Market Revenue (US$ Mn) and Forecasts, By End User
12.4.5.2.1.Hospitals
12.4.5.2.2.Eye Clinics
12.4.5.2.3.Academic and Research Institutes
12.4.5.2.4.Others
12.4.6.South Korea
12.4.6.1.South Korea Ophthalmic Operating Tables Market Revenue (US$ Mn) and Forecasts, By Product
12.4.6.1.1.Manual Operating Tables
12.4.6.1.2.Hydraulic Operating Tables
12.4.6.1.3.Electric Operating Tables
12.4.6.1.4.Electro-hydraulic Operating Tables
12.4.6.2.South Korea Ophthalmic Operating Tables Market Revenue (US$ Mn) and Forecasts, By End User
12.4.6.2.1.Hospitals
12.4.6.2.2.Eye Clinics
12.4.6.2.3.Academic and Research Institutes
12.4.6.2.4.Others
12.4.7.Southeast Asia
12.4.7.1.Southeast Asia Ophthalmic Operating Tables Market Revenue (US$ Mn) and Forecasts, By Product
12.4.7.1.1.Manual Operating Tables
12.4.7.1.2.Hydraulic Operating Tables
12.4.7.1.3.Electric Operating Tables
12.4.7.1.4.Electro-hydraulic Operating Tables
12.4.7.2.Southeast Asia Ophthalmic Operating Tables Market Revenue (US$ Mn) and Forecasts, By End User
12.4.7.2.1.Hospitals
12.4.7.2.2.Eye Clinics
12.4.7.2.3.Academic and Research Institutes
12.4.7.2.4.Others
12.4.7.3.Southeast Asia Ophthalmic Operating Tables Market Revenue (US$ Mn) and Forecasts, By Country
12.4.7.3.1.Indonesia
12.4.7.3.2.Thailand
12.4.7.3.3.Malaysia
12.4.7.3.4.Singapore
12.4.7.3.5.Rest of Southeast Asia
12.4.8.Rest of Asia Pacific
12.4.8.1.Rest of Asia Pacific Ophthalmic Operating Tables Market Revenue (US$ Mn) and Forecasts, By Product
12.4.8.1.1.Manual Operating Tables
12.4.8.1.2.Hydraulic Operating Tables
12.4.8.1.3.Electric Operating Tables
12.4.8.1.4.Electro-hydraulic Operating Tables
12.4.8.2.Rest of Asia Pacific Ophthalmic Operating Tables Market Revenue (US$ Mn) and Forecasts, By End User
12.4.8.2.1.Hospitals
12.4.8.2.2.Eye Clinics
12.4.8.2.3.Academic and Research Institutes
12.4.8.2.4.Others
12.5.Key Segment for Channeling Investments
12.5.1.By Country
12.5.2.By Product
12.5.3.By End User
13.Middle East and Africa Ophthalmic Operating Tables Market Analysis and Forecasts, 2024 – 2034
13.1.Overview
13.1.1.Middle East and Africa Ophthalmic Operating Tables Market Revenue (US$ Mn)
13.2.Middle East and Africa Ophthalmic Operating Tables Market Revenue (US$ Mn) and Forecasts, By Product
13.2.1.Manual Operating Tables
13.2.2.Hydraulic Operating Tables
13.2.3.Electric Operating Tables
13.2.4.Electro-hydraulic Operating Tables
13.3.Middle East and Africa Ophthalmic Operating Tables Market Revenue (US$ Mn) and Forecasts, By End User
13.3.1.Hospitals
13.3.2.Eye Clinics
13.3.3.Academic and Research Institutes
13.3.4.Others
13.4.Middle East and Africa Ophthalmic Operating Tables Market Revenue (US$ Mn) and Forecasts, By Country
13.4.1.Saudi Arabia
13.4.1.1.Saudi Arabia Ophthalmic Operating Tables Market Revenue (US$ Mn) and Forecasts, By Product
13.4.1.1.1.Manual Operating Tables
13.4.1.1.2.Hydraulic Operating Tables
13.4.1.1.3.Electric Operating Tables
13.4.1.1.4.Electro-hydraulic Operating Tables
13.4.1.2.Saudi Arabia Ophthalmic Operating Tables Market Revenue (US$ Mn) and Forecasts, By End User
13.4.1.2.1.Hospitals
13.4.1.2.2.Eye Clinics
13.4.1.2.3.Academic and Research Institutes
13.4.1.2.4.Others
13.4.2.UAE
13.4.2.1.UAE Ophthalmic Operating Tables Market Revenue (US$ Mn) and Forecasts, By Product
13.4.2.1.1.Manual Operating Tables
13.4.2.1.2.Hydraulic Operating Tables
13.4.2.1.3.Electric Operating Tables
13.4.2.1.4.Electro-hydraulic Operating Tables
13.4.2.2.UAE Ophthalmic Operating Tables Market Revenue (US$ Mn) and Forecasts, By End User
13.4.2.2.1.Hospitals
13.4.2.2.2.Eye Clinics
13.4.2.2.3.Academic and Research Institutes
13.4.2.2.4.Others
13.4.3.Egypt
13.4.3.1.Egypt Ophthalmic Operating Tables Market Revenue (US$ Mn) and Forecasts, By Product
13.4.3.1.1.Manual Operating Tables
13.4.3.1.2.Hydraulic Operating Tables
13.4.3.1.3.Electric Operating Tables
13.4.3.1.4.Electro-hydraulic Operating Tables
13.4.3.2.Egypt Ophthalmic Operating Tables Market Revenue (US$ Mn) and Forecasts, By End User
13.4.3.2.1.Hospitals
13.4.3.2.2.Eye Clinics
13.4.3.2.3.Academic and Research Institutes
13.4.3.2.4.Others
13.4.4.Kuwait
13.4.4.1.Kuwait Ophthalmic Operating Tables Market Revenue (US$ Mn) and Forecasts, By Product
13.4.4.1.1.Manual Operating Tables
13.4.4.1.2.Hydraulic Operating Tables
13.4.4.1.3.Electric Operating Tables
13.4.4.1.4.Electro-hydraulic Operating Tables
13.4.4.2.Kuwait Ophthalmic Operating Tables Market Revenue (US$ Mn) and Forecasts, By End User
13.4.4.2.1.Hospitals
13.4.4.2.2.Eye Clinics
13.4.4.2.3.Academic and Research Institutes
13.4.4.2.4.Others
13.4.5.South Africa
13.4.5.1.South Africa Ophthalmic Operating Tables Market Revenue (US$ Mn) and Forecasts, By Product
13.4.5.1.1.Manual Operating Tables
13.4.5.1.2.Hydraulic Operating Tables
13.4.5.1.3.Electric Operating Tables
13.4.5.1.4.Electro-hydraulic Operating Tables
13.4.5.2.South Africa Ophthalmic Operating Tables Market Revenue (US$ Mn) and Forecasts, By End User
13.4.5.2.1.Hospitals
13.4.5.2.2.Eye Clinics
13.4.5.2.3.Academic and Research Institutes
13.4.5.2.4.Others
13.4.6.Rest of Middle East & Africa
13.4.6.1.Rest of Middle East & Africa Ophthalmic Operating Tables Market Revenue (US$ Mn) and Forecasts, By Product
13.4.6.1.1.Manual Operating Tables
13.4.6.1.2.Hydraulic Operating Tables
13.4.6.1.3.Electric Operating Tables
13.4.6.1.4.Electro-hydraulic Operating Tables
13.4.6.2.Rest of Middle East & Africa Ophthalmic Operating Tables Market Revenue (US$ Mn) and Forecasts, By End User
13.4.6.2.1.Hospitals
13.4.6.2.2.Eye Clinics
13.4.6.2.3.Academic and Research Institutes
13.4.6.2.4.Others
13.5.Key Segment for Channeling Investments
13.5.1.By Country
13.5.2.By Product
13.5.3.By End User
14.Latin America Ophthalmic Operating Tables Market Analysis and Forecasts, 2024 – 2034
14.1.Overview
14.1.1.Latin America Ophthalmic Operating Tables Market Revenue (US$ Mn)
14.2.Latin America Ophthalmic Operating Tables Market Revenue (US$ Mn) and Forecasts, By Product
14.2.1.Manual Operating Tables
14.2.2.Hydraulic Operating Tables
14.2.3.Electric Operating Tables
14.2.4.Electro-hydraulic Operating Tables
14.3.Latin America Ophthalmic Operating Tables Market Revenue (US$ Mn) and Forecasts, By End User
14.3.1.Hospitals
14.3.2.Eye Clinics
14.3.3.Academic and Research Institutes
14.3.4.Others
14.4.Latin America Ophthalmic Operating Tables Market Revenue (US$ Mn) and Forecasts, By Country
14.4.1.Brazil
14.4.1.1.Brazil Ophthalmic Operating Tables Market Revenue (US$ Mn) and Forecasts, By Product
14.4.1.1.1.Manual Operating Tables
14.4.1.1.2.Hydraulic Operating Tables
14.4.1.1.3.Electric Operating Tables
14.4.1.1.4.Electro-hydraulic Operating Tables
14.4.1.2.Brazil Ophthalmic Operating Tables Market Revenue (US$ Mn) and Forecasts, By End User
14.4.1.2.1.Hospitals
14.4.1.2.2.Eye Clinics
14.4.1.2.3.Academic and Research Institutes
14.4.1.2.4.Others
14.4.2.Argentina
14.4.2.1.Argentina Ophthalmic Operating Tables Market Revenue (US$ Mn) and Forecasts, By Product
14.4.2.1.1.Manual Operating Tables
14.4.2.1.2.Hydraulic Operating Tables
14.4.2.1.3.Electric Operating Tables
14.4.2.1.4.Electro-hydraulic Operating Tables
14.4.2.2.Argentina Ophthalmic Operating Tables Market Revenue (US$ Mn) and Forecasts, By End User
14.4.2.2.1.Hospitals
14.4.2.2.2.Eye Clinics
14.4.2.2.3.Academic and Research Institutes
14.4.2.2.4.Others
14.4.3.Rest of Latin America
14.4.3.1.Rest of Latin America Ophthalmic Operating Tables Market Revenue (US$ Mn) and Forecasts, By Product
14.4.3.1.1.Manual Operating Tables
14.4.3.1.2.Hydraulic Operating Tables
14.4.3.1.3.Electric Operating Tables
14.4.3.1.4.Electro-hydraulic Operating Tables
14.4.3.2.Rest of Latin America Ophthalmic Operating Tables Market Revenue (US$ Mn) and Forecasts, By End User
14.4.3.2.1.Hospitals
14.4.3.2.2.Eye Clinics
14.4.3.2.3.Academic and Research Institutes
14.4.3.2.4.Others
14.5.Key Segment for Channeling Investments
14.5.1.By Country
14.5.2.By Product
14.5.3.By End User
15.Competitive Benchmarking
15.1.Brand Benchmarking
15.2.Market Share Analysis, 2023
15.3.Global Presence and Growth Strategies
15.3.1.Mergers and Acquisitions
15.3.2.Product Launches
15.3.3.Investments Trends
15.3.4.R&D Initiatives
16.Player Profiles
16.1.Advin Health Care
16.1.1.Company Details
16.1.2.Company Overview
16.1.3.Product Offerings
16.1.4.Key Developments
16.1.5.Financial Analysis
16.1.6.SWOT Analysis
16.1.7.Business Strategies
16.2.Akrus
16.2.1.Company Details
16.2.2.Company Overview
16.2.3.Product Offerings
16.2.4.Key Developments
16.2.5.Financial Analysis
16.2.6.SWOT Analysis
16.2.7.Business Strategies
16.3.Alcon
16.3.1.Company Details
16.3.2.Company Overview
16.3.3.Product Offerings
16.3.4.Key Developments
16.3.5.Financial Analysis
16.3.6.SWOT Analysis
16.3.7.Business Strategies
16.4.ANA MED
16.4.1.Company Details
16.4.2.Company Overview
16.4.3.Product Offerings
16.4.4.Key Developments
16.4.5.Financial Analysis
16.4.6.SWOT Analysis
16.4.7.Business Strategies
16.5.AR EL TIBBI URUNLER
16.5.1.Company Details
16.5.2.Company Overview
16.5.3.Product Offerings
16.5.4.Key Developments
16.5.5.Financial Analysis
16.5.6.SWOT Analysis
16.5.7.Business Strategies
16.6.BENQ Medical Technology
16.6.1.Company Details
16.6.2.Company Overview
16.6.3.Product Offerings
16.6.4.Key Developments
16.6.5.Financial Analysis
16.6.6.SWOT Analysis
16.6.7.Business Strategies
16.7.Bicakcilar Turkey
16.7.1.Company Details
16.7.2.Company Overview
16.7.3.Product Offerings
16.7.4.Key Developments
16.7.5.Financial Analysis
16.7.6.SWOT Analysis
16.7.7.Business Strategies
16.8.BiHealthcare
16.8.1.Company Details
16.8.2.Company Overview
16.8.3.Product Offerings
16.8.4.Key Developments
16.8.5.Financial Analysis
16.8.6.SWOT Analysis
16.8.7.Business Strategies
16.9.Ergo Tec
16.9.1.Company Details
16.9.2.Company Overview
16.9.3.Product Offerings
16.9.4.Key Developments
16.9.5.Financial Analysis
16.9.6.SWOT Analysis
16.9.7.Business Strategies
16.10.Frastema
16.10.1.Company Details
16.10.2.Company Overview
16.10.3.Product Offerings
16.10.4.Key Developments
16.10.5.Financial Analysis
16.10.6.SWOT Analysis
16.10.7.Business Strategies
16.11.Gladius Medical KFT
16.11.1.Company Details
16.11.2.Company Overview
16.11.3.Product Offerings
16.11.4.Key Developments
16.11.5.Financial Analysis
16.11.6.SWOT Analysis
16.11.7.Business Strategies
16.12.Howell Medical
16.12.1.Company Details
16.12.2.Company Overview
16.12.3.Product Offerings
16.12.4.Key Developments
16.12.5.Financial Analysis
16.12.6.SWOT Analysis
16.12.7.Business Strategies
16.13.Meditech
16.13.1.Company Details
16.13.2.Company Overview
16.13.3.Product Offerings
16.13.4.Key Developments
16.13.5.Financial Analysis
16.13.6.SWOT Analysis
16.13.7.Business Strategies
16.14.Merivaara
16.14.1.Company Details
16.14.2.Company Overview
16.14.3.Product Offerings
16.14.4.Key Developments
16.14.5.Financial Analysis
16.14.6.SWOT Analysis
16.14.7.Business Strategies
16.15.Ningbo Techart Medical Equipment
16.15.1.Company Details
16.15.2.Company Overview
16.15.3.Product Offerings
16.15.4.Key Developments
16.15.5.Financial Analysis
16.15.6.SWOT Analysis
16.15.7.Business Strategies
16.16.OPT SurgiSystems
16.16.1.Company Details
16.16.2.Company Overview
16.16.3.Product Offerings
16.16.4.Key Developments
16.16.5.Financial Analysis
16.16.6.SWOT Analysis
16.16.7.Business Strategies
16.17.Palakkad Surgical Industries
16.17.1.Company Details
16.17.2.Company Overview
16.17.3.Product Offerings
16.17.4.Key Developments
16.17.5.Financial Analysis
16.17.6.SWOT Analysis
16.17.7.Business Strategies
16.18.Seeuco Electronics Technology
16.18.1.Company Details
16.18.2.Company Overview
16.18.3.Product Offerings
16.18.4.Key Developments
16.18.5.Financial Analysis
16.18.6.SWOT Analysis
16.18.7.Business Strategies
16.19.Shree Hospital Equipments
16.19.1.Company Details
16.19.2.Company Overview
16.19.3.Product Offerings
16.19.4.Key Developments
16.19.5.Financial Analysis
16.19.6.SWOT Analysis
16.19.7.Business Strategies
16.20.Strongman Medline
16.20.1.Company Details
16.20.2.Company Overview
16.20.3.Product Offerings
16.20.4.Key Developments
16.20.5.Financial Analysis
16.20.6.SWOT Analysis
16.20.7.Business Strategies
16.21.Takara Belmont Corporation
16.21.1.Company Details
16.21.2.Company Overview
16.21.3.Product Offerings
16.21.4.Key Developments
16.21.5.Financial Analysis
16.21.6.SWOT Analysis
16.21.7.Business Strategies
16.22.TECHNOMED
16.22.1.Company Details
16.22.2.Company Overview
16.22.3.Product Offerings
16.22.4.Key Developments
16.22.5.Financial Analysis
16.22.6.SWOT Analysis
16.22.7.Business Strategies
16.23.TM Tigers
16.23.1.Company Details
16.23.2.Company Overview
16.23.3.Product Offerings
16.23.4.Key Developments
16.23.5.Financial Analysis
16.23.6.SWOT Analysis
16.23.7.Business Strategies
16.24.UFSK International OSYS
16.24.1.Company Details
16.24.2.Company Overview
16.24.3.Product Offerings
16.24.4.Key Developments
16.24.5.Financial Analysis
16.24.6.SWOT Analysis
16.24.7.Business Strategies
16.25.US Ophthalmic
16.25.1.Company Details
16.25.2.Company Overview
16.25.3.Product Offerings
16.25.4.Key Developments
16.25.5.Financial Analysis
16.25.6.SWOT Analysis
16.25.7.Business Strategies
16.26.Other Industry Participants
17.Key Findings

.

Note: This ToC is tentative and can be changed according to the research study conducted during the course of report completion.

.

**Exclusive for Multi-User and Enterprise User.

Global Ophthalmic Operating Tables Market

By Product

  • Manual Operating Tables
  • Hydraulic Operating Tables
  • Electric Operating Tables
  • Electro-hydraulic Operating Tables

By End User

  • Hospitals
  • Eye Clinics
  • Academic & Research Institutes
  • Others

By Region

  • North America (U.S., Canada, Mexico, Rest of North America)
  • Europe (France, The UK, Spain, Germany, Italy, Nordic Countries (Denmark, Finland, Iceland, Sweden, Norway), Benelux Union (Belgium, The Netherlands, Luxembourg), Rest of Europe)
  • Asia Pacific (China, Japan, India, New Zealand, Australia, South Korea, Southeast Asia (Indonesia, Thailand, Malaysia, Singapore, Rest of Southeast Asia), Rest of Asia Pacific)
  • Middle East & Africa (Saudi Arabia, UAE, Egypt, Kuwait, South Africa, Rest of Middle East & Africa)
  • Latin America (Brazil, Argentina, Rest of Latin America)


The Niche Research approach encompasses both primary and secondary research methods to provide comprehensive insights. While primary research is the cornerstone of our studies, we also incorporate secondary research sources such as company annual reports, premium industry databases, press releases, industry journals, and white papers.

Within our primary research, we actively engage with various industry stakeholders, conducting paid interviews and surveys. Our meticulous analysis extends to every market participant in major countries, allowing us to thoroughly examine their portfolios, calculate market shares, and segment revenues.

Our data collection primarily focuses on individual countries within our research scope, enabling us to estimate regional market sizes. Typically, we employ a bottom-up approach, meticulously tracking trends in different countries. We analyze growth drivers, constraints, technological innovations, and opportunities for each country, ultimately arriving at regional figures.Our process begins by examining the growth prospects of each country. Building upon these insights, we project growth and trends for the entire region. Finally, we utilize our proprietary model to refine estimations and forecasts.

Our data validation standards are integral to ensuring the reliability and accuracy of our research findings. Here’s a breakdown of our data validation processes and the stakeholders we engage with during our primary research:

  • Supply Side Analysis: We initiate a supply side analysis by directly contacting market participants, through telephonic interviews and questionnaires containing both open-ended and close-ended questions. We gather information on their portfolios, segment revenues, developments, and growth strategies.
  • Demand Side Analysis: To gain insights into adoption trends and consumer preferences, we reach out to target customers and users (non-vendors). This information forms a vital part of the qualitative analysis section of our reports, covering market dynamics, adoption trends, consumer behavior, spending patterns, and other related aspects.
  • Consultant Insights: We tap into the expertise of our partner consultants from around the world to obtain their unique viewpoints and perspectives. Their insights contribute to a well-rounded understanding of the markets under investigation.
  • In-House Validation: To ensure data accuracy and reliability, we conduct cross-validation of data points and information through our in-house team of consultants and utilize advanced data modeling tools for thorough verification.

The forecasts we provide are based on a comprehensive assessment of various factors, including:

  • Market Trends and Past Performance (Last Five Years): We accurately analyze market trends and performance data from preceding five years to identify historical patterns and understand the market’s evolution.
  • Historical Performance and Growth of Market Participants: We assess the historical performance and growth trajectories of key market participants. This analysis provides insights into the competitive landscape and individual company strategies.
  • Market Determinants Impact Analysis (Next Eight Years): We conduct a rigorous analysis of the factors that are projected to influence the market over the next eight years. This includes assessing both internal and external determinants that can shape market dynamics.
  • Drivers and Challenges for the Forecast Period:Identify the factors expected to drive market growth during the forecast period, as well as the challenges that the industry may face. This analysis aids in deriving an accurate growth rate projection.
  • New Acquisitions, Collaborations, or Partnerships: We keep a close watch on any new acquisitions, collaborations, or partnerships within the industry. These developments can have a significant impact on market dynamics and competitiveness.
  • Macro and Micro Factors Analysis:A thorough examination of both macro-level factors (e.g., economic trends, regulatory changes) and micro-level factors (e.g., technological advancements, consumer preferences) that may influence the market during the forecast period.
  • End-User Sentiment Analysis: To understand the market from the end-user perspective, we conduct sentiment analysis. This involves assessing the sentiment, preferences, and feedback of the end-users, which can provide valuable insights into market trends.
  • Perspective of Primary Participants: Insights gathered directly from primary research participants play a crucial role in shaping our forecasts. Their perspectives and experiences provide valuable qualitative data.
  • Year-on-Year Growth Trend: We utilize a year-on-year growth trend based on historical market growth and expected future trends. This helps in formulating our growth projections, aligning them with the market’s historical performance.

Research process adopted by TNR involves multiple stages, including data collection, validation, quality checks, and presentation. It’s crucial that the data and information we provide add value to your existing market understanding and expertise. We have also established partnerships with business consulting, research, and survey organizations across regions and globally to collaborate on regional analysis and data validation, ensuring the highest level of accuracy and reliability in our reports.


Procure Comprehensive Study of

Global Ophthalmic Operating Tables Market

Online Only

  • Online Access
  • Read Only File
  • Validity 3 Months
  • Print, Copy, Paste & Download
  • PPT, Excel
  • Cost-Free Report in the Next Update
$3300
Buy Now

Single User

  • Access to One User on One System
  • Read Only File
  • Validity 6 Months
  • Limited Print,Copy, Paste
  • PPT, Excel
  • Cost-Free Report in the Next Update
$4200
Buy Now

Multi User

  • Access to Fiver Users
  • PDF File
  • Validity 1 Year
  • Upto FivePrints
  • Cost-Free Report in the Next Update
  • PPT, Excel
$6000
Buy Now

Enterprise User

  • Access to Unlimited Users
  • PDF, PPT, Excel
  • Unlimited Validity, Prints&Downloads
  • 1 Hour Cost-Free & Dedicated Analyst Support
  • 10% Cost-Free Customization
  • Cost-Free Report Update Twice in a Year
  • Recommendations for Business Strategies
  • Authorization to Quote TNR, The Niche Research
$7300
Buy Now

Library Access

  • Online Access to Content Publications
  • Access Player Profiles Online
  • Get Immediate Access to Newly Added Content
  • Acquire 12 PDF Downloads
  • Acquire 5 Excel Data Sets
  • Gain Access to 290+ PDFs of Company Profiles
  • Round-the-clock Email and Phone Assistance
  • Dashboard Usage and Trends
  • Renewal & Upgrade Assistance
  • Assessing Customization Options and Alerts for New Reports
$10788
Buy Now
*Taxes/Fees, if applicable will be added during checkout. All prices in USD

Why TNR The Niche Research?

  • Unwavering Commitment to Excellence

  • Veteran Team of Researchers

  • Accurate and Timely Insights

  • Ethical Practices and Customized Service

  • Uninterrupted Availability Around the Clock

Scroll to Top