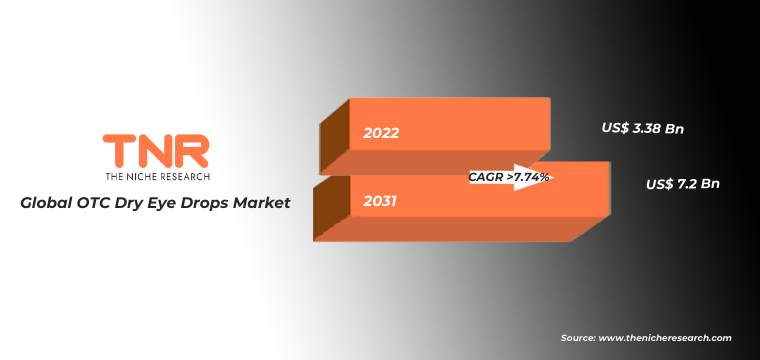
Over-the-counter (OTC) dry eye drops are non-prescription eye medications used to relieve symptoms of dry eyes. These drops typically provide lubrication and moisture to the eyes, alleviating discomfort, irritation, and redness caused by insufficient tear production or poor tear quality. They are readily available at pharmacies and do not require a doctor’s prescription. In terms of revenue, the global OTC dry eye drops market was worth US$ 3.38 Bn in 2022, anticipated to witness CAGR of 7.74% during 2023 – 2031.
Trends in the Global OTC Dry Eye Drops Market
- The growing reliance on digital screens in both work and leisure is intensifying eye strain and dry eye symptoms. Prolonged screen exposure reduces the frequency of natural blinking, leading to faster tear evaporation. Consequently, people are increasingly turning to OTC dry eye drops for quick relief. This trend is further propelled by the current work-from-home and online learning scenarios, where individuals are exposed to screens for extended durations, creating sustained demand for eye lubrication products.
- With a continuously aging global population, the prevalence of age-related dry eye is on the rise. As people get older, their tear production tends to decrease, leading to chronic dry eye issues. This demographic shift fuels the demand for OTC dry eye drops as a convenient and accessible solution for seniors seeking relief from dryness, irritation, and discomfort. The market is witnessing a surge in products catering specifically to age-related dry eye concerns, addressing a pressing need among older adults.
Global OTC Dry Eye Drops Market Revenue & Forecast, (US$ Million), 2015 – 2031
Preservative-free segment has gained popularity in recent years and is anticipated to be the fastest growing segment in the global OTC dry eye drops market during the forecast period. This growth can be attributed to increasing consumer awareness of eye health and safety. Surveys indicate a rising concern among users about the potential irritants like benzalkonium chloride found in preservatives. Data shows that a substantial number of individuals prefer gentler alternatives to alleviate dry eye symptoms.
Preservative-free formulations offer a safer and more comfortable option, particularly for those with sensitive eyes or frequent usage requirements. The growing demand for these products is bolstered by healthcare practitioners’ recommendations, emphasizing the significance of eye health, making the Preservative-free segment the fastest-growing in the OTC Dry Eye Drops market.
Low viscosity segment had the highest share in the global OTC dry eye drops market in 2022. The dominance is driven by its versatility and broad consumer appeal. This study observed that a majority of dry eye sufferers prefer these drops due to their lightweight and non-greasy nature. Low viscosity drops mimic the natural tear consistency, providing quick and even coverage, making them suitable for various dry eye conditions. Additionally, they are often recommended by eye care professionals, further solidifying their position. Data highlights that users find low viscosity formulations comfortable and convenient for everyday use, making them the preferred choice for a wide range of consumers, thereby establishing their dominance in the market.
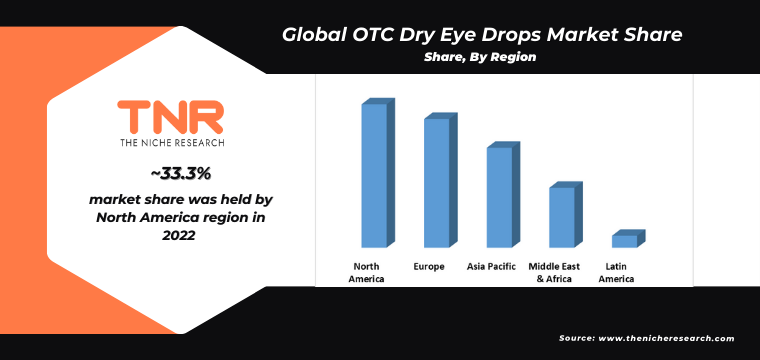
Asia Pacific is expected to witness the highest growth rate in the OTC dry eye drops market during the forecast period. This study observed a rising prevalence of dry eye conditions driven by an aging population, prolonged screen time, and environmental factors like air pollution. These surveys also underscore an increasing awareness of eye health and a consumer preference for OTC solutions in the region. With an expanding middle-class population and improved healthcare product accessibility, the Asia Pacific market is witnessing a surge in demand. Additionally, a growing array of innovative products tailored to address regional needs further solidifies its rapid growth in the OTC dry eye drops market.
Competitive Landscape
Some of the players operating in the global OTC dry eye drops market are
- AbbVie Inc.
- Johnson & Johnson Services, Inc.
- Medicom Healthcare Ltd.
- Novartis AG
- Prestige Consumer Healthcare Inc.
- Rohto
- Santen Pharmaceutical Co., Ltd.
- Sentiss
- Other Industry Participants
Report Summary of Global OTC Dry Eye Drops Market
| Report Specifications |
Details |
| Market Revenue in 2022 |
US$ 3.38 Billion |
| Market Size Forecast by 2031 |
US$ 7.2 Billion |
| Growth Rate (CAGR) |
7.74% |
| Historic Data |
2015 – 2021 |
| Base Year for Estimation |
2022 |
| Forecast Period |
2023 – 2031 |
| Report Inclusions |
Market Size & Estimates, Market Dynamics, Competitive Scenario, Trends, Growth Factors, Market Determinants, Key Investment Segmentation, Product/Service/Solutions Benchmarking |
| Segments Covered |
By Type, By Product Type, By Viscosity, By Distribution Channel |
| Regions Covered |
North America, Europe, Asia Pacific, Middle East & Africa, Latin America |
| Countries Covered |
U.S., Canada, Mexico, Rest of North America, France, The UK, Spain, Germany, Italy, Nordic Countries (Denmark, Finland, Iceland, Sweden, Norway), Benelux Union (Belgium, The Netherlands, Luxembourg), Rest of Europe, China, Japan, India, New Zealand, Australia, South Korea, Southeast Asia (Indonesia, Thailand, Malaysia, Singapore, Rest of Southeast Asia), Rest of Asia Pacific, Saudi Arabia, UAE, Egypt, Kuwait, South Africa, Rest of Middle East & Africa, Brazil, Argentina, Rest of Latin America |
| Key Players |
AbbVie Inc., Johnson & Johnson Services, Inc., Medicom Healthcare Ltd., Novartis AG, Prestige Consumer Healthcare Inc., Rohto, Santen Pharmaceutical Co., Ltd., Sentiss, Other Industry Participants |
| Customization Scope |
Customization allows for the inclusion/modification of content pertaining to geographical regions, countries, and specific market segments. |
| Pricing & Procurement Options |
Explore purchase options tailored to your specific research requirements |
| Contact Details |
Consult With Our Expert
Japan (Toll-Free): – +81 663-386-8111
South Korea (Toll-Free): – +82-808- 703-126
Saudi Arabia (Toll-Free): – +966 800 850 1643
United States: +1 302-232-5106
United Kingdom: +447537105080
E-mail: askanexpert@thenicheresearch.com
|
Global OTC Dry Eye Drops Market
By Type
By Product Type
- With Preservatives
- Preservative Free
By Viscosity
- Low Viscosity
- High Viscosity
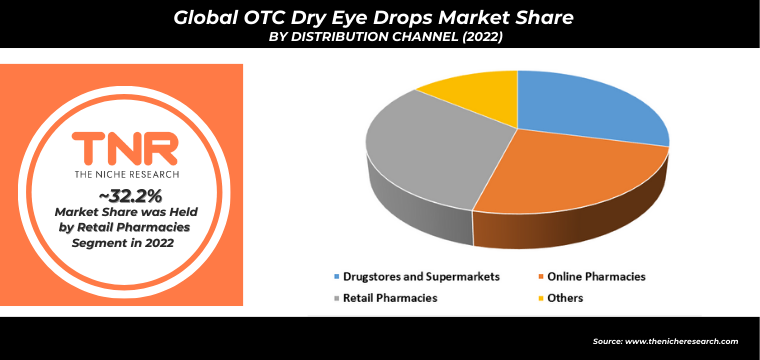
By Distribution Channel
- Drugstores and Supermarkets
- Online Pharmacies
- Retail Pharmacies
- Others
By Region
- North America (U.S., Canada, Mexico, Rest of North America)
- Europe (France, The UK, Spain, Germany, Italy, Nordic Countries (Denmark, Finland, Iceland, Sweden, Norway), Benelux Union (Belgium, The Netherlands, Luxembourg), Rest of Europe)
- Asia Pacific (China, Japan, India, New Zealand, Australia, South Korea, Southeast Asia (Indonesia, Thailand, Malaysia, Singapore, Rest of Southeast Asia), Rest of Asia Pacific)
- Middle East & Africa (Saudi Arabia, UAE, Egypt, Kuwait, South Africa, Rest of Middle East & Africa)
- Latin America (Brazil, Argentina, Rest of Latin America)
Report Coverage and Deliverables:

Table of Contents
.
1.Market Scope
1.2.Years Considered
1.2.1.Historic Years: 2015 – 2021
1.2.3.Forecast Years: 2023 – 2031
3.Research Methodology
3.1.Primary Research
3.1.1.Research Questionnaire
3.1.2.Global Percentage Breakdown
3.1.3.Primary Interviews: Key Opinion Leaders (KOLs)
3.3.Market Size Estimates
3.4.Data Triangulation Methodology
4.Recommendations and Insights from TNR’s Perspective**
5.Holistic Overview of OTC Dry Eye Drops Market
6.Market Synopsis: OTC Dry Eye Drops Market
7.OTC Dry Eye Drops Market Analysis: Qualitative Perspective
7.1.Introduction
7.1.2.Industry Development
7.3.Trends in OTC Dry Eye Drops Market
7.4.Market Determinants Radar Chart
7.5.Macro-Economic and Micro-Economic Indicators: OTC Dry Eye Drops Market
7.6.Porter’s Five Force Analysis
7.7.Impact of Covid-19 on OTC Dry Eye Drops Market
8.Global OTC Dry Eye Drops Market Analysis and Forecasts, 2023 – 2031
8.1.Overview
8.1.1.Global OTC Dry Eye Drops Market Revenue (US$ Mn)
8.2.Global OTC Dry Eye Drops Market Revenue (US$ Mn) and Forecasts, By Type
8.2.1.Branded
8.2.1.2.Market Estimation and Penetration, 2015 – 2022
8.2.1.3.Market Forecast, 2023 – 2031
8.2.1.4.Compound Annual Growth Rate (CAGR)
8.2.1.5.Regional Bifurcation
8.2.1.5.1.North America
8.2.1.5.1.1.Market Estimation, 2015 – 2022
8.2.1.5.1.2.Market Forecast, 2023 – 2031
8.2.1.5.2.Europe
8.2.1.5.2.1.Market Estimation, 2015 – 2022
8.2.1.5.2.2.Market Forecast, 2023 – 2031
8.2.1.5.3.Asia Pacific
8.2.1.5.3.1.Market Estimation, 2015 – 2022
8.2.1.5.3.2.Market Forecast, 2023 – 2031
8.2.1.5.4.Middle East and Africa
8.2.1.5.4.1.Market Estimation, 2015 – 2022
8.2.1.5.4.2.Market Forecast, 2023 – 2031
8.2.1.5.5.Latin America
8.2.1.5.5.1.Market Estimation, 2015 – 2022
8.2.1.5.5.2.Market Forecast, 2023 – 2031
8.2.2.Generic
8.2.2.2.Market Estimation and Penetration, 2015 – 2022
8.2.2.3.Market Forecast, 2023 – 2031
8.2.2.4.Compound Annual Growth Rate (CAGR)
8.2.2.5.Regional Bifurcation
8.2.2.5.1.North America
8.2.2.5.1.1.Market Estimation, 2015 – 2022
8.2.2.5.1.2.Market Forecast, 2023 – 2031
8.2.2.5.2.Europe
8.2.2.5.2.1.Market Estimation, 2015 – 2022
8.2.2.5.2.2.Market Forecast, 2023 – 2031
8.2.2.5.3.Asia Pacific
8.2.2.5.3.1.Market Estimation, 2015 – 2022
8.2.2.5.3.2.Market Forecast, 2023 – 2031
8.2.2.5.4.Middle East and Africa
8.2.2.5.4.1.Market Estimation, 2015 – 2022
8.2.2.5.4.2.Market Forecast, 2023 – 2031
8.2.2.5.5.Latin America
8.2.2.5.5.1.Market Estimation, 2015 – 2022
8.2.2.5.5.2.Market Forecast, 2023 – 2031
8.3.Key Segment for Channeling Investments
9.Global OTC Dry Eye Drops Market Analysis and Forecasts, 2023 – 2031
9.2.Global OTC Dry Eye Drops Market Revenue (US$ Mn) and Forecasts, By Product Type
9.2.1.With Preservatives
9.2.1.2.Market Estimation and Penetration, 2015 – 2022
9.2.1.3.Market Forecast, 2023 – 2031
9.2.1.4.Compound Annual Growth Rate (CAGR)
9.2.1.5.Regional Bifurcation
9.2.1.5.1.North America
9.2.1.5.1.1.Market Estimation, 2015 – 2022
9.2.1.5.1.2.Market Forecast, 2023 – 2031
9.2.1.5.2.Europe
9.2.1.5.2.1.Market Estimation, 2015 – 2022
9.2.1.5.2.2.Market Forecast, 2023 – 2031
9.2.1.5.3.Asia Pacific
9.2.1.5.3.1.Market Estimation, 2015 – 2022
9.2.1.5.3.2.Market Forecast, 2023 – 2031
9.2.1.5.4.Middle East and Africa
9.2.1.5.4.1.Market Estimation, 2015 – 2022
9.2.1.5.4.2.Market Forecast, 2023 – 2031
9.2.1.5.5.Latin America
9.2.1.5.5.1.Market Estimation, 2015 – 2022
9.2.1.5.5.2.Market Forecast, 2023 – 2031
9.2.2.Preservative Free
9.2.2.2.Market Estimation and Penetration, 2015 – 2022
9.2.2.3.Market Forecast, 2023 – 2031
9.2.2.4.Compound Annual Growth Rate (CAGR)
9.2.2.5.Regional Bifurcation
9.2.2.5.1.North America
9.2.2.5.1.1.Market Estimation, 2015 – 2022
9.2.2.5.1.2.Market Forecast, 2023 – 2031
9.2.2.5.2.Europe
9.2.2.5.2.1.Market Estimation, 2015 – 2022
9.2.2.5.2.2.Market Forecast, 2023 – 2031
9.2.2.5.3.Asia Pacific
9.2.2.5.3.1.Market Estimation, 2015 – 2022
9.2.2.5.3.2.Market Forecast, 2023 – 2031
9.2.2.5.4.Middle East and Africa
9.2.2.5.4.1.Market Estimation, 2015 – 2022
9.2.2.5.4.2.Market Forecast, 2023 – 2031
9.2.2.5.5.Latin America
9.2.2.5.5.1.Market Estimation, 2015 – 2022
9.2.2.5.5.2.Market Forecast, 2023 – 2031
9.3.Key Segment for Channeling Investments
10.Global OTC Dry Eye Drops Market Analysis and Forecasts, 2023 – 2031
10.2.Global OTC Dry Eye Drops Market Revenue (US$ Mn) and Forecasts, By Viscosity
10.2.1.Low Viscosity
10.2.1.2.Market Estimation and Penetration, 2015 – 2022
10.2.1.3.Market Forecast, 2023 – 2031
10.2.1.4.Compound Annual Growth Rate (CAGR)
10.2.1.5.Regional Bifurcation
10.2.1.5.1.North America
10.2.1.5.1.1.Market Estimation, 2015 – 2022
10.2.1.5.1.2.Market Forecast, 2023 – 2031
10.2.1.5.2.Europe
10.2.1.5.2.1.Market Estimation, 2015 – 2022
10.2.1.5.2.2.Market Forecast, 2023 – 2031
10.2.1.5.3.Asia Pacific
10.2.1.5.3.1.Market Estimation, 2015 – 2022
10.2.1.5.3.2.Market Forecast, 2023 – 2031
10.2.1.5.4.Middle East and Africa
10.2.1.5.4.1.Market Estimation, 2015 – 2022
10.2.1.5.4.2.Market Forecast, 2023 – 2031
10.2.1.5.5.Latin America
10.2.1.5.5.1.Market Estimation, 2015 – 2022
10.2.1.5.5.2.Market Forecast, 2023 – 2031
10.2.2.High Viscosity
10.2.2.2.Market Estimation and Penetration, 2015 – 2022
10.2.2.3.Market Forecast, 2023 – 2031
10.2.2.4.Compound Annual Growth Rate (CAGR)
10.2.2.5.Regional Bifurcation
10.2.2.5.1.North America
10.2.2.5.1.1.Market Estimation, 2015 – 2022
10.2.2.5.1.2.Market Forecast, 2023 – 2031
10.2.2.5.2.Europe
10.2.2.5.2.1.Market Estimation, 2015 – 2022
10.2.2.5.2.2.Market Forecast, 2023 – 2031
10.2.2.5.3.Asia Pacific
10.2.2.5.3.1.Market Estimation, 2015 – 2022
10.2.2.5.3.2.Market Forecast, 2023 – 2031
10.2.2.5.4.Middle East and Africa
10.2.2.5.4.1.Market Estimation, 2015 – 2022
10.2.2.5.4.2.Market Forecast, 2023 – 2031
10.2.2.5.5.Latin America
10.2.2.5.5.1.Market Estimation, 2015 – 2022
10.2.2.5.5.2.Market Forecast, 2023 – 2031
10.3.Key Segment for Channeling Investments
11.Global OTC Dry Eye Drops Market Analysis and Forecasts, 2023 – 2031
11.2.Global OTC Dry Eye Drops Market Revenue (US$ Mn) and Forecasts, By Distribution Channel
11.2.1.Drugstores and Supermarkets
11.2.1.2.Market Estimation and Penetration, 2015 – 2022
11.2.1.3.Market Forecast, 2023 – 2031
11.2.1.4.Compound Annual Growth Rate (CAGR)
11.2.1.5.Regional Bifurcation
11.2.1.5.1.North America
11.2.1.5.1.1.Market Estimation, 2015 – 2022
11.2.1.5.1.2.Market Forecast, 2023 – 2031
11.2.1.5.2.Europe
11.2.1.5.2.1.Market Estimation, 2015 – 2022
11.2.1.5.2.2.Market Forecast, 2023 – 2031
11.2.1.5.3.Asia Pacific
11.2.1.5.3.1.Market Estimation, 2015 – 2022
11.2.1.5.3.2.Market Forecast, 2023 – 2031
11.2.1.5.4.Middle East and Africa
11.2.1.5.4.1.Market Estimation, 2015 – 2022
11.2.1.5.4.2.Market Forecast, 2023 – 2031
11.2.1.5.5.Latin America
11.2.1.5.5.1.Market Estimation, 2015 – 2022
11.2.1.5.5.2.Market Forecast, 2023 – 2031
11.2.2.Online Pharmacies
11.2.2.2.Market Estimation and Penetration, 2015 – 2022
11.2.2.3.Market Forecast, 2023 – 2031
11.2.2.4.Compound Annual Growth Rate (CAGR)
11.2.2.5.Regional Bifurcation
11.2.2.5.1.North America
11.2.2.5.1.1.Market Estimation, 2015 – 2022
11.2.2.5.1.2.Market Forecast, 2023 – 2031
11.2.2.5.2.Europe
11.2.2.5.2.1.Market Estimation, 2015 – 2022
11.2.2.5.2.2.Market Forecast, 2023 – 2031
11.2.2.5.3.Asia Pacific
11.2.2.5.3.1.Market Estimation, 2015 – 2022
11.2.2.5.3.2.Market Forecast, 2023 – 2031
11.2.2.5.4.Middle East and Africa
11.2.2.5.4.1.Market Estimation, 2015 – 2022
11.2.2.5.4.2.Market Forecast, 2023 – 2031
11.2.2.5.5.Latin America
11.2.2.5.5.1.Market Estimation, 2015 – 2022
11.2.2.5.5.2.Market Forecast, 2023 – 2031
11.2.3.Retail Pharmacies
11.2.3.2.Market Estimation and Penetration, 2015 – 2022
11.2.3.3.Market Forecast, 2023 – 2031
11.2.3.4.Compound Annual Growth Rate (CAGR)
11.2.3.5.Regional Bifurcation
11.2.3.5.1.North America
11.2.3.5.1.1.Market Estimation, 2015 – 2022
11.2.3.5.1.2.Market Forecast, 2023 – 2031
11.2.3.5.2.Europe
11.2.3.5.2.1.Market Estimation, 2015 – 2022
11.2.3.5.2.2.Market Forecast, 2023 – 2031
11.2.3.5.3.Asia Pacific
11.2.3.5.3.1.Market Estimation, 2015 – 2022
11.2.3.5.3.2.Market Forecast, 2023 – 2031
11.2.3.5.4.Middle East and Africa
11.2.3.5.4.1.Market Estimation, 2015 – 2022
11.2.3.5.4.2.Market Forecast, 2023 – 2031
11.2.3.5.5.Latin America
11.2.3.5.5.1.Market Estimation, 2015 – 2022
11.2.3.5.5.2.Market Forecast, 2023 – 2031
11.2.4.Others
11.2.4.2.Market Estimation and Penetration, 2015 – 2022
11.2.4.3.Market Forecast, 2023 – 2031
11.2.4.4.Compound Annual Growth Rate (CAGR)
11.2.4.5.Regional Bifurcation
11.2.4.5.1.North America
11.2.4.5.1.1.Market Estimation, 2015 – 2022
11.2.4.5.1.2.Market Forecast, 2023 – 2031
11.2.4.5.2.Europe
11.2.4.5.2.1.Market Estimation, 2015 – 2022
11.2.4.5.2.2.Market Forecast, 2023 – 2031
11.2.4.5.3.Asia Pacific
11.2.4.5.3.1.Market Estimation, 2015 – 2022
11.2.4.5.3.2.Market Forecast, 2023 – 2031
11.2.4.5.4.Middle East and Africa
11.2.4.5.4.1.Market Estimation, 2015 – 2022
11.2.4.5.4.2.Market Forecast, 2023 – 2031
11.2.4.5.5.Latin America
11.2.4.5.5.1.Market Estimation, 2015 – 2022
11.2.4.5.5.2.Market Forecast, 2023 – 2031
11.3.Key Segment for Channeling Investments
11.3.1.By Distribution Channel
12.North America OTC Dry Eye Drops Market Analysis and Forecasts, 2023 – 2031
12.1.Overview
12.1.1.North America OTC Dry Eye Drops Market Revenue (US$ Mn)
12.2.North America OTC Dry Eye Drops Market Revenue (US$ Mn) and Forecasts, By Type
12.3.North America OTC Dry Eye Drops Market Revenue (US$ Mn) and Forecasts, By Product Type
12.3.1.With Preservatives
12.4.North America OTC Dry Eye Drops Market Revenue (US$ Mn) and Forecasts, By Viscosity
12.5.North America OTC Dry Eye Drops Market Revenue (US$ Mn) and Forecasts, By Distribution Channel
12.5.1.Drugstores and Supermarkets
12.6.North America OTC Dry Eye Drops Market Revenue (US$ Mn) and Forecasts, By Country
12.6.1.U.S
12.6.1.1.U.S OTC Dry Eye Drops Market Revenue (US$ Mn) and Forecasts, By Type
12.6.1.2.U.S OTC Dry Eye Drops Market Revenue (US$ Mn) and Forecasts, By Product Type
12.6.1.2.1.With Preservatives
12.6.1.2.2.Preservative Free
12.6.1.3.U.S OTC Dry Eye Drops Market Revenue (US$ Mn) and Forecasts, By Viscosity
12.6.1.3.2.High Viscosity
12.6.1.4.U.S OTC Dry Eye Drops Market Revenue (US$ Mn) and Forecasts, By Distribution Channel
12.6.1.4.1.Drugstores and Supermarkets
12.6.1.4.2.Online Pharmacies
12.6.1.4.3.Retail Pharmacies
12.6.2.Canada
12.6.2.1.Canada OTC Dry Eye Drops Market Revenue (US$ Mn) and Forecasts, By Type
12.6.2.2.Canada OTC Dry Eye Drops Market Revenue (US$ Mn) and Forecasts, By Product Type
12.6.2.2.1.With Preservatives
12.6.2.2.2.Preservative Free
12.6.2.3.Canada OTC Dry Eye Drops Market Revenue (US$ Mn) and Forecasts, By Viscosity
12.6.2.3.2.High Viscosity
12.6.2.4.Canada OTC Dry Eye Drops Market Revenue (US$ Mn) and Forecasts, By Distribution Channel
12.6.2.4.1.Drugstores and Supermarkets
12.6.2.4.2.Online Pharmacies
12.6.2.4.3.Retail Pharmacies
12.6.3.Mexico
12.6.3.1.Mexico OTC Dry Eye Drops Market Revenue (US$ Mn) and Forecasts, By Type
12.6.3.2.Mexico OTC Dry Eye Drops Market Revenue (US$ Mn) and Forecasts, By Product Type
12.6.3.2.1.With Preservatives
12.6.3.2.2.Preservative Free
12.6.3.3.Mexico OTC Dry Eye Drops Market Revenue (US$ Mn) and Forecasts, By Viscosity
12.6.3.3.2.High Viscosity
12.6.3.4.Mexico OTC Dry Eye Drops Market Revenue (US$ Mn) and Forecasts, By Distribution Channel
12.6.3.4.1.Drugstores and Supermarkets
12.6.3.4.2.Online Pharmacies
12.6.3.4.3.Retail Pharmacies
12.6.4.Rest of North America
12.6.4.1.Rest of North America OTC Dry Eye Drops Market Revenue (US$ Mn) and Forecasts, By Type
12.6.4.2.Rest of North America OTC Dry Eye Drops Market Revenue (US$ Mn) and Forecasts, By Product Type
12.6.4.2.1.With Preservatives
12.6.4.2.2.Preservative Free
12.6.4.3.Rest of North America OTC Dry Eye Drops Market Revenue (US$ Mn) and Forecasts, By Viscosity
12.6.4.3.2.High Viscosity
12.6.4.4.Rest of North America OTC Dry Eye Drops Market Revenue (US$ Mn) and Forecasts, By Distribution Channel
12.6.4.4.1.Drugstores and Supermarkets
12.6.4.4.2.Online Pharmacies
12.6.4.4.3.Retail Pharmacies
12.7.Key Segment for Channeling Investments
12.7.5.By Distribution Channel
13.Europe OTC Dry Eye Drops Market Analysis and Forecasts, 2023 – 2031
13.1.Overview
13.1.1.Europe OTC Dry Eye Drops Market Revenue (US$ Mn)
13.2.Europe OTC Dry Eye Drops Market Revenue (US$ Mn) and Forecasts, By Type
13.3.Europe OTC Dry Eye Drops Market Revenue (US$ Mn) and Forecasts, By Product Type
13.3.1.With Preservatives
13.4.Europe OTC Dry Eye Drops Market Revenue (US$ Mn) and Forecasts, By Viscosity
13.5.Europe OTC Dry Eye Drops Market Revenue (US$ Mn) and Forecasts, By Distribution Channel
13.5.1.Drugstores and Supermarkets
13.6.Europe OTC Dry Eye Drops Market Revenue (US$ Mn) and Forecasts, By Country
13.6.1.France
13.6.1.1.France OTC Dry Eye Drops Market Revenue (US$ Mn) and Forecasts, By Type
13.6.1.2.France OTC Dry Eye Drops Market Revenue (US$ Mn) and Forecasts, By Product Type
13.6.1.2.1.With Preservatives
13.6.1.2.2.Preservative Free
13.6.1.3.France OTC Dry Eye Drops Market Revenue (US$ Mn) and Forecasts, By Viscosity
13.6.1.3.2.High Viscosity
13.6.1.4.France OTC Dry Eye Drops Market Revenue (US$ Mn) and Forecasts, By Distribution Channel
13.6.1.4.1.Drugstores and Supermarkets
13.6.1.4.2.Online Pharmacies
13.6.1.4.3.Retail Pharmacies
13.6.2.The UK
13.6.2.1.The UK OTC Dry Eye Drops Market Revenue (US$ Mn) and Forecasts, By Type
13.6.2.2.The UK OTC Dry Eye Drops Market Revenue (US$ Mn) and Forecasts, By Product Type
13.6.2.2.1.With Preservatives
13.6.2.2.2.Preservative Free
13.6.2.3.The UK OTC Dry Eye Drops Market Revenue (US$ Mn) and Forecasts, By Viscosity
13.6.2.3.2.High Viscosity
13.6.2.4.The UK OTC Dry Eye Drops Market Revenue (US$ Mn) and Forecasts, By Distribution Channel
13.6.2.4.1.Drugstores and Supermarkets
13.6.2.4.2.Online Pharmacies
13.6.2.4.3.Retail Pharmacies
13.6.3.Spain
13.6.3.1.Spain OTC Dry Eye Drops Market Revenue (US$ Mn) and Forecasts, By Type
13.6.3.2.Spain OTC Dry Eye Drops Market Revenue (US$ Mn) and Forecasts, By Product Type
13.6.3.2.1.With Preservatives
13.6.3.2.2.Preservative Free
13.6.3.3.Spain OTC Dry Eye Drops Market Revenue (US$ Mn) and Forecasts, By Viscosity
13.6.3.3.2.High Viscosity
13.6.3.4.Spain OTC Dry Eye Drops Market Revenue (US$ Mn) and Forecasts, By Distribution Channel
13.6.3.4.1.Drugstores and Supermarkets
13.6.3.4.2.Online Pharmacies
13.6.3.4.3.Retail Pharmacies
13.6.4.Germany
13.6.4.1.Germany OTC Dry Eye Drops Market Revenue (US$ Mn) and Forecasts, By Type
13.6.4.2.Germany OTC Dry Eye Drops Market Revenue (US$ Mn) and Forecasts, By Product Type
13.6.4.2.1.With Preservatives
13.6.4.2.2.Preservative Free
13.6.4.3.Germany OTC Dry Eye Drops Market Revenue (US$ Mn) and Forecasts, By Viscosity
13.6.4.3.2.High Viscosity
13.6.4.4.Germany OTC Dry Eye Drops Market Revenue (US$ Mn) and Forecasts, By Distribution Channel
13.6.4.4.1.Drugstores and Supermarkets
13.6.4.4.2.Online Pharmacies
13.6.4.4.3.Retail Pharmacies
13.6.5.Italy
13.6.5.1.Italy OTC Dry Eye Drops Market Revenue (US$ Mn) and Forecasts, By Type
13.6.5.2.Italy OTC Dry Eye Drops Market Revenue (US$ Mn) and Forecasts, By Product Type
13.6.5.2.1.With Preservatives
13.6.5.2.2.Preservative Free
13.6.5.3.Italy OTC Dry Eye Drops Market Revenue (US$ Mn) and Forecasts, By Viscosity
13.6.5.3.2.High Viscosity
13.6.5.4.Italy OTC Dry Eye Drops Market Revenue (US$ Mn) and Forecasts, By Distribution Channel
13.6.5.4.1.Drugstores and Supermarkets
13.6.5.4.2.Online Pharmacies
13.6.5.4.3.Retail Pharmacies
13.6.6.Nordic Countries
13.6.6.1.Nordic Countries OTC Dry Eye Drops Market Revenue (US$ Mn) and Forecasts, By Type
13.6.6.2.Nordic Countries OTC Dry Eye Drops Market Revenue (US$ Mn) and Forecasts, By Product Type
13.6.6.2.1.With Preservatives
13.6.6.2.2.Preservative Free
13.6.6.3.Nordic Countries OTC Dry Eye Drops Market Revenue (US$ Mn) and Forecasts, By Viscosity
13.6.6.3.2.High Viscosity
13.6.6.4.Nordic Countries OTC Dry Eye Drops Market Revenue (US$ Mn) and Forecasts, By Distribution Channel
13.6.6.4.1.Drugstores and Supermarkets
13.6.6.4.2.Online Pharmacies
13.6.6.4.3.Retail Pharmacies
13.6.6.5.Nordic Countries OTC Dry Eye Drops Market Revenue (US$ Mn) and Forecasts, By Country
13.6.7.Benelux Union
13.6.7.1.Benelux Union OTC Dry Eye Drops Market Revenue (US$ Mn) and Forecasts, By Type
13.6.7.2.Benelux Union OTC Dry Eye Drops Market Revenue (US$ Mn) and Forecasts, By Product Type
13.6.7.2.1.With Preservatives
13.6.7.2.2.Preservative Free
13.6.7.3.Benelux Union OTC Dry Eye Drops Market Revenue (US$ Mn) and Forecasts, By Viscosity
13.6.7.3.2.High Viscosity
13.6.7.4.Benelux Union OTC Dry Eye Drops Market Revenue (US$ Mn) and Forecasts, By Distribution Channel
13.6.7.4.1.Drugstores and Supermarkets
13.6.7.4.2.Online Pharmacies
13.6.7.4.3.Retail Pharmacies
13.6.7.5.Benelux Union OTC Dry Eye Drops Market Revenue (US$ Mn) and Forecasts, By Country
13.6.7.5.2.The Netherlands
13.6.8.Rest of Europe
13.6.8.1.Rest of Europe OTC Dry Eye Drops Market Revenue (US$ Mn) and Forecasts, By Type
13.6.8.2.Rest of Europe OTC Dry Eye Drops Market Revenue (US$ Mn) and Forecasts, By Product Type
13.6.8.2.1.With Preservatives
13.6.8.2.2.Preservative Free
13.6.8.3.Rest of Europe OTC Dry Eye Drops Market Revenue (US$ Mn) and Forecasts, By Viscosity
13.6.8.3.2.High Viscosity
13.6.8.4.Rest of Europe OTC Dry Eye Drops Market Revenue (US$ Mn) and Forecasts, By Distribution Channel
13.6.8.4.1.Drugstores and Supermarkets
13.6.8.4.2.Online Pharmacies
13.6.8.4.3.Retail Pharmacies
13.7.Key Segment for Channeling Investments
13.7.5.By Distribution Channel
14.Asia Pacific OTC Dry Eye Drops Market Analysis and Forecasts, 2023 – 2031
14.1.Overview
14.1.1.Asia Pacific OTC Dry Eye Drops Market Revenue (US$ Mn)
14.2.Asia Pacific OTC Dry Eye Drops Market Revenue (US$ Mn) and Forecasts, By Type
14.3.Asia Pacific OTC Dry Eye Drops Market Revenue (US$ Mn) and Forecasts, By Product Type
14.3.1.With Preservatives
14.4.Asia Pacific OTC Dry Eye Drops Market Revenue (US$ Mn) and Forecasts, By Viscosity
14.5.Asia Pacific OTC Dry Eye Drops Market Revenue (US$ Mn) and Forecasts, By Distribution Channel
14.5.1.Drugstores and Supermarkets
14.6.Asia Pacific OTC Dry Eye Drops Market Revenue (US$ Mn) and Forecasts, By Country
14.6.1.China
14.6.1.1.China OTC Dry Eye Drops Market Revenue (US$ Mn) and Forecasts, By Type
14.6.1.2.China OTC Dry Eye Drops Market Revenue (US$ Mn) and Forecasts, By Product Type
14.6.1.2.1.With Preservatives
14.6.1.2.2.Preservative Free
14.6.1.3.China OTC Dry Eye Drops Market Revenue (US$ Mn) and Forecasts, By Viscosity
14.6.1.3.2.High Viscosity
14.6.1.4.China OTC Dry Eye Drops Market Revenue (US$ Mn) and Forecasts, By Distribution Channel
14.6.1.4.1.Drugstores and Supermarkets
14.6.1.4.2.Online Pharmacies
14.6.1.4.3.Retail Pharmacies
14.6.2.Japan
14.6.2.1.Japan OTC Dry Eye Drops Market Revenue (US$ Mn) and Forecasts, By Type
14.6.2.2.Japan OTC Dry Eye Drops Market Revenue (US$ Mn) and Forecasts, By Product Type
14.6.2.2.1.With Preservatives
14.6.2.2.2.Preservative Free
14.6.2.3.Japan OTC Dry Eye Drops Market Revenue (US$ Mn) and Forecasts, By Viscosity
14.6.2.3.2.High Viscosity
14.6.2.4.Japan OTC Dry Eye Drops Market Revenue (US$ Mn) and Forecasts, By Distribution Channel
14.6.2.4.1.Drugstores and Supermarkets
14.6.2.4.2.Online Pharmacies
14.6.2.4.3.Retail Pharmacies
14.6.3.India
14.6.3.1.India OTC Dry Eye Drops Market Revenue (US$ Mn) and Forecasts, By Type
14.6.3.2.India OTC Dry Eye Drops Market Revenue (US$ Mn) and Forecasts, By Product Type
14.6.3.2.1.With Preservatives
14.6.3.2.2.Preservative Free
14.6.3.3.India OTC Dry Eye Drops Market Revenue (US$ Mn) and Forecasts, By Viscosity
14.6.3.3.2.High Viscosity
14.6.3.4.India OTC Dry Eye Drops Market Revenue (US$ Mn) and Forecasts, By Distribution Channel
14.6.3.4.1.Drugstores and Supermarkets
14.6.3.4.2.Online Pharmacies
14.6.3.4.3.Retail Pharmacies
14.6.4.New Zealand
14.6.4.1.New Zealand OTC Dry Eye Drops Market Revenue (US$ Mn) and Forecasts, By Type
14.6.4.2.New Zealand OTC Dry Eye Drops Market Revenue (US$ Mn) and Forecasts, By Product Type
14.6.4.2.1.With Preservatives
14.6.4.2.2.Preservative Free
14.6.4.3.New Zealand OTC Dry Eye Drops Market Revenue (US$ Mn) and Forecasts, By Viscosity
14.6.4.3.2.High Viscosity
14.6.4.4.New Zealand OTC Dry Eye Drops Market Revenue (US$ Mn) and Forecasts, By Distribution Channel
14.6.4.4.1.Drugstores and Supermarkets
14.6.4.4.2.Online Pharmacies
14.6.4.4.3.Retail Pharmacies
14.6.5.Australia
14.6.5.1.Australia OTC Dry Eye Drops Market Revenue (US$ Mn) and Forecasts, By Type
14.6.5.2.Australia OTC Dry Eye Drops Market Revenue (US$ Mn) and Forecasts, By Product Type
14.6.5.2.1.With Preservatives
14.6.5.2.2.Preservative Free
14.6.5.3.Australia OTC Dry Eye Drops Market Revenue (US$ Mn) and Forecasts, By Viscosity
14.6.5.3.2.High Viscosity
14.6.5.4.Australia OTC Dry Eye Drops Market Revenue (US$ Mn) and Forecasts, By Distribution Channel
14.6.5.4.1.Drugstores and Supermarkets
14.6.5.4.2.Online Pharmacies
14.6.5.4.3.Retail Pharmacies
14.6.6.South Korea
14.6.6.1.South Korea OTC Dry Eye Drops Market Revenue (US$ Mn) and Forecasts, By Type
14.6.6.2.South Korea OTC Dry Eye Drops Market Revenue (US$ Mn) and Forecasts, By Product Type
14.6.6.2.1.With Preservatives
14.6.6.2.2.Preservative Free
14.6.6.3.South Korea OTC Dry Eye Drops Market Revenue (US$ Mn) and Forecasts, By Viscosity
14.6.6.3.2.High Viscosity
14.6.6.4.South Korea OTC Dry Eye Drops Market Revenue (US$ Mn) and Forecasts, By Distribution Channel
14.6.6.4.1.Drugstores and Supermarkets
14.6.6.4.2.Online Pharmacies
14.6.6.4.3.Retail Pharmacies
14.6.7.Southeast Asia
14.6.7.1.Southeast Asia OTC Dry Eye Drops Market Revenue (US$ Mn) and Forecasts, By Type
14.6.7.2.Southeast Asia OTC Dry Eye Drops Market Revenue (US$ Mn) and Forecasts, By Product Type
14.6.7.2.1.With Preservatives
14.6.7.2.2.Preservative Free
14.6.7.3.Southeast Asia OTC Dry Eye Drops Market Revenue (US$ Mn) and Forecasts, By Viscosity
14.6.7.3.2.High Viscosity
14.6.7.4.Southeast Asia OTC Dry Eye Drops Market Revenue (US$ Mn) and Forecasts, By Distribution Channel
14.6.7.4.1.Drugstores and Supermarkets
14.6.7.4.2.Online Pharmacies
14.6.7.4.3.Retail Pharmacies
14.6.7.5.Southeast Asia OTC Dry Eye Drops Market Revenue (US$ Mn) and Forecasts, By Country
14.6.7.5.5.Rest of Southeast Asia
14.6.8.Rest of Asia Pacific
14.6.8.1.Rest of Asia Pacific OTC Dry Eye Drops Market Revenue (US$ Mn) and Forecasts, By Type
14.6.8.2.Rest of Asia Pacific OTC Dry Eye Drops Market Revenue (US$ Mn) and Forecasts, By Product Type
14.6.8.2.1.With Preservatives
14.6.8.2.2.Preservative Free
14.6.8.3.Rest of Asia Pacific OTC Dry Eye Drops Market Revenue (US$ Mn) and Forecasts, By Viscosity
14.6.8.3.2.High Viscosity
14.6.8.4.Rest of Asia Pacific OTC Dry Eye Drops Market Revenue (US$ Mn) and Forecasts, By Distribution Channel
14.6.8.4.1.Drugstores and Supermarkets
14.6.8.4.2.Online Pharmacies
14.6.8.4.3.Retail Pharmacies
14.7.Key Segment for Channeling Investments
14.7.5.By Distribution Channel
15.Middle East and Africa OTC Dry Eye Drops Market Analysis and Forecasts, 2023 – 2031
15.1.Overview
15.1.1.Middle East and Africa OTC Dry Eye Drops Market Revenue (US$ Mn)
15.2.Middle East and Africa OTC Dry Eye Drops Market Revenue (US$ Mn) and Forecasts, By Type
15.3.Middle East and Africa OTC Dry Eye Drops Market Revenue (US$ Mn) and Forecasts, By Product Type
15.3.1.With Preservatives
15.4.Middle East and Africa OTC Dry Eye Drops Market Revenue (US$ Mn) and Forecasts, By Viscosity
15.5.Middle East and Africa OTC Dry Eye Drops Market Revenue (US$ Mn) and Forecasts, By Distribution Channel
15.5.1.Drugstores and Supermarkets
15.6.Middle East and Africa OTC Dry Eye Drops Market Revenue (US$ Mn) and Forecasts, By Country
15.6.1.Saudi Arabia
15.6.1.1.Saudi Arabia OTC Dry Eye Drops Market Revenue (US$ Mn) and Forecasts, By Type
15.6.1.2.Saudi Arabia OTC Dry Eye Drops Market Revenue (US$ Mn) and Forecasts, By Product Type
15.6.1.2.1.With Preservatives
15.6.1.2.2.Preservative Free
15.6.1.3.Saudi Arabia OTC Dry Eye Drops Market Revenue (US$ Mn) and Forecasts, By Viscosity
15.6.1.3.2.High Viscosity
15.6.1.4.Saudi Arabia OTC Dry Eye Drops Market Revenue (US$ Mn) and Forecasts, By Distribution Channel
15.6.1.4.1.Drugstores and Supermarkets
15.6.1.4.2.Online Pharmacies
15.6.1.4.3.Retail Pharmacies
15.6.2.UAE
15.6.2.1.UAE OTC Dry Eye Drops Market Revenue (US$ Mn) and Forecasts, By Type
15.6.2.2.UAE OTC Dry Eye Drops Market Revenue (US$ Mn) and Forecasts, By Product Type
15.6.2.2.1.With Preservatives
15.6.2.2.2.Preservative Free
15.6.2.3.UAE OTC Dry Eye Drops Market Revenue (US$ Mn) and Forecasts, By Viscosity
15.6.2.3.2.High Viscosity
15.6.2.4.UAE OTC Dry Eye Drops Market Revenue (US$ Mn) and Forecasts, By Distribution Channel
15.6.2.4.1.Drugstores and Supermarkets
15.6.2.4.2.Online Pharmacies
15.6.2.4.3.Retail Pharmacies
15.6.3.Egypt
15.6.3.1.Egypt OTC Dry Eye Drops Market Revenue (US$ Mn) and Forecasts, By Type
15.6.3.2.Egypt OTC Dry Eye Drops Market Revenue (US$ Mn) and Forecasts, By Product Type
15.6.3.2.1.With Preservatives
15.6.3.2.2.Preservative Free
15.6.3.3.Egypt OTC Dry Eye Drops Market Revenue (US$ Mn) and Forecasts, By Viscosity
15.6.3.3.2.High Viscosity
15.6.3.4.Egypt OTC Dry Eye Drops Market Revenue (US$ Mn) and Forecasts, By Distribution Channel
15.6.3.4.1.Drugstores and Supermarkets
15.6.3.4.2.Online Pharmacies
15.6.3.4.3.Retail Pharmacies
15.6.4.Kuwait
15.6.4.1.Kuwait OTC Dry Eye Drops Market Revenue (US$ Mn) and Forecasts, By Type
15.6.4.2.Kuwait OTC Dry Eye Drops Market Revenue (US$ Mn) and Forecasts, By Product Type
15.6.4.2.1.With Preservatives
15.6.4.2.2.Preservative Free
15.6.4.3.Kuwait OTC Dry Eye Drops Market Revenue (US$ Mn) and Forecasts, By Viscosity
15.6.4.3.2.High Viscosity
15.6.4.4.Kuwait OTC Dry Eye Drops Market Revenue (US$ Mn) and Forecasts, By Distribution Channel
15.6.4.4.1.Drugstores and Supermarkets
15.6.4.4.2.Online Pharmacies
15.6.4.4.3.Retail Pharmacies
15.6.5.South Africa
15.6.5.1.South Africa OTC Dry Eye Drops Market Revenue (US$ Mn) and Forecasts, By Type
15.6.5.2.South Africa OTC Dry Eye Drops Market Revenue (US$ Mn) and Forecasts, By Product Type
15.6.5.2.1.With Preservatives
15.6.5.2.2.Preservative Free
15.6.5.3.South Africa OTC Dry Eye Drops Market Revenue (US$ Mn) and Forecasts, By Viscosity
15.6.5.3.2.High Viscosity
15.6.5.4.South Africa OTC Dry Eye Drops Market Revenue (US$ Mn) and Forecasts, By Distribution Channel
15.6.5.4.1.Drugstores and Supermarkets
15.6.5.4.2.Online Pharmacies
15.6.5.4.3.Retail Pharmacies
15.6.6.Rest of Middle East & Africa
15.6.6.1.Rest of Middle East & Africa OTC Dry Eye Drops Market Revenue (US$ Mn) and Forecasts, By Type
15.6.6.2.Rest of Middle East & Africa OTC Dry Eye Drops Market Revenue (US$ Mn) and Forecasts, By Product Type
15.6.6.2.1.With Preservatives
15.6.6.2.2.Preservative Free
15.6.6.3.Rest of Middle East & Africa OTC Dry Eye Drops Market Revenue (US$ Mn) and Forecasts, By Viscosity
15.6.6.3.2.High Viscosity
15.6.6.4.Rest of Middle East & Africa OTC Dry Eye Drops Market Revenue (US$ Mn) and Forecasts, By Distribution Channel
15.6.6.4.1.Drugstores and Supermarkets
15.6.6.4.2.Online Pharmacies
15.6.6.4.3.Retail Pharmacies
15.7.Key Segment for Channeling Investments
15.7.5.By Distribution Channel
16.Latin America OTC Dry Eye Drops Market Analysis and Forecasts, 2023 – 2031
16.1.Overview
16.1.1.Latin America OTC Dry Eye Drops Market Revenue (US$ Mn)
16.2.Latin America OTC Dry Eye Drops Market Revenue (US$ Mn) and Forecasts, By Type
16.3.Latin America OTC Dry Eye Drops Market Revenue (US$ Mn) and Forecasts, By Product Type
16.3.1.With Preservatives
16.4.Latin America OTC Dry Eye Drops Market Revenue (US$ Mn) and Forecasts, By Viscosity
16.5.Latin America OTC Dry Eye Drops Market Revenue (US$ Mn) and Forecasts, By Distribution Channel
16.5.1.Drugstores and Supermarkets
16.6.Latin America OTC Dry Eye Drops Market Revenue (US$ Mn) and Forecasts, By Country
16.6.1.Brazil
16.6.1.1.Brazil OTC Dry Eye Drops Market Revenue (US$ Mn) and Forecasts, By Type
16.6.1.2.Brazil OTC Dry Eye Drops Market Revenue (US$ Mn) and Forecasts, By Product Type
16.6.1.2.1.With Preservatives
16.6.1.2.2.Preservative Free
16.6.1.3.Brazil OTC Dry Eye Drops Market Revenue (US$ Mn) and Forecasts, By Viscosity
16.6.1.3.2.High Viscosity
16.6.1.4.Brazil OTC Dry Eye Drops Market Revenue (US$ Mn) and Forecasts, By Distribution Channel
16.6.1.4.1.Drugstores and Supermarkets
16.6.1.4.2.Online Pharmacies
16.6.1.4.3.Retail Pharmacies
16.6.2.Argentina
16.6.2.1.Argentina OTC Dry Eye Drops Market Revenue (US$ Mn) and Forecasts, By Type
16.6.2.2.Argentina OTC Dry Eye Drops Market Revenue (US$ Mn) and Forecasts, By Product Type
16.6.2.2.1.With Preservatives
16.6.2.2.2.Preservative Free
16.6.2.3.Argentina OTC Dry Eye Drops Market Revenue (US$ Mn) and Forecasts, By Viscosity
16.6.2.3.2.High Viscosity
16.6.2.4.Argentina OTC Dry Eye Drops Market Revenue (US$ Mn) and Forecasts, By Distribution Channel
16.6.2.4.1.Drugstores and Supermarkets
16.6.2.4.2.Online Pharmacies
16.6.2.4.3.Retail Pharmacies
16.6.3.Rest of Latin America
16.6.3.1.Rest of Latin America OTC Dry Eye Drops Market Revenue (US$ Mn) and Forecasts, By Type
16.6.3.2.Rest of Latin America OTC Dry Eye Drops Market Revenue (US$ Mn) and Forecasts, By Product Type
16.6.3.2.1.With Preservatives
16.6.3.2.2.Preservative Free
16.6.3.3.Rest of Latin America OTC Dry Eye Drops Market Revenue (US$ Mn) and Forecasts, By Viscosity
16.6.3.3.2.High Viscosity
16.6.3.4.Rest of Latin America OTC Dry Eye Drops Market Revenue (US$ Mn) and Forecasts, By Distribution Channel
16.6.3.4.1.Drugstores and Supermarkets
16.6.3.4.2.Online Pharmacies
16.6.3.4.3.Retail Pharmacies
16.7.Key Segment for Channeling Investments
16.7.5.By Distribution Channel
17.Competitive Benchmarking
17.1.Market Share Analysis, 2022
17.2.Global Presence and Growth Strategies
17.2.1.Mergers and Acquisitions
17.2.3.Investments Trends
18.Player Profiles
18.1.AbbVie Inc.
18.1.5.Financial Analysis
18.1.7.Business Strategies
18.2.Johnson & Johnson Services, Inc.
18.2.5.Financial Analysis
18.2.7.Business Strategies
18.3.Medicom Healthcare Ltd.
18.3.5.Financial Analysis
18.3.7.Business Strategies
18.4.Novartis AG
18.4.5.Financial Analysis
18.4.7.Business Strategies
18.5.Prestige Consumer Healthcare Inc.
18.5.5.Financial Analysis
18.5.7.Business Strategies
18.6.Rohto
18.6.5.Financial Analysis
18.6.7.Business Strategies
18.7.Santen Pharmaceutical Co., Ltd.
18.7.5.Financial Analysis
18.7.7.Business Strategies
18.8.Sentiss
18.8.5.Financial Analysis
18.8.7.Business Strategies
18.9.Other Industry Participants
.
**Exclusive for Multi-User and Enterprise User.
Global OTC Dry Eye Drops Market Segmentation
By Type
By Product Type
By Viscosity
By Distribution Channel
◦ Drugstores and Supermarkets
By Region
◦ North America (U.S., Canada, Mexico, Rest of North America)
◦ Europe (France, The UK, Spain, Germany, Italy, Nordic Countries (Denmark, Finland, Iceland, Sweden, Norway), Benelux Union (Belgium, The Netherlands, Luxembourg), Rest of Europe)
◦ Asia Pacific (China, Japan, India, New Zealand, Australia, South Korea, Southeast Asia (Indonesia, Thailand, Malaysia, Singapore, Rest of Southeast Asia), Rest of Asia Pacific)
◦ Middle East & Africa (Saudi Arabia, UAE, Egypt, Kuwait, South Africa, Rest of Middle East & Africa)
◦ Latin America (Brazil, Argentina, Rest of Latin America)
**Note: The report covers cross-segmentation analysis by region further into countries
The Niche Research approach encompasses both primary and secondary research methods to provide comprehensive insights. While primary research is the cornerstone of our studies, we also incorporate secondary research sources such as company annual reports, premium industry databases, press releases, industry journals, and white papers.
Within our primary research, we actively engage with various industry stakeholders, conducting paid interviews and surveys. Our meticulous analysis extends to every market participant in major countries, allowing us to thoroughly examine their portfolios, calculate market shares, and segment revenues.
Our data collection primarily focuses on individual countries within our research scope, enabling us to estimate regional market sizes. Typically, we employ a bottom-up approach, meticulously tracking trends in different countries. We analyze growth drivers, constraints, technological innovations, and opportunities for each country, ultimately arriving at regional figures.Our process begins by examining the growth prospects of each country. Building upon these insights, we project growth and trends for the entire region. Finally, we utilize our proprietary model to refine estimations and forecasts.
Our data validation standards are integral to ensuring the reliability and accuracy of our research findings. Here’s a breakdown of our data validation processes and the stakeholders we engage with during our primary research:
- Supply Side Analysis: We initiate a supply side analysis by directly contacting market participants, through telephonic interviews and questionnaires containing both open-ended and close-ended questions. We gather information on their portfolios, segment revenues, developments, and growth strategies.
- Demand Side Analysis: To gain insights into adoption trends and consumer preferences, we reach out to target customers and users (non-vendors). This information forms a vital part of the qualitative analysis section of our reports, covering market dynamics, adoption trends, consumer behavior, spending patterns, and other related aspects.
- Consultant Insights: We tap into the expertise of our partner consultants from around the world to obtain their unique viewpoints and perspectives. Their insights contribute to a well-rounded understanding of the markets under investigation.
- In-House Validation: To ensure data accuracy and reliability, we conduct cross-validation of data points and information through our in-house team of consultants and utilize advanced data modeling tools for thorough verification.
The forecasts we provide are based on a comprehensive assessment of various factors, including:
- Market Trends and Past Performance (Last Five Years): We accurately analyze market trends and performance data from preceding five years to identify historical patterns and understand the market’s evolution.
- Historical Performance and Growth of Market Participants: We assess the historical performance and growth trajectories of key market participants. This analysis provides insights into the competitive landscape and individual company strategies.
- Market Determinants Impact Analysis (Next Eight Years): We conduct a rigorous analysis of the factors that are projected to influence the market over the next eight years. This includes assessing both internal and external determinants that can shape market dynamics.
- Drivers and Challenges for the Forecast Period:Identify the factors expected to drive market growth during the forecast period, as well as the challenges that the industry may face. This analysis aids in deriving an accurate growth rate projection.
- New Acquisitions, Collaborations, or Partnerships: We keep a close watch on any new acquisitions, collaborations, or partnerships within the industry. These developments can have a significant impact on market dynamics and competitiveness.
- Macro and Micro Factors Analysis:A thorough examination of both macro-level factors (e.g., economic trends, regulatory changes) and micro-level factors (e.g., technological advancements, consumer preferences) that may influence the market during the forecast period.
- End-User Sentiment Analysis: To understand the market from the end-user perspective, we conduct sentiment analysis. This involves assessing the sentiment, preferences, and feedback of the end-users, which can provide valuable insights into market trends.
- Perspective of Primary Participants: Insights gathered directly from primary research participants play a crucial role in shaping our forecasts. Their perspectives and experiences provide valuable qualitative data.
- Year-on-Year Growth Trend: We utilize a year-on-year growth trend based on historical market growth and expected future trends. This helps in formulating our growth projections, aligning them with the market’s historical performance.
Research process adopted by TNR involves multiple stages, including data collection, validation, quality checks, and presentation. It’s crucial that the data and information we provide add value to your existing market understanding and expertise. We have also established partnerships with business consulting, research, and survey organizations across regions and globally to collaborate on regional analysis and data validation, ensuring the highest level of accuracy and reliability in our reports.