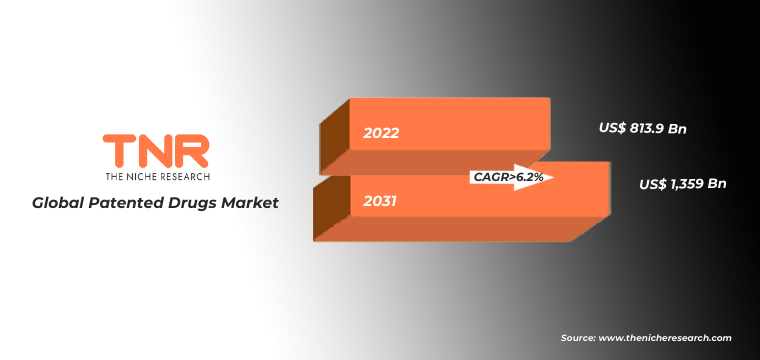
TNR states, Global Patented Drugs Market was Valued USD 813.9 Bn in 2022, Anticipated to Reach USD 1,359 Bn by 2031, Growing With a CAGR of 6.2% (2023-2031)
Patented drugs are a result of extensive research, development, and investment by pharmaceutical companies. The patent system is designed to encourage innovation by providing companies with a limited period of exclusivity during which they can recoup their investments and make a profit. This exclusivity allows them to charge higher prices for the drug to cover the costs of research and development.
Global Patented Drugs Market Revenue & Forecast, (US$ Million), 2015 – 2031
This growing pattern is linked to a limited number of developing, proprietary drugs with quick adoption and high year-over-year price increases, which are more than balancing the steady expansion in generic drug use. These higher prices are borne by both consumers and payers; whereas consumer out-of-pocket expenses for prescription pharmaceuticals have increased by just 3% per year overall, they have increased by 18% per year for patented drugs. Current trends indicate that the significant growth in patented medicine pricing is likely to continue in the coming years.
Trends in the Global Patented Drugs Market
- In the last few years, partnerships between pharmaceutical companies, research institutions, and academia have accelerated drug discovery and development, leading to a higher number of patented drugs. For instance, a sub-licensing agreements has been signed with three Indian companies, Eugia, Hetero, and Dr. Reddy’s Laboratories, along with the Indonesian firm BrightGene by Medicines Patent Pool (MPP). The research and development as well as production of generic versions of Novartis’ cancer treatment drug Nilotinib, making certain cancer drugs more affordable and accessible to patients. The drug is administered for treating chronic myeloid leukaemia (CML), which is a kind of blood cancer.
- Immunotherapy approaches, including checkpoint inhibitors and CAR-T cell therapies, are revolutionizing cancer treatment and contributing to the growth of the patented drugs market. In addition, Merck & Co of the United States plans to patent a new version of its $20 billion cancer treatment Keytruda that can be administered under the skin, enabling it to safeguard its best-selling medication from competition as early as 2028. Thus with these factors the global patented drugs market will exponentially rise during the forecast period.
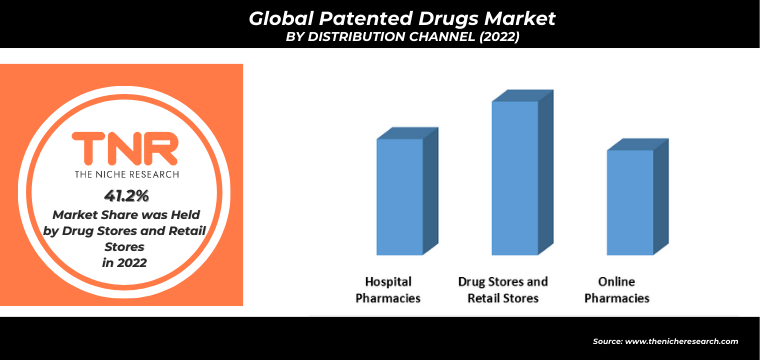
In the last few years, rise of patented drugs being sold on online pharmacies can be attributed to several factors that reflect changes in consumer behavior, advancements in technology, and the global pharmaceutical market. Pharmaceutical companies are partnering with online pharmacies to directly market and distribute their products to consumers, expanding their reach beyond traditional distribution channels. Thus due to favorable reasons such as competitive pricing, variety of medications as well as direct-to-consumer marketing are all supporting the growth of the global patented drugs market.
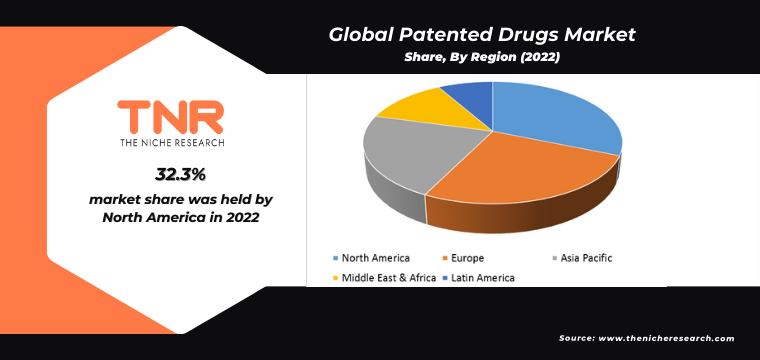
The rising prominence of patented drugs in Asia can be attributed to several factors that reflect the region’s increasing investment in research and development, changing demographics, economic growth, and evolving healthcare systems. Asian countries are increasingly focusing on biotechnology and life sciences, which includes areas like genomics, proteomics, and personalized medicine. This shift has led to the development of more complex and targeted therapies that are often eligible for patent protection contributing to the overall growth of the global patented drugs market.
Competitive Landscape
The competitive landscape in the global patented drugs market is dynamic and shaped by various factors, including innovation, research and development, market share, pricing strategies, regulatory environment, and strategic partnerships. Large pharmaceutical companies such as Pfizer, Roche, Novartis, Johnson & Johnson & AstraZeneca, among others, dominate the market. These companies invest heavily in research and development to bring innovative drugs to market and maintain a competitive edge. A few of key market participants operating in the global patented drugs market are:
- AbbVie Inc.
- Astellas Pharma Inc.
- AstraZeneca plc
- Bayer
- Biogen
- Boehringer Ingelheim International GmbH.
- F. Hoffmann-La Roche AG
- Gilead Sciences Inc
- Helsinn
- Johnson & Johnson
- Novartis AG
- Pf Prism Cv
- Pfizer Inc.
- Viiv
- Other Industry Participants
Global Patented Drugs Market Report Coverage
| Report Specifications |
Details |
| Market Revenue in 2022 |
US$ 813.9 Billion |
| Market Size Forecast by 2031 |
US$ 1,359 Billion |
| Growth Rate (CAGR) |
6.2% |
| Historic Data |
2015 – 2021 |
| Base Year for Estimation |
2022 |
| Forecast Period |
2023 – 2031 |
| Report Inclusions |
Market Size & Estimates, Market Dynamics, Competitive Scenario, Trends, Growth Factors, Market Determinants, Key Investment Segmentation, Product/Service/Solutions Benchmarking |
| Segments Covered |
By Type, By Distribution Channel |
| Regions Covered |
North America, Europe, Asia Pacific, Middle East & Africa, Latin America |
| Countries Covered |
U.S., Canada, Mexico, Rest of North America, France, The UK, Spain, Germany, Italy, Nordic Countries (Denmark, Finland, Iceland, Sweden, Norway), Benelux Union (Belgium, The Netherlands, Luxembourg), Rest of Europe, China, Japan, India, New Zealand, Australia, South Korea, Southeast Asia (Indonesia, Thailand, Malaysia, Singapore, Rest of Southeast Asia), Rest of Asia Pacific, Saudi Arabia, UAE, Egypt, Kuwait, South Africa, Rest of Middle East & Africa, Brazil, Argentina, Rest of Latin America |
| Key Players |
AbbVie Inc., Astellas Pharma Inc., AstraZeneca plc, Bayer, Biogen, Boehringer Ingelheim International GmbH., F. Hoffmann-La Roche AG, Gilead Sciences Inc, Helsinn, Johnson & Johnson, Novartis AG, Pf Prism Cv, Pfizer Inc., Viiv, Other Industry Participants |
| Customization Scope |
Customization allows for the inclusion/modification of content pertaining to geographical regions, countries, and specific market segments. |
| Pricing & Procurement Options |
Explore purchase options tailored to your specific research requirements |
| Contact Details |
Consult With Our Expert
Japan (Toll-Free): +81 663-386-8111
South Korea (Toll-Free): +82-808-703-126
Saudi Arabia (Toll-Free): +966 800-850-1643
United Kingdom: +44 753-710-5080
United States: +1 302-232-5106
E-mail: askanexpert@thenicheresearch.com
|
Global Patented Drugs Market
By Type
- Small Molecule Drugs
- Biologics
- Vaccines
- Gene Therapies
- Antiviral Drugs
- Anti-inflammatory Drugs
- Neurological Drugs
- Cancer Drugs
- Cardiovascular Drugs
- Others
By Distribution Channel
- Hospital Pharmacies
- Drug Stores and Retail Stores
- Online Pharmacies
By Region
- North America (U.S., Canada, Mexico, Rest of North America)
- Europe (France, The UK, Spain, Germany, Italy, Nordic Countries (Denmark, Finland, Iceland, Sweden, Norway), Benelux Union (Belgium, The Netherlands, Luxembourg), Rest of Europe)
- Asia Pacific (China, Japan, India, New Zealand, Australia, South Korea, Southeast Asia (Indonesia, Thailand, Malaysia, Singapore, Rest of Southeast Asia), Rest of Asia Pacific)
- Middle East & Africa (Saudi Arabia, UAE, Egypt, Kuwait, South Africa, Rest of Middle East & Africa)
- Latin America (Brazil, Argentina, Rest of Latin America)
Report Coverage and Deliverables:
Table of Contents
.
1.Market Scope
1.2.Years Considered
1.2.1.Historic Years: 2015 – 2021
1.2.3.Forecast Years: 2023 – 2031
3.Research Methodology
3.1.Primary Research
3.1.1.Research Questionnaire
3.1.2.Global Percentage Breakdown
3.1.3.Primary Interviews: Key Opinion Leaders (KOLs)
3.3.Market Size Estimates
3.4.Data Triangulation Methodology
4.Recommendations and Insights from TNR’s Perspective**
5.Holistic Overview of Patented Drugs Market
6.Market Synopsis: Patented Drugs Market
7.Patented Drugs Market Analysis: Qualitative Perspective
7.1.Introduction
7.1.2.Industry Development
7.3.Trends in Patented Drugs Market
7.4.Market Determinants Radar Chart
7.5.Macro-Economic and Micro-Economic Indicators: Patented Drugs Market
7.6.Porter’s Five Force Analysis
7.7.Impact of Covid-19 on Patented Drugs Market
8.Global Patented Drugs Market Analysis and Forecasts, 2023 – 2031
8.1.Overview
8.1.1.Global Patented Drugs Market Revenue (US$ Mn)
8.2.Global Patented Drugs Market Revenue (US$ Mn) and Forecasts, By Type
8.2.1.Small Molecule Drugs
8.2.1.2.Market Estimation and Penetration, 2015 – 2022
8.2.1.3.Market Forecast, 2023 – 2031
8.2.1.4.Compound Annual Growth Rate (CAGR)
8.2.1.5.Regional Bifurcation
8.2.1.5.1.North America
8.2.1.5.1.1.Market Estimation, 2015 – 2022
8.2.1.5.1.2.Market Forecast, 2023 – 2031
8.2.1.5.2.Europe
8.2.1.5.2.1.Market Estimation, 2015 – 2022
8.2.1.5.2.2.Market Forecast, 2023 – 2031
8.2.1.5.3.Asia Pacific
8.2.1.5.3.1.Market Estimation, 2015 – 2022
8.2.1.5.3.2.Market Forecast, 2023 – 2031
8.2.1.5.4.Middle East and Africa
8.2.1.5.4.1.Market Estimation, 2015 – 2022
8.2.1.5.4.2.Market Forecast, 2023 – 2031
8.2.1.5.5.Latin America
8.2.1.5.5.1.Market Estimation, 2015 – 2022
8.2.1.5.5.2.Market Forecast, 2023 – 2031
8.2.2.Biologics
8.2.2.2.Market Estimation and Penetration, 2015 – 2022
8.2.2.3.Market Forecast, 2023 – 2031
8.2.2.4.Compound Annual Growth Rate (CAGR)
8.2.2.5.Regional Bifurcation
8.2.2.5.1.North America
8.2.2.5.1.1.Market Estimation, 2015 – 2022
8.2.2.5.1.2.Market Forecast, 2023 – 2031
8.2.2.5.2.Europe
8.2.2.5.2.1.Market Estimation, 2015 – 2022
8.2.2.5.2.2.Market Forecast, 2023 – 2031
8.2.2.5.3.Asia Pacific
8.2.2.5.3.1.Market Estimation, 2015 – 2022
8.2.2.5.3.2.Market Forecast, 2023 – 2031
8.2.2.5.4.Middle East and Africa
8.2.2.5.4.1.Market Estimation, 2015 – 2022
8.2.2.5.4.2.Market Forecast, 2023 – 2031
8.2.2.5.5.Latin America
8.2.2.5.5.1.Market Estimation, 2015 – 2022
8.2.2.5.5.2.Market Forecast, 2023 – 2031
8.2.3.Vaccines
8.2.3.2.Market Estimation and Penetration, 2015 – 2022
8.2.3.3.Market Forecast, 2023 – 2031
8.2.3.4.Compound Annual Growth Rate (CAGR)
8.2.3.5.Regional Bifurcation
8.2.3.5.1.North America
8.2.3.5.1.1.Market Estimation, 2015 – 2022
8.2.3.5.1.2.Market Forecast, 2023 – 2031
8.2.3.5.2.Europe
8.2.3.5.2.1.Market Estimation, 2015 – 2022
8.2.3.5.2.2.Market Forecast, 2023 – 2031
8.2.3.5.3.Asia Pacific
8.2.3.5.3.1.Market Estimation, 2015 – 2022
8.2.3.5.3.2.Market Forecast, 2023 – 2031
8.2.3.5.4.Middle East and Africa
8.2.3.5.4.1.Market Estimation, 2015 – 2022
8.2.3.5.4.2.Market Forecast, 2023 – 2031
8.2.3.5.5.Latin America
8.2.3.5.5.1.Market Estimation, 2015 – 2022
8.2.3.5.5.2.Market Forecast, 2023 – 2031
8.2.4.Gene Therapies
8.2.4.2.Market Estimation and Penetration, 2015 – 2022
8.2.4.3.Market Forecast, 2023 – 2031
8.2.4.4.Compound Annual Growth Rate (CAGR)
8.2.4.5.Regional Bifurcation
8.2.4.5.1.North America
8.2.4.5.1.1.Market Estimation, 2015 – 2022
8.2.4.5.1.2.Market Forecast, 2023 – 2031
8.2.4.5.2.Europe
8.2.4.5.2.1.Market Estimation, 2015 – 2022
8.2.4.5.2.2.Market Forecast, 2023 – 2031
8.2.4.5.3.Asia Pacific
8.2.4.5.3.1.Market Estimation, 2015 – 2022
8.2.4.5.3.2.Market Forecast, 2023 – 2031
8.2.4.5.4.Middle East and Africa
8.2.4.5.4.1.Market Estimation, 2015 – 2022
8.2.4.5.4.2.Market Forecast, 2023 – 2031
8.2.4.5.5.Latin America
8.2.4.5.5.1.Market Estimation, 2015 – 2022
8.2.4.5.5.2.Market Forecast, 2023 – 2031
8.2.5.Antiviral Drugs
8.2.5.2.Market Estimation and Penetration, 2015 – 2022
8.2.5.3.Market Forecast, 2023 – 2031
8.2.5.4.Compound Annual Growth Rate (CAGR)
8.2.5.5.Regional Bifurcation
8.2.5.5.1.North America
8.2.5.5.1.1.Market Estimation, 2015 – 2022
8.2.5.5.1.2.Market Forecast, 2023 – 2031
8.2.5.5.2.Europe
8.2.5.5.2.1.Market Estimation, 2015 – 2022
8.2.5.5.2.2.Market Forecast, 2023 – 2031
8.2.5.5.3.Asia Pacific
8.2.5.5.3.1.Market Estimation, 2015 – 2022
8.2.5.5.3.2.Market Forecast, 2023 – 2031
8.2.5.5.4.Middle East and Africa
8.2.5.5.4.1.Market Estimation, 2015 – 2022
8.2.5.5.4.2.Market Forecast, 2023 – 2031
8.2.5.5.5.Latin America
8.2.5.5.5.1.Market Estimation, 2015 – 2022
8.2.5.5.5.2.Market Forecast, 2023 – 2031
8.2.6.Anti-inflammatory Drugs
8.2.6.2.Market Estimation and Penetration, 2015 – 2022
8.2.6.3.Market Forecast, 2023 – 2031
8.2.6.4.Compound Annual Growth Rate (CAGR)
8.2.6.5.Regional Bifurcation
8.2.6.5.1.North America
8.2.6.5.1.1.Market Estimation, 2015 – 2022
8.2.6.5.1.2.Market Forecast, 2023 – 2031
8.2.6.5.2.Europe
8.2.6.5.2.1.Market Estimation, 2015 – 2022
8.2.6.5.2.2.Market Forecast, 2023 – 2031
8.2.6.5.3.Asia Pacific
8.2.6.5.3.1.Market Estimation, 2015 – 2022
8.2.6.5.3.2.Market Forecast, 2023 – 2031
8.2.6.5.4.Middle East and Africa
8.2.6.5.4.1.Market Estimation, 2015 – 2022
8.2.6.5.4.2.Market Forecast, 2023 – 2031
8.2.6.5.5.Latin America
8.2.6.5.5.1.Market Estimation, 2015 – 2022
8.2.6.5.5.2.Market Forecast, 2023 – 2031
8.2.7.Neurological Drugs
8.2.7.2.Market Estimation and Penetration, 2015 – 2022
8.2.7.3.Market Forecast, 2023 – 2031
8.2.7.4.Compound Annual Growth Rate (CAGR)
8.2.7.5.Regional Bifurcation
8.2.7.5.1.North America
8.2.7.5.1.1.Market Estimation, 2015 – 2022
8.2.7.5.1.2.Market Forecast, 2023 – 2031
8.2.7.5.2.Europe
8.2.7.5.2.1.Market Estimation, 2015 – 2022
8.2.7.5.2.2.Market Forecast, 2023 – 2031
8.2.7.5.3.Asia Pacific
8.2.7.5.3.1.Market Estimation, 2015 – 2022
8.2.7.5.3.2.Market Forecast, 2023 – 2031
8.2.7.5.4.Middle East and Africa
8.2.7.5.4.1.Market Estimation, 2015 – 2022
8.2.7.5.4.2.Market Forecast, 2023 – 2031
8.2.7.5.5.Latin America
8.2.7.5.5.1.Market Estimation, 2015 – 2022
8.2.7.5.5.2.Market Forecast, 2023 – 2031
8.2.8.Cancer Drugs
8.2.8.2.Market Estimation and Penetration, 2015 – 2022
8.2.8.3.Market Forecast, 2023 – 2031
8.2.8.4.Compound Annual Growth Rate (CAGR)
8.2.8.5.Regional Bifurcation
8.2.8.5.1.North America
8.2.8.5.1.1.Market Estimation, 2015 – 2022
8.2.8.5.1.2.Market Forecast, 2023 – 2031
8.2.8.5.2.Europe
8.2.8.5.2.1.Market Estimation, 2015 – 2022
8.2.8.5.2.2.Market Forecast, 2023 – 2031
8.2.8.5.3.Asia Pacific
8.2.8.5.3.1.Market Estimation, 2015 – 2022
8.2.8.5.3.2.Market Forecast, 2023 – 2031
8.2.8.5.4.Middle East and Africa
8.2.8.5.4.1.Market Estimation, 2015 – 2022
8.2.8.5.4.2.Market Forecast, 2023 – 2031
8.2.8.5.5.Latin America
8.2.8.5.5.1.Market Estimation, 2015 – 2022
8.2.8.5.5.2.Market Forecast, 2023 – 2031
8.2.9.Cardiovascular Drugs
8.2.9.2.Market Estimation and Penetration, 2015 – 2022
8.2.9.3.Market Forecast, 2023 – 2031
8.2.9.4.Compound Annual Growth Rate (CAGR)
8.2.9.5.Regional Bifurcation
8.2.9.5.1.North America
8.2.9.5.1.1.Market Estimation, 2015 – 2022
8.2.9.5.1.2.Market Forecast, 2023 – 2031
8.2.9.5.2.Europe
8.2.9.5.2.1.Market Estimation, 2015 – 2022
8.2.9.5.2.2.Market Forecast, 2023 – 2031
8.2.9.5.3.Asia Pacific
8.2.9.5.3.1.Market Estimation, 2015 – 2022
8.2.9.5.3.2.Market Forecast, 2023 – 2031
8.2.9.5.4.Middle East and Africa
8.2.9.5.4.1.Market Estimation, 2015 – 2022
8.2.9.5.4.2.Market Forecast, 2023 – 2031
8.2.9.5.5.Latin America
8.2.9.5.5.1.Market Estimation, 2015 – 2022
8.2.9.5.5.2.Market Forecast, 2023 – 2031
8.2.10.Others
8.2.10.2.Market Estimation and Penetration, 2015 – 2022
8.2.10.3.Market Forecast, 2023 – 2031
8.2.10.4.Compound Annual Growth Rate (CAGR)
8.2.10.5.Regional Bifurcation
8.2.10.5.1.North America
8.2.10.5.1.1.Market Estimation, 2015 – 2022
8.2.10.5.1.2.Market Forecast, 2023 – 2031
8.2.10.5.2.Europe
8.2.10.5.2.1.Market Estimation, 2015 – 2022
8.2.10.5.2.2.Market Forecast, 2023 – 2031
8.2.10.5.3.Asia Pacific
8.2.10.5.3.1.Market Estimation, 2015 – 2022
8.2.10.5.3.2.Market Forecast, 2023 – 2031
8.2.10.5.4.Middle East and Africa
8.2.10.5.4.1.Market Estimation, 2015 – 2022
8.2.10.5.4.2.Market Forecast, 2023 – 2031
8.2.10.5.5.Latin America
8.2.10.5.5.1.Market Estimation, 2015 – 2022
8.2.10.5.5.2.Market Forecast, 2023 – 2031
8.3.Key Segment for Channeling Investments
9.Global Patented Drugs Market Analysis and Forecasts, 2023 – 2031
9.2.Global Patented Drugs Market Revenue (US$ Mn) and Forecasts, By Distribution Channel
9.2.1.Hospital Pharmacies
9.2.1.2.Market Estimation and Penetration, 2015 – 2022
9.2.1.3.Market Forecast, 2023 – 2031
9.2.1.4.Compound Annual Growth Rate (CAGR)
9.2.1.5.Regional Bifurcation
9.2.1.5.1.North America
9.2.1.5.1.1.Market Estimation, 2015 – 2022
9.2.1.5.1.2.Market Forecast, 2023 – 2031
9.2.1.5.2.Europe
9.2.1.5.2.1.Market Estimation, 2015 – 2022
9.2.1.5.2.2.Market Forecast, 2023 – 2031
9.2.1.5.3.Asia Pacific
9.2.1.5.3.1.Market Estimation, 2015 – 2022
9.2.1.5.3.2.Market Forecast, 2023 – 2031
9.2.1.5.4.Middle East and Africa
9.2.1.5.4.1.Market Estimation, 2015 – 2022
9.2.1.5.4.2.Market Forecast, 2023 – 2031
9.2.1.5.5.Latin America
9.2.1.5.5.1.Market Estimation, 2015 – 2022
9.2.1.5.5.2.Market Forecast, 2023 – 2031
9.2.2.Drug Stores and Retail Stores
9.2.2.2.Market Estimation and Penetration, 2015 – 2022
9.2.2.3.Market Forecast, 2023 – 2031
9.2.2.4.Compound Annual Growth Rate (CAGR)
9.2.2.5.Regional Bifurcation
9.2.2.5.1.North America
9.2.2.5.1.1.Market Estimation, 2015 – 2022
9.2.2.5.1.2.Market Forecast, 2023 – 2031
9.2.2.5.2.Europe
9.2.2.5.2.1.Market Estimation, 2015 – 2022
9.2.2.5.2.2.Market Forecast, 2023 – 2031
9.2.2.5.3.Asia Pacific
9.2.2.5.3.1.Market Estimation, 2015 – 2022
9.2.2.5.3.2.Market Forecast, 2023 – 2031
9.2.2.5.4.Middle East and Africa
9.2.2.5.4.1.Market Estimation, 2015 – 2022
9.2.2.5.4.2.Market Forecast, 2023 – 2031
9.2.2.5.5.Latin America
9.2.2.5.5.1.Market Estimation, 2015 – 2022
9.2.2.5.5.2.Market Forecast, 2023 – 2031
9.2.3.Online Pharmacies
9.2.3.2.Market Estimation and Penetration, 2015 – 2022
9.2.3.3.Market Forecast, 2023 – 2031
9.2.3.4.Compound Annual Growth Rate (CAGR)
9.2.3.5.Regional Bifurcation
9.2.3.5.1.North America
9.2.3.5.1.1.Market Estimation, 2015 – 2022
9.2.3.5.1.2.Market Forecast, 2023 – 2031
9.2.3.5.2.Europe
9.2.3.5.2.1.Market Estimation, 2015 – 2022
9.2.3.5.2.2.Market Forecast, 2023 – 2031
9.2.3.5.3.Asia Pacific
9.2.3.5.3.1.Market Estimation, 2015 – 2022
9.2.3.5.3.2.Market Forecast, 2023 – 2031
9.2.3.5.4.Middle East and Africa
9.2.3.5.4.1.Market Estimation, 2015 – 2022
9.2.3.5.4.2.Market Forecast, 2023 – 2031
9.2.3.5.5.Latin America
9.2.3.5.5.1.Market Estimation, 2015 – 2022
9.2.3.5.5.2.Market Forecast, 2023 – 2031
9.3.Key Segment for Channeling Investments
9.3.1.By Distribution Channel
10.North America Patented Drugs Market Analysis and Forecasts, 2023 – 2031
10.1.Overview
10.1.1.North America Patented Drugs Market Revenue (US$ Mn)
10.2.North America Patented Drugs Market Revenue (US$ Mn) and Forecasts, By Type
10.2.1.Small Molecule Drugs
10.2.6.Anti-inflammatory Drugs
10.2.7.Neurological Drugs
10.2.9.Cardiovascular Drugs
10.3.North America Patented Drugs Market Revenue (US$ Mn) and Forecasts, By Distribution Channel
10.3.1.Hospital Pharmacies
10.3.2.Drug Stores and Retail Stores
10.4.North America Patented Drugs Market Revenue (US$ Mn) and Forecasts, By Country
10.4.1.U.S
10.4.1.1.U.S Patented Drugs Market Revenue (US$ Mn) and Forecasts, By Type
10.4.1.1.1.Small Molecule Drugs
10.4.1.1.4.Gene Therapies
10.4.1.1.5.Antiviral Drugs
10.4.1.1.6.Anti-inflammatory Drugs
10.4.1.1.7.Neurological Drugs
10.4.1.1.9.Cardiovascular Drugs
10.4.1.2.U.S Patented Drugs Market Revenue (US$ Mn) and Forecasts, By Distribution Channel
10.4.1.2.1.Hospital Pharmacies
10.4.1.2.2.Drug Stores and Retail Stores
10.4.1.2.3.Online Pharmacies
10.4.2.Canada
10.4.2.1.Canada Patented Drugs Market Revenue (US$ Mn) and Forecasts, By Type
10.4.2.1.1.Small Molecule Drugs
10.4.2.1.4.Gene Therapies
10.4.2.1.5.Antiviral Drugs
10.4.2.1.6.Anti-inflammatory Drugs
10.4.2.1.7.Neurological Drugs
10.4.2.1.9.Cardiovascular Drugs
10.4.2.2.Canada Patented Drugs Market Revenue (US$ Mn) and Forecasts, By Distribution Channel
10.4.2.2.1.Hospital Pharmacies
10.4.2.2.2.Drug Stores and Retail Stores
10.4.2.2.3.Online Pharmacies
10.4.3.Mexico
10.4.3.1.Mexico Patented Drugs Market Revenue (US$ Mn) and Forecasts, By Type
10.4.3.1.1.Small Molecule Drugs
10.4.3.1.4.Gene Therapies
10.4.3.1.5.Antiviral Drugs
10.4.3.1.6.Anti-inflammatory Drugs
10.4.3.1.7.Neurological Drugs
10.4.3.1.9.Cardiovascular Drugs
10.4.3.2.Mexico Patented Drugs Market Revenue (US$ Mn) and Forecasts, By Distribution Channel
10.4.3.2.1.Hospital Pharmacies
10.4.3.2.2.Drug Stores and Retail Stores
10.4.3.2.3.Online Pharmacies
10.4.4.Rest of North America
10.4.4.1.Rest of North America Patented Drugs Market Revenue (US$ Mn) and Forecasts, By Type
10.4.4.1.1.Small Molecule Drugs
10.4.4.1.4.Gene Therapies
10.4.4.1.5.Antiviral Drugs
10.4.4.1.6.Anti-inflammatory Drugs
10.4.4.1.7.Neurological Drugs
10.4.4.1.9.Cardiovascular Drugs
10.4.4.2.Rest of North America Patented Drugs Market Revenue (US$ Mn) and Forecasts, By Distribution Channel
10.4.4.2.1.Hospital Pharmacies
10.4.4.2.2.Drug Stores and Retail Stores
10.4.4.2.3.Online Pharmacies
10.5.Key Segment for Channeling Investments
10.5.3.By Distribution Channel
11.Europe Patented Drugs Market Analysis and Forecasts, 2023 – 2031
11.1.Overview
11.1.1.Europe Patented Drugs Market Revenue (US$ Mn)
11.2.Europe Patented Drugs Market Revenue (US$ Mn) and Forecasts, By Type
11.2.1.Small Molecule Drugs
11.2.6.Anti-inflammatory Drugs
11.2.7.Neurological Drugs
11.2.9.Cardiovascular Drugs
11.3.Europe Patented Drugs Market Revenue (US$ Mn) and Forecasts, By Distribution Channel
11.3.1.Hospital Pharmacies
11.3.2.Drug Stores and Retail Stores
11.4.Europe Patented Drugs Market Revenue (US$ Mn) and Forecasts, By Country
11.4.1.France
11.4.1.1.France Patented Drugs Market Revenue (US$ Mn) and Forecasts, By Type
11.4.1.1.1.Small Molecule Drugs
11.4.1.1.4.Gene Therapies
11.4.1.1.5.Antiviral Drugs
11.4.1.1.6.Anti-inflammatory Drugs
11.4.1.1.7.Neurological Drugs
11.4.1.1.9.Cardiovascular Drugs
11.4.1.2.France Patented Drugs Market Revenue (US$ Mn) and Forecasts, By Distribution Channel
11.4.1.2.1.Hospital Pharmacies
11.4.1.2.2.Drug Stores and Retail Stores
11.4.1.2.3.Online Pharmacies
11.4.2.The UK
11.4.2.1.The UK Patented Drugs Market Revenue (US$ Mn) and Forecasts, By Type
11.4.2.1.1.Small Molecule Drugs
11.4.2.1.4.Gene Therapies
11.4.2.1.5.Antiviral Drugs
11.4.2.1.6.Anti-inflammatory Drugs
11.4.2.1.7.Neurological Drugs
11.4.2.1.9.Cardiovascular Drugs
11.4.2.2.The UK Patented Drugs Market Revenue (US$ Mn) and Forecasts, By Distribution Channel
11.4.2.2.1.Hospital Pharmacies
11.4.2.2.2.Drug Stores and Retail Stores
11.4.2.2.3.Online Pharmacies
11.4.3.Spain
11.4.3.1.Spain Patented Drugs Market Revenue (US$ Mn) and Forecasts, By Type
11.4.3.1.1.Small Molecule Drugs
11.4.3.1.4.Gene Therapies
11.4.3.1.5.Antiviral Drugs
11.4.3.1.6.Anti-inflammatory Drugs
11.4.3.1.7.Neurological Drugs
11.4.3.1.9.Cardiovascular Drugs
11.4.3.2.Spain Patented Drugs Market Revenue (US$ Mn) and Forecasts, By Distribution Channel
11.4.3.2.1.Hospital Pharmacies
11.4.3.2.2.Drug Stores and Retail Stores
11.4.3.2.3.Online Pharmacies
11.4.4.Germany
11.4.4.1.Germany Patented Drugs Market Revenue (US$ Mn) and Forecasts, By Type
11.4.4.1.1.Small Molecule Drugs
11.4.4.1.4.Gene Therapies
11.4.4.1.5.Antiviral Drugs
11.4.4.1.6.Anti-inflammatory Drugs
11.4.4.1.7.Neurological Drugs
11.4.4.1.9.Cardiovascular Drugs
11.4.4.2.Germany Patented Drugs Market Revenue (US$ Mn) and Forecasts, By Distribution Channel
11.4.4.2.1.Hospital Pharmacies
11.4.4.2.2.Drug Stores and Retail Stores
11.4.4.2.3.Online Pharmacies
11.4.5.Italy
11.4.5.1.Italy Patented Drugs Market Revenue (US$ Mn) and Forecasts, By Type
11.4.5.1.1.Small Molecule Drugs
11.4.5.1.4.Gene Therapies
11.4.5.1.5.Antiviral Drugs
11.4.5.1.6.Anti-inflammatory Drugs
11.4.5.1.7.Neurological Drugs
11.4.5.1.9.Cardiovascular Drugs
11.4.5.2.Italy Patented Drugs Market Revenue (US$ Mn) and Forecasts, By Distribution Channel
11.4.5.2.1.Hospital Pharmacies
11.4.5.2.2.Drug Stores and Retail Stores
11.4.5.2.3.Online Pharmacies
11.4.6.Nordic Countries
11.4.6.1.Nordic Countries Patented Drugs Market Revenue (US$ Mn) and Forecasts, By Type
11.4.6.1.1.Small Molecule Drugs
11.4.6.1.4.Gene Therapies
11.4.6.1.5.Antiviral Drugs
11.4.6.1.6.Anti-inflammatory Drugs
11.4.6.1.7.Neurological Drugs
11.4.6.1.9.Cardiovascular Drugs
11.4.6.2.Nordic Countries Patented Drugs Market Revenue (US$ Mn) and Forecasts, By Distribution Channel
11.4.6.2.1.Hospital Pharmacies
11.4.6.2.2.Drug Stores and Retail Stores
11.4.6.2.3.Online Pharmacies
11.4.6.3.Nordic Countries Patented Drugs Market Revenue (US$ Mn) and Forecasts, By Country
11.4.7.Benelux Union
11.4.7.1.Benelux Union Patented Drugs Market Revenue (US$ Mn) and Forecasts, By Type
11.4.7.1.1.Small Molecule Drugs
11.4.7.1.4.Gene Therapies
11.4.7.1.5.Antiviral Drugs
11.4.7.1.6.Anti-inflammatory Drugs
11.4.7.1.7.Neurological Drugs
11.4.7.1.9.Cardiovascular Drugs
11.4.7.2.Benelux Union Patented Drugs Market Revenue (US$ Mn) and Forecasts, By Distribution Channel
11.4.7.2.1.Hospital Pharmacies
11.4.7.2.2.Drug Stores and Retail Stores
11.4.7.2.3.Online Pharmacies
11.4.7.3.Benelux Union Patented Drugs Market Revenue (US$ Mn) and Forecasts, By Country
11.4.7.3.2.The Netherlands
11.4.8.Rest of Europe
11.4.8.1.Rest of Europe Patented Drugs Market Revenue (US$ Mn) and Forecasts, By Type
11.4.8.1.1.Small Molecule Drugs
11.4.8.1.4.Gene Therapies
11.4.8.1.5.Antiviral Drugs
11.4.8.1.6.Anti-inflammatory Drugs
11.4.8.1.7.Neurological Drugs
11.4.8.1.9.Cardiovascular Drugs
11.4.8.2.Rest of Europe Patented Drugs Market Revenue (US$ Mn) and Forecasts, By Distribution Channel
11.4.8.2.1.Hospital Pharmacies
11.4.8.2.2.Drug Stores and Retail Stores
11.4.8.2.3.Online Pharmacies
11.5.Key Segment for Channeling Investments
11.5.3.By Distribution Channel
12.Asia Pacific Patented Drugs Market Analysis and Forecasts, 2023 – 2031
12.1.Overview
12.1.1.Asia Pacific Patented Drugs Market Revenue (US$ Mn)
12.2.Asia Pacific Patented Drugs Market Revenue (US$ Mn) and Forecasts, By Type
12.2.1.Small Molecule Drugs
12.2.6.Anti-inflammatory Drugs
12.2.7.Neurological Drugs
12.2.9.Cardiovascular Drugs
12.3.Asia Pacific Patented Drugs Market Revenue (US$ Mn) and Forecasts, By Distribution Channel
12.3.1.Hospital Pharmacies
12.3.2.Drug Stores and Retail Stores
12.4.Asia Pacific Patented Drugs Market Revenue (US$ Mn) and Forecasts, By Country
12.4.1.China
12.4.1.1.China Patented Drugs Market Revenue (US$ Mn) and Forecasts, By Type
12.4.1.1.1.Small Molecule Drugs
12.4.1.1.4.Gene Therapies
12.4.1.1.5.Antiviral Drugs
12.4.1.1.6.Anti-inflammatory Drugs
12.4.1.1.7.Neurological Drugs
12.4.1.1.9.Cardiovascular Drugs
12.4.1.2.China Patented Drugs Market Revenue (US$ Mn) and Forecasts, By Distribution Channel
12.4.1.2.1.Hospital Pharmacies
12.4.1.2.2.Drug Stores and Retail Stores
12.4.1.2.3.Online Pharmacies
12.4.2.Japan
12.4.2.1.Japan Patented Drugs Market Revenue (US$ Mn) and Forecasts, By Type
12.4.2.1.1.Small Molecule Drugs
12.4.2.1.4.Gene Therapies
12.4.2.1.5.Antiviral Drugs
12.4.2.1.6.Anti-inflammatory Drugs
12.4.2.1.7.Neurological Drugs
12.4.2.1.9.Cardiovascular Drugs
12.4.2.2.Japan Patented Drugs Market Revenue (US$ Mn) and Forecasts, By Distribution Channel
12.4.2.2.1.Hospital Pharmacies
12.4.2.2.2.Drug Stores and Retail Stores
12.4.2.2.3.Online Pharmacies
12.4.3.India
12.4.3.1.India Patented Drugs Market Revenue (US$ Mn) and Forecasts, By Type
12.4.3.1.1.Small Molecule Drugs
12.4.3.1.4.Gene Therapies
12.4.3.1.5.Antiviral Drugs
12.4.3.1.6.Anti-inflammatory Drugs
12.4.3.1.7.Neurological Drugs
12.4.3.1.9.Cardiovascular Drugs
12.4.3.2.India Patented Drugs Market Revenue (US$ Mn) and Forecasts, By Distribution Channel
12.4.3.2.1.Hospital Pharmacies
12.4.3.2.2.Drug Stores and Retail Stores
12.4.3.2.3.Online Pharmacies
12.4.4.New Zealand
12.4.4.1.New Zealand Patented Drugs Market Revenue (US$ Mn) and Forecasts, By Type
12.4.4.1.1.Small Molecule Drugs
12.4.4.1.4.Gene Therapies
12.4.4.1.5.Antiviral Drugs
12.4.4.1.6.Anti-inflammatory Drugs
12.4.4.1.7.Neurological Drugs
12.4.4.1.9.Cardiovascular Drugs
12.4.4.2.New Zealand Patented Drugs Market Revenue (US$ Mn) and Forecasts, By Distribution Channel
12.4.4.2.1.Hospital Pharmacies
12.4.4.2.2.Drug Stores and Retail Stores
12.4.4.2.3.Online Pharmacies
12.4.5.Australia
12.4.5.1.Australia Patented Drugs Market Revenue (US$ Mn) and Forecasts, By Type
12.4.5.1.1.Small Molecule Drugs
12.4.5.1.4.Gene Therapies
12.4.5.1.5.Antiviral Drugs
12.4.5.1.6.Anti-inflammatory Drugs
12.4.5.1.7.Neurological Drugs
12.4.5.1.9.Cardiovascular Drugs
12.4.5.2.Australia Patented Drugs Market Revenue (US$ Mn) and Forecasts, By Distribution Channel
12.4.5.2.1.Hospital Pharmacies
12.4.5.2.2.Drug Stores and Retail Stores
12.4.5.2.3.Online Pharmacies
12.4.6.South Korea
12.4.6.1.South Korea Patented Drugs Market Revenue (US$ Mn) and Forecasts, By Type
12.4.6.1.1.Small Molecule Drugs
12.4.6.1.4.Gene Therapies
12.4.6.1.5.Antiviral Drugs
12.4.6.1.6.Anti-inflammatory Drugs
12.4.6.1.7.Neurological Drugs
12.4.6.1.9.Cardiovascular Drugs
12.4.6.2.South Korea Patented Drugs Market Revenue (US$ Mn) and Forecasts, By Distribution Channel
12.4.6.2.1.Hospital Pharmacies
12.4.6.2.2.Drug Stores and Retail Stores
12.4.6.2.3.Online Pharmacies
12.4.7.Southeast Asia
12.4.7.1.Southeast Asia Patented Drugs Market Revenue (US$ Mn) and Forecasts, By Type
12.4.7.1.1.Small Molecule Drugs
12.4.7.1.4.Gene Therapies
12.4.7.1.5.Antiviral Drugs
12.4.7.1.6.Anti-inflammatory Drugs
12.4.7.1.7.Neurological Drugs
12.4.7.1.9.Cardiovascular Drugs
12.4.7.2.Southeast Asia Patented Drugs Market Revenue (US$ Mn) and Forecasts, By Distribution Channel
12.4.7.2.1.Hospital Pharmacies
12.4.7.2.2.Drug Stores and Retail Stores
12.4.7.2.3.Online Pharmacies
12.4.7.3.Southeast Asia Patented Drugs Market Revenue (US$ Mn) and Forecasts, By Country
12.4.7.3.5.Rest of Southeast Asia
12.4.8.Rest of Asia Pacific
12.4.8.1.Rest of Asia Pacific Patented Drugs Market Revenue (US$ Mn) and Forecasts, By Type
12.4.8.1.1.Small Molecule Drugs
12.4.8.1.4.Gene Therapies
12.4.8.1.5.Antiviral Drugs
12.4.8.1.6.Anti-inflammatory Drugs
12.4.8.1.7.Neurological Drugs
12.4.8.1.9.Cardiovascular Drugs
12.4.8.2.Rest of Asia Pacific Patented Drugs Market Revenue (US$ Mn) and Forecasts, By Distribution Channel
12.4.8.2.1.Hospital Pharmacies
12.4.8.2.2.Drug Stores and Retail Stores
12.4.8.2.3.Online Pharmacies
12.5.Key Segment for Channeling Investments
12.5.3.By Distribution Channel
13.Middle East and Africa Patented Drugs Market Analysis and Forecasts, 2023 – 2031
13.1.Overview
13.1.1.Middle East and Africa Patented Drugs Market Revenue (US$ Mn)
13.2.Middle East and Africa Patented Drugs Market Revenue (US$ Mn) and Forecasts, By Type
13.2.1.Small Molecule Drugs
13.2.6.Anti-inflammatory Drugs
13.2.7.Neurological Drugs
13.2.9.Cardiovascular Drugs
13.3.Middle East and Africa Patented Drugs Market Revenue (US$ Mn) and Forecasts, By Distribution Channel
13.3.1.Hospital Pharmacies
13.3.2.Drug Stores and Retail Stores
13.4.Middle East and Africa Patented Drugs Market Revenue (US$ Mn) and Forecasts, By Country
13.4.1.Saudi Arabia
13.4.1.1.Saudi Arabia Patented Drugs Market Revenue (US$ Mn) and Forecasts, By Type
13.4.1.1.1.Small Molecule Drugs
13.4.1.1.4.Gene Therapies
13.4.1.1.5.Antiviral Drugs
13.4.1.1.6.Anti-inflammatory Drugs
13.4.1.1.7.Neurological Drugs
13.4.1.1.9.Cardiovascular Drugs
13.4.1.2.Saudi Arabia Patented Drugs Market Revenue (US$ Mn) and Forecasts, By Distribution Channel
13.4.1.2.1.Hospital Pharmacies
13.4.1.2.2.Drug Stores and Retail Stores
13.4.1.2.3.Online Pharmacies
13.4.2.UAE
13.4.2.1.UAE Patented Drugs Market Revenue (US$ Mn) and Forecasts, By Type
13.4.2.1.1.Small Molecule Drugs
13.4.2.1.4.Gene Therapies
13.4.2.1.5.Antiviral Drugs
13.4.2.1.6.Anti-inflammatory Drugs
13.4.2.1.7.Neurological Drugs
13.4.2.1.9.Cardiovascular Drugs
13.4.2.2.UAE Patented Drugs Market Revenue (US$ Mn) and Forecasts, By Distribution Channel
13.4.2.2.1.Hospital Pharmacies
13.4.2.2.2.Drug Stores and Retail Stores
13.4.2.2.3.Online Pharmacies
13.4.3.Egypt
13.4.3.1.Egypt Patented Drugs Market Revenue (US$ Mn) and Forecasts, By Type
13.4.3.1.1.Small Molecule Drugs
13.4.3.1.4.Gene Therapies
13.4.3.1.5.Antiviral Drugs
13.4.3.1.6.Anti-inflammatory Drugs
13.4.3.1.7.Neurological Drugs
13.4.3.1.9.Cardiovascular Drugs
13.4.3.2.Egypt Patented Drugs Market Revenue (US$ Mn) and Forecasts, By Distribution Channel
13.4.3.2.1.Hospital Pharmacies
13.4.3.2.2.Drug Stores and Retail Stores
13.4.3.2.3.Online Pharmacies
13.4.4.Kuwait
13.4.4.1.Kuwait Patented Drugs Market Revenue (US$ Mn) and Forecasts, By Type
13.4.4.1.1.Small Molecule Drugs
13.4.4.1.4.Gene Therapies
13.4.4.1.5.Antiviral Drugs
13.4.4.1.6.Anti-inflammatory Drugs
13.4.4.1.7.Neurological Drugs
13.4.4.1.9.Cardiovascular Drugs
13.4.4.2.Kuwait Patented Drugs Market Revenue (US$ Mn) and Forecasts, By Distribution Channel
13.4.4.2.1.Hospital Pharmacies
13.4.4.2.2.Drug Stores and Retail Stores
13.4.4.2.3.Online Pharmacies
13.4.5.South Africa
13.4.5.1.South Africa Patented Drugs Market Revenue (US$ Mn) and Forecasts, By Type
13.4.5.1.1.Small Molecule Drugs
13.4.5.1.4.Gene Therapies
13.4.5.1.5.Antiviral Drugs
13.4.5.1.6.Anti-inflammatory Drugs
13.4.5.1.7.Neurological Drugs
13.4.5.1.9.Cardiovascular Drugs
13.4.5.2.South Africa Patented Drugs Market Revenue (US$ Mn) and Forecasts, By Distribution Channel
13.4.5.2.1.Hospital Pharmacies
13.4.5.2.2.Drug Stores and Retail Stores
13.4.5.2.3.Online Pharmacies
13.4.6.Rest of Middle East & Africa
13.4.6.1.Rest of Middle East & Africa Patented Drugs Market Revenue (US$ Mn) and Forecasts, By Type
13.4.6.1.1.Small Molecule Drugs
13.4.6.1.4.Gene Therapies
13.4.6.1.5.Antiviral Drugs
13.4.6.1.6.Anti-inflammatory Drugs
13.4.6.1.7.Neurological Drugs
13.4.6.1.9.Cardiovascular Drugs
13.4.6.2.Rest of Middle East & Africa Patented Drugs Market Revenue (US$ Mn) and Forecasts, By Distribution Channel
13.4.6.2.1.Hospital Pharmacies
13.4.6.2.2.Drug Stores and Retail Stores
13.4.6.2.3.Online Pharmacies
13.5.Key Segment for Channeling Investments
13.5.3.By Distribution Channel
14.Latin America Patented Drugs Market Analysis and Forecasts, 2023 – 2031
14.1.Overview
14.1.1.Latin America Patented Drugs Market Revenue (US$ Mn)
14.2.Latin America Patented Drugs Market Revenue (US$ Mn) and Forecasts, By Type
14.2.1.Small Molecule Drugs
14.2.6.Anti-inflammatory Drugs
14.2.7.Neurological Drugs
14.2.9.Cardiovascular Drugs
14.3.Latin America Patented Drugs Market Revenue (US$ Mn) and Forecasts, By Distribution Channel
14.3.1.Hospital Pharmacies
14.3.2.Drug Stores and Retail Stores
14.4.Latin America Patented Drugs Market Revenue (US$ Mn) and Forecasts, By Country
14.4.1.Brazil
14.4.1.1.Brazil Patented Drugs Market Revenue (US$ Mn) and Forecasts, By Type
14.4.1.1.1.Small Molecule Drugs
14.4.1.1.4.Gene Therapies
14.4.1.1.5.Antiviral Drugs
14.4.1.1.6.Anti-inflammatory Drugs
14.4.1.1.7.Neurological Drugs
14.4.1.1.9.Cardiovascular Drugs
14.4.1.2.Brazil Patented Drugs Market Revenue (US$ Mn) and Forecasts, By Distribution Channel
14.4.1.2.1.Hospital Pharmacies
14.4.1.2.2.Drug Stores and Retail Stores
14.4.1.2.3.Online Pharmacies
14.4.2.Argentina
14.4.2.1.Argentina Patented Drugs Market Revenue (US$ Mn) and Forecasts, By Type
14.4.2.1.1.Small Molecule Drugs
14.4.2.1.4.Gene Therapies
14.4.2.1.5.Antiviral Drugs
14.4.2.1.6.Anti-inflammatory Drugs
14.4.2.1.7.Neurological Drugs
14.4.2.1.9.Cardiovascular Drugs
14.4.2.2.Argentina Patented Drugs Market Revenue (US$ Mn) and Forecasts, By Distribution Channel
14.4.2.2.1.Hospital Pharmacies
14.4.2.2.2.Drug Stores and Retail Stores
14.4.2.2.3.Online Pharmacies
14.4.3.Rest of Latin America
14.4.3.1.Rest of Latin America Patented Drugs Market Revenue (US$ Mn) and Forecasts, By Type
14.4.3.1.1.Small Molecule Drugs
14.4.3.1.4.Gene Therapies
14.4.3.1.5.Antiviral Drugs
14.4.3.1.6.Anti-inflammatory Drugs
14.4.3.1.7.Neurological Drugs
14.4.3.1.9.Cardiovascular Drugs
14.4.3.2.Rest of Latin America Patented Drugs Market Revenue (US$ Mn) and Forecasts, By Distribution Channel
14.4.3.2.1.Hospital Pharmacies
14.4.3.2.2.Drug Stores and Retail Stores
14.4.3.2.3.Online Pharmacies
14.5.Key Segment for Channeling Investments
14.5.3.By Distribution Channel
15.Competitive Benchmarking
15.1.Market Share Analysis, 2022
15.2.Global Presence and Growth Strategies
15.2.1.Mergers and Acquisitions
15.2.3.Investments Trends
16.Player Profiles
16.1.AbbVie Inc.
16.1.5.Financial Analysis
16.1.7.Business Strategies
16.2.Astellas Pharma Inc.
16.2.5.Financial Analysis
16.2.7.Business Strategies
16.3.Bayer
16.3.5.Financial Analysis
16.3.7.Business Strategies
16.4.Biogen
16.4.5.Financial Analysis
16.4.7.Business Strategies
16.5.Boehringer Ingelheim International GmbH.
16.5.5.Financial Analysis
16.5.7.Business Strategies
16.6.F. Hoffmann-La Roche AG
16.6.5.Financial Analysis
16.6.7.Business Strategies
16.7.Gilead Sciences Inc
16.7.5.Financial Analysis
16.7.7.Business Strategies
16.8.Helsinn
16.8.5.Financial Analysis
16.8.7.Business Strategies
16.9.Johnson and Johnson
16.9.5.Financial Analysis
16.9.7.Business Strategies
16.10.Novartis AG
16.10.3.Product Offerings
16.10.5.Financial Analysis
16.10.7.Business Strategies
16.11.Pf Prism Cv
16.11.3.Product Offerings
16.11.5.Financial Analysis
16.11.7.Business Strategies
16.12.Pfizer Inc.
16.12.3.Product Offerings
16.12.5.Financial Analysis
16.12.7.Business Strategies
16.13.Viiv
16.13.3.Product Offerings
16.13.5.Financial Analysis
16.13.7.Business Strategies
16.14.Other market participants
.
Note: This ToC is tentative and can be changed according to the research study conducted during the course of report completion.
.
**Exclusive for Multi-User and Enterprise User.
.
Global Patented Drugs Market Segmentation
Global Patented Drugs Market – Type Outlook (Revenue, USD Million, 2015 – 2031)
• Anti-inflammatory Drugs
• Others
Global Patented Drugs Market – Distribution Channel Outlook (Revenue, USD Million, 2015 – 2031)
• Drug Stores and Retail Stores
• Online Pharmacies
Global Patented Drugs Market – Regional Outlook (Revenue, USD Million, 2015 – 2031)
• North America (U.S., Canada, Mexico, Rest of North America)
• Europe (France, The UK, Spain, Germany, Italy, Nordic Countries (Denmark, Finland, Iceland, Sweden, Norway), Benelux Union (Belgium, The Netherlands, Luxembourg), Rest of Europe)
• Asia Pacific (China, Japan, India, New Zealand, Australia, South Korea, Southeast Asia (Indonesia, Thailand, Malaysia, Singapore, Rest of Southeast Asia), Rest of Asia Pacific)
• Middle East & Africa (Saudi Arabia, UAE, Egypt, Kuwait, South Africa, Rest of Middle East & Africa)
• Latin America (Brazil, Argentina, Rest of Latin America)
**Note: The report covers cross-segmentation analysis by region further into countries
The Niche Research approach encompasses both primary and secondary research methods to provide comprehensive insights. While primary research is the cornerstone of our studies, we also incorporate secondary research sources such as company annual reports, premium industry databases, press releases, industry journals, and white papers.
Within our primary research, we actively engage with various industry stakeholders, conducting paid interviews and surveys. Our meticulous analysis extends to every market participant in major countries, allowing us to thoroughly examine their portfolios, calculate market shares, and segment revenues.
Our data collection primarily focuses on individual countries within our research scope, enabling us to estimate regional market sizes. Typically, we employ a bottom-up approach, meticulously tracking trends in different countries. We analyze growth drivers, constraints, technological innovations, and opportunities for each country, ultimately arriving at regional figures.Our process begins by examining the growth prospects of each country. Building upon these insights, we project growth and trends for the entire region. Finally, we utilize our proprietary model to refine estimations and forecasts.
Our data validation standards are integral to ensuring the reliability and accuracy of our research findings. Here’s a breakdown of our data validation processes and the stakeholders we engage with during our primary research:
- Supply Side Analysis: We initiate a supply side analysis by directly contacting market participants, through telephonic interviews and questionnaires containing both open-ended and close-ended questions. We gather information on their portfolios, segment revenues, developments, and growth strategies.
- Demand Side Analysis: To gain insights into adoption trends and consumer preferences, we reach out to target customers and users (non-vendors). This information forms a vital part of the qualitative analysis section of our reports, covering market dynamics, adoption trends, consumer behavior, spending patterns, and other related aspects.
- Consultant Insights: We tap into the expertise of our partner consultants from around the world to obtain their unique viewpoints and perspectives. Their insights contribute to a well-rounded understanding of the markets under investigation.
- In-House Validation: To ensure data accuracy and reliability, we conduct cross-validation of data points and information through our in-house team of consultants and utilize advanced data modeling tools for thorough verification.
The forecasts we provide are based on a comprehensive assessment of various factors, including:
- Market Trends and Past Performance (Last Five Years): We accurately analyze market trends and performance data from preceding five years to identify historical patterns and understand the market’s evolution.
- Historical Performance and Growth of Market Participants: We assess the historical performance and growth trajectories of key market participants. This analysis provides insights into the competitive landscape and individual company strategies.
- Market Determinants Impact Analysis (Next Eight Years): We conduct a rigorous analysis of the factors that are projected to influence the market over the next eight years. This includes assessing both internal and external determinants that can shape market dynamics.
- Drivers and Challenges for the Forecast Period:Identify the factors expected to drive market growth during the forecast period, as well as the challenges that the industry may face. This analysis aids in deriving an accurate growth rate projection.
- New Acquisitions, Collaborations, or Partnerships: We keep a close watch on any new acquisitions, collaborations, or partnerships within the industry. These developments can have a significant impact on market dynamics and competitiveness.
- Macro and Micro Factors Analysis:A thorough examination of both macro-level factors (e.g., economic trends, regulatory changes) and micro-level factors (e.g., technological advancements, consumer preferences) that may influence the market during the forecast period.
- End-User Sentiment Analysis: To understand the market from the end-user perspective, we conduct sentiment analysis. This involves assessing the sentiment, preferences, and feedback of the end-users, which can provide valuable insights into market trends.
- Perspective of Primary Participants: Insights gathered directly from primary research participants play a crucial role in shaping our forecasts. Their perspectives and experiences provide valuable qualitative data.
- Year-on-Year Growth Trend: We utilize a year-on-year growth trend based on historical market growth and expected future trends. This helps in formulating our growth projections, aligning them with the market’s historical performance.
Research process adopted by TNR involves multiple stages, including data collection, validation, quality checks, and presentation. It’s crucial that the data and information we provide add value to your existing market understanding and expertise. We have also established partnerships with business consulting, research, and survey organizations across regions and globally to collaborate on regional analysis and data validation, ensuring the highest level of accuracy and reliability in our reports.