Global Photopolymers Market, By Performance, By Technology, By Application, By Region & Segmental Insights Trends and Forecast, 2023 – 2031
- Industry: Chemicals & Materials
- Report ID: TNR-110-1002
- Number of Pages: 420
- Table/Charts : Yes
- November, 2023
- Base Year : 2024
- No. of Companies : 10+
- No. of Countries : 29
- Views : 10118
- Covid Impact Covered: Yes
- War Impact Covered: Yes
- Formats : PDF, Excel, PPT
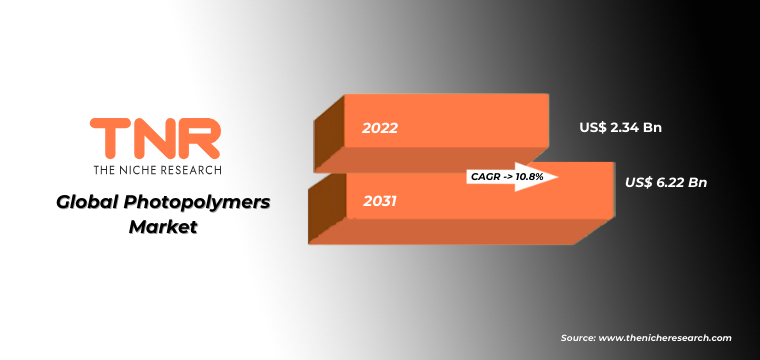
Photopolymers are light-sensitive materials that change their chemical properties when exposed to ultraviolet (UV) or visible light. This transformation allows them to solidify or harden, making them valuable in 3D printing, printing plates, and holography. Photopolymers are widely used for their rapid curing and precise detailing capabilities. In terms of revenue, the global photopolymers market was worth US$ 2.34 Bn in 2022, anticipated to witness CAGR of 10.8% during 2023 – 2031.
Trends in the Global Photopolymers Market
- The photopolymers market is currently witnessing a surge in demand due to the ongoing 3D printing revolution. As of now, 3D printing technology is experiencing widespread adoption across industries, including aerospace, healthcare, and automotive. Photopolymers are at the forefront of this trend because of their ability to rapidly solidify layer by layer when exposed to light. This facilitates precise and customizable 3D printing, making photopolymers essential in producing prototypes, medical implants, and intricate parts, reflecting the current trend of expanding applications in additive manufacturing.
- Presently, the photopolymers market is experiencing robust growth driven by the increasing demand in the healthcare sector. The medical industry is utilizing photopolymers for applications such as dental models, hearing aids, and surgical guides. These materials offer biocompatibility and the ability to produce complex, patient-specific structures. With personalized medicine on the rise, the current trend involves a heightened reliance on photopolymers for creating tailored medical devices and implants, ultimately enhancing patient care and driving market expansion.
Global Photopolymers Market Revenue & Forecast, (US$ Million), 2015 – 2031
Mid performance segment has gained popularity in recent years and is anticipated to be the fastest growing segment in the global photopolymers market during the forecast period. The growth is attributed to its versatility and cost-effectiveness. As of 2022, these photopolymers exhibited a balanced combination of quality and affordability, making them suitable for a wide range of applications. They have gained popularity in industries like automotive, consumer goods, and architecture, where precision and durability are essential but cost considerations are also significant.
This growth aligns with the trend of manufacturers seeking cost-efficient materials without compromising on performance. Mid-performance photopolymers offer a competitive edge by enabling product development and innovation in a cost-effective manner, making them a dynamic force in the market.
 Dental application segment had the highest share in the global photopolymers market in 2022. As of 2022, the dental industry had seen a significant shift towards digital dentistry, valued at approximately $2.4 billion globally. Photopolymers are essential in this transformation, facilitating the creation of precise dental models, crowns, bridges, and orthodontic devices. Their biocompatibility and exceptional detailing capabilities have made them indispensable in modern dentistry. With an increasing emphasis on dental aesthetics and patient-specific treatments, photopolymers have become the standard for delivering efficient, accurate, and aesthetically pleasing dental solutions, reaffirming their dominance in the market.
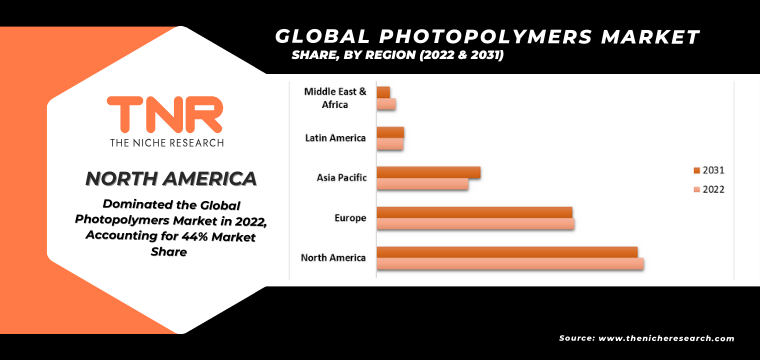
Asia Pacific is expected to witness the highest growth rate in the photopolymers market during the forecast period. The region is witnessing a surge in manufacturing, particularly in countries like China and India, driving demand for photopolymers in automotive, electronics, and consumer goods. Moreover, the region’s expanding healthcare and dental sectors, valued at billions of dollars, are increasingly adopting photopolymers for applications such as dental models and medical devices. Furthermore, the rise of 3D printing and additive manufacturing in Asia Pacific, fueled by innovation and investments, has amplified the need for photopolymers, making it the fastest-growing segment in the market.
Report Coverage & Insights
Competitive Landscape
Some of the key companies operating in the photopolymers market are listed below:
- ANYCUBIC-US
- Arkema
- BASF SE
- Carbon, Inc.
- Evonik Industries AG
- Formlabs
- Henkel AG & Co. KGaA
- Keystone Industries
- Liqcreate
- polySpectra
- RAHN AG
- Stratasys
- Other Industry Participants
Global Photopolymers Market Summary
| Report Specifications | Details |
| Market Revenue in 2022 | US$ 2.34 Bn |
| Market Size Forecast by 2031 | US$ 6.22 Bn |
| Growth Rate (CAGR) | 10.8% |
| Historic Data | 2015 – 2021 |
| Base Year for Estimation | 2022 |
| Forecast Period | 2023 – 2031 |
| Report Inclusions | Market Size & Estimates, Market Dynamics, Competitive Scenario, Trends, Growth Factors, Market Determinants, Key Investment Segmentation, Product/Service/Solutions Benchmarking |
| Segments Covered | By Performance, By Technology, By Application |
| Regions Covered | North America, Europe, Asia Pacific, Middle East & Africa, Latin America |
| Countries Covered | U.S., Canada, Mexico, Rest of North America, France, The UK, Spain, Germany, Italy, Nordic Countries (Denmark, Finland, Iceland, Sweden, Norway), Benelux Union (Belgium, The Netherlands, Luxembourg), Rest of Europe, China, Japan, India, New Zealand, Australia, South Korea, Southeast Asia (Indonesia, Thailand, Malaysia, Singapore, Rest of Southeast Asia), Rest of Asia Pacific, Saudi Arabia, UAE, Egypt, Kuwait, South Africa, Rest of Middle East & Africa, Brazil, Argentina, Rest of Latin America |
| Key Players | ANYCUBIC-US, Arkema, BASF SE, Carbon, Inc, Evonik Industries AG, Formlabs, Henkel AG & Co. KGaA, Keystone Industries, Liqcreate, polySpectra, RAHN AG, Stratasys, Other Industry Participants |
| Customization Scope | Customization allows for the inclusion/modification of content pertaining to geographical regions, countries, and specific market segments. |
| Pricing & Procurement Options | Explore purchase options tailored to your specific research requirements |
| Contact Details | Consult With Our Expert
Japan (Toll-Free): +81 663-386-8111 South Korea (Toll-Free): +82-808- 703-126 Saudi Arabia (Toll-Free): +966 800-850-1643 United Kingdom: +44 753-710-5080 United States: +1 302-232-5106 E-mail: askanexpert@thenicheresearch.com
|
Global Photopolymers Market
By Performance
- Low Performance
- Mid Performance
- High Performance
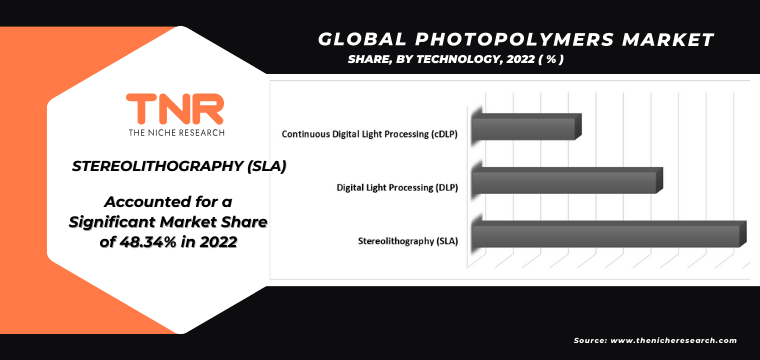
By Technology
- Stereolithography (SLA)
- Digital Light Processing (DLP)
- Continuous Digital Light Processing (cDLP)
By Application
- Dental
- Medical
- Audiology
- Jewelry
- Automotive
- Prototyping
- Industrial/Engineering
- Electronics (including connectors)
- Consumer Goods
- Others
By Region
- North America (U.S., Canada, Mexico, Rest of North America)
- Europe (France, The UK, Spain, Germany, Italy, Nordic Countries (Denmark, Finland, Iceland, Sweden, Norway), Benelux Union (Belgium, The Netherlands, Luxembourg), Rest of Europe)
- Asia Pacific (China, Japan, India, New Zealand, Australia, South Korea, Southeast Asia (Indonesia, Thailand, Malaysia, Singapore, Rest of Southeast Asia), Rest of Asia Pacific)
- Middle East & Africa (Saudi Arabia, UAE, Egypt, Kuwait, South Africa, Rest of Middle East & Africa)
- Latin America (Brazil, Argentina, Rest of Latin America)
Table of Contents
**Exclusive for Multi-User and Enterprise User.
Global Photopolymers Market
By Performance
By Technology
By Application
By Region
**Note: The report covers cross-segmentation analysis by region further into countries
The Niche Research approach encompasses both primary and secondary research methods to provide comprehensive insights. While primary research is the cornerstone of our studies, we also incorporate secondary research sources such as company annual reports, premium industry databases, press releases, industry journals, and white papers.
Within our primary research, we actively engage with various industry stakeholders, conducting paid interviews and surveys. Our meticulous analysis extends to every market participant in major countries, allowing us to thoroughly examine their portfolios, calculate market shares, and segment revenues.
Our data collection primarily focuses on individual countries within our research scope, enabling us to estimate regional market sizes. Typically, we employ a bottom-up approach, meticulously tracking trends in different countries. We analyze growth drivers, constraints, technological innovations, and opportunities for each country, ultimately arriving at regional figures.Our process begins by examining the growth prospects of each country. Building upon these insights, we project growth and trends for the entire region. Finally, we utilize our proprietary model to refine estimations and forecasts.
Our data validation standards are integral to ensuring the reliability and accuracy of our research findings. Here’s a breakdown of our data validation processes and the stakeholders we engage with during our primary research:
- Supply Side Analysis: We initiate a supply side analysis by directly contacting market participants, through telephonic interviews and questionnaires containing both open-ended and close-ended questions. We gather information on their portfolios, segment revenues, developments, and growth strategies.
- Demand Side Analysis: To gain insights into adoption trends and consumer preferences, we reach out to target customers and users (non-vendors). This information forms a vital part of the qualitative analysis section of our reports, covering market dynamics, adoption trends, consumer behavior, spending patterns, and other related aspects.
- Consultant Insights: We tap into the expertise of our partner consultants from around the world to obtain their unique viewpoints and perspectives. Their insights contribute to a well-rounded understanding of the markets under investigation.
- In-House Validation: To ensure data accuracy and reliability, we conduct cross-validation of data points and information through our in-house team of consultants and utilize advanced data modeling tools for thorough verification.
The forecasts we provide are based on a comprehensive assessment of various factors, including:
- Market Trends and Past Performance (Last Five Years): We accurately analyze market trends and performance data from preceding five years to identify historical patterns and understand the market’s evolution.
- Historical Performance and Growth of Market Participants: We assess the historical performance and growth trajectories of key market participants. This analysis provides insights into the competitive landscape and individual company strategies.
- Market Determinants Impact Analysis (Next Eight Years): We conduct a rigorous analysis of the factors that are projected to influence the market over the next eight years. This includes assessing both internal and external determinants that can shape market dynamics.
- Drivers and Challenges for the Forecast Period:Identify the factors expected to drive market growth during the forecast period, as well as the challenges that the industry may face. This analysis aids in deriving an accurate growth rate projection.
- New Acquisitions, Collaborations, or Partnerships: We keep a close watch on any new acquisitions, collaborations, or partnerships within the industry. These developments can have a significant impact on market dynamics and competitiveness.
- Macro and Micro Factors Analysis:A thorough examination of both macro-level factors (e.g., economic trends, regulatory changes) and micro-level factors (e.g., technological advancements, consumer preferences) that may influence the market during the forecast period.
- End-User Sentiment Analysis: To understand the market from the end-user perspective, we conduct sentiment analysis. This involves assessing the sentiment, preferences, and feedback of the end-users, which can provide valuable insights into market trends.
- Perspective of Primary Participants: Insights gathered directly from primary research participants play a crucial role in shaping our forecasts. Their perspectives and experiences provide valuable qualitative data.
- Year-on-Year Growth Trend: We utilize a year-on-year growth trend based on historical market growth and expected future trends. This helps in formulating our growth projections, aligning them with the market’s historical performance.
Research process adopted by TNR involves multiple stages, including data collection, validation, quality checks, and presentation. It’s crucial that the data and information we provide add value to your existing market understanding and expertise. We have also established partnerships with business consulting, research, and survey organizations across regions and globally to collaborate on regional analysis and data validation, ensuring the highest level of accuracy and reliability in our reports.