Global Physical Security Market By Component, By Industry Vertical, By End User, By Region & Segmental Insights Trends and Forecast, 2024 – 2034

  • Industry: Automotive & Transportation
  • Report ID: TNR-110-1268
  • Number of Pages: 420
  • Table/Charts : Yes
  • August, 2024
  • Base Year : 2024
  • No. of Companies : 10+
  • No. of Countries : 29
  • Views : 10037
  • Covid Impact Covered: Yes
  • War Impact Covered: Yes
  • Formats : PDF, Excel, PPT

The physical security market encompasses measures and technologies designed to protect physical assets, people, and information from unauthorized access, damage, or theft. This market includes surveillance systems, access control solutions, alarm systems, and barriers.

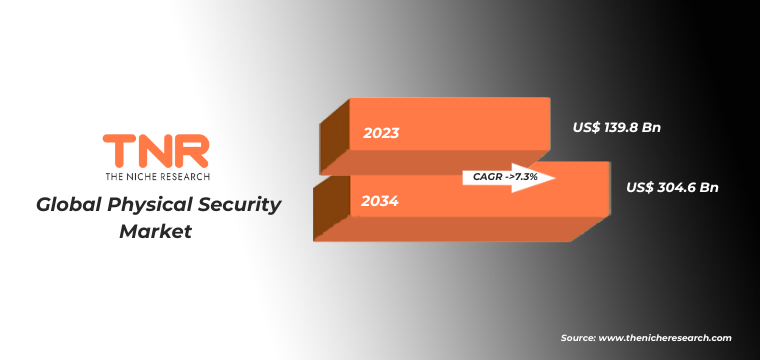
According to recent statistics, the global physical security market was valued at approximately USD 139.8 Bn in 2023 projected to reach USD 304.6 Bn by 2034; expected to grow at a CAGR of 7.3% from 2024 to 2034. Physical security applications are broad, spanning various industry verticals. In the corporate sector, it secures facilities and sensitive information. In retail, it helps prevent theft and ensure customer safety. Healthcare institutions use it to protect patient data and ensure staff safety. Critical infrastructure sectors, such as energy and transportation, rely on physical security to safeguard against potential threats and disruptions. The growing focus on security and technological advancements drive the expansion and innovation within this market.

Global Physical Security Market Segmental Analysis:

Global Physical Security Market By Component

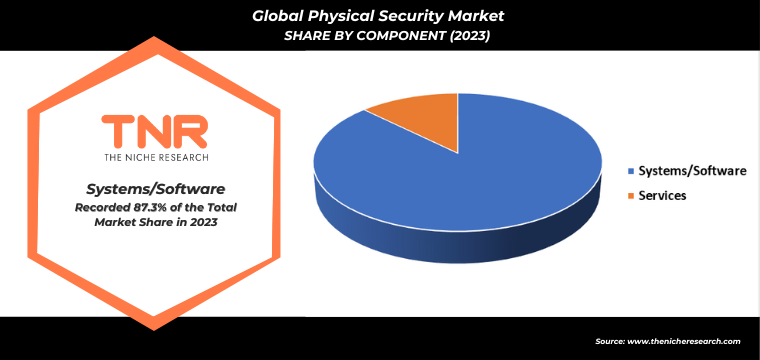
Systems/software segment, by component, is anticipated to lead the global physical security market in the upcoming years. This segment encompasses advanced technologies such as video management systems (VMS), access control systems, and integrated security platforms that enhance overall security operations. With increasing demand for centralized control and real-time monitoring, businesses and organizations are investing heavily in sophisticated software solutions. These systems provide comprehensive functionalities, including alarm management, video analytics, and IoT integration, facilitating more effective and streamlined security management. The rapid advancements in technology and the growing need for robust, scalable security solutions are driving the strong growth and market leadership of the systems/software segment.

Global Physical Security Market By Industry Vertical

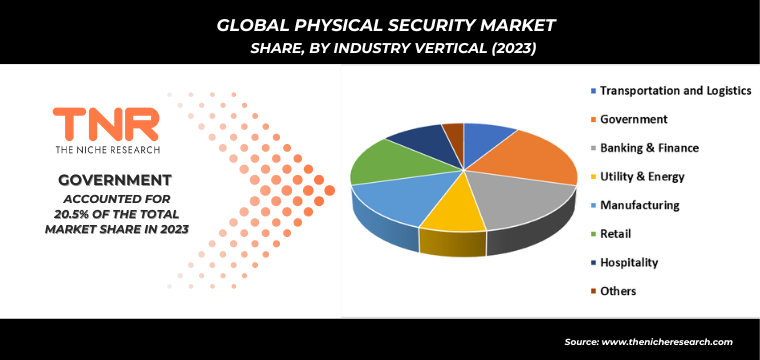
The government sector is a leading industry vertical in the global physical security market due to its extensive use of advanced security measures. Governments prioritize the protection of critical infrastructure, sensitive data, and public safety, driving significant investments in physical security systems. This includes deployment of surveillance cameras, access control systems, and alarm systems across various government facilities. The need for enhanced security against potential threats, such as terrorism and cyber-attacks, further fuels the demand for comprehensive security solutions. Consequently, the government’s substantial spending on physical security technologies establishes it as a dominant segment within the market, reflecting its critical role in national and public safety.

Global Physical Security Market By End User

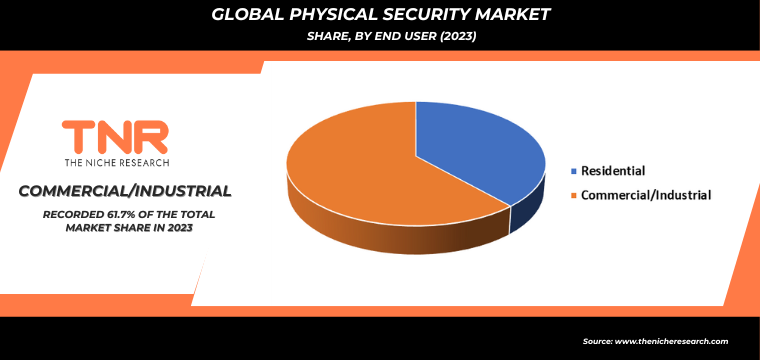
The residential segment is projected to experience the fastest growth in the global physical security market in the coming years. This surge is driven by increasing consumer awareness about home safety, advancements in affordable smart home technology, and a rising desire for enhanced security measures among homeowners. The adoption of systems such as smart locks, video doorbells, and integrated security cameras is becoming more prevalent as homeowners seek to protect their property and loved ones. Additionally, the growing availability of user-friendly and cost-effective solutions contributes to the segment’s expansion. As residential security technology becomes more accessible and sophisticated, the residential segment is set to lead the market’s growth.

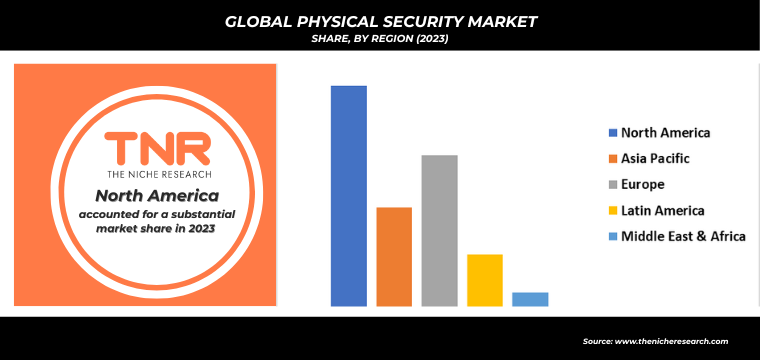
Global Physical Security Market By Region

Latin America has the potential to become a dominant player in the global physical security market in the coming years. This growth is driven by increasing investments in infrastructure development, heightened security concerns, and rising urbanization across the region. Governments and private sectors are prioritizing advanced security solutions to address challenges related to crime and safety. Additionally, the expanding adoption of smart technologies and IoT-based security systems in residential, commercial, and government sectors further supports this trend. As economic growth continues and technological advancements are embraced, Latin America is well-positioned to lead in the global physical security market.

Global Physical Security Market Dynamics

Global Physical Security Market Growth Driver:

  • Technological Advancements: The integration of advanced technologies such as IoT, AI, and machine learning into physical security systems enhances threat detection, response times, and operational efficiency, driving growth in the global physical security market.
  • Rising Security Concerns: Increasing concerns over terrorism, vandalism, and theft across various sectors amplify the demand for robust physical security solutions. This heightened awareness drives investment in comprehensive security systems to protect assets and ensure safety.

Global Physical Security Market Restraint:

  • High Implementation Costs: The initial investment required for advanced physical security systems, including installation and maintenance, can be significant. This high cost may deter smaller organizations from adopting comprehensive security solutions, limiting market growth potential.
  • Complex Integration Challenges: Integrating new physical security technologies with existing systems can be complex and resource-intensive. Compatibility issues and the need for specialized expertise may hinder seamless deployment, affecting the overall adoption rate of advanced security solutions.

Global Physical Security Market Opportunity:

  • Smart City Initiatives: As cities worldwide invest in smart infrastructure, there is an opportunity for physical security providers to integrate advanced solutions like IoT-based surveillance and automated access control, enhancing urban safety and operational efficiency.
  • Growing Demand for Cyber-Physical Security: The convergence of cybersecurity and physical security creates opportunities for integrated solutions that protect against both digital and physical threats, addressing the increasing need for comprehensive security strategies in various industry sectors.

Global Physical Security Market Trends:

  • Integration of AI and Machine Learning: The adoption of AI and machine learning in physical security systems enhances real-time threat detection, predictive analytics, and automated responses, leading to more efficient and adaptive security solutions in various sectors.
  • Cloud-Based Security Solutions: The shift towards cloud-based platforms for physical security management offers scalable, flexible, and cost-effective solutions. This trend enables remote monitoring, real-time data access, and easier integration with other security technologies.

Competitive Landscape

The global physical security market is highly competitive, with major players like Honeywell, Johnson Controls, and Bosch leading the sector. Companies focus on technological innovation, strategic partnerships, and acquisitions to enhance their product portfolios and maintain market leadership amid evolving security needs.

Recent Developments:

  • In August 2023, Fingerprint Cards AB, specializing in biometrics, joined forces with BenjiLock, known for premium biometric locks, to advance the global promotion of high-end biometric access control systems.
  • In March 2023, Rhombus, Inc., a cloud-based enterprise physical security provider, launched ‘Rhombus Access Control,’ a solution allowing enterprises to manage access control, security alarms, video surveillance, and sensors through a single web-based console or mobile app.
  • In July 2023, Solink Corp, a company offering cloud-based video surveillance, secured USD 60 million in Series C funding. The investment round was led by Goldman Sachs, with additional participation from BDC IT and Omers Ventures.

Some of the players operating in the physical security market are

  • ADT LLC
  • Axis Communications AB
  • Bosch Sicherheitssysteme GmbH
  • Cisco Systems Inc.
  • Dahua Technology Co., Ltd
  • Genetec Inc.
  • Hangzhou Hikvision Digital Technology Co., Ltd.
  • Honeywell International, Inc.
  • Johnson Controls
  • Pelco
  • Robert Bosch GmbH
  • SECOM CO., LTD.
  • Siemens
  • Other Industry Participants

Global Physical Security Market Scope:

Report Specifications Details
Market Revenue in 2023 US$ 139.8 Bn
Market Size Forecast by 2034 US$ 304.6 Bn
Growth Rate (CAGR) 7.3%
Historic Data 2016 – 2022
Base Year for Estimation 2023
Forecast Period 2024 – 2034
Report Inclusions Market Size & Estimates, Market Dynamics, Competitive Scenario, Trends, Growth Factors, Market Determinants, Key Investment Segmentation, Product/Service/Solutions Benchmarking
Segments Covered By Component, By Industry Vertical, By End User, By Region
Regions Covered North America, Europe, Asia Pacific, Middle East & Africa, Latin America
Countries Covered U.S., Canada, Mexico, Rest of North America,  France, The UK, Spain, Germany, Italy, Nordic Countries (Denmark, Finland, Iceland, Sweden, Norway), Benelux Union (Belgium, The Netherlands, Luxembourg), Rest of Europe,  China, Japan, India, New Zealand, Australia, South Korea, Southeast Asia (Indonesia, Thailand, Malaysia, Singapore, Rest of Southeast Asia), Rest of Asia Pacific,  Saudi Arabia, UAE, Egypt, Kuwait, South Africa, Rest of Middle East & Africa,  Brazil, Argentina, Rest of Latin America
Key Players ADT LLC, Axis Communications AB, Bosch Sicherheitssysteme GmbH, Cisco Systems Inc., Dahua Technology Co., Ltd, Genetec Inc., Hangzhou Hikvision Digital Technology Co., Ltd., Honeywell International, Inc., Johnson Controls, Pelco, Robert Bosch GmbH, SECOM CO., LTD., Siemens
Customization Scope Customization allows for the inclusion/modification of content pertaining to geographical regions, countries, and specific market segments.
Pricing & Procurement Options Explore purchase options tailored to your specific research requirements
Contact Details Consult With Our Expert

Japan (Toll-Free):  +81 663-386-8111

South Korea (Toll-Free):  +82-808- 703-126

Saudi Arabia (Toll-Free):  +966 800-850-1643

United Kingdom: +44 753-710-5080

United States: +1 302-232-5106

E-mail:  askanexpert@thenicheresearch.com


Global Physical Security Market Segmentation:

By Component

  • Systems/Software
    • Video Surveillance Systems
    • Biometrics & Access Control Systems
    • Intrusion Detection and Prevention Systems
    • Fire Detection Systems
    • Physical Security Information Management (PSIM)
    • Others
  • Services
    • System Integration
    • Remote Monitoring
    • Others

By Industry Vertical

  • Transportation and Logistics
  • Government
  • Banking & Finance
  • Utility & Energy
  • Manufacturing
  • Retail
  • Hospitality
  • Others

By End User

  • Residential
  • Commercial/Industrial
    • Small and Medium-sized Enterprises
    • Large Enterprises

By Region

  • North America (U.S., Canada, Mexico, Rest of North America)
  • Europe (France, The UK, Spain, Germany, Italy, Nordic Countries (Denmark, Finland, Iceland, Sweden, Norway), Benelux Union (Belgium, The Netherlands, Luxembourg), Rest of Europe)
  • Asia Pacific (China, Japan, India, New Zealand, Australia, South Korea, Southeast Asia (Indonesia, Thailand, Malaysia, Singapore, Rest of Southeast Asia), Rest of Asia Pacific)
  • Middle East & Africa (Saudi Arabia, UAE, Egypt, Kuwait, South Africa, Rest of Middle East & Africa)
  • Latin America (Brazil, Argentina, Rest of Latin America)

 Report Layout:

Table of Contents

.

1.Market Scope
1.1.Market Segmentation
1.2.Years Considered
1.2.1.Historic Years: 2016 – 2022
1.2.2.Base Year: 2023
1.2.3.Forecast Years: 2024 – 2034
2.Key Target Audiences
3.Research Methodology
3.1.Primary Research
3.1.1.Research Questionnaire
3.1.2.Global Percentage Breakdown
3.1.3.Primary Interviews: Key Opinion Leaders (KOLs)
3.2.Secondary Research
3.2.1.Paid Databases
3.2.2.Secondary Sources
3.3.Market Size Estimates
3.3.1.Top-Down Approach
3.3.2.Bottom-Up Approach
3.4.Data Triangulation Methodology
3.5.Research Assumptions
4.Recommendations and Insights from TNR’s Perspective**
5.Holistic Overview of Physical Security Market
6.Market Synopsis: Physical Security Market
7.Physical Security Market Analysis: Qualitative Perspective
7.1.Introduction
7.1.1.Product Definition
7.1.2.Industry Development
7.2.Market Dynamics
7.2.1.Drivers
7.2.2.Restraints
7.2.3.Opportunities
7.2.4.Challenges
7.3.Trends in Physical Security Market
7.4.Market Determinants Radar Chart
7.5.Macro-Economic and Micro-Economic Indicators: Physical Security Market
7.6.Industry Gross Margin Overview
7.7.Porter’s Five Force Analysis
7.8.Impact of Covid-19 on Physical Security Market
7.9.PESTEL Analysis
7.10.Value Chain Analysis
7.11.Pricing Analysis, By Region (2023)
7.11.1.North America
7.11.2.Europe
7.11.3.Asia Pacific
7.11.4.Middle East and Africa
7.11.5.Latin America
8.Global Physical Security Market Analysis and Forecasts, 2024 – 2034
8.1.Overview
8.1.1.Global Physical Security Market Revenue (US$ Mn)
8.2.Global Physical Security Market Revenue (US$ Mn) and Forecasts, By Component
8.2.1.Systems/Software (Definition, Market Estimation and Penetration, 2016 – 2023, Market Estimation (2016 – 2023), Market Forecast (2024 – 2034), Compound Annual Growth Rate (CAGR), Regional Bifurcation (North America, Europe, Asia Pacific, Middle East and Africa, Latin America) and Information on Video Surveillance Systems, Biometrics and Access Control Systems, Intrusion Detection and Prevention Systems, Fire Detection Systems, Physical Security Information Management (PSIM), Others)
8.2.1.1.Video Surveillance Systems
8.2.1.2.Biometrics and Access Control Systems
8.2.1.3.Intrusion Detection and Prevention Systems
8.2.1.4.Fire Detection Systems
8.2.1.5.Physical Security Information Management (PSIM)
8.2.1.6.Others
8.2.2.Services (Definition, Market Estimation and Penetration, 2016 – 2023, Market Estimation (2016 – 2023), Market Forecast (2024 – 2034), Compound Annual Growth Rate (CAGR), Regional Bifurcation (North America, Europe, Asia Pacific, Middle East and Africa, Latin America) and Information on System Integration, Remote Monitoring, Others)
8.2.2.1.System Integration
8.2.2.2.Remote Monitoring
8.2.2.3.Others
8.3.Key Segment for Channeling Investments
8.3.1.By Component
9.Global Physical Security Market Analysis and Forecasts, 2024 – 2034
9.1.Overview
9.2.Global Physical Security Market Revenue (US$ Mn) and Forecasts, By Industry Vertical
9.2.1.Transportation and Logistics
9.2.1.1.Definition
9.2.1.2.Market Estimation and Penetration, 2016 – 2023
9.2.1.3.Market Forecast, 2024 – 2034
9.2.1.4.Compound Annual Growth Rate (CAGR)
9.2.1.5.Regional Bifurcation
9.2.1.5.1.North America
9.2.1.5.1.1.Market Estimation, 2016 – 2023
9.2.1.5.1.2.Market Forecast, 2024 – 2034
9.2.1.5.2.Europe
9.2.1.5.2.1.Market Estimation, 2016 – 2023
9.2.1.5.2.2.Market Forecast, 2024 – 2034
9.2.1.5.3.Asia Pacific
9.2.1.5.3.1.Market Estimation, 2016 – 2023
9.2.1.5.3.2.Market Forecast, 2024 – 2034
9.2.1.5.4.Middle East and Africa
9.2.1.5.4.1.Market Estimation, 2016 – 2023
9.2.1.5.4.2.Market Forecast, 2024 – 2034
9.2.1.5.5.Latin America
9.2.1.5.5.1.Market Estimation, 2016 – 2023
9.2.1.5.5.2.Market Forecast, 2024 – 2034
9.2.2.Government
9.2.2.1.Definition
9.2.2.2.Market Estimation and Penetration, 2016 – 2023
9.2.2.3.Market Forecast, 2024 – 2034
9.2.2.4.Compound Annual Growth Rate (CAGR)
9.2.2.5.Regional Bifurcation
9.2.2.5.1.North America
9.2.2.5.1.1.Market Estimation, 2016 – 2023
9.2.2.5.1.2.Market Forecast, 2024 – 2034
9.2.2.5.2.Europe
9.2.2.5.2.1.Market Estimation, 2016 – 2023
9.2.2.5.2.2.Market Forecast, 2024 – 2034
9.2.2.5.3.Asia Pacific
9.2.2.5.3.1.Market Estimation, 2016 – 2023
9.2.2.5.3.2.Market Forecast, 2024 – 2034
9.2.2.5.4.Middle East and Africa
9.2.2.5.4.1.Market Estimation, 2016 – 2023
9.2.2.5.4.2.Market Forecast, 2024 – 2034
9.2.2.5.5.Latin America
9.2.2.5.5.1.Market Estimation, 2016 – 2023
9.2.2.5.5.2.Market Forecast, 2024 – 2034
9.2.3.Banking and Finance
9.2.3.1.Definition
9.2.3.2.Market Estimation and Penetration, 2016 – 2023
9.2.3.3.Market Forecast, 2024 – 2034
9.2.3.4.Compound Annual Growth Rate (CAGR)
9.2.3.5.Regional Bifurcation
9.2.3.5.1.North America
9.2.3.5.1.1.Market Estimation, 2016 – 2023
9.2.3.5.1.2.Market Forecast, 2024 – 2034
9.2.3.5.2.Europe
9.2.3.5.2.1.Market Estimation, 2016 – 2023
9.2.3.5.2.2.Market Forecast, 2024 – 2034
9.2.3.5.3.Asia Pacific
9.2.3.5.3.1.Market Estimation, 2016 – 2023
9.2.3.5.3.2.Market Forecast, 2024 – 2034
9.2.3.5.4.Middle East and Africa
9.2.3.5.4.1.Market Estimation, 2016 – 2023
9.2.3.5.4.2.Market Forecast, 2024 – 2034
9.2.3.5.5.Latin America
9.2.3.5.5.1.Market Estimation, 2016 – 2023
9.2.3.5.5.2.Market Forecast, 2024 – 2034
9.2.4.Utility and Energy
9.2.4.1.Definition
9.2.4.2.Market Estimation and Penetration, 2016 – 2023
9.2.4.3.Market Forecast, 2024 – 2034
9.2.4.4.Compound Annual Growth Rate (CAGR)
9.2.4.5.Regional Bifurcation
9.2.4.5.1.North America
9.2.4.5.1.1.Market Estimation, 2016 – 2023
9.2.4.5.1.2.Market Forecast, 2024 – 2034
9.2.4.5.2.Europe
9.2.4.5.2.1.Market Estimation, 2016 – 2023
9.2.4.5.2.2.Market Forecast, 2024 – 2034
9.2.4.5.3.Asia Pacific
9.2.4.5.3.1.Market Estimation, 2016 – 2023
9.2.4.5.3.2.Market Forecast, 2024 – 2034
9.2.4.5.4.Middle East and Africa
9.2.4.5.4.1.Market Estimation, 2016 – 2023
9.2.4.5.4.2.Market Forecast, 2024 – 2034
9.2.4.5.5.Latin America
9.2.4.5.5.1.Market Estimation, 2016 – 2023
9.2.4.5.5.2.Market Forecast, 2024 – 2034
9.2.5.Manufacturing
9.2.5.1.Definition
9.2.5.2.Market Estimation and Penetration, 2016 – 2023
9.2.5.3.Market Forecast, 2024 – 2034
9.2.5.4.Compound Annual Growth Rate (CAGR)
9.2.5.5.Regional Bifurcation
9.2.5.5.1.North America
9.2.5.5.1.1.Market Estimation, 2016 – 2023
9.2.5.5.1.2.Market Forecast, 2024 – 2034
9.2.5.5.2.Europe
9.2.5.5.2.1.Market Estimation, 2016 – 2023
9.2.5.5.2.2.Market Forecast, 2024 – 2034
9.2.5.5.3.Asia Pacific
9.2.5.5.3.1.Market Estimation, 2016 – 2023
9.2.5.5.3.2.Market Forecast, 2024 – 2034
9.2.5.5.4.Middle East and Africa
9.2.5.5.4.1.Market Estimation, 2016 – 2023
9.2.5.5.4.2.Market Forecast, 2024 – 2034
9.2.5.5.5.Latin America
9.2.5.5.5.1.Market Estimation, 2016 – 2023
9.2.5.5.5.2.Market Forecast, 2024 – 2034
9.2.6.Retail
9.2.6.1.Definition
9.2.6.2.Market Estimation and Penetration, 2016 – 2023
9.2.6.3.Market Forecast, 2024 – 2034
9.2.6.4.Compound Annual Growth Rate (CAGR)
9.2.6.5.Regional Bifurcation
9.2.6.5.1.North America
9.2.6.5.1.1.Market Estimation, 2016 – 2023
9.2.6.5.1.2.Market Forecast, 2024 – 2034
9.2.6.5.2.Europe
9.2.6.5.2.1.Market Estimation, 2016 – 2023
9.2.6.5.2.2.Market Forecast, 2024 – 2034
9.2.6.5.3.Asia Pacific
9.2.6.5.3.1.Market Estimation, 2016 – 2023
9.2.6.5.3.2.Market Forecast, 2024 – 2034
9.2.6.5.4.Middle East and Africa
9.2.6.5.4.1.Market Estimation, 2016 – 2023
9.2.6.5.4.2.Market Forecast, 2024 – 2034
9.2.6.5.5.Latin America
9.2.6.5.5.1.Market Estimation, 2016 – 2023
9.2.6.5.5.2.Market Forecast, 2024 – 2034
9.2.7.Hospitality
9.2.7.1.Definition
9.2.7.2.Market Estimation and Penetration, 2016 – 2023
9.2.7.3.Market Forecast, 2024 – 2034
9.2.7.4.Compound Annual Growth Rate (CAGR)
9.2.7.5.Regional Bifurcation
9.2.7.5.1.North America
9.2.7.5.1.1.Market Estimation, 2016 – 2023
9.2.7.5.1.2.Market Forecast, 2024 – 2034
9.2.7.5.2.Europe
9.2.7.5.2.1.Market Estimation, 2016 – 2023
9.2.7.5.2.2.Market Forecast, 2024 – 2034
9.2.7.5.3.Asia Pacific
9.2.7.5.3.1.Market Estimation, 2016 – 2023
9.2.7.5.3.2.Market Forecast, 2024 – 2034
9.2.7.5.4.Middle East and Africa
9.2.7.5.4.1.Market Estimation, 2016 – 2023
9.2.7.5.4.2.Market Forecast, 2024 – 2034
9.2.7.5.5.Latin America
9.2.7.5.5.1.Market Estimation, 2016 – 2023
9.2.7.5.5.2.Market Forecast, 2024 – 2034
9.2.8.Others
9.2.8.1.Definition
9.2.8.2.Market Estimation and Penetration, 2016 – 2023
9.2.8.3.Market Forecast, 2024 – 2034
9.2.8.4.Compound Annual Growth Rate (CAGR)
9.2.8.5.Regional Bifurcation
9.2.8.5.1.North America
9.2.8.5.1.1.Market Estimation, 2016 – 2023
9.2.8.5.1.2.Market Forecast, 2024 – 2034
9.2.8.5.2.Europe
9.2.8.5.2.1.Market Estimation, 2016 – 2023
9.2.8.5.2.2.Market Forecast, 2024 – 2034
9.2.8.5.3.Asia Pacific
9.2.8.5.3.1.Market Estimation, 2016 – 2023
9.2.8.5.3.2.Market Forecast, 2024 – 2034
9.2.8.5.4.Middle East and Africa
9.2.8.5.4.1.Market Estimation, 2016 – 2023
9.2.8.5.4.2.Market Forecast, 2024 – 2034
9.2.8.5.5.Latin America
9.2.8.5.5.1.Market Estimation, 2016 – 2023
9.2.8.5.5.2.Market Forecast, 2024 – 2034
9.3.Key Segment for Channeling Investments
9.3.1.By Industry Vertical
10.Global Physical Security Market Analysis and Forecasts, 2024 – 2034
10.1.Overview
10.2.Global Physical Security Market Revenue (US$ Mn) and Forecasts, By End User
10.2.1.Residential
10.2.1.1.Definition
10.2.1.2.Market Estimation and Penetration, 2016 – 2023
10.2.1.3.Market Forecast, 2024 – 2034
10.2.1.4.Compound Annual Growth Rate (CAGR)
10.2.1.5.Regional Bifurcation
10.2.1.5.1.North America
10.2.1.5.1.1.Market Estimation, 2016 – 2023
10.2.1.5.1.2.Market Forecast, 2024 – 2034
10.2.1.5.2.Europe
10.2.1.5.2.1.Market Estimation, 2016 – 2023
10.2.1.5.2.2.Market Forecast, 2024 – 2034
10.2.1.5.3.Asia Pacific
10.2.1.5.3.1.Market Estimation, 2016 – 2023
10.2.1.5.3.2.Market Forecast, 2024 – 2034
10.2.1.5.4.Middle East and Africa
10.2.1.5.4.1.Market Estimation, 2016 – 2023
10.2.1.5.4.2.Market Forecast, 2024 – 2034
10.2.1.5.5.Latin America
10.2.1.5.5.1.Market Estimation, 2016 – 2023
10.2.1.5.5.2.Market Forecast, 2024 – 2034
10.2.2.Commercial/Industrial (Definition, Market Estimation and Penetration, 2016 – 2023, Market Estimation (2016 – 2023), Market Forecast (2024 – 2034), Compound Annual Growth Rate (CAGR), Regional Bifurcation (North America, Europe, Asia Pacific, Middle East and Africa, Latin America) and Information on Small and Medium-sized Enterprises, Large Enterprises)
10.2.2.1.Small and Medium-sized Enterprises
10.2.2.2.Large Enterprises
10.3.Key Segment for Channeling Investments
10.3.1.By End User
11.North America Physical Security Market Analysis and Forecasts, 2024 – 2034
11.1.Overview
11.1.1.North America Physical Security Market Revenue (US$ Mn)
11.2.North America Physical Security Market Revenue (US$ Mn) and Forecasts, By Component
11.2.1.Systems/Software
11.2.1.1.Video Surveillance Systems
11.2.1.2.Biometrics and Access Control Systems
11.2.1.3.Intrusion Detection and Prevention Systems
11.2.1.4.Fire Detection Systems
11.2.1.5.Physical Security Information Management (PSIM)
11.2.1.6.Others
11.2.2.Services
11.2.2.1.System Integration
11.2.2.2.Remote Monitoring
11.2.2.3.Others
11.3.North America Physical Security Market Revenue (US$ Mn) and Forecasts, By Industry Vertical
11.3.1.Transportation and Logistics
11.3.2.Government
11.3.3.Banking and Finance
11.3.4.Utility and Energy
11.3.5.Manufacturing
11.3.6.Retail
11.3.7.Hospitality
11.3.8.Others
11.4.North America Physical Security Market Revenue (US$ Mn) and Forecasts, By End User
11.4.1.Residential
11.4.2.Commercial/Industrial
11.4.2.1.Small and Medium-sized Enterprises
11.4.2.2.Large Enterprises
11.5.North America Physical Security Market Revenue (US$ Mn) and Forecasts, By Country
11.5.1.U.S
11.5.1.1.U.S Physical Security Market Revenue (US$ Mn) and Forecasts, By Component
11.5.1.1.1.Systems/Software
11.5.1.1.1.1.Video Surveillance Systems
11.5.1.1.1.2.Biometrics and Access Control Systems
11.5.1.1.1.3.Intrusion Detection and Prevention Systems
11.5.1.1.1.4.Fire Detection Systems
11.5.1.1.1.5.Physical Security Information Management (PSIM)
11.5.1.1.1.6.Others
11.5.1.1.2.Services
11.5.1.1.2.1.System Integration
11.5.1.1.2.2.Remote Monitoring
11.5.1.1.2.3.Others
11.5.1.2.U.S Physical Security Market Revenue (US$ Mn) and Forecasts, By Industry Vertical
11.5.1.2.1.Transportation and Logistics
11.5.1.2.2.Government
11.5.1.2.3.Banking and Finance
11.5.1.2.4.Utility and Energy
11.5.1.2.5.Manufacturing
11.5.1.2.6.Retail
11.5.1.2.7.Hospitality
11.5.1.2.8.Others
11.5.1.3.U.S Physical Security Market Revenue (US$ Mn) and Forecasts, By End User
11.5.1.3.1.Residential
11.5.1.3.2.Commercial/Industrial
11.5.1.3.2.1.Small and Medium-sized Enterprises
11.5.1.3.2.2.Large Enterprises
11.5.2.Canada
11.5.2.1.Canada Physical Security Market Revenue (US$ Mn) and Forecasts, By Component
11.5.2.1.1.Systems/Software
11.5.2.1.1.1.Video Surveillance Systems
11.5.2.1.1.2.Biometrics and Access Control Systems
11.5.2.1.1.3.Intrusion Detection and Prevention Systems
11.5.2.1.1.4.Fire Detection Systems
11.5.2.1.1.5.Physical Security Information Management (PSIM)
11.5.2.1.1.6.Others
11.5.2.1.2.Services
11.5.2.1.2.1.System Integration
11.5.2.1.2.2.Remote Monitoring
11.5.2.1.2.3.Others
11.5.2.2.Canada Physical Security Market Revenue (US$ Mn) and Forecasts, By Industry Vertical
11.5.2.2.1.Transportation and Logistics
11.5.2.2.2.Government
11.5.2.2.3.Banking and Finance
11.5.2.2.4.Utility and Energy
11.5.2.2.5.Manufacturing
11.5.2.2.6.Retail
11.5.2.2.7.Hospitality
11.5.2.2.8.Others
11.5.2.3.Canada Physical Security Market Revenue (US$ Mn) and Forecasts, By End User
11.5.2.3.1.Residential
11.5.2.3.2.Commercial/Industrial
11.5.2.3.2.1.Small and Medium-sized Enterprises
11.5.2.3.2.2.Large Enterprises
11.5.3.Mexico
11.5.3.1.Mexico Physical Security Market Revenue (US$ Mn) and Forecasts, By Component
11.5.3.1.1.Systems/Software
11.5.3.1.1.1.Video Surveillance Systems
11.5.3.1.1.2.Biometrics and Access Control Systems
11.5.3.1.1.3.Intrusion Detection and Prevention Systems
11.5.3.1.1.4.Fire Detection Systems
11.5.3.1.1.5.Physical Security Information Management (PSIM)
11.5.3.1.1.6.Others
11.5.3.1.2.Services
11.5.3.1.2.1.System Integration
11.5.3.1.2.2.Remote Monitoring
11.5.3.1.2.3.Others
11.5.3.2.Mexico Physical Security Market Revenue (US$ Mn) and Forecasts, By Industry Vertical
11.5.3.2.1.Transportation and Logistics
11.5.3.2.2.Government
11.5.3.2.3.Banking and Finance
11.5.3.2.4.Utility and Energy
11.5.3.2.5.Manufacturing
11.5.3.2.6.Retail
11.5.3.2.7.Hospitality
11.5.3.2.8.Others
11.5.3.3.Mexico Physical Security Market Revenue (US$ Mn) and Forecasts, By End User
11.5.3.3.1.Residential
11.5.3.3.2.Commercial/Industrial
11.5.3.3.2.1.Small and Medium-sized Enterprises
11.5.3.3.2.2.Large Enterprises
11.5.4.Rest of North America
11.5.4.1.Rest of North America Physical Security Market Revenue (US$ Mn) and Forecasts, By Component
11.5.4.1.1.Systems/Software
11.5.4.1.1.1.Video Surveillance Systems
11.5.4.1.1.2.Biometrics and Access Control Systems
11.5.4.1.1.3.Intrusion Detection and Prevention Systems
11.5.4.1.1.4.Fire Detection Systems
11.5.4.1.1.5.Physical Security Information Management (PSIM)
11.5.4.1.1.6.Others
11.5.4.1.2.Services
11.5.4.1.2.1.System Integration
11.5.4.1.2.2.Remote Monitoring
11.5.4.1.2.3.Others
11.5.4.2.Rest of North America Physical Security Market Revenue (US$ Mn) and Forecasts, By Industry Vertical
11.5.4.2.1.Transportation and Logistics
11.5.4.2.2.Government
11.5.4.2.3.Banking and Finance
11.5.4.2.4.Utility and Energy
11.5.4.2.5.Manufacturing
11.5.4.2.6.Retail
11.5.4.2.7.Hospitality
11.5.4.2.8.Others
11.5.4.3.Rest of North America Physical Security Market Revenue (US$ Mn) and Forecasts, By End User
11.5.4.3.1.Residential
11.5.4.3.2.Commercial/Industrial
11.5.4.3.2.1.Small and Medium-sized Enterprises
11.5.4.3.2.2.Large Enterprises
11.6.Key Segment for Channeling Investments
11.6.1.By Country
11.6.2.By Component
11.6.3.By Industry Vertical
11.6.4.By End User
12.Europe Physical Security Market Analysis and Forecasts, 2024 – 2034
12.1.Overview
12.1.1.Europe Physical Security Market Revenue (US$ Mn)
12.2.Europe Physical Security Market Revenue (US$ Mn) and Forecasts, By Component
12.2.1.Systems/Software
12.2.1.1.Video Surveillance Systems
12.2.1.2.Biometrics and Access Control Systems
12.2.1.3.Intrusion Detection and Prevention Systems
12.2.1.4.Fire Detection Systems
12.2.1.5.Physical Security Information Management (PSIM)
12.2.1.6.Others
12.2.2.Services
12.2.2.1.System Integration
12.2.2.2.Remote Monitoring
12.2.2.3.Others
12.3.Europe Physical Security Market Revenue (US$ Mn) and Forecasts, By Industry Vertical
12.3.1.Transportation and Logistics
12.3.2.Government
12.3.3.Banking and Finance
12.3.4.Utility and Energy
12.3.5.Manufacturing
12.3.6.Retail
12.3.7.Hospitality
12.3.8.Others
12.4.Europe Physical Security Market Revenue (US$ Mn) and Forecasts, By End User
12.4.1.Residential
12.4.2.Commercial/Industrial
12.4.2.1.Small and Medium-sized Enterprises
12.4.2.2.Large Enterprises
12.5.Europe Physical Security Market Revenue (US$ Mn) and Forecasts, By Country
12.5.1.France
12.5.1.1.France Physical Security Market Revenue (US$ Mn) and Forecasts, By Component
12.5.1.1.1.Systems/Software
12.5.1.1.1.1.Video Surveillance Systems
12.5.1.1.1.2.Biometrics and Access Control Systems
12.5.1.1.1.3.Intrusion Detection and Prevention Systems
12.5.1.1.1.4.Fire Detection Systems
12.5.1.1.1.5.Physical Security Information Management (PSIM)
12.5.1.1.1.6.Others
12.5.1.1.2.Services
12.5.1.1.2.1.System Integration
12.5.1.1.2.2.Remote Monitoring
12.5.1.1.2.3.Others
12.5.1.2.France Physical Security Market Revenue (US$ Mn) and Forecasts, By Industry Vertical
12.5.1.2.1.Transportation and Logistics
12.5.1.2.2.Government
12.5.1.2.3.Banking and Finance
12.5.1.2.4.Utility and Energy
12.5.1.2.5.Manufacturing
12.5.1.2.6.Retail
12.5.1.2.7.Hospitality
12.5.1.2.8.Others
12.5.1.3.France Physical Security Market Revenue (US$ Mn) and Forecasts, By End User
12.5.1.3.1.Residential
12.5.1.3.2.Commercial/Industrial
12.5.1.3.2.1.Small and Medium-sized Enterprises
12.5.1.3.2.2.Large Enterprises
12.5.2.The UK
12.5.2.1.The UK Physical Security Market Revenue (US$ Mn) and Forecasts, By Component
12.5.2.1.1.Systems/Software
12.5.2.1.1.1.Video Surveillance Systems
12.5.2.1.1.2.Biometrics and Access Control Systems
12.5.2.1.1.3.Intrusion Detection and Prevention Systems
12.5.2.1.1.4.Fire Detection Systems
12.5.2.1.1.5.Physical Security Information Management (PSIM)
12.5.2.1.1.6.Others
12.5.2.1.2.Services
12.5.2.1.2.1.System Integration
12.5.2.1.2.2.Remote Monitoring
12.5.2.1.2.3.Others
12.5.2.2.The UK Physical Security Market Revenue (US$ Mn) and Forecasts, By Industry Vertical
12.5.2.2.1.Transportation and Logistics
12.5.2.2.2.Government
12.5.2.2.3.Banking and Finance
12.5.2.2.4.Utility and Energy
12.5.2.2.5.Manufacturing
12.5.2.2.6.Retail
12.5.2.2.7.Hospitality
12.5.2.2.8.Others
12.5.2.3.The UK Physical Security Market Revenue (US$ Mn) and Forecasts, By End User
12.5.2.3.1.Residential
12.5.2.3.2.Commercial/Industrial
12.5.2.3.2.1.Small and Medium-sized Enterprises
12.5.2.3.2.2.Large Enterprises
12.5.3.Spain
12.5.3.1.Spain Physical Security Market Revenue (US$ Mn) and Forecasts, By Component
12.5.3.1.1.Systems/Software
12.5.3.1.1.1.Video Surveillance Systems
12.5.3.1.1.2.Biometrics and Access Control Systems
12.5.3.1.1.3.Intrusion Detection and Prevention Systems
12.5.3.1.1.4.Fire Detection Systems
12.5.3.1.1.5.Physical Security Information Management (PSIM)
12.5.3.1.1.6.Others
12.5.3.1.2.Services
12.5.3.1.2.1.System Integration
12.5.3.1.2.2.Remote Monitoring
12.5.3.1.2.3.Others
12.5.3.2.Spain Physical Security Market Revenue (US$ Mn) and Forecasts, By Industry Vertical
12.5.3.2.1.Transportation and Logistics
12.5.3.2.2.Government
12.5.3.2.3.Banking and Finance
12.5.3.2.4.Utility and Energy
12.5.3.2.5.Manufacturing
12.5.3.2.6.Retail
12.5.3.2.7.Hospitality
12.5.3.2.8.Others
12.5.3.3.Spain Physical Security Market Revenue (US$ Mn) and Forecasts, By End User
12.5.3.3.1.Residential
12.5.3.3.2.Commercial/Industrial
12.5.3.3.2.1.Small and Medium-sized Enterprises
12.5.3.3.2.2.Large Enterprises
12.5.4.Germany
12.5.4.1.Germany Physical Security Market Revenue (US$ Mn) and Forecasts, By Component
12.5.4.1.1.Systems/Software
12.5.4.1.1.1.Video Surveillance Systems
12.5.4.1.1.2.Biometrics and Access Control Systems
12.5.4.1.1.3.Intrusion Detection and Prevention Systems
12.5.4.1.1.4.Fire Detection Systems
12.5.4.1.1.5.Physical Security Information Management (PSIM)
12.5.4.1.1.6.Others
12.5.4.1.2.Services
12.5.4.1.2.1.System Integration
12.5.4.1.2.2.Remote Monitoring
12.5.4.1.2.3.Others
12.5.4.2.Germany Physical Security Market Revenue (US$ Mn) and Forecasts, By Industry Vertical
12.5.4.2.1.Transportation and Logistics
12.5.4.2.2.Government
12.5.4.2.3.Banking and Finance
12.5.4.2.4.Utility and Energy
12.5.4.2.5.Manufacturing
12.5.4.2.6.Retail
12.5.4.2.7.Hospitality
12.5.4.2.8.Others
12.5.4.3.Germany Physical Security Market Revenue (US$ Mn) and Forecasts, By End User
12.5.4.3.1.Residential
12.5.4.3.2.Commercial/Industrial
12.5.4.3.2.1.Small and Medium-sized Enterprises
12.5.4.3.2.2.Large Enterprises
12.5.5.Italy
12.5.5.1.Italy Physical Security Market Revenue (US$ Mn) and Forecasts, By Component
12.5.5.1.1.Systems/Software
12.5.5.1.1.1.Video Surveillance Systems
12.5.5.1.1.2.Biometrics and Access Control Systems
12.5.5.1.1.3.Intrusion Detection and Prevention Systems
12.5.5.1.1.4.Fire Detection Systems
12.5.5.1.1.5.Physical Security Information Management (PSIM)
12.5.5.1.1.6.Others
12.5.5.1.2.Services
12.5.5.1.2.1.System Integration
12.5.5.1.2.2.Remote Monitoring
12.5.5.1.2.3.Others
12.5.5.2.Italy Physical Security Market Revenue (US$ Mn) and Forecasts, By Industry Vertical
12.5.5.2.1.Transportation and Logistics
12.5.5.2.2.Government
12.5.5.2.3.Banking and Finance
12.5.5.2.4.Utility and Energy
12.5.5.2.5.Manufacturing
12.5.5.2.6.Retail
12.5.5.2.7.Hospitality
12.5.5.2.8.Others
12.5.5.3.Italy Physical Security Market Revenue (US$ Mn) and Forecasts, By End User
12.5.5.3.1.Residential
12.5.5.3.2.Commercial/Industrial
12.5.5.3.2.1.Small and Medium-sized Enterprises
12.5.5.3.2.2.Large Enterprises
12.5.6.Nordic Countries
12.5.6.1.Nordic Countries Physical Security Market Revenue (US$ Mn) and Forecasts, By Component
12.5.6.1.1.Systems/Software
12.5.6.1.1.1.Video Surveillance Systems
12.5.6.1.1.2.Biometrics and Access Control Systems
12.5.6.1.1.3.Intrusion Detection and Prevention Systems
12.5.6.1.1.4.Fire Detection Systems
12.5.6.1.1.5.Physical Security Information Management (PSIM)
12.5.6.1.1.6.Others
12.5.6.1.2.Services
12.5.6.1.2.1.System Integration
12.5.6.1.2.2.Remote Monitoring
12.5.6.1.2.3.Others
12.5.6.2.Nordic Countries Physical Security Market Revenue (US$ Mn) and Forecasts, By Industry Vertical
12.5.6.2.1.Transportation and Logistics
12.5.6.2.2.Government
12.5.6.2.3.Banking and Finance
12.5.6.2.4.Utility and Energy
12.5.6.2.5.Manufacturing
12.5.6.2.6.Retail
12.5.6.2.7.Hospitality
12.5.6.2.8.Others
12.5.6.3.Nordic Countries Physical Security Market Revenue (US$ Mn) and Forecasts, By End User
12.5.6.3.1.Residential
12.5.6.3.2.Commercial/Industrial
12.5.6.3.2.1.Small and Medium-sized Enterprises
12.5.6.3.2.2.Large Enterprises
12.5.6.4.Nordic Countries Physical Security Market Revenue (US$ Mn) and Forecasts, By Country
12.5.6.4.1.Denmark
12.5.6.4.2.Finland
12.5.6.4.3.Iceland
12.5.6.4.4.Sweden
12.5.6.4.5.Norway
12.5.7.Benelux Union
12.5.7.1.Benelux Union Physical Security Market Revenue (US$ Mn) and Forecasts, By Component
12.5.7.1.1.Systems/Software
12.5.7.1.1.1.Video Surveillance Systems
12.5.7.1.1.2.Biometrics and Access Control Systems
12.5.7.1.1.3.Intrusion Detection and Prevention Systems
12.5.7.1.1.4.Fire Detection Systems
12.5.7.1.1.5.Physical Security Information Management (PSIM)
12.5.7.1.1.6.Others
12.5.7.1.2.Services
12.5.7.1.2.1.System Integration
12.5.7.1.2.2.Remote Monitoring
12.5.7.1.2.3.Others
12.5.7.2.Benelux Union Physical Security Market Revenue (US$ Mn) and Forecasts, By Industry Vertical
12.5.7.2.1.Transportation and Logistics
12.5.7.2.2.Government
12.5.7.2.3.Banking and Finance
12.5.7.2.4.Utility and Energy
12.5.7.2.5.Manufacturing
12.5.7.2.6.Retail
12.5.7.2.7.Hospitality
12.5.7.2.8.Others
12.5.7.3.Benelux Union Physical Security Market Revenue (US$ Mn) and Forecasts, By End User
12.5.7.3.1.Residential
12.5.7.3.2.Commercial/Industrial
12.5.7.3.2.1.Small and Medium-sized Enterprises
12.5.7.3.2.2.Large Enterprises
12.5.7.4.Benelux Union Physical Security Market Revenue (US$ Mn) and Forecasts, By Country
12.5.7.4.1.Belgium
12.5.7.4.2.The Netherlands
12.5.7.4.3.Luxembourg
12.5.8.Rest of Europe
12.5.8.1.Rest of Europe Physical Security Market Revenue (US$ Mn) and Forecasts, By Component
12.5.8.1.1.Systems/Software
12.5.8.1.1.1.Video Surveillance Systems
12.5.8.1.1.2.Biometrics and Access Control Systems
12.5.8.1.1.3.Intrusion Detection and Prevention Systems
12.5.8.1.1.4.Fire Detection Systems
12.5.8.1.1.5.Physical Security Information Management (PSIM)
12.5.8.1.1.6.Others
12.5.8.1.2.Services
12.5.8.1.2.1.System Integration
12.5.8.1.2.2.Remote Monitoring
12.5.8.1.2.3.Others
12.5.8.2.Rest of Europe Physical Security Market Revenue (US$ Mn) and Forecasts, By Industry Vertical
12.5.8.2.1.Transportation and Logistics
12.5.8.2.2.Government
12.5.8.2.3.Banking and Finance
12.5.8.2.4.Utility and Energy
12.5.8.2.5.Manufacturing
12.5.8.2.6.Retail
12.5.8.2.7.Hospitality
12.5.8.2.8.Others
12.5.8.3.Rest of Europe Physical Security Market Revenue (US$ Mn) and Forecasts, By End User
12.5.8.3.1.Residential
12.5.8.3.2.Commercial/Industrial
12.5.8.3.2.1.Small and Medium-sized Enterprises
12.5.8.3.2.2.Large Enterprises
12.6.Key Segment for Channeling Investments
12.6.1.By Country
12.6.2.By Component
12.6.3.By Industry Vertical
12.6.4.By End User
13.Asia Pacific Physical Security Market Analysis and Forecasts, 2024 – 2034
13.1.Overview
13.1.1.Asia Pacific Physical Security Market Revenue (US$ Mn)
13.2.Asia Pacific Physical Security Market Revenue (US$ Mn) and Forecasts, By Component
13.2.1.Systems/Software
13.2.1.1.Video Surveillance Systems
13.2.1.2.Biometrics and Access Control Systems
13.2.1.3.Intrusion Detection and Prevention Systems
13.2.1.4.Fire Detection Systems
13.2.1.5.Physical Security Information Management (PSIM)
13.2.1.6.Others
13.2.2.Services
13.2.2.1.System Integration
13.2.2.2.Remote Monitoring
13.2.2.3.Others
13.3.Asia Pacific Physical Security Market Revenue (US$ Mn) and Forecasts, By Industry Vertical
13.3.1.Transportation and Logistics
13.3.2.Government
13.3.3.Banking and Finance
13.3.4.Utility and Energy
13.3.5.Manufacturing
13.3.6.Retail
13.3.7.Hospitality
13.3.8.Others
13.4.Asia Pacific Physical Security Market Revenue (US$ Mn) and Forecasts, By End User
13.4.1.Residential
13.4.2.Commercial/Industrial
13.4.2.1.Small and Medium-sized Enterprises
13.4.2.2.Large Enterprises
13.5.Asia Pacific Physical Security Market Revenue (US$ Mn) and Forecasts, By Country
13.5.1.China
13.5.1.1.China Physical Security Market Revenue (US$ Mn) and Forecasts, By Component
13.5.1.1.1.Systems/Software
13.5.1.1.1.1.Video Surveillance Systems
13.5.1.1.1.2.Biometrics and Access Control Systems
13.5.1.1.1.3.Intrusion Detection and Prevention Systems
13.5.1.1.1.4.Fire Detection Systems
13.5.1.1.1.5.Physical Security Information Management (PSIM)
13.5.1.1.1.6.Others
13.5.1.1.2.Services
13.5.1.1.2.1.System Integration
13.5.1.1.2.2.Remote Monitoring
13.5.1.1.2.3.Others
13.5.1.2.China Physical Security Market Revenue (US$ Mn) and Forecasts, By Industry Vertical
13.5.1.2.1.Transportation and Logistics
13.5.1.2.2.Government
13.5.1.2.3.Banking and Finance
13.5.1.2.4.Utility and Energy
13.5.1.2.5.Manufacturing
13.5.1.2.6.Retail
13.5.1.2.7.Hospitality
13.5.1.2.8.Others
13.5.1.3.China Physical Security Market Revenue (US$ Mn) and Forecasts, By End User
13.5.1.3.1.Residential
13.5.1.3.2.Commercial/Industrial
13.5.1.3.2.1.Small and Medium-sized Enterprises
13.5.1.3.2.2.Large Enterprises
13.5.2.Japan
13.5.2.1.Japan Physical Security Market Revenue (US$ Mn) and Forecasts, By Component
13.5.2.1.1.Systems/Software
13.5.2.1.1.1.Video Surveillance Systems
13.5.2.1.1.2.Biometrics and Access Control Systems
13.5.2.1.1.3.Intrusion Detection and Prevention Systems
13.5.2.1.1.4.Fire Detection Systems
13.5.2.1.1.5.Physical Security Information Management (PSIM)
13.5.2.1.1.6.Others
13.5.2.1.2.Services
13.5.2.1.2.1.System Integration
13.5.2.1.2.2.Remote Monitoring
13.5.2.1.2.3.Others
13.5.2.2.Japan Physical Security Market Revenue (US$ Mn) and Forecasts, By Industry Vertical
13.5.2.2.1.Transportation and Logistics
13.5.2.2.2.Government
13.5.2.2.3.Banking and Finance
13.5.2.2.4.Utility and Energy
13.5.2.2.5.Manufacturing
13.5.2.2.6.Retail
13.5.2.2.7.Hospitality
13.5.2.2.8.Others
13.5.2.3.Japan Physical Security Market Revenue (US$ Mn) and Forecasts, By End User
13.5.2.3.1.Residential
13.5.2.3.2.Commercial/Industrial
13.5.2.3.2.1.Small and Medium-sized Enterprises
13.5.2.3.2.2.Large Enterprises
13.5.3.India
13.5.3.1.India Physical Security Market Revenue (US$ Mn) and Forecasts, By Component
13.5.3.1.1.Systems/Software
13.5.3.1.1.1.Video Surveillance Systems
13.5.3.1.1.2.Biometrics and Access Control Systems
13.5.3.1.1.3.Intrusion Detection and Prevention Systems
13.5.3.1.1.4.Fire Detection Systems
13.5.3.1.1.5.Physical Security Information Management (PSIM)
13.5.3.1.1.6.Others
13.5.3.1.2.Services
13.5.3.1.2.1.System Integration
13.5.3.1.2.2.Remote Monitoring
13.5.3.1.2.3.Others
13.5.3.2.India Physical Security Market Revenue (US$ Mn) and Forecasts, By Industry Vertical
13.5.3.2.1.Transportation and Logistics
13.5.3.2.2.Government
13.5.3.2.3.Banking and Finance
13.5.3.2.4.Utility and Energy
13.5.3.2.5.Manufacturing
13.5.3.2.6.Retail
13.5.3.2.7.Hospitality
13.5.3.2.8.Others
13.5.3.3.India Physical Security Market Revenue (US$ Mn) and Forecasts, By End User
13.5.3.3.1.Residential
13.5.3.3.2.Commercial/Industrial
13.5.3.3.2.1.Small and Medium-sized Enterprises
13.5.3.3.2.2.Large Enterprises
13.5.4.New Zealand
13.5.4.1.New Zealand Physical Security Market Revenue (US$ Mn) and Forecasts, By Component
13.5.4.1.1.Systems/Software
13.5.4.1.1.1.Video Surveillance Systems
13.5.4.1.1.2.Biometrics and Access Control Systems
13.5.4.1.1.3.Intrusion Detection and Prevention Systems
13.5.4.1.1.4.Fire Detection Systems
13.5.4.1.1.5.Physical Security Information Management (PSIM)
13.5.4.1.1.6.Others
13.5.4.1.2.Services
13.5.4.1.2.1.System Integration
13.5.4.1.2.2.Remote Monitoring
13.5.4.1.2.3.Others
13.5.4.2.New Zealand Physical Security Market Revenue (US$ Mn) and Forecasts, By Industry Vertical
13.5.4.2.1.Transportation and Logistics
13.5.4.2.2.Government
13.5.4.2.3.Banking and Finance
13.5.4.2.4.Utility and Energy
13.5.4.2.5.Manufacturing
13.5.4.2.6.Retail
13.5.4.2.7.Hospitality
13.5.4.2.8.Others
13.5.4.3.New Zealand Physical Security Market Revenue (US$ Mn) and Forecasts, By End User
13.5.4.3.1.Residential
13.5.4.3.2.Commercial/Industrial
13.5.4.3.2.1.Small and Medium-sized Enterprises
13.5.4.3.2.2.Large Enterprises
13.5.5.Australia
13.5.5.1.Australia Physical Security Market Revenue (US$ Mn) and Forecasts, By Component
13.5.5.1.1.Systems/Software
13.5.5.1.1.1.Video Surveillance Systems
13.5.5.1.1.2.Biometrics and Access Control Systems
13.5.5.1.1.3.Intrusion Detection and Prevention Systems
13.5.5.1.1.4.Fire Detection Systems
13.5.5.1.1.5.Physical Security Information Management (PSIM)
13.5.5.1.1.6.Others
13.5.5.1.2.Services
13.5.5.1.2.1.System Integration
13.5.5.1.2.2.Remote Monitoring
13.5.5.1.2.3.Others
13.5.5.2.Australia Physical Security Market Revenue (US$ Mn) and Forecasts, By Industry Vertical
13.5.5.2.1.Transportation and Logistics
13.5.5.2.2.Government
13.5.5.2.3.Banking and Finance
13.5.5.2.4.Utility and Energy
13.5.5.2.5.Manufacturing
13.5.5.2.6.Retail
13.5.5.2.7.Hospitality
13.5.5.2.8.Others
13.5.5.3.Australia Physical Security Market Revenue (US$ Mn) and Forecasts, By End User
13.5.5.3.1.Residential
13.5.5.3.2.Commercial/Industrial
13.5.5.3.2.1.Small and Medium-sized Enterprises
13.5.5.3.2.2.Large Enterprises
13.5.6.South Korea
13.5.6.1.South Korea Physical Security Market Revenue (US$ Mn) and Forecasts, By Component
13.5.6.1.1.Systems/Software
13.5.6.1.1.1.Video Surveillance Systems
13.5.6.1.1.2.Biometrics and Access Control Systems
13.5.6.1.1.3.Intrusion Detection and Prevention Systems
13.5.6.1.1.4.Fire Detection Systems
13.5.6.1.1.5.Physical Security Information Management (PSIM)
13.5.6.1.1.6.Others
13.5.6.1.2.Services
13.5.6.1.2.1.System Integration
13.5.6.1.2.2.Remote Monitoring
13.5.6.1.2.3.Others
13.5.6.2.South Korea Physical Security Market Revenue (US$ Mn) and Forecasts, By Industry Vertical
13.5.6.2.1.Transportation and Logistics
13.5.6.2.2.Government
13.5.6.2.3.Banking and Finance
13.5.6.2.4.Utility and Energy
13.5.6.2.5.Manufacturing
13.5.6.2.6.Retail
13.5.6.2.7.Hospitality
13.5.6.2.8.Others
13.5.6.3.South Korea Physical Security Market Revenue (US$ Mn) and Forecasts, By End User
13.5.6.3.1.Residential
13.5.6.3.2.Commercial/Industrial
13.5.6.3.2.1.Small and Medium-sized Enterprises
13.5.6.3.2.2.Large Enterprises
13.5.7.Southeast Asia
13.5.7.1.Southeast Asia Physical Security Market Revenue (US$ Mn) and Forecasts, By Component
13.5.7.1.1.Systems/Software
13.5.7.1.1.1.Video Surveillance Systems
13.5.7.1.1.2.Biometrics and Access Control Systems
13.5.7.1.1.3.Intrusion Detection and Prevention Systems
13.5.7.1.1.4.Fire Detection Systems
13.5.7.1.1.5.Physical Security Information Management (PSIM)
13.5.7.1.1.6.Others
13.5.7.1.2.Services
13.5.7.1.2.1.System Integration
13.5.7.1.2.2.Remote Monitoring
13.5.7.1.2.3.Others
13.5.7.2.Southeast Asia Physical Security Market Revenue (US$ Mn) and Forecasts, By Industry Vertical
13.5.7.2.1.Transportation and Logistics
13.5.7.2.2.Government
13.5.7.2.3.Banking and Finance
13.5.7.2.4.Utility and Energy
13.5.7.2.5.Manufacturing
13.5.7.2.6.Retail
13.5.7.2.7.Hospitality
13.5.7.2.8.Others
13.5.7.3.Southeast Asia Physical Security Market Revenue (US$ Mn) and Forecasts, By End User
13.5.7.3.1.Residential
13.5.7.3.2.Commercial/Industrial
13.5.7.3.2.1.Small and Medium-sized Enterprises
13.5.7.3.2.2.Large Enterprises
13.5.7.4.Southeast Asia Physical Security Market Revenue (US$ Mn) and Forecasts, By Country
13.5.7.4.1.Indonesia
13.5.7.4.2.Thailand
13.5.7.4.3.Malaysia
13.5.7.4.4.Singapore
13.5.7.4.5.Rest of Southeast Asia
13.5.8.Rest of Asia Pacific
13.5.8.1.Rest of Asia Pacific Physical Security Market Revenue (US$ Mn) and Forecasts, By Component
13.5.8.1.1.Systems/Software
13.5.8.1.1.1.Video Surveillance Systems
13.5.8.1.1.2.Biometrics and Access Control Systems
13.5.8.1.1.3.Intrusion Detection and Prevention Systems
13.5.8.1.1.4.Fire Detection Systems
13.5.8.1.1.5.Physical Security Information Management (PSIM)
13.5.8.1.1.6.Others
13.5.8.1.2.Services
13.5.8.1.2.1.System Integration
13.5.8.1.2.2.Remote Monitoring
13.5.8.1.2.3.Others
13.5.8.2.Rest of Asia Pacific Physical Security Market Revenue (US$ Mn) and Forecasts, By Industry Vertical
13.5.8.2.1.Transportation and Logistics
13.5.8.2.2.Government
13.5.8.2.3.Banking and Finance
13.5.8.2.4.Utility and Energy
13.5.8.2.5.Manufacturing
13.5.8.2.6.Retail
13.5.8.2.7.Hospitality
13.5.8.2.8.Others
13.5.8.3.Rest of Asia Pacific Physical Security Market Revenue (US$ Mn) and Forecasts, By End User
13.5.8.3.1.Residential
13.5.8.3.2.Commercial/Industrial
13.5.8.3.2.1.Small and Medium-sized Enterprises
13.5.8.3.2.2.Large Enterprises
13.6.Key Segment for Channeling Investments
13.6.1.By Country
13.6.2.By Component
13.6.3.By Industry Vertical
13.6.4.By End User
14.Middle East and Africa Physical Security Market Analysis and Forecasts, 2024 – 2034
14.1.Overview
14.1.1.Middle East and Africa Physical Security Market Revenue (US$ Mn)
14.2.Middle East and Africa Physical Security Market Revenue (US$ Mn) and Forecasts, By Component
14.2.1.Systems/Software
14.2.1.1.Video Surveillance Systems
14.2.1.2.Biometrics and Access Control Systems
14.2.1.3.Intrusion Detection and Prevention Systems
14.2.1.4.Fire Detection Systems
14.2.1.5.Physical Security Information Management (PSIM)
14.2.1.6.Others
14.2.2.Services
14.2.2.1.System Integration
14.2.2.2.Remote Monitoring
14.2.2.3.Others
14.3.Middle East and Africa Physical Security Market Revenue (US$ Mn) and Forecasts, By Industry Vertical
14.3.1.Transportation and Logistics
14.3.2.Government
14.3.3.Banking and Finance
14.3.4.Utility and Energy
14.3.5.Manufacturing
14.3.6.Retail
14.3.7.Hospitality
14.3.8.Others
14.4.Middle East and Africa Physical Security Market Revenue (US$ Mn) and Forecasts, By End User
14.4.1.Residential
14.4.2.Commercial/Industrial
14.4.2.1.Small and Medium-sized Enterprises
14.4.2.2.Large Enterprises
14.5.Middle East and Africa Physical Security Market Revenue (US$ Mn) and Forecasts, By Country
14.5.1.Saudi Arabia
14.5.1.1.Saudi Arabia Physical Security Market Revenue (US$ Mn) and Forecasts, By Component
14.5.1.1.1.Systems/Software
14.5.1.1.1.1.Video Surveillance Systems
14.5.1.1.1.2.Biometrics and Access Control Systems
14.5.1.1.1.3.Intrusion Detection and Prevention Systems
14.5.1.1.1.4.Fire Detection Systems
14.5.1.1.1.5.Physical Security Information Management (PSIM)
14.5.1.1.1.6.Others
14.5.1.1.2.Services
14.5.1.1.2.1.System Integration
14.5.1.1.2.2.Remote Monitoring
14.5.1.1.2.3.Others
14.5.1.2.Saudi Arabia Physical Security Market Revenue (US$ Mn) and Forecasts, By Industry Vertical
14.5.1.2.1.Transportation and Logistics
14.5.1.2.2.Government
14.5.1.2.3.Banking and Finance
14.5.1.2.4.Utility and Energy
14.5.1.2.5.Manufacturing
14.5.1.2.6.Retail
14.5.1.2.7.Hospitality
14.5.1.2.8.Others
14.5.1.3.Saudi Arabia Physical Security Market Revenue (US$ Mn) and Forecasts, By End User
14.5.1.3.1.Residential
14.5.1.3.2.Commercial/Industrial
14.5.1.3.2.1.Small and Medium-sized Enterprises
14.5.1.3.2.2.Large Enterprises
14.5.2.UAE
14.5.2.1.UAE Physical Security Market Revenue (US$ Mn) and Forecasts, By Component
14.5.2.1.1.Systems/Software
14.5.2.1.1.1.Video Surveillance Systems
14.5.2.1.1.2.Biometrics and Access Control Systems
14.5.2.1.1.3.Intrusion Detection and Prevention Systems
14.5.2.1.1.4.Fire Detection Systems
14.5.2.1.1.5.Physical Security Information Management (PSIM)
14.5.2.1.1.6.Others
14.5.2.1.2.Services
14.5.2.1.2.1.System Integration
14.5.2.1.2.2.Remote Monitoring
14.5.2.1.2.3.Others
14.5.2.2.UAE Physical Security Market Revenue (US$ Mn) and Forecasts, By Industry Vertical
14.5.2.2.1.Transportation and Logistics
14.5.2.2.2.Government
14.5.2.2.3.Banking and Finance
14.5.2.2.4.Utility and Energy
14.5.2.2.5.Manufacturing
14.5.2.2.6.Retail
14.5.2.2.7.Hospitality
14.5.2.2.8.Others
14.5.2.3.UAE Physical Security Market Revenue (US$ Mn) and Forecasts, By End User
14.5.2.3.1.Residential
14.5.2.3.2.Commercial/Industrial
14.5.2.3.2.1.Small and Medium-sized Enterprises
14.5.2.3.2.2.Large Enterprises
14.5.3.Egypt
14.5.3.1.Egypt Physical Security Market Revenue (US$ Mn) and Forecasts, By Component
14.5.3.1.1.Systems/Software
14.5.3.1.1.1.Video Surveillance Systems
14.5.3.1.1.2.Biometrics and Access Control Systems
14.5.3.1.1.3.Intrusion Detection and Prevention Systems
14.5.3.1.1.4.Fire Detection Systems
14.5.3.1.1.5.Physical Security Information Management (PSIM)
14.5.3.1.1.6.Others
14.5.3.1.2.Services
14.5.3.1.2.1.System Integration
14.5.3.1.2.2.Remote Monitoring
14.5.3.1.2.3.Others
14.5.3.2.Egypt Physical Security Market Revenue (US$ Mn) and Forecasts, By Industry Vertical
14.5.3.2.1.Transportation and Logistics
14.5.3.2.2.Government
14.5.3.2.3.Banking and Finance
14.5.3.2.4.Utility and Energy
14.5.3.2.5.Manufacturing
14.5.3.2.6.Retail
14.5.3.2.7.Hospitality
14.5.3.2.8.Others
14.5.3.3.Egypt Physical Security Market Revenue (US$ Mn) and Forecasts, By End User
14.5.3.3.1.Residential
14.5.3.3.2.Commercial/Industrial
14.5.3.3.2.1.Small and Medium-sized Enterprises
14.5.3.3.2.2.Large Enterprises
14.5.4.Kuwait
14.5.4.1.Kuwait Physical Security Market Revenue (US$ Mn) and Forecasts, By Component
14.5.4.1.1.Systems/Software
14.5.4.1.1.1.Video Surveillance Systems
14.5.4.1.1.2.Biometrics and Access Control Systems
14.5.4.1.1.3.Intrusion Detection and Prevention Systems
14.5.4.1.1.4.Fire Detection Systems
14.5.4.1.1.5.Physical Security Information Management (PSIM)
14.5.4.1.1.6.Others
14.5.4.1.2.Services
14.5.4.1.2.1.System Integration
14.5.4.1.2.2.Remote Monitoring
14.5.4.1.2.3.Others
14.5.4.2.Kuwait Physical Security Market Revenue (US$ Mn) and Forecasts, By Industry Vertical
14.5.4.2.1.Transportation and Logistics
14.5.4.2.2.Government
14.5.4.2.3.Banking and Finance
14.5.4.2.4.Utility and Energy
14.5.4.2.5.Manufacturing
14.5.4.2.6.Retail
14.5.4.2.7.Hospitality
14.5.4.2.8.Others
14.5.4.3.Kuwait Physical Security Market Revenue (US$ Mn) and Forecasts, By End User
14.5.4.3.1.Residential
14.5.4.3.2.Commercial/Industrial
14.5.4.3.2.1.Small and Medium-sized Enterprises
14.5.4.3.2.2.Large Enterprises
14.5.5.South Africa
14.5.5.1.South Africa Physical Security Market Revenue (US$ Mn) and Forecasts, By Component
14.5.5.1.1.Systems/Software
14.5.5.1.1.1.Video Surveillance Systems
14.5.5.1.1.2.Biometrics and Access Control Systems
14.5.5.1.1.3.Intrusion Detection and Prevention Systems
14.5.5.1.1.4.Fire Detection Systems
14.5.5.1.1.5.Physical Security Information Management (PSIM)
14.5.5.1.1.6.Others
14.5.5.1.2.Services
14.5.5.1.2.1.System Integration
14.5.5.1.2.2.Remote Monitoring
14.5.5.1.2.3.Others
14.5.5.2.South Africa Physical Security Market Revenue (US$ Mn) and Forecasts, By Industry Vertical
14.5.5.2.1.Transportation and Logistics
14.5.5.2.2.Government
14.5.5.2.3.Banking and Finance
14.5.5.2.4.Utility and Energy
14.5.5.2.5.Manufacturing
14.5.5.2.6.Retail
14.5.5.2.7.Hospitality
14.5.5.2.8.Others
14.5.5.3.South Africa Physical Security Market Revenue (US$ Mn) and Forecasts, By End User
14.5.5.3.1.Residential
14.5.5.3.2.Commercial/Industrial
14.5.5.3.2.1.Small and Medium-sized Enterprises
14.5.5.3.2.2.Large Enterprises
14.5.6.Rest of Middle East & Africa
14.5.6.1.Rest of Middle East & Africa Physical Security Market Revenue (US$ Mn) and Forecasts, By Component
14.5.6.1.1.Systems/Software
14.5.6.1.1.1.Video Surveillance Systems
14.5.6.1.1.2.Biometrics and Access Control Systems
14.5.6.1.1.3.Intrusion Detection and Prevention Systems
14.5.6.1.1.4.Fire Detection Systems
14.5.6.1.1.5.Physical Security Information Management (PSIM)
14.5.6.1.1.6.Others
14.5.6.1.2.Services
14.5.6.1.2.1.System Integration
14.5.6.1.2.2.Remote Monitoring
14.5.6.1.2.3.Others
14.5.6.2.Rest of Middle East & Africa Physical Security Market Revenue (US$ Mn) and Forecasts, By Industry Vertical
14.5.6.2.1.Transportation and Logistics
14.5.6.2.2.Government
14.5.6.2.3.Banking and Finance
14.5.6.2.4.Utility and Energy
14.5.6.2.5.Manufacturing
14.5.6.2.6.Retail
14.5.6.2.7.Hospitality
14.5.6.2.8.Others
14.5.6.3.Rest of Middle East & Africa Physical Security Market Revenue (US$ Mn) and Forecasts, By End User
14.5.6.3.1.Residential
14.5.6.3.2.Commercial/Industrial
14.5.6.3.2.1.Small and Medium-sized Enterprises
14.5.6.3.2.2.Large Enterprises
14.6.Key Segment for Channeling Investments
14.6.1.By Country
14.6.2.By Component
14.6.3.By Industry Vertical
14.6.4.By End User
15.Latin America Physical Security Market Analysis and Forecasts, 2024 – 2034
15.1.Overview
15.1.1.Latin America Physical Security Market Revenue (US$ Mn)
15.2.Latin America Physical Security Market Revenue (US$ Mn) and Forecasts, By Component
15.2.1.Systems/Software
15.2.1.1.Video Surveillance Systems
15.2.1.2.Biometrics and Access Control Systems
15.2.1.3.Intrusion Detection and Prevention Systems
15.2.1.4.Fire Detection Systems
15.2.1.5.Physical Security Information Management (PSIM)
15.2.1.6.Others
15.2.2.Services
15.2.2.1.System Integration
15.2.2.2.Remote Monitoring
15.2.2.3.Others
15.3.Latin America Physical Security Market Revenue (US$ Mn) and Forecasts, By Industry Vertical
15.3.1.Transportation and Logistics
15.3.2.Government
15.3.3.Banking and Finance
15.3.4.Utility and Energy
15.3.5.Manufacturing
15.3.6.Retail
15.3.7.Hospitality
15.3.8.Others
15.4.Latin America Physical Security Market Revenue (US$ Mn) and Forecasts, By End User
15.4.1.Residential
15.4.2.Commercial/Industrial
15.4.2.1.Small and Medium-sized Enterprises
15.4.2.2.Large Enterprises
15.5.Latin America Physical Security Market Revenue (US$ Mn) and Forecasts, By Country
15.5.1.Brazil
15.5.1.1.Brazil Physical Security Market Revenue (US$ Mn) and Forecasts, By Component
15.5.1.1.1.Systems/Software
15.5.1.1.1.1.Video Surveillance Systems
15.5.1.1.1.2.Biometrics and Access Control Systems
15.5.1.1.1.3.Intrusion Detection and Prevention Systems
15.5.1.1.1.4.Fire Detection Systems
15.5.1.1.1.5.Physical Security Information Management (PSIM)
15.5.1.1.1.6.Others
15.5.1.1.2.Services
15.5.1.1.2.1.System Integration
15.5.1.1.2.2.Remote Monitoring
15.5.1.1.2.3.Others
15.5.1.2.Brazil Physical Security Market Revenue (US$ Mn) and Forecasts, By Industry Vertical
15.5.1.2.1.Transportation and Logistics
15.5.1.2.2.Government
15.5.1.2.3.Banking and Finance
15.5.1.2.4.Utility and Energy
15.5.1.2.5.Manufacturing
15.5.1.2.6.Retail
15.5.1.2.7.Hospitality
15.5.1.2.8.Others
15.5.1.3.Brazil Physical Security Market Revenue (US$ Mn) and Forecasts, By End User
15.5.1.3.1.Residential
15.5.1.3.2.Commercial/Industrial
15.5.1.3.2.1.Small and Medium-sized Enterprises
15.5.1.3.2.2.Large Enterprises
15.5.2.Argentina
15.5.2.1.Argentina Physical Security Market Revenue (US$ Mn) and Forecasts, By Component
15.5.2.1.1.Systems/Software
15.5.2.1.1.1.Video Surveillance Systems
15.5.2.1.1.2.Biometrics and Access Control Systems
15.5.2.1.1.3.Intrusion Detection and Prevention Systems
15.5.2.1.1.4.Fire Detection Systems
15.5.2.1.1.5.Physical Security Information Management (PSIM)
15.5.2.1.1.6.Others
15.5.2.1.2.Services
15.5.2.1.2.1.System Integration
15.5.2.1.2.2.Remote Monitoring
15.5.2.1.2.3.Others
15.5.2.2.Argentina Physical Security Market Revenue (US$ Mn) and Forecasts, By Industry Vertical
15.5.2.2.1.Transportation and Logistics
15.5.2.2.2.Government
15.5.2.2.3.Banking and Finance
15.5.2.2.4.Utility and Energy
15.5.2.2.5.Manufacturing
15.5.2.2.6.Retail
15.5.2.2.7.Hospitality
15.5.2.2.8.Others
15.5.2.3.Argentina Physical Security Market Revenue (US$ Mn) and Forecasts, By End User
15.5.2.3.1.Residential
15.5.2.3.2.Commercial/Industrial
15.5.2.3.2.1.Small and Medium-sized Enterprises
15.5.2.3.2.2.Large Enterprises
15.5.3.Rest of Latin America
15.5.3.1.Rest of Latin America Physical Security Market Revenue (US$ Mn) and Forecasts, By Component
15.5.3.1.1.Systems/Software
15.5.3.1.1.1.Video Surveillance Systems
15.5.3.1.1.2.Biometrics and Access Control Systems
15.5.3.1.1.3.Intrusion Detection and Prevention Systems
15.5.3.1.1.4.Fire Detection Systems
15.5.3.1.1.5.Physical Security Information Management (PSIM)
15.5.3.1.1.6.Others
15.5.3.1.2.Services
15.5.3.1.2.1.System Integration
15.5.3.1.2.2.Remote Monitoring
15.5.3.1.2.3.Others
15.5.3.2.Rest of Latin America Physical Security Market Revenue (US$ Mn) and Forecasts, By Industry Vertical
15.5.3.2.1.Transportation and Logistics
15.5.3.2.2.Government
15.5.3.2.3.Banking and Finance
15.5.3.2.4.Utility and Energy
15.5.3.2.5.Manufacturing
15.5.3.2.6.Retail
15.5.3.2.7.Hospitality
15.5.3.2.8.Others
15.5.3.3.Rest of Latin America Physical Security Market Revenue (US$ Mn) and Forecasts, By End User
15.5.3.3.1.Residential
15.5.3.3.2.Commercial/Industrial
15.5.3.3.2.1.Small and Medium-sized Enterprises
15.5.3.3.2.2.Large Enterprises
15.6.Key Segment for Channeling Investments
15.6.1.By Country
15.6.2.By Component
15.6.3.By Industry Vertical
15.6.4.By End User
16.Competitive Benchmarking
16.1.Brand Benchmarking
16.2.Market Share Analysis, 2023
16.3.Global Presence and Growth Strategies
16.3.1.Mergers and Acquisitions
16.3.2.Product Launches
16.3.3.Investments Trends
16.3.4.R&D Initiatives
17.Player Profiles
17.1.ADT LLC
17.1.1.Company Details
17.1.2.Company Overview
17.1.3.Product Offerings
17.1.4.Key Developments
17.1.5.Financial Analysis
17.1.6.SWOT Analysis
17.1.7.Business Strategies
17.2.Axis Communications AB
17.2.1.Company Details
17.2.2.Company Overview
17.2.3.Product Offerings
17.2.4.Key Developments
17.2.5.Financial Analysis
17.2.6.SWOT Analysis
17.2.7.Business Strategies
17.3.Bosch Sicherheitssysteme GmbH
17.3.1.Company Details
17.3.2.Company Overview
17.3.3.Product Offerings
17.3.4.Key Developments
17.3.5.Financial Analysis
17.3.6.SWOT Analysis
17.3.7.Business Strategies
17.4.Cisco Systems Inc.
17.4.1.Company Details
17.4.2.Company Overview
17.4.3.Product Offerings
17.4.4.Key Developments
17.4.5.Financial Analysis
17.4.6.SWOT Analysis
17.4.7.Business Strategies
17.5.Dahua Technology Co., Ltd
17.5.1.Company Details
17.5.2.Company Overview
17.5.3.Product Offerings
17.5.4.Key Developments
17.5.5.Financial Analysis
17.5.6.SWOT Analysis
17.5.7.Business Strategies
17.6.Genetec Inc.
17.6.1.Company Details
17.6.2.Company Overview
17.6.3.Product Offerings
17.6.4.Key Developments
17.6.5.Financial Analysis
17.6.6.SWOT Analysis
17.6.7.Business Strategies
17.7.Hangzhou Hikvision Digital Technology Co., Ltd.
17.7.1.Company Details
17.7.2.Company Overview
17.7.3.Product Offerings
17.7.4.Key Developments
17.7.5.Financial Analysis
17.7.6.SWOT Analysis
17.7.7.Business Strategies
17.8.Honeywell International, Inc.
17.8.1.Company Details
17.8.2.Company Overview
17.8.3.Product Offerings
17.8.4.Key Developments
17.8.5.Financial Analysis
17.8.6.SWOT Analysis
17.8.7.Business Strategies
17.9.Johnson Controls
17.9.1.Company Details
17.9.2.Company Overview
17.9.3.Product Offerings
17.9.4.Key Developments
17.9.5.Financial Analysis
17.9.6.SWOT Analysis
17.9.7.Business Strategies
17.10.Pelco
17.10.1.Company Details
17.10.2.Company Overview
17.10.3.Product Offerings
17.10.4.Key Developments
17.10.5.Financial Analysis
17.10.6.SWOT Analysis
17.10.7.Business Strategies
17.11.Robert Bosch GmbH
17.11.1.Company Details
17.11.2.Company Overview
17.11.3.Product Offerings
17.11.4.Key Developments
17.11.5.Financial Analysis
17.11.6.SWOT Analysis
17.11.7.Business Strategies
17.12.SECOM CO., LTD.
17.12.1.Company Details
17.12.2.Company Overview
17.12.3.Product Offerings
17.12.4.Key Developments
17.12.5.Financial Analysis
17.12.6.SWOT Analysis
17.12.7.Business Strategies
17.13.Siemens
17.13.1.Company Details
17.13.2.Company Overview
17.13.3.Product Offerings
17.13.4.Key Developments
17.13.5.Financial Analysis
17.13.6.SWOT Analysis
17.13.7.Business Strategies
17.14.Other Industry Participants
18.Key Findings

.

Note: This ToC is tentative and can be changed according to the research study conducted during the course of report completion.

**Exclusive for Multi-User and Enterprise User.

Global Physical Security Market Segmentation:

By Component

  • Systems/Software
    • Video Surveillance Systems
    • Biometrics & Access Control Systems
    • Intrusion Detection and Prevention Systems
    • Fire Detection Systems
    • Physical Security Information Management (PSIM)
    • Others
  • Services
    • System Integration
    • Remote Monitoring
    • Others

By Industry Vertical

  • Transportation and Logistics
  • Government
  • Banking & Finance
  • Utility & Energy
  • Manufacturing
  • Retail
  • Hospitality
  • Others

By End User

  • Residential
  • Commercial/Industrial
    • Small and Medium-sized Enterprises
    • Large Enterprises

By Region

  • North America (U.S., Canada, Mexico, Rest of North America)
  • Europe (France, The UK, Spain, Germany, Italy, Nordic Countries (Denmark, Finland, Iceland, Sweden, Norway), Benelux Union (Belgium, The Netherlands, Luxembourg), Rest of Europe)
  • Asia Pacific (China, Japan, India, New Zealand, Australia, South Korea, Southeast Asia (Indonesia, Thailand, Malaysia, Singapore, Rest of Southeast Asia), Rest of Asia Pacific)
  • Middle East & Africa (Saudi Arabia, UAE, Egypt, Kuwait, South Africa, Rest of Middle East & Africa)
  • Latin America (Brazil, Argentina, Rest of Latin America)


The Niche Research approach encompasses both primary and secondary research methods to provide comprehensive insights. While primary research is the cornerstone of our studies, we also incorporate secondary research sources such as company annual reports, premium industry databases, press releases, industry journals, and white papers.

Within our primary research, we actively engage with various industry stakeholders, conducting paid interviews and surveys. Our meticulous analysis extends to every market participant in major countries, allowing us to thoroughly examine their portfolios, calculate market shares, and segment revenues.

Our data collection primarily focuses on individual countries within our research scope, enabling us to estimate regional market sizes. Typically, we employ a bottom-up approach, meticulously tracking trends in different countries. We analyze growth drivers, constraints, technological innovations, and opportunities for each country, ultimately arriving at regional figures.Our process begins by examining the growth prospects of each country. Building upon these insights, we project growth and trends for the entire region. Finally, we utilize our proprietary model to refine estimations and forecasts.

Our data validation standards are integral to ensuring the reliability and accuracy of our research findings. Here’s a breakdown of our data validation processes and the stakeholders we engage with during our primary research:

  • Supply Side Analysis: We initiate a supply side analysis by directly contacting market participants, through telephonic interviews and questionnaires containing both open-ended and close-ended questions. We gather information on their portfolios, segment revenues, developments, and growth strategies.
  • Demand Side Analysis: To gain insights into adoption trends and consumer preferences, we reach out to target customers and users (non-vendors). This information forms a vital part of the qualitative analysis section of our reports, covering market dynamics, adoption trends, consumer behavior, spending patterns, and other related aspects.
  • Consultant Insights: We tap into the expertise of our partner consultants from around the world to obtain their unique viewpoints and perspectives. Their insights contribute to a well-rounded understanding of the markets under investigation.
  • In-House Validation: To ensure data accuracy and reliability, we conduct cross-validation of data points and information through our in-house team of consultants and utilize advanced data modeling tools for thorough verification.

The forecasts we provide are based on a comprehensive assessment of various factors, including:

  • Market Trends and Past Performance (Last Five Years): We accurately analyze market trends and performance data from preceding five years to identify historical patterns and understand the market’s evolution.
  • Historical Performance and Growth of Market Participants: We assess the historical performance and growth trajectories of key market participants. This analysis provides insights into the competitive landscape and individual company strategies.
  • Market Determinants Impact Analysis (Next Eight Years): We conduct a rigorous analysis of the factors that are projected to influence the market over the next eight years. This includes assessing both internal and external determinants that can shape market dynamics.
  • Drivers and Challenges for the Forecast Period:Identify the factors expected to drive market growth during the forecast period, as well as the challenges that the industry may face. This analysis aids in deriving an accurate growth rate projection.
  • New Acquisitions, Collaborations, or Partnerships: We keep a close watch on any new acquisitions, collaborations, or partnerships within the industry. These developments can have a significant impact on market dynamics and competitiveness.
  • Macro and Micro Factors Analysis:A thorough examination of both macro-level factors (e.g., economic trends, regulatory changes) and micro-level factors (e.g., technological advancements, consumer preferences) that may influence the market during the forecast period.
  • End-User Sentiment Analysis: To understand the market from the end-user perspective, we conduct sentiment analysis. This involves assessing the sentiment, preferences, and feedback of the end-users, which can provide valuable insights into market trends.
  • Perspective of Primary Participants: Insights gathered directly from primary research participants play a crucial role in shaping our forecasts. Their perspectives and experiences provide valuable qualitative data.
  • Year-on-Year Growth Trend: We utilize a year-on-year growth trend based on historical market growth and expected future trends. This helps in formulating our growth projections, aligning them with the market’s historical performance.

Research process adopted by TNR involves multiple stages, including data collection, validation, quality checks, and presentation. It’s crucial that the data and information we provide add value to your existing market understanding and expertise. We have also established partnerships with business consulting, research, and survey organizations across regions and globally to collaborate on regional analysis and data validation, ensuring the highest level of accuracy and reliability in our reports.


Procure Comprehensive Study of

Global Physical Security Market

Online Only

  • Online Access
  • Read Only File
  • Validity 3 Months
  • Print, Copy, Paste & Download
  • PPT, Excel
  • Cost-Free Report in the Next Update
$3300
Buy Now

Single User

  • Access to One User on One System
  • Read Only File
  • Validity 6 Months
  • Limited Print,Copy, Paste
  • PPT, Excel
  • Cost-Free Report in the Next Update
$4200
Buy Now

Multi User

  • Access to Fiver Users
  • PDF File
  • Validity 1 Year
  • Upto FivePrints
  • Cost-Free Report in the Next Update
  • PPT, Excel
$6000
Buy Now

Enterprise User

  • Access to Unlimited Users
  • PDF, PPT, Excel
  • Unlimited Validity, Prints&Downloads
  • 1 Hour Cost-Free & Dedicated Analyst Support
  • 10% Cost-Free Customization
  • Cost-Free Report Update Twice in a Year
  • Recommendations for Business Strategies
  • Authorization to Quote TNR, The Niche Research
$7300
Buy Now

Library Access

  • Online Access to Content Publications
  • Access Player Profiles Online
  • Get Immediate Access to Newly Added Content
  • Acquire 12 PDF Downloads
  • Acquire 5 Excel Data Sets
  • Gain Access to 290+ PDFs of Company Profiles
  • Round-the-clock Email and Phone Assistance
  • Dashboard Usage and Trends
  • Renewal & Upgrade Assistance
  • Assessing Customization Options and Alerts for New Reports
$10788
Buy Now
*Taxes/Fees, if applicable will be added during checkout. All prices in USD

Why TNR The Niche Research?

  • Unwavering Commitment to Excellence

  • Veteran Team of Researchers

  • Accurate and Timely Insights

  • Ethical Practices and Customized Service

  • Uninterrupted Availability Around the Clock

Scroll to Top