Global Portable Power Station Market, By Power Source, By Technology, By Sales Channel, By Region & Segmental Insights Trends and Forecast, 2024 – 2034

  • Industry: Energy & Power
  • Report ID: TNR-110-1206
  • Number of Pages: 420
  • Table/Charts : Yes
  • July, 2024
  • Base Year : 2024
  • No. of Companies : 10+
  • No. of Countries : 29
  • Views : 10068
  • Covid Impact Covered: Yes
  • War Impact Covered: Yes
  • Formats : PDF, Excel, PPT

The portable power station market has seen significant growth in recent years, driven by the increasing demand for reliable and convenient power solutions. These versatile units, which typically include lithium-ion batteries, offer a sustainable alternative to traditional gas-powered generators, making them ideal for both emergency backup and outdoor activities. The market is buoyed by the rising awareness of environmental issues and the corresponding shift towards clean energy solutions.

Key trends in the market include advancements in battery technology, leading to higher capacity and longer life cycles. There is also a growing integration of smart technology, allowing users to monitor and control power usage via mobile apps. Opportunities abound in the expanding recreational vehicle (RV) market, as well as in the development of portable power stations tailored for specific industries, such as construction and healthcare.

The primary growth drivers include increasing occurrences of power outages due to extreme weather conditions, the growing popularity of outdoor recreational activities, and the rising adoption of renewable energy sources. Government incentives and regulations promoting clean energy are also propelling market growth. As consumer electronics become more essential in daily life, the need for portable, reliable power sources is expected to continue its upward trajectory.

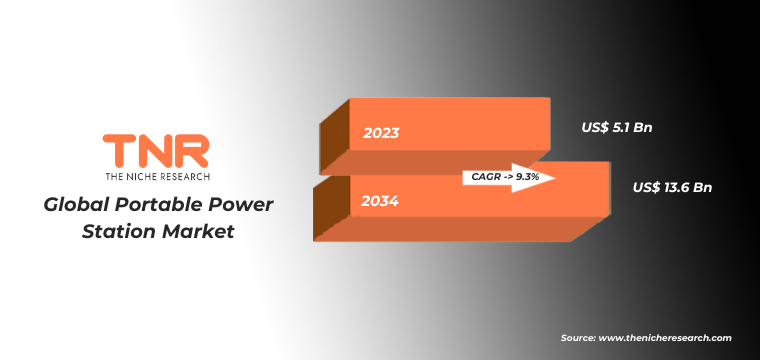
In Terms of Revenue, the Global Portable Power Station Market was Worth US$ 5.1 Bn in 2023, Anticipated to Witness CAGR of 9.3% During 2024 – 2034.

Trends in the Global Portable Power Station Market

  • Advanced Battery Technology: Innovations in lithium-ion and lithium iron phosphate (LiFePO4) batteries have led to higher energy densities, longer life cycles, and improved safety features. These advancements enable portable power stations to store more power in smaller, lighter units, making them more convenient for users. Faster charging capabilities and enhanced thermal management systems are becoming standard, addressing consumer concerns about downtime and overheating. As technology continues to evolve, the efficiency and reliability of portable power stations are expected to improve further, driving their adoption across various applications, from emergency backup to outdoor activities and professional use.
  • Integration of Smart Technology: Modern units increasingly feature advanced interfaces that allow users to monitor and manage power consumption through dedicated mobile apps or built-in touchscreens. These smart features enable real-time tracking of battery levels, input/output status, and estimated runtime, providing users with greater control and convenience. Some models offer remote control capabilities, allowing users to operate and configure their power stations from a distance. The incorporation of smart technology not only enhances user experience but also improves energy efficiency by optimizing power usage based on real-time data. This trend is expected to continue as manufacturers seek to differentiate their products in a competitive market.

Hybrid source by power source category has emerged as a dominant segment in the global portable power station market, combining renewable energy, such as solar, with traditional power sources like batteries or fuel generators. This dual capability ensures a more reliable and versatile power supply, catering to a wider range of applications. Users benefit from the eco-friendly nature of solar power while maintaining the reliability of conventional power sources. Hybrid systems are particularly advantageous in off-grid and remote locations where access to a consistent power supply is crucial. The growing demand for sustainable energy solutions, coupled with advancements in hybrid technology, positions this segment for substantial growth, addressing both environmental concerns and the need for dependable power.

In 2023, lead-acid batteries segment solidified its position as the second-largest technology category within the global portable power station market. Despite the increasing popularity of lithium-ion alternatives, lead-acid batteries remain favored for their cost-effectiveness, reliability, and robust performance in various applications. Their ability to provide high surge currents and withstand harsh environmental conditions makes them ideal for heavy-duty and industrial uses. Advancements in lead-acid technology have improved their energy density and cycle life, further enhancing their competitiveness. This segment’s strong market presence is driven by ongoing demand in sectors requiring durable, low-cost power solutions, ensuring its continued relevance in the evolving portable power station landscape.

Online segment, categorized by sales channel, has exerted significant dominance over the global portable power station market, reflecting changing consumer behaviors and the growing importance of e-commerce. The convenience of online shopping, combined with the ability to compare products, read reviews, and access a wider range of options, has made online platforms the preferred choice for many consumers. Major e-commerce giants and specialized online retailers offer competitive pricing, promotional deals, and fast shipping, enhancing the appeal of buying portable power stations online. Additionally, the COVID-19 pandemic accelerated the shift to digital shopping, further solidifying the online segment’s dominance. This trend is expected to continue as consumers increasingly prioritize convenience and accessibility in their purchasing decisions.

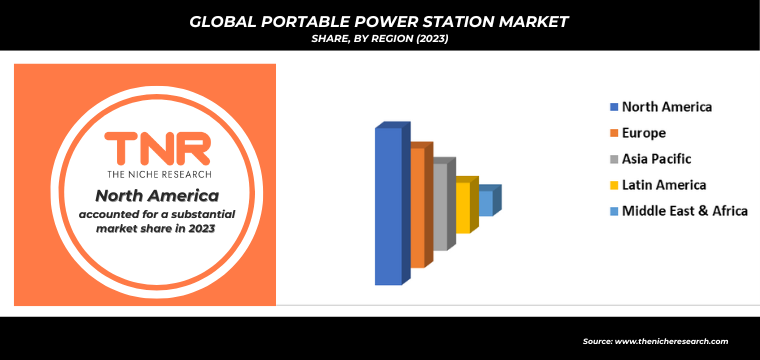
In 2023, North America solidified its dominance in the global portable power station market, contributing a revenue share of 35.7%. This leadership is driven by the region’s high demand for reliable backup power solutions amid increasing occurrences of power outages and natural disasters. The popularity of outdoor recreational activities, such as camping and RVing, has spurred demand for portable power stations. Strong consumer awareness of renewable energy solutions and favourable government policies promoting clean energy also contribute to market growth. The presence of key industry players and rapid technological advancements further bolster North America’s prominent position in the market, ensuring sustained growth and innovation in portable power solutions.

Competitive Landscape

Some of the players operating in the portable power station market are

  • Anker Technology (UK) Ltd
  • Bluetti
  • Duracell Inc.
  • EcoFlow
  • Goal Zero
  • Indiegogo Inc.
  • Jackery Inc.
  • Lion Energy
  • Maxoak
  • Maxoak Technology
  • Milwaukee Tool
  • Rockpals
  • Other Industry Participants

Global Portable Power Station Market Scope

Report Specifications Details
Market Revenue in 2023 US$ 5.1 Bn
Market Size Forecast by 2034 US$ 13.6 Bn
Growth Rate (CAGR) 9.3%
Historic Data 2016 – 2022
Base Year for Estimation 2023
Forecast Period 2024 – 2034
Report Inclusions Market Size & Estimates, Market Dynamics, Competitive Scenario, Trends, Growth Factors, Market Determinants, Key Investment Segmentation, Product/Service/Solutions Benchmarking
Segments Covered By Power Source, By Technology, By Sales Channel, By Region
Regions Covered North America, Europe, Asia Pacific, Middle East & Africa, Latin America
Countries Covered U.S., Canada, Mexico, Rest of North America,  France, The UK, Spain, Germany, Italy, Nordic Countries (Denmark, Finland, Iceland, Sweden, Norway), Benelux Union (Belgium, The Netherlands, Luxembourg), Rest of Europe,  China, Japan, India, New Zealand, Australia, South Korea, Southeast Asia (Indonesia, Thailand, Malaysia, Singapore, Rest of Southeast Asia), Rest of Asia Pacific,  Saudi Arabia, UAE, Egypt, Kuwait, South Africa, Rest of Middle East & Africa,  Brazil, Argentina, Rest of Latin America
Key Players Anker Technology (UK) Ltd, Bluetti, Duracell Inc., EcoFlow, Goal Zero, Indiegogo Inc., Jackery Inc., Lion Energy, Maxoak, Maxoak Technology, Milwaukee Tool, Rockpals
Customization Scope Customization allows for the inclusion/modification of content pertaining to geographical regions, countries, and specific market segments.
Pricing & Procurement Options Explore purchase options tailored to your specific research requirements
Contact Details Consult With Our Expert

Japan (Toll-Free):  +81 663-386-8111

South Korea (Toll-Free):  +82-808- 703-126

Saudi Arabia (Toll-Free):  +966 800-850-1643

United Kingdom: +44 753-710-5080

United States: +1 302-232-5106

E-mail:  askanexpert@thenicheresearch.com


Global Portable Power Station Market

By Power Source

  • Direct source
  • Hybrid source

By Technology

  • Lithium-ion Batteries
  • Lead-acid Batteries
  • Others

By Sales Channel

  • Online
  • Offline

By Region

  • North America (U.S., Canada, Mexico, Rest of North America)
  • Europe (France, The UK, Spain, Germany, Italy, Nordic Countries (Denmark, Finland, Iceland, Sweden, Norway), Benelux Union (Belgium, The Netherlands, Luxembourg), Rest of Europe)
  • Asia Pacific (China, Japan, India, New Zealand, Australia, South Korea, Southeast Asia (Indonesia, Thailand, Malaysia, Singapore, Rest of Southeast Asia), Rest of Asia Pacific)
  • Middle East & Africa (Saudi Arabia, UAE, Egypt, Kuwait, South Africa, Rest of Middle East & Africa)
  • Latin America (Brazil, Argentina, Rest of Latin America)

Report Layout:

Table of Contents

.

1.Market Scope
1.1.Market Segmentation
1.2.Years Considered
1.2.1.Historic Years: 2016 – 2022
1.2.2.Base Year: 2023
1.2.3.Forecast Years: 2024 – 2034
2.Key Target Audiences
3.Research Methodology
3.1.Primary Research
3.1.1.Research Questionnaire
3.1.2.Global Percentage Breakdown
3.1.3.Primary Interviews: Key Opinion Leaders (KOLs)
3.2.Secondary Research
3.2.1.Paid Databases
3.2.2.Secondary Sources
3.3.Market Size Estimates
3.3.1.Top-Down Approach
3.3.2.Bottom-Up Approach
3.4.Data Triangulation Methodology
3.5.Research Assumptions
4.Recommendations and Insights from TNR’s Perspective**
5.Holistic Overview of Portable Power Station Market
6.Market Synopsis: Portable Power Station Market
7.Portable Power Station Market Analysis: Qualitative Perspective
7.1.Introduction
7.1.1.Product Definition
7.1.2.Industry Development
7.2.Market Dynamics
7.2.1.Drivers
7.2.2.Restraints
7.2.3.Opportunities
7.2.4.Challenges
7.3.Trends in Portable Power Station Market
7.4.Market Determinants Radar Chart
7.5.Macro-Economic and Micro-Economic Indicators: Portable Power Station Market
7.6.Industry Gross Margin Overview
7.7.Porter’s Five Force Analysis
7.8.Impact of Covid-19 on Portable Power Station Market
7.9.PESTEL Analysis
7.10.Value Chain Analysis
7.11.Pricing Analysis, By Region (2023)
7.11.1.North America
7.11.2.Europe
7.11.3.Asia Pacific
7.11.4.Middle East and Africa
7.11.5.Latin America
8.Global Portable Power Station Market Analysis and Forecasts, 2024 – 2034
8.1.Overview
8.1.1.Global Portable Power Station Market Revenue (US$ Mn)
8.2.Global Portable Power Station Market Revenue (US$ Mn) and Forecasts, By Power Source
8.2.1.Direct source
8.2.1.1.Definition
8.2.1.2.Market Estimation and Penetration, 2016 – 2023
8.2.1.3.Market Forecast, 2024 – 2034
8.2.1.4.Compound Annual Growth Rate (CAGR)
8.2.1.5.Regional Bifurcation
8.2.1.5.1.North America
8.2.1.5.1.1.Market Estimation, 2016 – 2023
8.2.1.5.1.2.Market Forecast, 2024 – 2034
8.2.1.5.2.Europe
8.2.1.5.2.1.Market Estimation, 2016 – 2023
8.2.1.5.2.2.Market Forecast, 2024 – 2034
8.2.1.5.3.Asia Pacific
8.2.1.5.3.1.Market Estimation, 2016 – 2023
8.2.1.5.3.2.Market Forecast, 2024 – 2034
8.2.1.5.4.Middle East and Africa
8.2.1.5.4.1.Market Estimation, 2016 – 2023
8.2.1.5.4.2.Market Forecast, 2024 – 2034
8.2.1.5.5.Latin America
8.2.1.5.5.1.Market Estimation, 2016 – 2023
8.2.1.5.5.2.Market Forecast, 2024 – 2034
8.2.2.Hybrid source
8.2.2.1.Definition
8.2.2.2.Market Estimation and Penetration, 2016 – 2023
8.2.2.3.Market Forecast, 2024 – 2034
8.2.2.4.Compound Annual Growth Rate (CAGR)
8.2.2.5.Regional Bifurcation
8.2.2.5.1.North America
8.2.2.5.1.1.Market Estimation, 2016 – 2023
8.2.2.5.1.2.Market Forecast, 2024 – 2034
8.2.2.5.2.Europe
8.2.2.5.2.1.Market Estimation, 2016 – 2023
8.2.2.5.2.2.Market Forecast, 2024 – 2034
8.2.2.5.3.Asia Pacific
8.2.2.5.3.1.Market Estimation, 2016 – 2023
8.2.2.5.3.2.Market Forecast, 2024 – 2034
8.2.2.5.4.Middle East and Africa
8.2.2.5.4.1.Market Estimation, 2016 – 2023
8.2.2.5.4.2.Market Forecast, 2024 – 2034
8.2.2.5.5.Latin America
8.2.2.5.5.1.Market Estimation, 2016 – 2023
8.2.2.5.5.2.Market Forecast, 2024 – 2034
8.3.Key Segment for Channeling Investments
8.3.1.By Power Source
9.Global Portable Power Station Market Analysis and Forecasts, 2024 – 2034
9.1.Overview
9.2.Global Portable Power Station Market Revenue (US$ Mn) and Forecasts, By Technology
9.2.1.Lithium-ion Batteries
9.2.1.1.Definition
9.2.1.2.Market Estimation and Penetration, 2016 – 2023
9.2.1.3.Market Forecast, 2024 – 2034
9.2.1.4.Compound Annual Growth Rate (CAGR)
9.2.1.5.Regional Bifurcation
9.2.1.5.1.North America
9.2.1.5.1.1.Market Estimation, 2016 – 2023
9.2.1.5.1.2.Market Forecast, 2024 – 2034
9.2.1.5.2.Europe
9.2.1.5.2.1.Market Estimation, 2016 – 2023
9.2.1.5.2.2.Market Forecast, 2024 – 2034
9.2.1.5.3.Asia Pacific
9.2.1.5.3.1.Market Estimation, 2016 – 2023
9.2.1.5.3.2.Market Forecast, 2024 – 2034
9.2.1.5.4.Middle East and Africa
9.2.1.5.4.1.Market Estimation, 2016 – 2023
9.2.1.5.4.2.Market Forecast, 2024 – 2034
9.2.1.5.5.Latin America
9.2.1.5.5.1.Market Estimation, 2016 – 2023
9.2.1.5.5.2.Market Forecast, 2024 – 2034
9.2.2.Lead-acid Batteries
9.2.2.1.Definition
9.2.2.2.Market Estimation and Penetration, 2016 – 2023
9.2.2.3.Market Forecast, 2024 – 2034
9.2.2.4.Compound Annual Growth Rate (CAGR)
9.2.2.5.Regional Bifurcation
9.2.2.5.1.North America
9.2.2.5.1.1.Market Estimation, 2016 – 2023
9.2.2.5.1.2.Market Forecast, 2024 – 2034
9.2.2.5.2.Europe
9.2.2.5.2.1.Market Estimation, 2016 – 2023
9.2.2.5.2.2.Market Forecast, 2024 – 2034
9.2.2.5.3.Asia Pacific
9.2.2.5.3.1.Market Estimation, 2016 – 2023
9.2.2.5.3.2.Market Forecast, 2024 – 2034
9.2.2.5.4.Middle East and Africa
9.2.2.5.4.1.Market Estimation, 2016 – 2023
9.2.2.5.4.2.Market Forecast, 2024 – 2034
9.2.2.5.5.Latin America
9.2.2.5.5.1.Market Estimation, 2016 – 2023
9.2.2.5.5.2.Market Forecast, 2024 – 2034
9.2.3.Others
9.2.3.1.Definition
9.2.3.2.Market Estimation and Penetration, 2016 – 2023
9.2.3.3.Market Forecast, 2024 – 2034
9.2.3.4.Compound Annual Growth Rate (CAGR)
9.2.3.5.Regional Bifurcation
9.2.3.5.1.North America
9.2.3.5.1.1.Market Estimation, 2016 – 2023
9.2.3.5.1.2.Market Forecast, 2024 – 2034
9.2.3.5.2.Europe
9.2.3.5.2.1.Market Estimation, 2016 – 2023
9.2.3.5.2.2.Market Forecast, 2024 – 2034
9.2.3.5.3.Asia Pacific
9.2.3.5.3.1.Market Estimation, 2016 – 2023
9.2.3.5.3.2.Market Forecast, 2024 – 2034
9.2.3.5.4.Middle East and Africa
9.2.3.5.4.1.Market Estimation, 2016 – 2023
9.2.3.5.4.2.Market Forecast, 2024 – 2034
9.2.3.5.5.Latin America
9.2.3.5.5.1.Market Estimation, 2016 – 2023
9.2.3.5.5.2.Market Forecast, 2024 – 2034
9.3.Key Segment for Channeling Investments
9.3.1.By Technology
10.Global Portable Power Station Market Analysis and Forecasts, 2024 – 2034
10.1.Overview
10.2.Global Portable Power Station Market Revenue (US$ Mn) and Forecasts, By Sales Channel
10.2.1.Online
10.2.1.1.Definition
10.2.1.2.Market Estimation and Penetration, 2016 – 2023
10.2.1.3.Market Forecast, 2024 – 2034
10.2.1.4.Compound Annual Growth Rate (CAGR)
10.2.1.5.Regional Bifurcation
10.2.1.5.1.North America
10.2.1.5.1.1.Market Estimation, 2016 – 2023
10.2.1.5.1.2.Market Forecast, 2024 – 2034
10.2.1.5.2.Europe
10.2.1.5.2.1.Market Estimation, 2016 – 2023
10.2.1.5.2.2.Market Forecast, 2024 – 2034
10.2.1.5.3.Asia Pacific
10.2.1.5.3.1.Market Estimation, 2016 – 2023
10.2.1.5.3.2.Market Forecast, 2024 – 2034
10.2.1.5.4.Middle East and Africa
10.2.1.5.4.1.Market Estimation, 2016 – 2023
10.2.1.5.4.2.Market Forecast, 2024 – 2034
10.2.1.5.5.Latin America
10.2.1.5.5.1.Market Estimation, 2016 – 2023
10.2.1.5.5.2.Market Forecast, 2024 – 2034
10.2.2.Offline
10.2.2.1.Definition
10.2.2.2.Market Estimation and Penetration, 2016 – 2023
10.2.2.3.Market Forecast, 2024 – 2034
10.2.2.4.Compound Annual Growth Rate (CAGR)
10.2.2.5.Regional Bifurcation
10.2.2.5.1.North America
10.2.2.5.1.1.Market Estimation, 2016 – 2023
10.2.2.5.1.2.Market Forecast, 2024 – 2034
10.2.2.5.2.Europe
10.2.2.5.2.1.Market Estimation, 2016 – 2023
10.2.2.5.2.2.Market Forecast, 2024 – 2034
10.2.2.5.3.Asia Pacific
10.2.2.5.3.1.Market Estimation, 2016 – 2023
10.2.2.5.3.2.Market Forecast, 2024 – 2034
10.2.2.5.4.Middle East and Africa
10.2.2.5.4.1.Market Estimation, 2016 – 2023
10.2.2.5.4.2.Market Forecast, 2024 – 2034
10.2.2.5.5.Latin America
10.2.2.5.5.1.Market Estimation, 2016 – 2023
10.2.2.5.5.2.Market Forecast, 2024 – 2034
10.3.Key Segment for Channeling Investments
10.3.1.By Sales Channel
11.North America Portable Power Station Market Analysis and Forecasts, 2024 – 2034
11.1.Overview
11.1.1.North America Portable Power Station Market Revenue (US$ Mn)
11.2.North America Portable Power Station Market Revenue (US$ Mn) and Forecasts, By Power Source
11.2.1.Direct source
11.2.2.Hybrid source
11.3.North America Portable Power Station Market Revenue (US$ Mn) and Forecasts, By Technology
11.3.1.Lithium-ion Batteries
11.3.2.Lead-acid Batteries
11.3.3.Others
11.4.North America Portable Power Station Market Revenue (US$ Mn) and Forecasts, By Sales Channel
11.4.1.Online
11.4.2.Offline
11.5.North America Portable Power Station Market Revenue (US$ Mn) and Forecasts, By Country
11.5.1.U.S
11.5.1.1.U.S Portable Power Station Market Revenue (US$ Mn) and Forecasts, By Power Source
11.5.1.1.1.Direct source
11.5.1.1.2.Hybrid source
11.5.1.2.U.S Portable Power Station Market Revenue (US$ Mn) and Forecasts, By Technology
11.5.1.2.1.Lithium-ion Batteries
11.5.1.2.2.Lead-acid Batteries
11.5.1.2.3.Others
11.5.1.3.U.S Portable Power Station Market Revenue (US$ Mn) and Forecasts, By Sales Channel
11.5.1.3.1.Online
11.5.1.3.2.Offline
11.5.2.Canada
11.5.2.1.Canada Portable Power Station Market Revenue (US$ Mn) and Forecasts, By Power Source
11.5.2.1.1.Direct source
11.5.2.1.2.Hybrid source
11.5.2.2.Canada Portable Power Station Market Revenue (US$ Mn) and Forecasts, By Technology
11.5.2.2.1.Lithium-ion Batteries
11.5.2.2.2.Lead-acid Batteries
11.5.2.2.3.Others
11.5.2.3.Canada Portable Power Station Market Revenue (US$ Mn) and Forecasts, By Sales Channel
11.5.2.3.1.Online
11.5.2.3.2.Offline
11.5.3.Mexico
11.5.3.1.Mexico Portable Power Station Market Revenue (US$ Mn) and Forecasts, By Power Source
11.5.3.1.1.Direct source
11.5.3.1.2.Hybrid source
11.5.3.2.Mexico Portable Power Station Market Revenue (US$ Mn) and Forecasts, By Technology
11.5.3.2.1.Lithium-ion Batteries
11.5.3.2.2.Lead-acid Batteries
11.5.3.2.3.Others
11.5.3.3.Mexico Portable Power Station Market Revenue (US$ Mn) and Forecasts, By Sales Channel
11.5.3.3.1.Online
11.5.3.3.2.Offline
11.5.4.Rest of North America
11.5.4.1.Rest of North America Portable Power Station Market Revenue (US$ Mn) and Forecasts, By Power Source
11.5.4.1.1.Direct source
11.5.4.1.2.Hybrid source
11.5.4.2.Rest of North America Portable Power Station Market Revenue (US$ Mn) and Forecasts, By Technology
11.5.4.2.1.Lithium-ion Batteries
11.5.4.2.2.Lead-acid Batteries
11.5.4.2.3.Others
11.5.4.3.Rest of North America Portable Power Station Market Revenue (US$ Mn) and Forecasts, By Sales Channel
11.5.4.3.1.Online
11.5.4.3.2.Offline
11.6.Key Segment for Channeling Investments
11.6.1.By Country
11.6.2.By Power Source
11.6.3.By Technology
11.6.4.By Sales Channel
12.Europe Portable Power Station Market Analysis and Forecasts, 2024 – 2034
12.1.Overview
12.1.1.Europe Portable Power Station Market Revenue (US$ Mn)
12.2.Europe Portable Power Station Market Revenue (US$ Mn) and Forecasts, By Power Source
12.2.1.Direct source
12.2.2.Hybrid source
12.3.Europe Portable Power Station Market Revenue (US$ Mn) and Forecasts, By Technology
12.3.1.Lithium-ion Batteries
12.3.2.Lead-acid Batteries
12.3.3.Others
12.4.Europe Portable Power Station Market Revenue (US$ Mn) and Forecasts, By Sales Channel
12.4.1.Online
12.4.2.Offline
12.5.Europe Portable Power Station Market Revenue (US$ Mn) and Forecasts, By Country
12.5.1.France
12.5.1.1.France Portable Power Station Market Revenue (US$ Mn) and Forecasts, By Power Source
12.5.1.1.1.Direct source
12.5.1.1.2.Hybrid source
12.5.1.2.France Portable Power Station Market Revenue (US$ Mn) and Forecasts, By Technology
12.5.1.2.1.Lithium-ion Batteries
12.5.1.2.2.Lead-acid Batteries
12.5.1.2.3.Others
12.5.1.3.France Portable Power Station Market Revenue (US$ Mn) and Forecasts, By Sales Channel
12.5.1.3.1.Online
12.5.1.3.2.Offline
12.5.2.The UK
12.5.2.1.The UK Portable Power Station Market Revenue (US$ Mn) and Forecasts, By Power Source
12.5.2.1.1.Direct source
12.5.2.1.2.Hybrid source
12.5.2.2.The UK Portable Power Station Market Revenue (US$ Mn) and Forecasts, By Technology
12.5.2.2.1.Lithium-ion Batteries
12.5.2.2.2.Lead-acid Batteries
12.5.2.2.3.Others
12.5.2.3.The UK Portable Power Station Market Revenue (US$ Mn) and Forecasts, By Sales Channel
12.5.2.3.1.Online
12.5.2.3.2.Offline
12.5.3.Spain
12.5.3.1.Spain Portable Power Station Market Revenue (US$ Mn) and Forecasts, By Power Source
12.5.3.1.1.Direct source
12.5.3.1.2.Hybrid source
12.5.3.2.Spain Portable Power Station Market Revenue (US$ Mn) and Forecasts, By Technology
12.5.3.2.1.Lithium-ion Batteries
12.5.3.2.2.Lead-acid Batteries
12.5.3.2.3.Others
12.5.3.3.Spain Portable Power Station Market Revenue (US$ Mn) and Forecasts, By Sales Channel
12.5.3.3.1.Online
12.5.3.3.2.Offline
12.5.4.Germany
12.5.4.1.Germany Portable Power Station Market Revenue (US$ Mn) and Forecasts, By Power Source
12.5.4.1.1.Direct source
12.5.4.1.2.Hybrid source
12.5.4.2.Germany Portable Power Station Market Revenue (US$ Mn) and Forecasts, By Technology
12.5.4.2.1.Lithium-ion Batteries
12.5.4.2.2.Lead-acid Batteries
12.5.4.2.3.Others
12.5.4.3.Germany Portable Power Station Market Revenue (US$ Mn) and Forecasts, By Sales Channel
12.5.4.3.1.Online
12.5.4.3.2.Offline
12.5.5.Italy
12.5.5.1.Italy Portable Power Station Market Revenue (US$ Mn) and Forecasts, By Power Source
12.5.5.1.1.Direct source
12.5.5.1.2.Hybrid source
12.5.5.2.Italy Portable Power Station Market Revenue (US$ Mn) and Forecasts, By Technology
12.5.5.2.1.Lithium-ion Batteries
12.5.5.2.2.Lead-acid Batteries
12.5.5.2.3.Others
12.5.5.3.Italy Portable Power Station Market Revenue (US$ Mn) and Forecasts, By Sales Channel
12.5.5.3.1.Online
12.5.5.3.2.Offline
12.5.6.Nordic Countries
12.5.6.1.Nordic Countries Portable Power Station Market Revenue (US$ Mn) and Forecasts, By Power Source
12.5.6.1.1.Direct source
12.5.6.1.2.Hybrid source
12.5.6.2.Nordic Countries Portable Power Station Market Revenue (US$ Mn) and Forecasts, By Technology
12.5.6.2.1.Lithium-ion Batteries
12.5.6.2.2.Lead-acid Batteries
12.5.6.2.3.Others
12.5.6.3.Nordic Countries Portable Power Station Market Revenue (US$ Mn) and Forecasts, By Sales Channel
12.5.6.3.1.Online
12.5.6.3.2.Offline
12.5.6.4.Nordic Countries Portable Power Station Market Revenue (US$ Mn) and Forecasts, By Country
12.5.6.4.1.Denmark
12.5.6.4.2.Finland
12.5.6.4.3.Iceland
12.5.6.4.4.Sweden
12.5.6.4.5.Norway
12.5.7.Benelux Union
12.5.7.1.Benelux Union Portable Power Station Market Revenue (US$ Mn) and Forecasts, By Power Source
12.5.7.1.1.Direct source
12.5.7.1.2.Hybrid source
12.5.7.2.Benelux Union Portable Power Station Market Revenue (US$ Mn) and Forecasts, By Technology
12.5.7.2.1.Lithium-ion Batteries
12.5.7.2.2.Lead-acid Batteries
12.5.7.2.3.Others
12.5.7.3.Benelux Union Portable Power Station Market Revenue (US$ Mn) and Forecasts, By Sales Channel
12.5.7.3.1.Online
12.5.7.3.2.Offline
12.5.7.4.Benelux Union Portable Power Station Market Revenue (US$ Mn) and Forecasts, By Country
12.5.7.4.1.Belgium
12.5.7.4.2.The Netherlands
12.5.7.4.3.Luxembourg
12.5.8.Rest of Europe
12.5.8.1.Rest of Europe Portable Power Station Market Revenue (US$ Mn) and Forecasts, By Power Source
12.5.8.1.1.Direct source
12.5.8.1.2.Hybrid source
12.5.8.2.Rest of Europe Portable Power Station Market Revenue (US$ Mn) and Forecasts, By Technology
12.5.8.2.1.Lithium-ion Batteries
12.5.8.2.2.Lead-acid Batteries
12.5.8.2.3.Others
12.5.8.3.Rest of Europe Portable Power Station Market Revenue (US$ Mn) and Forecasts, By Sales Channel
12.5.8.3.1.Online
12.5.8.3.2.Offline
12.6.Key Segment for Channeling Investments
12.6.1.By Country
12.6.2.By Power Source
12.6.3.By Technology
12.6.4.By Sales Channel
13.Asia Pacific Portable Power Station Market Analysis and Forecasts, 2024 – 2034
13.1.Overview
13.1.1.Asia Pacific Portable Power Station Market Revenue (US$ Mn)
13.2.Asia Pacific Portable Power Station Market Revenue (US$ Mn) and Forecasts, By Power Source
13.2.1.Direct source
13.2.2.Hybrid source
13.3.Asia Pacific Portable Power Station Market Revenue (US$ Mn) and Forecasts, By Technology
13.3.1.Lithium-ion Batteries
13.3.2.Lead-acid Batteries
13.3.3.Others
13.4.Asia Pacific Portable Power Station Market Revenue (US$ Mn) and Forecasts, By Sales Channel
13.4.1.Online
13.4.2.Offline
13.5.Asia Pacific Portable Power Station Market Revenue (US$ Mn) and Forecasts, By Country
13.5.1.China
13.5.1.1.China Portable Power Station Market Revenue (US$ Mn) and Forecasts, By Power Source
13.5.1.1.1.Direct source
13.5.1.1.2.Hybrid source
13.5.1.2.China Portable Power Station Market Revenue (US$ Mn) and Forecasts, By Technology
13.5.1.2.1.Lithium-ion Batteries
13.5.1.2.2.Lead-acid Batteries
13.5.1.2.3.Others
13.5.1.3.China Portable Power Station Market Revenue (US$ Mn) and Forecasts, By Sales Channel
13.5.1.3.1.Online
13.5.1.3.2.Offline
13.5.2.Japan
13.5.2.1.Japan Portable Power Station Market Revenue (US$ Mn) and Forecasts, By Power Source
13.5.2.1.1.Direct source
13.5.2.1.2.Hybrid source
13.5.2.2.Japan Portable Power Station Market Revenue (US$ Mn) and Forecasts, By Technology
13.5.2.2.1.Lithium-ion Batteries
13.5.2.2.2.Lead-acid Batteries
13.5.2.2.3.Others
13.5.2.3.Japan Portable Power Station Market Revenue (US$ Mn) and Forecasts, By Sales Channel
13.5.2.3.1.Online
13.5.2.3.2.Offline
13.5.3.India
13.5.3.1.India Portable Power Station Market Revenue (US$ Mn) and Forecasts, By Power Source
13.5.3.1.1.Direct source
13.5.3.1.2.Hybrid source
13.5.3.2.India Portable Power Station Market Revenue (US$ Mn) and Forecasts, By Technology
13.5.3.2.1.Lithium-ion Batteries
13.5.3.2.2.Lead-acid Batteries
13.5.3.2.3.Others
13.5.3.3.India Portable Power Station Market Revenue (US$ Mn) and Forecasts, By Sales Channel
13.5.3.3.1.Online
13.5.3.3.2.Offline
13.5.4.New Zealand
13.5.4.1.New Zealand Portable Power Station Market Revenue (US$ Mn) and Forecasts, By Power Source
13.5.4.1.1.Direct source
13.5.4.1.2.Hybrid source
13.5.4.2.New Zealand Portable Power Station Market Revenue (US$ Mn) and Forecasts, By Technology
13.5.4.2.1.Lithium-ion Batteries
13.5.4.2.2.Lead-acid Batteries
13.5.4.2.3.Others
13.5.4.3.New Zealand Portable Power Station Market Revenue (US$ Mn) and Forecasts, By Sales Channel
13.5.4.3.1.Online
13.5.4.3.2.Offline
13.5.5.Australia
13.5.5.1.Australia Portable Power Station Market Revenue (US$ Mn) and Forecasts, By Power Source
13.5.5.1.1.Direct source
13.5.5.1.2.Hybrid source
13.5.5.2.Australia Portable Power Station Market Revenue (US$ Mn) and Forecasts, By Technology
13.5.5.2.1.Lithium-ion Batteries
13.5.5.2.2.Lead-acid Batteries
13.5.5.2.3.Others
13.5.5.3.Australia Portable Power Station Market Revenue (US$ Mn) and Forecasts, By Sales Channel
13.5.5.3.1.Online
13.5.5.3.2.Offline
13.5.6.South Korea
13.5.6.1.South Korea Portable Power Station Market Revenue (US$ Mn) and Forecasts, By Power Source
13.5.6.1.1.Direct source
13.5.6.1.2.Hybrid source
13.5.6.2.South Korea Portable Power Station Market Revenue (US$ Mn) and Forecasts, By Technology
13.5.6.2.1.Lithium-ion Batteries
13.5.6.2.2.Lead-acid Batteries
13.5.6.2.3.Others
13.5.6.3.South Korea Portable Power Station Market Revenue (US$ Mn) and Forecasts, By Sales Channel
13.5.6.3.1.Online
13.5.6.3.2.Offline
13.5.7.Southeast Asia
13.5.7.1.Southeast Asia Portable Power Station Market Revenue (US$ Mn) and Forecasts, By Power Source
13.5.7.1.1.Direct source
13.5.7.1.2.Hybrid source
13.5.7.2.Southeast Asia Portable Power Station Market Revenue (US$ Mn) and Forecasts, By Technology
13.5.7.2.1.Lithium-ion Batteries
13.5.7.2.2.Lead-acid Batteries
13.5.7.2.3.Others
13.5.7.3.Southeast Asia Portable Power Station Market Revenue (US$ Mn) and Forecasts, By Sales Channel
13.5.7.3.1.Online
13.5.7.3.2.Offline
13.5.7.4.Southeast Asia Portable Power Station Market Revenue (US$ Mn) and Forecasts, By Country
13.5.7.4.1.Indonesia
13.5.7.4.2.Thailand
13.5.7.4.3.Malaysia
13.5.7.4.4.Singapore
13.5.7.4.5.Rest of Southeast Asia
13.5.8.Rest of Asia Pacific
13.5.8.1.Rest of Asia Pacific Portable Power Station Market Revenue (US$ Mn) and Forecasts, By Power Source
13.5.8.1.1.Direct source
13.5.8.1.2.Hybrid source
13.5.8.2.Rest of Asia Pacific Portable Power Station Market Revenue (US$ Mn) and Forecasts, By Technology
13.5.8.2.1.Lithium-ion Batteries
13.5.8.2.2.Lead-acid Batteries
13.5.8.2.3.Others
13.5.8.3.Rest of Asia Pacific Portable Power Station Market Revenue (US$ Mn) and Forecasts, By Sales Channel
13.5.8.3.1.Online
13.5.8.3.2.Offline
13.6.Key Segment for Channeling Investments
13.6.1.By Country
13.6.2.By Power Source
13.6.3.By Technology
13.6.4.By Sales Channel
14.Middle East and Africa Portable Power Station Market Analysis and Forecasts, 2024 – 2034
14.1.Overview
14.1.1.Middle East and Africa Portable Power Station Market Revenue (US$ Mn)
14.2.Middle East and Africa Portable Power Station Market Revenue (US$ Mn) and Forecasts, By Power Source
14.2.1.Direct source
14.2.2.Hybrid source
14.3.Middle East and Africa Portable Power Station Market Revenue (US$ Mn) and Forecasts, By Technology
14.3.1.Lithium-ion Batteries
14.3.2.Lead-acid Batteries
14.3.3.Others
14.4.Middle East and Africa Portable Power Station Market Revenue (US$ Mn) and Forecasts, By Sales Channel
14.4.1.Online
14.4.2.Offline
14.5.Middle East and Africa Portable Power Station Market Revenue (US$ Mn) and Forecasts, By Country
14.5.1.Saudi Arabia
14.5.1.1.Saudi Arabia Portable Power Station Market Revenue (US$ Mn) and Forecasts, By Power Source
14.5.1.1.1.Direct source
14.5.1.1.2.Hybrid source
14.5.1.2.Saudi Arabia Portable Power Station Market Revenue (US$ Mn) and Forecasts, By Technology
14.5.1.2.1.Lithium-ion Batteries
14.5.1.2.2.Lead-acid Batteries
14.5.1.2.3.Others
14.5.1.3.Saudi Arabia Portable Power Station Market Revenue (US$ Mn) and Forecasts, By Sales Channel
14.5.1.3.1.Online
14.5.1.3.2.Offline
14.5.2.UAE
14.5.2.1.UAE Portable Power Station Market Revenue (US$ Mn) and Forecasts, By Power Source
14.5.2.1.1.Direct source
14.5.2.1.2.Hybrid source
14.5.2.2.UAE Portable Power Station Market Revenue (US$ Mn) and Forecasts, By Technology
14.5.2.2.1.Lithium-ion Batteries
14.5.2.2.2.Lead-acid Batteries
14.5.2.2.3.Others
14.5.2.3.UAE Portable Power Station Market Revenue (US$ Mn) and Forecasts, By Sales Channel
14.5.2.3.1.Online
14.5.2.3.2.Offline
14.5.3.Egypt
14.5.3.1.Egypt Portable Power Station Market Revenue (US$ Mn) and Forecasts, By Power Source
14.5.3.1.1.Direct source
14.5.3.1.2.Hybrid source
14.5.3.2.Egypt Portable Power Station Market Revenue (US$ Mn) and Forecasts, By Technology
14.5.3.2.1.Lithium-ion Batteries
14.5.3.2.2.Lead-acid Batteries
14.5.3.2.3.Others
14.5.3.3.Egypt Portable Power Station Market Revenue (US$ Mn) and Forecasts, By Sales Channel
14.5.3.3.1.Online
14.5.3.3.2.Offline
14.5.4.Kuwait
14.5.4.1.Kuwait Portable Power Station Market Revenue (US$ Mn) and Forecasts, By Power Source
14.5.4.1.1.Direct source
14.5.4.1.2.Hybrid source
14.5.4.2.Kuwait Portable Power Station Market Revenue (US$ Mn) and Forecasts, By Technology
14.5.4.2.1.Lithium-ion Batteries
14.5.4.2.2.Lead-acid Batteries
14.5.4.2.3.Others
14.5.4.3.Kuwait Portable Power Station Market Revenue (US$ Mn) and Forecasts, By Sales Channel
14.5.4.3.1.Online
14.5.4.3.2.Offline
14.5.5.South Africa
14.5.5.1.South Africa Portable Power Station Market Revenue (US$ Mn) and Forecasts, By Power Source
14.5.5.1.1.Direct source
14.5.5.1.2.Hybrid source
14.5.5.2.South Africa Portable Power Station Market Revenue (US$ Mn) and Forecasts, By Technology
14.5.5.2.1.Lithium-ion Batteries
14.5.5.2.2.Lead-acid Batteries
14.5.5.2.3.Others
14.5.5.3.South Africa Portable Power Station Market Revenue (US$ Mn) and Forecasts, By Sales Channel
14.5.5.3.1.Online
14.5.5.3.2.Offline
14.5.6.Rest of Middle East & Africa
14.5.6.1.Rest of Middle East & Africa Portable Power Station Market Revenue (US$ Mn) and Forecasts, By Power Source
14.5.6.1.1.Direct source
14.5.6.1.2.Hybrid source
14.5.6.2.Rest of Middle East & Africa Portable Power Station Market Revenue (US$ Mn) and Forecasts, By Technology
14.5.6.2.1.Lithium-ion Batteries
14.5.6.2.2.Lead-acid Batteries
14.5.6.2.3.Others
14.5.6.3.Rest of Middle East & Africa Portable Power Station Market Revenue (US$ Mn) and Forecasts, By Sales Channel
14.5.6.3.1.Online
14.5.6.3.2.Offline
14.6.Key Segment for Channeling Investments
14.6.1.By Country
14.6.2.By Power Source
14.6.3.By Technology
14.6.4.By Sales Channel
15.Latin America Portable Power Station Market Analysis and Forecasts, 2024 – 2034
15.1.Overview
15.1.1.Latin America Portable Power Station Market Revenue (US$ Mn)
15.2.Latin America Portable Power Station Market Revenue (US$ Mn) and Forecasts, By Power Source
15.2.1.Direct source
15.2.2.Hybrid source
15.3.Latin America Portable Power Station Market Revenue (US$ Mn) and Forecasts, By Technology
15.3.1.Lithium-ion Batteries
15.3.2.Lead-acid Batteries
15.3.3.Others
15.4.Latin America Portable Power Station Market Revenue (US$ Mn) and Forecasts, By Sales Channel
15.4.1.Online
15.4.2.Offline
15.5.Latin America Portable Power Station Market Revenue (US$ Mn) and Forecasts, By Country
15.5.1.Brazil
15.5.1.1.Brazil Portable Power Station Market Revenue (US$ Mn) and Forecasts, By Power Source
15.5.1.1.1.Direct source
15.5.1.1.2.Hybrid source
15.5.1.2.Brazil Portable Power Station Market Revenue (US$ Mn) and Forecasts, By Technology
15.5.1.2.1.Lithium-ion Batteries
15.5.1.2.2.Lead-acid Batteries
15.5.1.2.3.Others
15.5.1.3.Brazil Portable Power Station Market Revenue (US$ Mn) and Forecasts, By Sales Channel
15.5.1.3.1.Online
15.5.1.3.2.Offline
15.5.2.Argentina
15.5.2.1.Argentina Portable Power Station Market Revenue (US$ Mn) and Forecasts, By Power Source
15.5.2.1.1.Direct source
15.5.2.1.2.Hybrid source
15.5.2.2.Argentina Portable Power Station Market Revenue (US$ Mn) and Forecasts, By Technology
15.5.2.2.1.Lithium-ion Batteries
15.5.2.2.2.Lead-acid Batteries
15.5.2.2.3.Others
15.5.2.3.Argentina Portable Power Station Market Revenue (US$ Mn) and Forecasts, By Sales Channel
15.5.2.3.1.Online
15.5.2.3.2.Offline
15.5.3.Rest of Latin America
15.5.3.1.Rest of Latin America Portable Power Station Market Revenue (US$ Mn) and Forecasts, By Power Source
15.5.3.1.1.Direct source
15.5.3.1.2.Hybrid source
15.5.3.2.Rest of Latin America Portable Power Station Market Revenue (US$ Mn) and Forecasts, By Technology
15.5.3.2.1.Lithium-ion Batteries
15.5.3.2.2.Lead-acid Batteries
15.5.3.2.3.Others
15.5.3.3.Rest of Latin America Portable Power Station Market Revenue (US$ Mn) and Forecasts, By Sales Channel
15.5.3.3.1.Online
15.5.3.3.2.Offline
15.6.Key Segment for Channeling Investments
15.6.1.By Country
15.6.2.By Power Source
15.6.3.By Technology
15.6.4.By Sales Channel
16.Competitive Benchmarking
16.1.Brand Benchmarking
16.2.Market Share Analysis, 2023
16.3.Global Presence and Growth Strategies
16.3.1.Mergers and Acquisitions
16.3.2.Product Launches
16.3.3.Investments Trends
16.3.4.R&D Initiatives
17.Player Profiles
17.1.Anker Technology (UK) Ltd
17.1.1.Company Details
17.1.2.Company Overview
17.1.3.Product Offerings
17.1.4.Key Developments
17.1.5.Financial Analysis
17.1.6.SWOT Analysis
17.1.7.Business Strategies
17.2.Bluetti
17.2.1.Company Details
17.2.2.Company Overview
17.2.3.Product Offerings
17.2.4.Key Developments
17.2.5.Financial Analysis
17.2.6.SWOT Analysis
17.2.7.Business Strategies
17.3.Duracell Inc.
17.3.1.Company Details
17.3.2.Company Overview
17.3.3.Product Offerings
17.3.4.Key Developments
17.3.5.Financial Analysis
17.3.6.SWOT Analysis
17.3.7.Business Strategies
17.4.EcoFlow
17.4.1.Company Details
17.4.2.Company Overview
17.4.3.Product Offerings
17.4.4.Key Developments
17.4.5.Financial Analysis
17.4.6.SWOT Analysis
17.4.7.Business Strategies
17.5.Goal Zero
17.5.1.Company Details
17.5.2.Company Overview
17.5.3.Product Offerings
17.5.4.Key Developments
17.5.5.Financial Analysis
17.5.6.SWOT Analysis
17.5.7.Business Strategies
17.6.Indiegogo Inc.
17.6.1.Company Details
17.6.2.Company Overview
17.6.3.Product Offerings
17.6.4.Key Developments
17.6.5.Financial Analysis
17.6.6.SWOT Analysis
17.6.7.Business Strategies
17.7.Jackery Inc.
17.7.1.Company Details
17.7.2.Company Overview
17.7.3.Product Offerings
17.7.4.Key Developments
17.7.5.Financial Analysis
17.7.6.SWOT Analysis
17.7.7.Business Strategies
17.8.Lion Energy
17.8.1.Company Details
17.8.2.Company Overview
17.8.3.Product Offerings
17.8.4.Key Developments
17.8.5.Financial Analysis
17.8.6.SWOT Analysis
17.8.7.Business Strategies
17.9.Maxoak Technology
17.9.1.Company Details
17.9.2.Company Overview
17.9.3.Product Offerings
17.9.4.Key Developments
17.9.5.Financial Analysis
17.9.6.SWOT Analysis
17.9.7.Business Strategies
17.10.Milwaukee Tool
17.10.1.Company Details
17.10.2.Company Overview
17.10.3.Product Offerings
17.10.4.Key Developments
17.10.5.Financial Analysis
17.10.6.SWOT Analysis
17.10.7.Business Strategies
17.11.Rockpals
17.11.1.Company Details
17.11.2.Company Overview
17.11.3.Product Offerings
17.11.4.Key Developments
17.11.5.Financial Analysis
17.11.6.SWOT Analysis
17.11.7.Business Strategies
17.12.Other Industry Participants
18.Key Findings

.

Note: This ToC is tentative and can be changed according to the research study conducted during the course of report completion.

**Exclusive for Multi-User and Enterprise User.

Global Portable Power Station Market

By Power Source

  • Direct source
  • Hybrid source

By Technology

  • Lithium-ion Batteries
  • Lead-acid Batteries
  • Others

By Sales Channel

  • Online
  • Offline

By Region

  • North America (U.S., Canada, Mexico, Rest of North America)
  • Europe (France, The UK, Spain, Germany, Italy, Nordic Countries (Denmark, Finland, Iceland, Sweden, Norway), Benelux Union (Belgium, The Netherlands, Luxembourg), Rest of Europe)
  • Asia Pacific (China, Japan, India, New Zealand, Australia, South Korea, Southeast Asia (Indonesia, Thailand, Malaysia, Singapore, Rest of Southeast Asia), Rest of Asia Pacific)
  • Middle East & Africa (Saudi Arabia, UAE, Egypt, Kuwait, South Africa, Rest of Middle East & Africa)
  • Latin America (Brazil, Argentina, Rest of Latin America)

The Niche Research approach encompasses both primary and secondary research methods to provide comprehensive insights. While primary research is the cornerstone of our studies, we also incorporate secondary research sources such as company annual reports, premium industry databases, press releases, industry journals, and white papers.

Within our primary research, we actively engage with various industry stakeholders, conducting paid interviews and surveys. Our meticulous analysis extends to every market participant in major countries, allowing us to thoroughly examine their portfolios, calculate market shares, and segment revenues.

Our data collection primarily focuses on individual countries within our research scope, enabling us to estimate regional market sizes. Typically, we employ a bottom-up approach, meticulously tracking trends in different countries. We analyze growth drivers, constraints, technological innovations, and opportunities for each country, ultimately arriving at regional figures.Our process begins by examining the growth prospects of each country. Building upon these insights, we project growth and trends for the entire region. Finally, we utilize our proprietary model to refine estimations and forecasts.

Our data validation standards are integral to ensuring the reliability and accuracy of our research findings. Here’s a breakdown of our data validation processes and the stakeholders we engage with during our primary research:

  • Supply Side Analysis: We initiate a supply side analysis by directly contacting market participants, through telephonic interviews and questionnaires containing both open-ended and close-ended questions. We gather information on their portfolios, segment revenues, developments, and growth strategies.
  • Demand Side Analysis: To gain insights into adoption trends and consumer preferences, we reach out to target customers and users (non-vendors). This information forms a vital part of the qualitative analysis section of our reports, covering market dynamics, adoption trends, consumer behavior, spending patterns, and other related aspects.
  • Consultant Insights: We tap into the expertise of our partner consultants from around the world to obtain their unique viewpoints and perspectives. Their insights contribute to a well-rounded understanding of the markets under investigation.
  • In-House Validation: To ensure data accuracy and reliability, we conduct cross-validation of data points and information through our in-house team of consultants and utilize advanced data modeling tools for thorough verification.

The forecasts we provide are based on a comprehensive assessment of various factors, including:

  • Market Trends and Past Performance (Last Five Years): We accurately analyze market trends and performance data from preceding five years to identify historical patterns and understand the market’s evolution.
  • Historical Performance and Growth of Market Participants: We assess the historical performance and growth trajectories of key market participants. This analysis provides insights into the competitive landscape and individual company strategies.
  • Market Determinants Impact Analysis (Next Eight Years): We conduct a rigorous analysis of the factors that are projected to influence the market over the next eight years. This includes assessing both internal and external determinants that can shape market dynamics.
  • Drivers and Challenges for the Forecast Period:Identify the factors expected to drive market growth during the forecast period, as well as the challenges that the industry may face. This analysis aids in deriving an accurate growth rate projection.
  • New Acquisitions, Collaborations, or Partnerships: We keep a close watch on any new acquisitions, collaborations, or partnerships within the industry. These developments can have a significant impact on market dynamics and competitiveness.
  • Macro and Micro Factors Analysis:A thorough examination of both macro-level factors (e.g., economic trends, regulatory changes) and micro-level factors (e.g., technological advancements, consumer preferences) that may influence the market during the forecast period.
  • End-User Sentiment Analysis: To understand the market from the end-user perspective, we conduct sentiment analysis. This involves assessing the sentiment, preferences, and feedback of the end-users, which can provide valuable insights into market trends.
  • Perspective of Primary Participants: Insights gathered directly from primary research participants play a crucial role in shaping our forecasts. Their perspectives and experiences provide valuable qualitative data.
  • Year-on-Year Growth Trend: We utilize a year-on-year growth trend based on historical market growth and expected future trends. This helps in formulating our growth projections, aligning them with the market’s historical performance.

Research process adopted by TNR involves multiple stages, including data collection, validation, quality checks, and presentation. It’s crucial that the data and information we provide add value to your existing market understanding and expertise. We have also established partnerships with business consulting, research, and survey organizations across regions and globally to collaborate on regional analysis and data validation, ensuring the highest level of accuracy and reliability in our reports.


Procure Comprehensive Study of

Global Portable Power Station Market

Online Only

  • Online Access
  • Read Only File
  • Validity 3 Months
  • Print, Copy, Paste & Download
  • PPT, Excel
  • Cost-Free Report in the Next Update
$3300
Buy Now

Single User

  • Access to One User on One System
  • Read Only File
  • Validity 6 Months
  • Limited Print,Copy, Paste
  • PPT, Excel
  • Cost-Free Report in the Next Update
$4200
Buy Now

Multi User

  • Access to Fiver Users
  • PDF File
  • Validity 1 Year
  • Upto FivePrints
  • Cost-Free Report in the Next Update
  • PPT, Excel
$6000
Buy Now

Enterprise User

  • Access to Unlimited Users
  • PDF, PPT, Excel
  • Unlimited Validity, Prints&Downloads
  • 1 Hour Cost-Free & Dedicated Analyst Support
  • 10% Cost-Free Customization
  • Cost-Free Report Update Twice in a Year
  • Recommendations for Business Strategies
  • Authorization to Quote TNR, The Niche Research
$7300
Buy Now

Library Access

  • Online Access to Content Publications
  • Access Player Profiles Online
  • Get Immediate Access to Newly Added Content
  • Acquire 12 PDF Downloads
  • Acquire 5 Excel Data Sets
  • Gain Access to 290+ PDFs of Company Profiles
  • Round-the-clock Email and Phone Assistance
  • Dashboard Usage and Trends
  • Renewal & Upgrade Assistance
  • Assessing Customization Options and Alerts for New Reports
$10788
Buy Now
*Taxes/Fees, if applicable will be added during checkout. All prices in USD

Why TNR The Niche Research?

  • Unwavering Commitment to Excellence

  • Veteran Team of Researchers

  • Accurate and Timely Insights

  • Ethical Practices and Customized Service

  • Uninterrupted Availability Around the Clock

Scroll to Top