Global Power-to-X (P2X) Market Insights, Growth, Share, Size: By Usage, By Energy Form, By End Use, By Region & Segmental Forecast, 2023-2031, Comparative Analysis and Trends
- Industry: Energy & Power
- Report ID: TNR-110-972
- Number of Pages: 420
- Table/Charts : Yes
- November, 2023
- Base Year : 2024
- No. of Companies : 10+
- No. of Countries : 29
- Views : 10228
- Covid Impact Covered: Yes
- War Impact Covered: Yes
- Formats : PDF, Excel, PPT
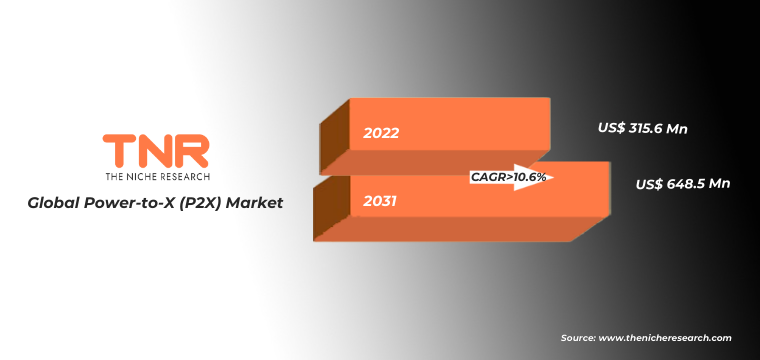
Global Power-to-X (P2X) Market was Valued at USD 315.6 Mn in 2022, with an Estimated CAGR of 10.6% from 2023- 2031.
Power-to-X (sometimes termed PtX or P2X) refers to technologies that convert power into carbon-neutral synthetic fuels such as hydrogen, synthetic natural gas, liquid fuels, or chemicals. These can be employed in difficult-to-decarbonize sectors or, unlike electricity, can be stored for later use.
Power-to-X is critical to developing a carbon-neutral society that can satisfy rising energy demand. Power-to-X can unleash carbon neutral solutions that reduce inevitable emissions from industry through electrolysis and CO2 reutilisation, such as harvesting concentrated CO2 streams from biomass-fired power plants or anaerobic digestion. It also provides a cost-effective solution for energy storage.
Global Power-to-X (P2X) Market Future
In view of the scope and intensity driving the green transformation, it also promises an unparalleled commercial opportunity for forward-thinking enterprises and investors. This has sparked tremendous interest in technologies such as power-to-x, which has the potential to significantly accelerate the energy transition, particularly in industries that would otherwise be difficult to decarbonize. The commercial prognosis for green hydrogen and other power-to-x products is inextricably linked to the global commitment to decrease global warming and is dependent on the amount of ambition in achieving net carbon neutrality. The future of power-to-x (P2X) market holds promise in enabling the integration of renewable energy, decarbonizing hard-to-abate sectors, and contributing to a more flexible, sustainable, and interconnected energy system.
Global Power-to-X (P2X) Market Revenue & Forecast, (US$ Million), 2017 – 2031
Global Power-to-X (P2X) Market Challenges
Commercialization of power-to-x (P2X) solutions has its share with challenges. Despite fast advancements in critical technologies, most renewable P2X solutions continue to be more expensive than equivalent fossil-fuel-based alternatives. The cost disparity can be explained in part by the decentralised structure of P2X plants. Currently, the majority of P2X ventures are on a modest scale.
Hydrogen storage also provides a number of issues. The volume and weight of hydrogen storage devices are now prohibitively large. Another issue is the energy efficiency of hydrogen storage systems. Storage system durability is currently insufficient, and improved materials are necessary to extend equipment lifespan. With the advancements in the power-to-x (P2X) technologies in the upcoming years will upsurge the growth of the global power-to-x (P2X) market.
Power-to-X may create fuels that reduce greenhouse gas emissions immediately: e-Methane, e-Methanol, e-Diesel, e-Gasoline, or e-Jet Fuel can be used within current fuel logistics infrastructures. While certain synthetic fuels utilised today are derived from fossil fuels and hence are neither carbon-neutral nor carbon-free, synthetic e-Fuels derived through Power-to-X technologies are not. These e-Fuels might also be made from excess electricity generated by wind and solar farms, eliminating the present temporary cutbacks or shutdowns of these sources when they provide too much power for the grid.
 Power-to-X (P2X) market technologies are gaining traction in Asia as countries in the region strive to address energy security, reduce carbon emissions, and transition to more sustainable energy systems. Japan has been a pioneer in hydrogen technologies and is actively pursuing the development of Power-to-Hydrogen (P2H2) solutions. The country aims to become a global leader in hydrogen production, distribution, and utilization. Japan’s focus on hydrogen aligns with its efforts to transition away from nuclear power and reduce carbon emissions.
Besides as one of the world’s largest energy consumers and greenhouse gas emitters, China is investing heavily in renewable energy and clean technologies. China has been working on integrating P2X technologies into its energy mix. The country is focusing on power-to-hydrogen (P2H2) for applications such as transportation and industrial processes. China’s significant investment in renewable energy sources like solar and wind power creates opportunities for P2X to play a role in energy storage and sector coupling.
Competitive Landscape
The report also offers extensive research on the key players in the global power-to-x (P2X) market and details on the competitiveness of these players. The competitive landscape is characterized by partnerships, joint ventures, mergers and acquisitions, and collaborations aimed at accelerating the development and deployment of P2X technologies. As the world focuses more on decarbonization and the transition to sustainable energy systems, the competitive landscape for P2X technologies is likely to evolve with new entrants, technological advancements, and increasing market demand.
A few of the major players operating in the global power-to-x (P2X) market are
- AFRY AB
- Air Liquide Engineering & Construction
- ALFA LAVAL
- Howden Group
- Linde plc
- MAN Energy Solutions
- MITSUBISHI HEAVY INDUSTRIES, LTD.
- Ørsted A/S
- RWE
- Siemens Energy
- thyssenkrupp Uhde GmbH
- Valmet
- Weidmüller
- Other Industry Participants
Global Power-to-X (P2X) Market Report Coverage
| Report Specifications | Details |
| Market Revenue in 2022 | US$ 315.6 Million |
| Market Size Forecast by 2031 | US$ 648.5 Million |
| Growth Rate (CAGR) | 10.6% |
| Historic Data | 2017 – 2021 |
| Base Year for Estimation | 2022 |
| Forecast Period | 2023 – 2031 |
| Report Inclusions | Market Size & Estimates, Market Dynamics, Competitive Scenario, Trends, Growth Factors, Market Determinants, Key Investment Segmentation, Product/Service/Solutions Benchmarking |
| Segments Covered | By Usage, By Energy Form, By End Use |
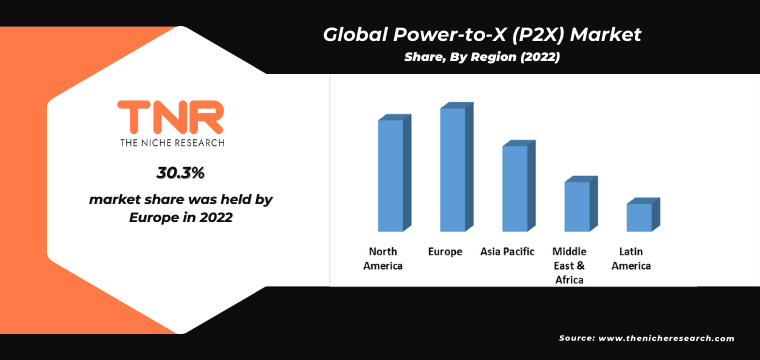
| Regions Covered | North America, Europe, Asia Pacific, Middle East & Africa, Latin America |
| Countries Covered | U.S., Canada, Mexico, Rest of North America, France, The UK, Spain, Germany, Italy, Nordic Countries (Denmark, Finland, Iceland, Sweden, Norway), Benelux Union (Belgium, The Netherlands, Luxembourg), Rest of Europe, China, Japan, India, New Zealand, Australia, South Korea, Southeast Asia (Indonesia, Thailand, Malaysia, Singapore, Rest of Southeast Asia), Rest of Asia Pacific, Saudi Arabia, UAE, Egypt, Kuwait, South Africa, Rest of Middle East & Africa, Brazil, Argentina, Rest of Latin America |
| Key Players | AFRY AB, Air Liquide Engineering & Construction, ALFA LAVAL, Howden Group, Linde plc, MAN Energy Solutions, MITSUBISHI HEAVY INDUSTRIES, LTD., Ørsted A/S, RWE, Siemens Energy, thyssenkrupp Uhde GmbH, Valmet, Weidmüller, Other Industry Participants |
| Customization Scope | Customization allows for the inclusion/modification of content pertaining to geographical regions, countries, and specific market segments. |
| Pricing & Procurement Options | Explore purchase options tailored to your specific research requirements |
| Contact Details | Consult With Our Expert
Japan (Toll-Free): – +81 663-386-8111 South Korea (Toll-Free): – +82-808- 703-126 Saudi Arabia (Toll-Free): – +966 800 850 1643 United States: +1 302-232-5106 United Kingdom: +447537105080 E-mail: askanexpert@thenicheresearch.com
|
Global Power-to-X (P2X) MarketPower-to-X (P2X) Market
By Usage
- Power-to-Hydrogen
- Power-to-Chemicals
- Power-to-Ammonia
- Power-to-Methane
- Power-to-Protein
- Power-to-Syngas
- Others
By Energy Form
- Power-to-Gas
- Power-to-Liquid
- Power-to-Heat
By End Use
- Residential
- Industrial
- Transportation
- Aviation
- Agriculture and Food Industry
- Chemicals
- Marine
- Energy and Utilities
- Others
By Region
- North America (U.S., Canada, Mexico, Rest of North America)
- Europe (France, The UK, Spain, Germany, Italy, Nordic Countries (Denmark, Finland, Iceland, Sweden, Norway), Benelux Union (Belgium, The Netherlands, Luxembourg), Rest of Europe)
- Asia Pacific (China, Japan, India, New Zealand, Australia, South Korea, Southeast Asia (Indonesia, Thailand, Malaysia, Singapore, Rest of Southeast Asia), Rest of Asia Pacific)
- Middle East & Africa (Saudi Arabia, UAE, Egypt, Kuwait, South Africa, Rest of Middle East & Africa)
- Latin America (Brazil, Argentina, Rest of Latin America)
Report Coverage and Deliverables
Table of Contents
Note: This ToC is tentative and can be changed according to the research study conducted during the course of report completion.
**Exclusive for Multi-User and Enterprise User.
Global Power-to-X (P2X) Market Segmentation
Global Power-to-X (P2X) Market – Usage Outlook
Global Power-to-X (P2X) Market – Energy Form Outlook
Global Power-to-X (P2X) Market – End Use Outlook
Global Power-to-X (P2X) Market – Regional Outlook
**Note: The report covers cross-segmentation analysis by region further into countries
The Niche Research approach encompasses both primary and secondary research methods to provide comprehensive insights. While primary research is the cornerstone of our studies, we also incorporate secondary research sources such as company annual reports, premium industry databases, press releases, industry journals, and white papers.
Within our primary research, we actively engage with various industry stakeholders, conducting paid interviews and surveys. Our meticulous analysis extends to every market participant in major countries, allowing us to thoroughly examine their portfolios, calculate market shares, and segment revenues.
Our data collection primarily focuses on individual countries within our research scope, enabling us to estimate regional market sizes. Typically, we employ a bottom-up approach, meticulously tracking trends in different countries. We analyze growth drivers, constraints, technological innovations, and opportunities for each country, ultimately arriving at regional figures.Our process begins by examining the growth prospects of each country. Building upon these insights, we project growth and trends for the entire region. Finally, we utilize our proprietary model to refine estimations and forecasts.
Our data validation standards are integral to ensuring the reliability and accuracy of our research findings. Here’s a breakdown of our data validation processes and the stakeholders we engage with during our primary research:
- Supply Side Analysis: We initiate a supply side analysis by directly contacting market participants, through telephonic interviews and questionnaires containing both open-ended and close-ended questions. We gather information on their portfolios, segment revenues, developments, and growth strategies.
- Demand Side Analysis: To gain insights into adoption trends and consumer preferences, we reach out to target customers and users (non-vendors). This information forms a vital part of the qualitative analysis section of our reports, covering market dynamics, adoption trends, consumer behavior, spending patterns, and other related aspects.
- Consultant Insights: We tap into the expertise of our partner consultants from around the world to obtain their unique viewpoints and perspectives. Their insights contribute to a well-rounded understanding of the markets under investigation.
- In-House Validation: To ensure data accuracy and reliability, we conduct cross-validation of data points and information through our in-house team of consultants and utilize advanced data modeling tools for thorough verification.
The forecasts we provide are based on a comprehensive assessment of various factors, including:
- Market Trends and Past Performance (Last Five Years): We accurately analyze market trends and performance data from preceding five years to identify historical patterns and understand the market’s evolution.
- Historical Performance and Growth of Market Participants: We assess the historical performance and growth trajectories of key market participants. This analysis provides insights into the competitive landscape and individual company strategies.
- Market Determinants Impact Analysis (Next Eight Years): We conduct a rigorous analysis of the factors that are projected to influence the market over the next eight years. This includes assessing both internal and external determinants that can shape market dynamics.
- Drivers and Challenges for the Forecast Period:Identify the factors expected to drive market growth during the forecast period, as well as the challenges that the industry may face. This analysis aids in deriving an accurate growth rate projection.
- New Acquisitions, Collaborations, or Partnerships: We keep a close watch on any new acquisitions, collaborations, or partnerships within the industry. These developments can have a significant impact on market dynamics and competitiveness.
- Macro and Micro Factors Analysis:A thorough examination of both macro-level factors (e.g., economic trends, regulatory changes) and micro-level factors (e.g., technological advancements, consumer preferences) that may influence the market during the forecast period.
- End-User Sentiment Analysis: To understand the market from the end-user perspective, we conduct sentiment analysis. This involves assessing the sentiment, preferences, and feedback of the end-users, which can provide valuable insights into market trends.
- Perspective of Primary Participants: Insights gathered directly from primary research participants play a crucial role in shaping our forecasts. Their perspectives and experiences provide valuable qualitative data.
- Year-on-Year Growth Trend: We utilize a year-on-year growth trend based on historical market growth and expected future trends. This helps in formulating our growth projections, aligning them with the market’s historical performance.
Research process adopted by TNR involves multiple stages, including data collection, validation, quality checks, and presentation. It’s crucial that the data and information we provide add value to your existing market understanding and expertise. We have also established partnerships with business consulting, research, and survey organizations across regions and globally to collaborate on regional analysis and data validation, ensuring the highest level of accuracy and reliability in our reports.