Global Radiology as a Service Market By Service Type, By Business Model, By Modality, By End User, By Region & Segmental Insights Trends and Forecast, 2024 – 2034

  • Industry: Healthcare
  • Report ID: TNR-110-1286
  • Number of Pages: 420
  • Table/Charts : Yes
  • September, 2024
  • Base Year : 2024
  • No. of Companies : 10+
  • No. of Countries : 29
  • Views : 10047
  • Covid Impact Covered: Yes
  • War Impact Covered: Yes
  • Formats : PDF, Excel, PPT

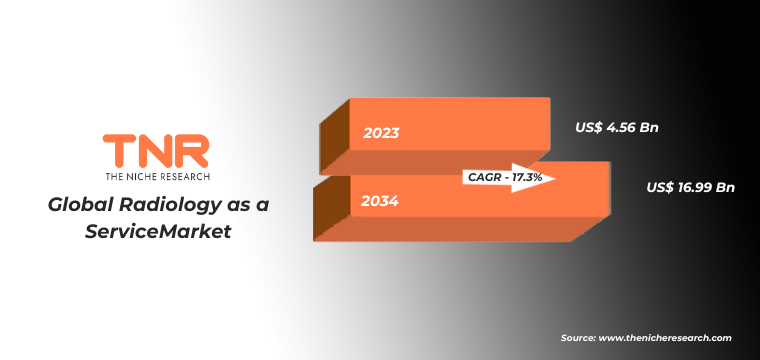
Radiology as a Service (RaaS) refers to the delivery of radiology services through a cloud-based platform or as a managed service model. This approach allows healthcare providers to access radiological expertise, imaging services, and diagnostics without the need to maintain in-house radiology departments. RaaS leverages cloud computing, artificial intelligence (AI), and telemedicine to offer services like image storage, teleradiology, and AI-driven diagnostic tools. The radiology as a service market has gained traction due to the rising demand for accessible, cost-effective, and high-quality radiological services across various healthcare settings. The global radiology as a service market accounted for US$ 4.56 Bn; projected to experience CAGR of 17.3% during 2024 – 2034.

Radiology as a service has evolved significantly over the past decade, driven by advancements in cloud technology, the integration of AI in imaging, and the growing acceptance of telemedicine. Initially, radiology services were confined to hospital settings with on-site radiologists. However, the advent of digital imaging and picture archiving and communication systems (PACS) paved the way for teleradiology, allowing radiologists to interpret images remotely. The increasing volume of imaging data, coupled with the need for quicker turnaround times, led to the adoption of RaaS, which offers scalability, reduced costs, and improved accessibility.

Key Trends in the Radiology as a Service Market

  • AI Integration: The incorporation of AI in radiology is one of the most significant trends. AI algorithms enhance the interpretation of medical images, boosting both diagnostic accuracy and efficiency. By 2024, it is estimated that AI-driven radiology solutions will account for 20% of the total radiology as a service market.
  • Cloud-Based Solutions: The shift towards cloud-based radiology services has accelerated, enabling secure and efficient storage, retrieval, and sharing of imaging data. As of 2023, over 60% of RaaS providers offered cloud-based services, a figure expected to rise to 80% by 2027.
  • Telemedicine Growth: The expansion of telemedicine has boosted the demand for RaaS, especially in remote or underserved regions. Telemedicine-related radiology services grew by 18% in 2023 and are expected to continue this upward trend, driven by the need for remote healthcare solutions.
  • Increased Focus on Data Security and Compliance: With the rise in cyber threats, ensuring the security of patient data has become paramount. By 2025, 90% of RaaS providers are expected to implement advanced encryption and compliance measures to meet global data security standards.

Restraints and Challenges

  • Data Privacy Concerns: The storage and transmission of sensitive patient data over cloud platforms raise concerns about data privacy and security. In 2023, data breaches in the healthcare sector accounted for 21% of all reported breaches, highlighting the need for improved security measures in RaaS.
  • Limited Internet Connectivity: In regions with poor internet connectivity, accessing cloud-based radiology services can be challenging. Approximately 30% of healthcare facilities in rural areas globally face internet connectivity issues, hindering the adoption of RaaS.
  • Resistance to Change: Some healthcare providers are hesitant to adopt RaaS due to concerns about the quality of outsourced services, potential job losses for in-house radiologists, and the disruption of established workflows. This resistance is particularly prevalent in developed markets, where traditional radiology practices are deeply ingrained.
  • Regulatory Hurdles: Compliance with varying healthcare regulations across different countries can be a challenge for RaaS providers, limiting their ability to expand globally. The regulatory compliance costs for RaaS providers are expected to increase by 12% annually due to the evolving legal landscape.

Segment Analysis: Global Radiology as a Service Market

The teleradiology segment is a cornerstone of the radiology as a service market, commanding over 33% of the radiology as a service market share in 2023. This growth is fuelled by the rising demand for remote diagnostic services, particularly in regions with limited access to specialized radiologists.

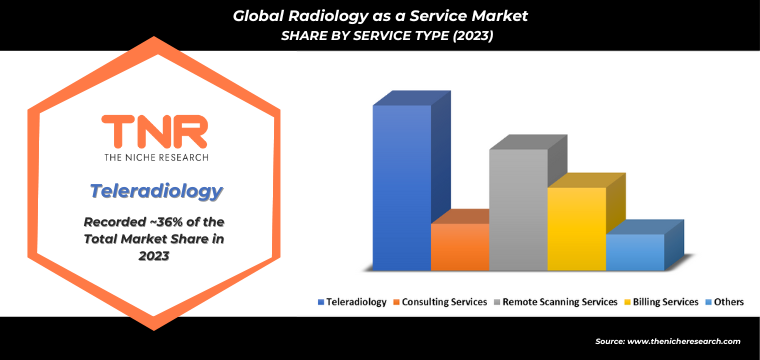
Teleradiology enables healthcare providers to transmit radiological images, such as X-rays, CT scans, and MRIs, to radiologists located anywhere in the world for interpretation. For example, hospitals in rural areas or developing countries can leverage teleradiology to access expert opinions from radiologists in urban centres or even different countries, significantly improving patient care. For instance, in India, where over 70% of the population resides in rural areas, teleradiology services have enabled hospitals to connect with radiologists in major urban centers like Delhi and Mumbai. This has led to a 40% reduction in diagnostic turnaround times, significantly improving patient care. Similarly, in Australia, teleradiology has played a critical role in serving the 30% of the population living in remote regions. Australian healthcare facilities have leveraged teleradiology to transmit images to specialists in cities like Sydney and Melbourne, contributing to a 20% increase in diagnostic accuracy in these areas.

The adoption of teleradiology has been further accelerated by the integration of advanced technologies like cloud computing and AI, which enhance the speed and accuracy of image analysis. In 2023, the global teleradiology market was valued at approximately USD 1.2 billion, with a projected growth rate of 15.5% CAGR through 2030, reflecting its critical role in the broader RaaS ecosystem.

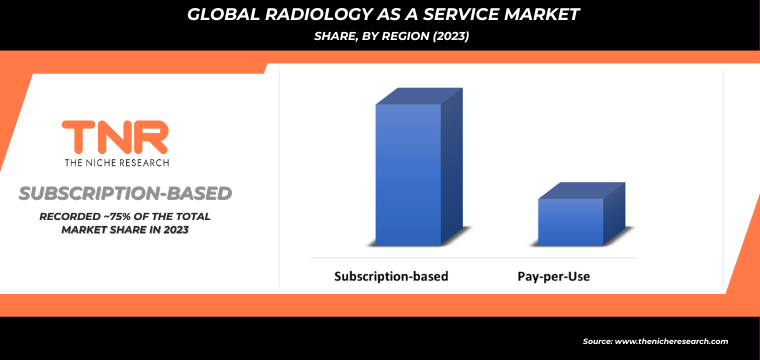
In 2023, the subscription-based model accounted for the highest share within the radiology as a service market by business model. This approach is increasingly preferred by healthcare providers due to its predictable cost structure and access to a comprehensive suite of radiology services. Subscription-based models typically offer bundled services, including image storage, teleradiology, and AI-driven diagnostics, on a monthly or annual basis.

This model provides healthcare facilities with consistent access to cutting-edge radiology tools and expert consultations without the need for significant upfront investments. For example, in the United States, over 45% of hospitals have adopted subscription-based RaaS models to manage their radiology needs. This shift has resulted in a 20% reduction in operational costs for these hospitals, while also providing them with access to advanced diagnostic tools that might otherwise be unaffordable. In Germany, the subscription-based model has gained significant traction, with nearly 40% of healthcare providers utilizing this approach. The predictable monthly costs have enabled German hospitals to better manage their budgets, leading to a 25% increase in the adoption of AI-driven diagnostics within the radiology departments.

In 2023, the x-ray segment held the largest revenue share of approximately 29.3% within the Radiology as a Service market. This dominant share reflects X-ray’s widespread utilization due to its cost-effectiveness, quick diagnostic capabilities, and versatility in detecting a broad range of conditions, from fractures to infections. X-rays are integral to both emergency and routine medical care, making them a staple in healthcare facilities worldwide.

On the other hand, CT segment is anticipated to witness fastest CAGR during the forecast period (2024 – 2034). This expected growth is fueled by various factors, such as technological advancements, the growing incidence of chronic diseases, and an increasing demand for high-resolution and detailed imaging. CT scans provide comprehensive cross-sectional images that offer greater diagnostic precision, which is crucial for complex cases such as cancer, trauma, and cardiovascular conditions.

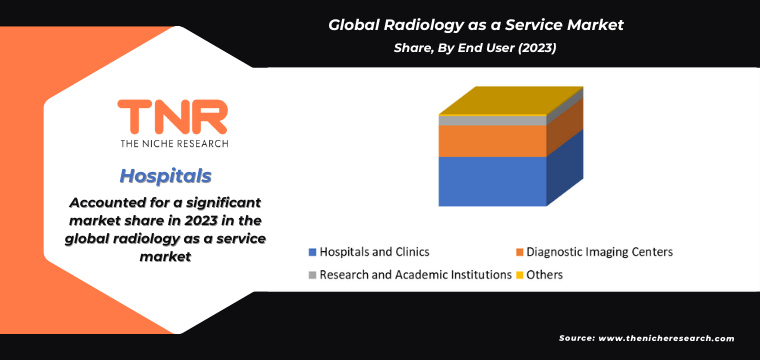
Based on end-use, the hospital segment dominated the radiology as a service market with a significant 53.6% share in 2023. This dominant position is attributed to the extensive use of radiology services within hospitals for a variety of diagnostic and therapeutic purposes. Hospitals are key users of radiology services due to their comprehensive range of medical procedures and the need for high-volume diagnostic imaging to support patient care.  Hospitals utilize radiology services for a wide array of functions, including emergency diagnostics, routine check-ups, preoperative and postoperative assessments, and ongoing management of chronic conditions. The integration of advanced imaging technologies, such as MRI, CT, and X-ray, is essential for hospitals to provide accurate diagnoses and effective treatment plans.

As of 2023, North America held the largest revenue share in the radiology as a service market, accounting for 41.3%. This dominant share is driven by several factors, including the region’s advanced healthcare infrastructure, high adoption of cutting-edge radiology technologies, and significant investments in medical imaging solutions.

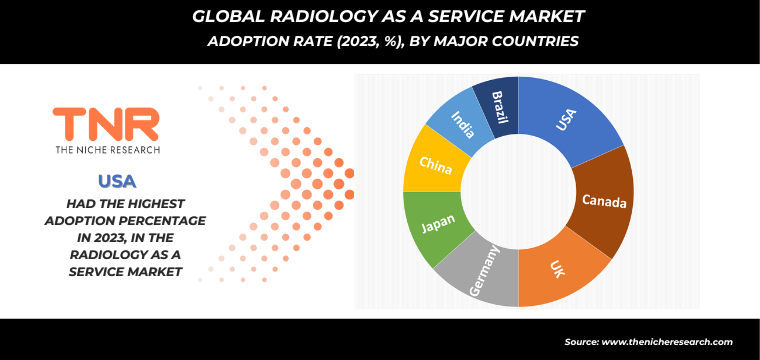
The United States, in particular, contributes substantially to this leading position due to its extensive network of hospitals, diagnostic centers, and healthcare facilities that rely heavily on radiology services. The country’s emphasis on technological innovation and the integration of advanced imaging technologies such as AI-driven diagnostics and high-resolution CT and MRI scanners further bolsters its market share. In addition, the U.S. healthcare system’s focus on early and accurate diagnosis of various conditions drives high demand for comprehensive radiology services.

Canada also plays a significant role in North America’s large market share, with its healthcare system increasingly adopting advanced radiology solutions to enhance diagnostic capabilities and improve patient care. Canadian hospitals and diagnostic centers are investing in state-of-the-art imaging technologies and integrated radiology services, contributing to the region’s substantial revenue share.

Global Radiology as a Service Market: Key Participants

  • ARIS Radiology
  • Aster Medical Imaging, LLC.
  • Everlight Radiology
  • KG Invicta Services Private Limited.
  • ONRAD Inc.
  • Premier Radiology Services
  • Rays (Envision Healthcare Company)
  • Siemens Healthcare S.A.
  • StatRad LLC
  • TeleDiagnosys Services Pvt Ltd.
  • Telemedicine Clinic
  • The Radiology Group
  • Virtual Radiologic
  • Vital Radiology Services
  • Other Industry Participants

Global Radiology as a Service Market:

By Service Type

  • Teleradiology
    • Routine Reporting
    • Nighthawk Services
    • Preliminary Reads Services
    • Emergency Reporting
    • Final Reads Services
  • Consulting Services
  • Remote Scanning Services
  • Billing Services
  • Others

By Business Model

  • Subscription-based
  • Pay-per-Use

By Modality

  • X-ray
  • CT
  • MRI
  • Ultrasound
  • PET Scan
  • Nuclear Medicine
  • Mammography
  • Others

By End User

  • Hospitals and Clinics
  • Diagnostic Imaging Centers
  • Research and Academic Institutions
  • Others

By Region

  • North America (U.S., Canada, Mexico, Rest of North America)
  • Europe (France, The UK, Spain, Germany, Italy, Nordic Countries (Denmark, Finland, Iceland, Sweden, Norway), Benelux Union (Belgium, The Netherlands, Luxembourg), Rest of Europe
  • Asia Pacific (China, Japan, India, New Zealand, Australia, South Korea, Southeast Asia (Indonesia, Thailand, Malaysia, Singapore, Rest of Southeast Asia), Rest of Asia Pacific
  • Middle East & Africa (Saudi Arabia, UAE, Egypt, Kuwait, South Africa, Rest of Middle East & Africa)
  • Latin America (Brazil, Argentina, Rest of Latin America

Global Radiology as a Service Market: Key Highlights

Report Specifications Details
Market Revenue in 2023 USD 4.56 Bn
Market Size Forecast by 2034 USD 16.99 Bn
Growth Rate (CAGR) 17.3%
Historic Data 2016 – 2022
Base Year for Estimation 2023
Forecast Period 2024 – 2034
Report Inclusions Market Size & Estimates, Market Dynamics, Competitive Scenario, Trends, Growth Factors, Market Determinants, Key Investment Segmentation, Product/Service/Solutions Benchmarking
Segments Covered By Service Type, By Business Model, By Modality, By End User
Regions Covered North America, Europe, Asia Pacific, Middle East & Africa, Latin America
Countries Covered U.S., Canada, Mexico, Rest of North America,  France, The UK, Spain, Germany, Italy, Nordic Countries (Denmark, Finland, Iceland, Sweden, Norway), Benelux Union (Belgium, The Netherlands, Luxembourg), Rest of Europe,  China, Japan, India, New Zealand, Australia, South Korea, Southeast Asia (Indonesia, Thailand, Malaysia, Singapore, Rest of Southeast Asia), Rest of Asia Pacific,  Saudi Arabia, UAE, Egypt, Kuwait, South Africa, Rest of Middle East & Africa,  Brazil, Argentina, Rest of Latin America
Key Players ARIS Radiology, Aster Medical Imaging, LLC., Everlight Radiology, KG Invicta Services Private Limited., ONRAD Inc., Premier Radiology Services, Rays (Envision Healthcare Company), Siemens Healthcare S.A., StatRad LLC, TeleDiagnosys Services Pvt Ltd., Telemedicine Clinic, The Radiology Group, Virtual Radiologic, Vital Radiology Services Other Market Participants
Customization Scope Customization allows for the inclusion/modification of content pertaining to geographical regions, countries, and specific market segments.
Pricing & Procurement Options Explore purchase options tailored to your specific research requirements
Contact Details Consult With Our Expert

Japan (Toll-Free):  +81 663-386-8111

South Korea (Toll-Free):  +82-808- 703-126

Saudi Arabia (Toll-Free):  +966 800-850-1643

United Kingdom: +44 753-710-5080

United States: +1 302-232-5106

E-mail:  askanexpert@thenicheresearch.com


Global Radiology as a Service Market: Report Layout

Table of Contents

.

1.Market Scope
1.1.Market Segmentation

1.2.Years Considered
1.2.1.Historic Years: 2016 – 2022

1.2.2.Base Year: 2023

1.2.3.Forecast Years: 2024 – 2034

2.Key Target Audiences

3.Research Methodology
3.1.Primary Research
3.1.1.Research Questionnaire

3.1.2.Global Percentage Breakdown

3.1.3.Primary Interviews: Key Opinion Leaders (KOLs)

3.2.Secondary Research
3.2.1.Paid Databases

3.2.2.Secondary Sources

3.3.Market Size Estimates
3.3.1.Top-Down Approach

3.3.2.Bottom-Up Approach

3.4.Data Triangulation Methodology

3.5.Research Assumptions

4.Recommendations and Insights from TNR’s Perspective**

5.Holistic Overview of Radiology As A Service Market

6.Market Synopsis: Radiology As A Service Market

7.Radiology As A Service Market Analysis: Qualitative Perspective
7.1.Introduction
7.1.1.Product Definition

7.1.2.Industry Development

7.2.Market Dynamics
7.2.1.Drivers

7.2.2.Restraints

7.2.3.Opportunities

7.2.4.Challenges

7.3.Trends in Radiology As A Service Market

7.4.Market Determinants Radar Chart

7.5.Macro-Economic and Micro-Economic Indicators: Radiology As A Service Market

7.6.Porter’s Five Force Analysis

7.7.Impact of Covid-19 on Radiology As A Service Market

7.8.PESTEL Analysis

8.Global Radiology As A Service Market Analysis and Forecasts, 2024 – 2034
8.1.Overview
8.1.1.Global Radiology As A Service Market Revenue (US$ Mn)

8.2.Global Radiology As A Service Market Revenue (US$ Mn) and Forecasts, By Services
8.2.1.Teleradiology
8.2.1.1.Definition

8.2.1.2.Market Estimation and Penetration, 2016 – 2023

8.2.1.3.Market Forecast, 2024 – 2034

8.2.1.4.Compound Annual Growth Rate (CAGR)

8.2.1.5.Regional Bifurcation
8.2.1.5.1.North America
8.2.1.5.1.1.Market Estimation, 2016 – 2023

8.2.1.5.1.2.Market Forecast, 2024 – 2034

8.2.1.5.2.Europe
8.2.1.5.2.1.Market Estimation, 2016 – 2023

8.2.1.5.2.2.Market Forecast, 2024 – 2034

8.2.1.5.3.Asia Pacific
8.2.1.5.3.1.Market Estimation, 2016 – 2023

8.2.1.5.3.2.Market Forecast, 2024 – 2034

8.2.1.5.4.Middle East and Africa
8.2.1.5.4.1.Market Estimation, 2016 – 2023

8.2.1.5.4.2.Market Forecast, 2024 – 2034

8.2.1.5.5.Latin America
8.2.1.5.5.1.Market Estimation, 2016 – 2023

8.2.1.5.5.2.Market Forecast, 2024 – 2034

8.2.2.Remote scanning
8.2.2.1.Definition

8.2.2.2.Market Estimation and Penetration, 2016 – 2023

8.2.2.3.Market Forecast, 2024 – 2034

8.2.2.4.Compound Annual Growth Rate (CAGR)

8.2.2.5.Regional Bifurcation
8.2.2.5.1.North America
8.2.2.5.1.1.Market Estimation, 2016 – 2023

8.2.2.5.1.2.Market Forecast, 2024 – 2034

8.2.2.5.2.Europe
8.2.2.5.2.1.Market Estimation, 2016 – 2023

8.2.2.5.2.2.Market Forecast, 2024 – 2034

8.2.2.5.3.Asia Pacific
8.2.2.5.3.1.Market Estimation, 2016 – 2023

8.2.2.5.3.2.Market Forecast, 2024 – 2034

8.2.2.5.4.Middle East and Africa
8.2.2.5.4.1.Market Estimation, 2016 – 2023

8.2.2.5.4.2.Market Forecast, 2024 – 2034

8.2.2.5.5.Latin America
8.2.2.5.5.1.Market Estimation, 2016 – 2023

8.2.2.5.5.2.Market Forecast, 2024 – 2034

8.2.3.Consulting
8.2.3.1.Definition

8.2.3.2.Market Estimation and Penetration, 2016 – 2023

8.2.3.3.Market Forecast, 2024 – 2034

8.2.3.4.Compound Annual Growth Rate (CAGR)

8.2.3.5.Regional Bifurcation
8.2.3.5.1.North America
8.2.3.5.1.1.Market Estimation, 2016 – 2023

8.2.3.5.1.2.Market Forecast, 2024 – 2034

8.2.3.5.2.Europe
8.2.3.5.2.1.Market Estimation, 2016 – 2023

8.2.3.5.2.2.Market Forecast, 2024 – 2034

8.2.3.5.3.Asia Pacific
8.2.3.5.3.1.Market Estimation, 2016 – 2023

8.2.3.5.3.2.Market Forecast, 2024 – 2034

8.2.3.5.4.Middle East and Africa
8.2.3.5.4.1.Market Estimation, 2016 – 2023

8.2.3.5.4.2.Market Forecast, 2024 – 2034

8.2.3.5.5.Latin America
8.2.3.5.5.1.Market Estimation, 2016 – 2023

8.2.3.5.5.2.Market Forecast, 2024 – 2034

8.2.4.Others
8.2.4.1.Definition

8.2.4.2.Market Estimation and Penetration, 2016 – 2023

8.2.4.3.Market Forecast, 2024 – 2034

8.2.4.4.Compound Annual Growth Rate (CAGR)

8.2.4.5.Regional Bifurcation
8.2.4.5.1.North America
8.2.4.5.1.1.Market Estimation, 2016 – 2023

8.2.4.5.1.2.Market Forecast, 2024 – 2034

8.2.4.5.2.Europe
8.2.4.5.2.1.Market Estimation, 2016 – 2023

8.2.4.5.2.2.Market Forecast, 2024 – 2034

8.2.4.5.3.Asia Pacific
8.2.4.5.3.1.Market Estimation, 2016 – 2023

8.2.4.5.3.2.Market Forecast, 2024 – 2034

8.2.4.5.4.Middle East and Africa
8.2.4.5.4.1.Market Estimation, 2016 – 2023

8.2.4.5.4.2.Market Forecast, 2024 – 2034

8.2.4.5.5.Latin America
8.2.4.5.5.1.Market Estimation, 2016 – 2023

8.2.4.5.5.2.Market Forecast, 2024 – 2034

8.3.Key Segment for Channeling Investments
8.3.1.By Services

9.Global Radiology As A Service Market Analysis and Forecasts, 2024 – 2034
9.1.Overview

9.2.Global Radiology As A Service Market Revenue (US$ Mn) and Forecasts, By Type
9.2.1.Diagnostic radiology
9.2.1.1.Definition

9.2.1.2.Market Estimation and Penetration, 2016 – 2023

9.2.1.3.Market Forecast, 2024 – 2034

9.2.1.4.Compound Annual Growth Rate (CAGR)

9.2.1.5.Regional Bifurcation
9.2.1.5.1.North America
9.2.1.5.1.1.Market Estimation, 2016 – 2023

9.2.1.5.1.2.Market Forecast, 2024 – 2034

9.2.1.5.2.Europe
9.2.1.5.2.1.Market Estimation, 2016 – 2023

9.2.1.5.2.2.Market Forecast, 2024 – 2034

9.2.1.5.3.Asia Pacific
9.2.1.5.3.1.Market Estimation, 2016 – 2023

9.2.1.5.3.2.Market Forecast, 2024 – 2034

9.2.1.5.4.Middle East and Africa
9.2.1.5.4.1.Market Estimation, 2016 – 2023

9.2.1.5.4.2.Market Forecast, 2024 – 2034

9.2.1.5.5.Latin America
9.2.1.5.5.1.Market Estimation, 2016 – 2023

9.2.1.5.5.2.Market Forecast, 2024 – 2034

9.2.2.Interventional radiology
9.2.2.1.Definition

9.2.2.2.Market Estimation and Penetration, 2016 – 2023

9.2.2.3.Market Forecast, 2024 – 2034

9.2.2.4.Compound Annual Growth Rate (CAGR)

9.2.2.5.Regional Bifurcation
9.2.2.5.1.North America
9.2.2.5.1.1.Market Estimation, 2016 – 2023

9.2.2.5.1.2.Market Forecast, 2024 – 2034

9.2.2.5.2.Europe
9.2.2.5.2.1.Market Estimation, 2016 – 2023

9.2.2.5.2.2.Market Forecast, 2024 – 2034

9.2.2.5.3.Asia Pacific
9.2.2.5.3.1.Market Estimation, 2016 – 2023

9.2.2.5.3.2.Market Forecast, 2024 – 2034

9.2.2.5.4.Middle East and Africa
9.2.2.5.4.1.Market Estimation, 2016 – 2023

9.2.2.5.4.2.Market Forecast, 2024 – 2034

9.2.2.5.5.Latin America
9.2.2.5.5.1.Market Estimation, 2016 – 2023

9.2.2.5.5.2.Market Forecast, 2024 – 2034

9.2.3.Therapeutic radiology
9.2.3.1.Definition

9.2.3.2.Market Estimation and Penetration, 2016 – 2023

9.2.3.3.Market Forecast, 2024 – 2034

9.2.3.4.Compound Annual Growth Rate (CAGR)

9.2.3.5.Regional Bifurcation
9.2.3.5.1.North America
9.2.3.5.1.1.Market Estimation, 2016 – 2023

9.2.3.5.1.2.Market Forecast, 2024 – 2034

9.2.3.5.2.Europe
9.2.3.5.2.1.Market Estimation, 2016 – 2023

9.2.3.5.2.2.Market Forecast, 2024 – 2034

9.2.3.5.3.Asia Pacific
9.2.3.5.3.1.Market Estimation, 2016 – 2023

9.2.3.5.3.2.Market Forecast, 2024 – 2034

9.2.3.5.4.Middle East and Africa
9.2.3.5.4.1.Market Estimation, 2016 – 2023

9.2.3.5.4.2.Market Forecast, 2024 – 2034

9.2.3.5.5.Latin America
9.2.3.5.5.1.Market Estimation, 2016 – 2023

9.2.3.5.5.2.Market Forecast, 2024 – 2034

9.3.Key Segment for Channeling Investments
9.3.1.By Type

10.Global Radiology As A Service Market Analysis and Forecasts, 2024 – 2034
10.1.Overview

10.2.Global Radiology As A Service Market Revenue (US$ Mn) and Forecasts, By Modality
10.2.1.MRI
10.2.1.1.Definition

10.2.1.2.Market Estimation and Penetration, 2016 – 2023

10.2.1.3.Market Forecast, 2024 – 2034

10.2.1.4.Compound Annual Growth Rate (CAGR)

10.2.1.5.Regional Bifurcation
10.2.1.5.1.North America
10.2.1.5.1.1.Market Estimation, 2016 – 2023

10.2.1.5.1.2.Market Forecast, 2024 – 2034

10.2.1.5.2.Europe
10.2.1.5.2.1.Market Estimation, 2016 – 2023

10.2.1.5.2.2.Market Forecast, 2024 – 2034

10.2.1.5.3.Asia Pacific
10.2.1.5.3.1.Market Estimation, 2016 – 2023

10.2.1.5.3.2.Market Forecast, 2024 – 2034

10.2.1.5.4.Middle East and Africa
10.2.1.5.4.1.Market Estimation, 2016 – 2023

10.2.1.5.4.2.Market Forecast, 2024 – 2034

10.2.1.5.5.Latin America
10.2.1.5.5.1.Market Estimation, 2016 – 2023

10.2.1.5.5.2.Market Forecast, 2024 – 2034

10.2.2.CT Scan
10.2.2.1.Definition

10.2.2.2.Market Estimation and Penetration, 2016 – 2023

10.2.2.3.Market Forecast, 2024 – 2034

10.2.2.4.Compound Annual Growth Rate (CAGR)

10.2.2.5.Regional Bifurcation
10.2.2.5.1.North America
10.2.2.5.1.1.Market Estimation, 2016 – 2023

10.2.2.5.1.2.Market Forecast, 2024 – 2034

10.2.2.5.2.Europe
10.2.2.5.2.1.Market Estimation, 2016 – 2023

10.2.2.5.2.2.Market Forecast, 2024 – 2034

10.2.2.5.3.Asia Pacific
10.2.2.5.3.1.Market Estimation, 2016 – 2023

10.2.2.5.3.2.Market Forecast, 2024 – 2034

10.2.2.5.4.Middle East and Africa
10.2.2.5.4.1.Market Estimation, 2016 – 2023

10.2.2.5.4.2.Market Forecast, 2024 – 2034

10.2.2.5.5.Latin America
10.2.2.5.5.1.Market Estimation, 2016 – 2023

10.2.2.5.5.2.Market Forecast, 2024 – 2034

10.2.3.X-Ray
10.2.3.1.Definition

10.2.3.2.Market Estimation and Penetration, 2016 – 2023

10.2.3.3.Market Forecast, 2024 – 2034

10.2.3.4.Compound Annual Growth Rate (CAGR)

10.2.3.5.Regional Bifurcation
10.2.3.5.1.North America
10.2.3.5.1.1.Market Estimation, 2016 – 2023

10.2.3.5.1.2.Market Forecast, 2024 – 2034

10.2.3.5.2.Europe
10.2.3.5.2.1.Market Estimation, 2016 – 2023

10.2.3.5.2.2.Market Forecast, 2024 – 2034

10.2.3.5.3.Asia Pacific
10.2.3.5.3.1.Market Estimation, 2016 – 2023

10.2.3.5.3.2.Market Forecast, 2024 – 2034

10.2.3.5.4.Middle East and Africa
10.2.3.5.4.1.Market Estimation, 2016 – 2023

10.2.3.5.4.2.Market Forecast, 2024 – 2034

10.2.3.5.5.Latin America
10.2.3.5.5.1.Market Estimation, 2016 – 2023

10.2.3.5.5.2.Market Forecast, 2024 – 2034

10.2.4.Ultrasound
10.2.4.1.Definition

10.2.4.2.Market Estimation and Penetration, 2016 – 2023

10.2.4.3.Market Forecast, 2024 – 2034

10.2.4.4.Compound Annual Growth Rate (CAGR)

10.2.4.5.Regional Bifurcation
10.2.4.5.1.North America
10.2.4.5.1.1.Market Estimation, 2016 – 2023

10.2.4.5.1.2.Market Forecast, 2024 – 2034

10.2.4.5.2.Europe
10.2.4.5.2.1.Market Estimation, 2016 – 2023

10.2.4.5.2.2.Market Forecast, 2024 – 2034

10.2.4.5.3.Asia Pacific
10.2.4.5.3.1.Market Estimation, 2016 – 2023

10.2.4.5.3.2.Market Forecast, 2024 – 2034

10.2.4.5.4.Middle East and Africa
10.2.4.5.4.1.Market Estimation, 2016 – 2023

10.2.4.5.4.2.Market Forecast, 2024 – 2034

10.2.4.5.5.Latin America
10.2.4.5.5.1.Market Estimation, 2016 – 2023

10.2.4.5.5.2.Market Forecast, 2024 – 2034

10.2.5.Mammography
10.2.5.1.Definition

10.2.5.2.Market Estimation and Penetration, 2016 – 2023

10.2.5.3.Market Forecast, 2024 – 2034

10.2.5.4.Compound Annual Growth Rate (CAGR)

10.2.5.5.Regional Bifurcation
10.2.5.5.1.North America
10.2.5.5.1.1.Market Estimation, 2016 – 2023

10.2.5.5.1.2.Market Forecast, 2024 – 2034

10.2.5.5.2.Europe
10.2.5.5.2.1.Market Estimation, 2016 – 2023

10.2.5.5.2.2.Market Forecast, 2024 – 2034

10.2.5.5.3.Asia Pacific
10.2.5.5.3.1.Market Estimation, 2016 – 2023

10.2.5.5.3.2.Market Forecast, 2024 – 2034

10.2.5.5.4.Middle East and Africa
10.2.5.5.4.1.Market Estimation, 2016 – 2023

10.2.5.5.4.2.Market Forecast, 2024 – 2034

10.2.5.5.5.Latin America
10.2.5.5.5.1.Market Estimation, 2016 – 2023

10.2.5.5.5.2.Market Forecast, 2024 – 2034

10.2.6.PET-CT
10.2.6.1.Definition

10.2.6.2.Market Estimation and Penetration, 2016 – 2023

10.2.6.3.Market Forecast, 2024 – 2034

10.2.6.4.Compound Annual Growth Rate (CAGR)

10.2.6.5.Regional Bifurcation
10.2.6.5.1.North America
10.2.6.5.1.1.Market Estimation, 2016 – 2023

10.2.6.5.1.2.Market Forecast, 2024 – 2034

10.2.6.5.2.Europe
10.2.6.5.2.1.Market Estimation, 2016 – 2023

10.2.6.5.2.2.Market Forecast, 2024 – 2034

10.2.6.5.3.Asia Pacific
10.2.6.5.3.1.Market Estimation, 2016 – 2023

10.2.6.5.3.2.Market Forecast, 2024 – 2034

10.2.6.5.4.Middle East and Africa
10.2.6.5.4.1.Market Estimation, 2016 – 2023

10.2.6.5.4.2.Market Forecast, 2024 – 2034

10.2.6.5.5.Latin America
10.2.6.5.5.1.Market Estimation, 2016 – 2023

10.2.6.5.5.2.Market Forecast, 2024 – 2034

10.2.7.Others
10.2.7.1.Definition

10.2.7.2.Market Estimation and Penetration, 2016 – 2023

10.2.7.3.Market Forecast, 2024 – 2034

10.2.7.4.Compound Annual Growth Rate (CAGR)

10.2.7.5.Regional Bifurcation
10.2.7.5.1.North America
10.2.7.5.1.1.Market Estimation, 2016 – 2023

10.2.7.5.1.2.Market Forecast, 2024 – 2034

10.2.7.5.2.Europe
10.2.7.5.2.1.Market Estimation, 2016 – 2023

10.2.7.5.2.2.Market Forecast, 2024 – 2034

10.2.7.5.3.Asia Pacific
10.2.7.5.3.1.Market Estimation, 2016 – 2023

10.2.7.5.3.2.Market Forecast, 2024 – 2034

10.2.7.5.4.Middle East and Africa
10.2.7.5.4.1.Market Estimation, 2016 – 2023

10.2.7.5.4.2.Market Forecast, 2024 – 2034

10.2.7.5.5.Latin America
10.2.7.5.5.1.Market Estimation, 2016 – 2023

10.2.7.5.5.2.Market Forecast, 2024 – 2034

10.3.Key Segment for Channeling Investments
10.3.1.By Modality

11.Global Radiology As A Service Market Analysis and Forecasts, 2024 – 2034
11.1.Overview

11.2.Global Radiology As A Service Market Revenue (US$ Mn) and Forecasts, By End Users
11.2.1.Hospitals and Clinics
11.2.1.1.Definition

11.2.1.2.Market Estimation and Penetration, 2016 – 2023

11.2.1.3.Market Forecast, 2024 – 2034

11.2.1.4.Compound Annual Growth Rate (CAGR)

11.2.1.5.Regional Bifurcation
11.2.1.5.1.North America
11.2.1.5.1.1.Market Estimation, 2016 – 2023

11.2.1.5.1.2.Market Forecast, 2024 – 2034

11.2.1.5.2.Europe
11.2.1.5.2.1.Market Estimation, 2016 – 2023

11.2.1.5.2.2.Market Forecast, 2024 – 2034

11.2.1.5.3.Asia Pacific
11.2.1.5.3.1.Market Estimation, 2016 – 2023

11.2.1.5.3.2.Market Forecast, 2024 – 2034

11.2.1.5.4.Middle East and Africa
11.2.1.5.4.1.Market Estimation, 2016 – 2023

11.2.1.5.4.2.Market Forecast, 2024 – 2034

11.2.1.5.5.Latin America
11.2.1.5.5.1.Market Estimation, 2016 – 2023

11.2.1.5.5.2.Market Forecast, 2024 – 2034

11.2.2.Diagnostic Imaging Centers
11.2.2.1.Definition

11.2.2.2.Market Estimation and Penetration, 2016 – 2023

11.2.2.3.Market Forecast, 2024 – 2034

11.2.2.4.Compound Annual Growth Rate (CAGR)

11.2.2.5.Regional Bifurcation
11.2.2.5.1.North America
11.2.2.5.1.1.Market Estimation, 2016 – 2023

11.2.2.5.1.2.Market Forecast, 2024 – 2034

11.2.2.5.2.Europe
11.2.2.5.2.1.Market Estimation, 2016 – 2023

11.2.2.5.2.2.Market Forecast, 2024 – 2034

11.2.2.5.3.Asia Pacific
11.2.2.5.3.1.Market Estimation, 2016 – 2023

11.2.2.5.3.2.Market Forecast, 2024 – 2034

11.2.2.5.4.Middle East and Africa
11.2.2.5.4.1.Market Estimation, 2016 – 2023

11.2.2.5.4.2.Market Forecast, 2024 – 2034

11.2.2.5.5.Latin America
11.2.2.5.5.1.Market Estimation, 2016 – 2023

11.2.2.5.5.2.Market Forecast, 2024 – 2034

11.2.3.Radiology Clinics
11.2.3.1.Definition

11.2.3.2.Market Estimation and Penetration, 2016 – 2023

11.2.3.3.Market Forecast, 2024 – 2034

11.2.3.4.Compound Annual Growth Rate (CAGR)

11.2.3.5.Regional Bifurcation
11.2.3.5.1.North America
11.2.3.5.1.1.Market Estimation, 2016 – 2023

11.2.3.5.1.2.Market Forecast, 2024 – 2034

11.2.3.5.2.Europe
11.2.3.5.2.1.Market Estimation, 2016 – 2023

11.2.3.5.2.2.Market Forecast, 2024 – 2034

11.2.3.5.3.Asia Pacific
11.2.3.5.3.1.Market Estimation, 2016 – 2023

11.2.3.5.3.2.Market Forecast, 2024 – 2034

11.2.3.5.4.Middle East and Africa
11.2.3.5.4.1.Market Estimation, 2016 – 2023

11.2.3.5.4.2.Market Forecast, 2024 – 2034

11.2.3.5.5.Latin America
11.2.3.5.5.1.Market Estimation, 2016 – 2023

11.2.3.5.5.2.Market Forecast, 2024 – 2034

11.2.4.Others
11.2.4.1.Definition

11.2.4.2.Market Estimation and Penetration, 2016 – 2023

11.2.4.3.Market Forecast, 2024 – 2034

11.2.4.4.Compound Annual Growth Rate (CAGR)

11.2.4.5.Regional Bifurcation
11.2.4.5.1.North America
11.2.4.5.1.1.Market Estimation, 2016 – 2023

11.2.4.5.1.2.Market Forecast, 2024 – 2034

11.2.4.5.2.Europe
11.2.4.5.2.1.Market Estimation, 2016 – 2023

11.2.4.5.2.2.Market Forecast, 2024 – 2034

11.2.4.5.3.Asia Pacific
11.2.4.5.3.1.Market Estimation, 2016 – 2023

11.2.4.5.3.2.Market Forecast, 2024 – 2034

11.2.4.5.4.Middle East and Africa
11.2.4.5.4.1.Market Estimation, 2016 – 2023

11.2.4.5.4.2.Market Forecast, 2024 – 2034

11.2.4.5.5.Latin America
11.2.4.5.5.1.Market Estimation, 2016 – 2023

11.2.4.5.5.2.Market Forecast, 2024 – 2034

11.3.Key Segment for Channeling Investments
11.3.1.By End Users

12.North America Radiology As A Service Market Analysis and Forecasts, 2024 – 2034
12.1.Overview
12.1.1.North America Radiology As A Service Market Revenue (US$ Mn)

12.2.North America Radiology As A Service Market Revenue (US$ Mn) and Forecasts, By Services
12.2.1.Teleradiology

12.2.2.Remote scanning

12.2.3.Consulting

12.2.4.Others

12.3.North America Radiology As A Service Market Revenue (US$ Mn) and Forecasts, By Type
12.3.1.Diagnostic radiology

12.3.2.Interventional radiology

12.3.3.Therapeutic radiology

12.4.North America Radiology As A Service Market Revenue (US$ Mn) and Forecasts, By Modality
12.4.1.MRI

12.4.2.CT Scan

12.4.3.X-Ray

12.4.4.Ultrasound

12.4.5.Mammography

12.4.6.PET-CT

12.4.7.Others

12.5.North America Radiology As A Service Market Revenue (US$ Mn) and Forecasts, By End Users
12.5.1.Hospitals and Clinics

12.5.2.Diagnostic Imaging Centers

12.5.3.Radiology Clinics

12.5.4.Others

12.6.North America Radiology As A Service Market Revenue (US$ Mn) and Forecasts, By Country
12.6.1.U.S
12.6.1.1.U.S Radiology As A Service Market Revenue (US$ Mn) and Forecasts, By Services
12.6.1.1.1.Teleradiology

12.6.1.1.2.Remote scanning

12.6.1.1.3.Consulting

12.6.1.1.4.Others

12.6.1.2.U.S Radiology As A Service Market Revenue (US$ Mn) and Forecasts, By Type
12.6.1.2.1.Diagnostic radiology

12.6.1.2.2.Interventional radiology

12.6.1.2.3.Therapeutic radiology

12.6.1.3.U.S Radiology As A Service Market Revenue (US$ Mn) and Forecasts, By Modality
12.6.1.3.1.MRI

12.6.1.3.2.CT Scan

12.6.1.3.3.X-Ray

12.6.1.3.4.Ultrasound

12.6.1.3.5.Mammography

12.6.1.3.6.PET-CT

12.6.1.3.7.Others

12.6.1.4.U.S Radiology As A Service Market Revenue (US$ Mn) and Forecasts, By End Users
12.6.1.4.1.Hospitals and Clinics

12.6.1.4.2.Diagnostic Imaging Centers

12.6.1.4.3.Radiology Clinics

12.6.1.4.4.Others

12.6.2.Canada
12.6.2.1.Canada Radiology As A Service Market Revenue (US$ Mn) and Forecasts, By Services
12.6.2.1.1.Teleradiology

12.6.2.1.2.Remote scanning

12.6.2.1.3.Consulting

12.6.2.1.4.Others

12.6.2.2.Canada Radiology As A Service Market Revenue (US$ Mn) and Forecasts, By Type
12.6.2.2.1.Diagnostic radiology

12.6.2.2.2.Interventional radiology

12.6.2.2.3.Therapeutic radiology

12.6.2.3.Canada Radiology As A Service Market Revenue (US$ Mn) and Forecasts, By Modality
12.6.2.3.1.MRI

12.6.2.3.2.CT Scan

12.6.2.3.3.X-Ray

12.6.2.3.4.Ultrasound

12.6.2.3.5.Mammography

12.6.2.3.6.PET-CT

12.6.2.3.7.Others

12.6.2.4.Canada Radiology As A Service Market Revenue (US$ Mn) and Forecasts, By End Users
12.6.2.4.1.Hospitals and Clinics

12.6.2.4.2.Diagnostic Imaging Centers

12.6.2.4.3.Radiology Clinics

12.6.2.4.4.Others

12.6.3.Mexico
12.6.3.1.Mexico Radiology As A Service Market Revenue (US$ Mn) and Forecasts, By Services
12.6.3.1.1.Teleradiology

12.6.3.1.2.Remote scanning

12.6.3.1.3.Consulting

12.6.3.1.4.Others

12.6.3.2.Mexico Radiology As A Service Market Revenue (US$ Mn) and Forecasts, By Type
12.6.3.2.1.Diagnostic radiology

12.6.3.2.2.Interventional radiology

12.6.3.2.3.Therapeutic radiology

12.6.3.3.Mexico Radiology As A Service Market Revenue (US$ Mn) and Forecasts, By Modality
12.6.3.3.1.MRI

12.6.3.3.2.CT Scan

12.6.3.3.3.X-Ray

12.6.3.3.4.Ultrasound

12.6.3.3.5.Mammography

12.6.3.3.6.PET-CT

12.6.3.3.7.Others

12.6.3.4.Mexico Radiology As A Service Market Revenue (US$ Mn) and Forecasts, By End Users
12.6.3.4.1.Hospitals and Clinics

12.6.3.4.2.Diagnostic Imaging Centers

12.6.3.4.3.Radiology Clinics

12.6.3.4.4.Others

12.6.4.Rest of North America
12.6.4.1.Rest of North America Radiology As A Service Market Revenue (US$ Mn) and Forecasts, By Services
12.6.4.1.1.Teleradiology

12.6.4.1.2.Remote scanning

12.6.4.1.3.Consulting

12.6.4.1.4.Others

12.6.4.2.Rest of North America Radiology As A Service Market Revenue (US$ Mn) and Forecasts, By Type
12.6.4.2.1.Diagnostic radiology

12.6.4.2.2.Interventional radiology

12.6.4.2.3.Therapeutic radiology

12.6.4.3.Rest of North America Radiology As A Service Market Revenue (US$ Mn) and Forecasts, By Modality
12.6.4.3.1.MRI

12.6.4.3.2.CT Scan

12.6.4.3.3.X-Ray

12.6.4.3.4.Ultrasound

12.6.4.3.5.Mammography

12.6.4.3.6.PET-CT

12.6.4.3.7.Others

12.6.4.4.Rest of North America Radiology As A Service Market Revenue (US$ Mn) and Forecasts, By End Users
12.6.4.4.1.Hospitals and Clinics

12.6.4.4.2.Diagnostic Imaging Centers

12.6.4.4.3.Radiology Clinics

12.6.4.4.4.Others

12.7.Key Segment for Channeling Investments
12.7.1.By Country

12.7.2.By Services

12.7.3.By Type

12.7.4.By Modality

12.7.5.By End Users

13.Europe Radiology As A Service Market Analysis and Forecasts, 2024 – 2034
13.1.Overview
13.1.1.Europe Radiology As A Service Market Revenue (US$ Mn)

13.2.Europe Radiology As A Service Market Revenue (US$ Mn) and Forecasts, By Services
13.2.1.Teleradiology

13.2.2.Remote scanning

13.2.3.Consulting

13.2.4.Others

13.3.Europe Radiology As A Service Market Revenue (US$ Mn) and Forecasts, By Type
13.3.1.Diagnostic radiology

13.3.2.Interventional radiology

13.3.3.Therapeutic radiology

13.4.Europe Radiology As A Service Market Revenue (US$ Mn) and Forecasts, By Modality
13.4.1.MRI

13.4.2.CT Scan

13.4.3.X-Ray

13.4.4.Ultrasound

13.4.5.Mammography

13.4.6.PET-CT

13.4.7.Others

13.5.Europe Radiology As A Service Market Revenue (US$ Mn) and Forecasts, By End Users
13.5.1.Hospitals and Clinics

13.5.2.Diagnostic Imaging Centers

13.5.3.Radiology Clinics

13.5.4.Others

13.6.Europe Radiology As A Service Market Revenue (US$ Mn) and Forecasts, By Country
13.6.1.France
13.6.1.1.France Radiology As A Service Market Revenue (US$ Mn) and Forecasts, By Services
13.6.1.1.1.Teleradiology

13.6.1.1.2.Remote scanning

13.6.1.1.3.Consulting

13.6.1.1.4.Others

13.6.1.2.France Radiology As A Service Market Revenue (US$ Mn) and Forecasts, By Type
13.6.1.2.1.Diagnostic radiology

13.6.1.2.2.Interventional radiology

13.6.1.2.3.Therapeutic radiology

13.6.1.3.France Radiology As A Service Market Revenue (US$ Mn) and Forecasts, By Modality
13.6.1.3.1.MRI

13.6.1.3.2.CT Scan

13.6.1.3.3.X-Ray

13.6.1.3.4.Ultrasound

13.6.1.3.5.Mammography

13.6.1.3.6.PET-CT

13.6.1.3.7.Others

13.6.1.4.France Radiology As A Service Market Revenue (US$ Mn) and Forecasts, By End Users
13.6.1.4.1.Hospitals and Clinics

13.6.1.4.2.Diagnostic Imaging Centers

13.6.1.4.3.Radiology Clinics

13.6.1.4.4.Others

13.6.2.The UK
13.6.2.1.The UK Radiology As A Service Market Revenue (US$ Mn) and Forecasts, By Services
13.6.2.1.1.Teleradiology

13.6.2.1.2.Remote scanning

13.6.2.1.3.Consulting

13.6.2.1.4.Others

13.6.2.2.The UK Radiology As A Service Market Revenue (US$ Mn) and Forecasts, By Type
13.6.2.2.1.Diagnostic radiology

13.6.2.2.2.Interventional radiology

13.6.2.2.3.Therapeutic radiology

13.6.2.3.The UK Radiology As A Service Market Revenue (US$ Mn) and Forecasts, By Modality
13.6.2.3.1.MRI

13.6.2.3.2.CT Scan

13.6.2.3.3.X-Ray

13.6.2.3.4.Ultrasound

13.6.2.3.5.Mammography

13.6.2.3.6.PET-CT

13.6.2.3.7.Others

13.6.2.4.The UK Radiology As A Service Market Revenue (US$ Mn) and Forecasts, By End Users
13.6.2.4.1.Hospitals and Clinics

13.6.2.4.2.Diagnostic Imaging Centers

13.6.2.4.3.Radiology Clinics

13.6.2.4.4.Others

13.6.3.Spain
13.6.3.1.Spain Radiology As A Service Market Revenue (US$ Mn) and Forecasts, By Services
13.6.3.1.1.Teleradiology

13.6.3.1.2.Remote scanning

13.6.3.1.3.Consulting

13.6.3.1.4.Others

13.6.3.2.Spain Radiology As A Service Market Revenue (US$ Mn) and Forecasts, By Type
13.6.3.2.1.Diagnostic radiology

13.6.3.2.2.Interventional radiology

13.6.3.2.3.Therapeutic radiology

13.6.3.3.Spain Radiology As A Service Market Revenue (US$ Mn) and Forecasts, By Modality
13.6.3.3.1.MRI

13.6.3.3.2.CT Scan

13.6.3.3.3.X-Ray

13.6.3.3.4.Ultrasound

13.6.3.3.5.Mammography

13.6.3.3.6.PET-CT

13.6.3.3.7.Others

13.6.3.4.Spain Radiology As A Service Market Revenue (US$ Mn) and Forecasts, By End Users
13.6.3.4.1.Hospitals and Clinics

13.6.3.4.2.Diagnostic Imaging Centers

13.6.3.4.3.Radiology Clinics

13.6.3.4.4.Others

13.6.4.Germany
13.6.4.1.Germany Radiology As A Service Market Revenue (US$ Mn) and Forecasts, By Services
13.6.4.1.1.Teleradiology

13.6.4.1.2.Remote scanning

13.6.4.1.3.Consulting

13.6.4.1.4.Others

13.6.4.2.Germany Radiology As A Service Market Revenue (US$ Mn) and Forecasts, By Type
13.6.4.2.1.Diagnostic radiology

13.6.4.2.2.Interventional radiology

13.6.4.2.3.Therapeutic radiology

13.6.4.3.Germany Radiology As A Service Market Revenue (US$ Mn) and Forecasts, By Modality
13.6.4.3.1.MRI

13.6.4.3.2.CT Scan

13.6.4.3.3.X-Ray

13.6.4.3.4.Ultrasound

13.6.4.3.5.Mammography

13.6.4.3.6.PET-CT

13.6.4.3.7.Others

13.6.4.4.Germany Radiology As A Service Market Revenue (US$ Mn) and Forecasts, By End Users
13.6.4.4.1.Hospitals and Clinics

13.6.4.4.2.Diagnostic Imaging Centers

13.6.4.4.3.Radiology Clinics

13.6.4.4.4.Others

13.6.5.Italy
13.6.5.1.Italy Radiology As A Service Market Revenue (US$ Mn) and Forecasts, By Services
13.6.5.1.1.Teleradiology

13.6.5.1.2.Remote scanning

13.6.5.1.3.Consulting

13.6.5.1.4.Others

13.6.5.2.Italy Radiology As A Service Market Revenue (US$ Mn) and Forecasts, By Type
13.6.5.2.1.Diagnostic radiology

13.6.5.2.2.Interventional radiology

13.6.5.2.3.Therapeutic radiology

13.6.5.3.Italy Radiology As A Service Market Revenue (US$ Mn) and Forecasts, By Modality
13.6.5.3.1.MRI

13.6.5.3.2.CT Scan

13.6.5.3.3.X-Ray

13.6.5.3.4.Ultrasound

13.6.5.3.5.Mammography

13.6.5.3.6.PET-CT

13.6.5.3.7.Others

13.6.5.4.Italy Radiology As A Service Market Revenue (US$ Mn) and Forecasts, By End Users
13.6.5.4.1.Hospitals and Clinics

13.6.5.4.2.Diagnostic Imaging Centers

13.6.5.4.3.Radiology Clinics

13.6.5.4.4.Others

13.6.6.Nordic Countries
13.6.6.1.Nordic Countries Radiology As A Service Market Revenue (US$ Mn) and Forecasts, By Services
13.6.6.1.1.Teleradiology

13.6.6.1.2.Remote scanning

13.6.6.1.3.Consulting

13.6.6.1.4.Others

13.6.6.2.Nordic Countries Radiology As A Service Market Revenue (US$ Mn) and Forecasts, By Type
13.6.6.2.1.Diagnostic radiology

13.6.6.2.2.Interventional radiology

13.6.6.2.3.Therapeutic radiology

13.6.6.3.Nordic Countries Radiology As A Service Market Revenue (US$ Mn) and Forecasts, By Modality
13.6.6.3.1.MRI

13.6.6.3.2.CT Scan

13.6.6.3.3.X-Ray

13.6.6.3.4.Ultrasound

13.6.6.3.5.Mammography

13.6.6.3.6.PET-CT

13.6.6.3.7.Others

13.6.6.4.Nordic Countries Radiology As A Service Market Revenue (US$ Mn) and Forecasts, By End Users
13.6.6.4.1.Hospitals and Clinics

13.6.6.4.2.Diagnostic Imaging Centers

13.6.6.4.3.Radiology Clinics

13.6.6.4.4.Others

13.6.6.5.Nordic Countries Radiology As A Service Market Revenue (US$ Mn) and Forecasts, By Country
13.6.6.5.1.Denmark

13.6.6.5.2.Finland

13.6.6.5.3.Iceland

13.6.6.5.4.Sweden

13.6.6.5.5.Norway

13.6.7.Benelux Union
13.6.7.1.Benelux Union Radiology As A Service Market Revenue (US$ Mn) and Forecasts, By Services
13.6.7.1.1.Teleradiology

13.6.7.1.2.Remote scanning

13.6.7.1.3.Consulting

13.6.7.1.4.Others

13.6.7.2.Benelux Union Radiology As A Service Market Revenue (US$ Mn) and Forecasts, By Type
13.6.7.2.1.Diagnostic radiology

13.6.7.2.2.Interventional radiology

13.6.7.2.3.Therapeutic radiology

13.6.7.3.Benelux Union Radiology As A Service Market Revenue (US$ Mn) and Forecasts, By Modality
13.6.7.3.1.MRI

13.6.7.3.2.CT Scan

13.6.7.3.3.X-Ray

13.6.7.3.4.Ultrasound

13.6.7.3.5.Mammography

13.6.7.3.6.PET-CT

13.6.7.3.7.Others

13.6.7.4.Benelux Union Radiology As A Service Market Revenue (US$ Mn) and Forecasts, By End Users
13.6.7.4.1.Hospitals and Clinics

13.6.7.4.2.Diagnostic Imaging Centers

13.6.7.4.3.Radiology Clinics

13.6.7.4.4.Others

13.6.7.5.Benelux Union Radiology As A Service Market Revenue (US$ Mn) and Forecasts, By Country
13.6.7.5.1.Belgium

13.6.7.5.2.The Netherlands

13.6.7.5.3.Luxembourg

13.6.8.Rest of Europe
13.6.8.1.Rest of Europe Radiology As A Service Market Revenue (US$ Mn) and Forecasts, By Services
13.6.8.1.1.Teleradiology

13.6.8.1.2.Remote scanning

13.6.8.1.3.Consulting

13.6.8.1.4.Others

13.6.8.2.Rest of Europe Radiology As A Service Market Revenue (US$ Mn) and Forecasts, By Type
13.6.8.2.1.Diagnostic radiology

13.6.8.2.2.Interventional radiology

13.6.8.2.3.Therapeutic radiology

13.6.8.3.Rest of Europe Radiology As A Service Market Revenue (US$ Mn) and Forecasts, By Modality
13.6.8.3.1.MRI

13.6.8.3.2.CT Scan

13.6.8.3.3.X-Ray

13.6.8.3.4.Ultrasound

13.6.8.3.5.Mammography

13.6.8.3.6.PET-CT

13.6.8.3.7.Others

13.6.8.4.Rest of Europe Radiology As A Service Market Revenue (US$ Mn) and Forecasts, By End Users
13.6.8.4.1.Hospitals and Clinics

13.6.8.4.2.Diagnostic Imaging Centers

13.6.8.4.3.Radiology Clinics

13.6.8.4.4.Others

13.7.Key Segment for Channeling Investments
13.7.1.By Country

13.7.2.By Services

13.7.3.By Type

13.7.4.By Modality

13.7.5.By End Users

14.Asia Pacific Radiology As A Service Market Analysis and Forecasts, 2024 – 2034
14.1.Overview
14.1.1.Asia Pacific Radiology As A Service Market Revenue (US$ Mn)

14.2.Asia Pacific Radiology As A Service Market Revenue (US$ Mn) and Forecasts, By Services
14.2.1.Teleradiology

14.2.2.Remote scanning

14.2.3.Consulting

14.2.4.Others

14.3.Asia Pacific Radiology As A Service Market Revenue (US$ Mn) and Forecasts, By Type
14.3.1.Diagnostic radiology

14.3.2.Interventional radiology

14.3.3.Therapeutic radiology

14.4.Asia Pacific Radiology As A Service Market Revenue (US$ Mn) and Forecasts, By Modality
14.4.1.MRI

14.4.2.CT Scan

14.4.3.X-Ray

14.4.4.Ultrasound

14.4.5.Mammography

14.4.6.PET-CT

14.4.7.Others

14.5.Asia Pacific Radiology As A Service Market Revenue (US$ Mn) and Forecasts, By End Users
14.5.1.Hospitals and Clinics

14.5.2.Diagnostic Imaging Centers

14.5.3.Radiology Clinics

14.5.4.Others

14.6.Asia Pacific Radiology As A Service Market Revenue (US$ Mn) and Forecasts, By Country
14.6.1.China
14.6.1.1.China Radiology As A Service Market Revenue (US$ Mn) and Forecasts, By Services
14.6.1.1.1.Teleradiology

14.6.1.1.2.Remote scanning

14.6.1.1.3.Consulting

14.6.1.1.4.Others

14.6.1.2.China Radiology As A Service Market Revenue (US$ Mn) and Forecasts, By Type
14.6.1.2.1.Diagnostic radiology

14.6.1.2.2.Interventional radiology

14.6.1.2.3.Therapeutic radiology

14.6.1.3.China Radiology As A Service Market Revenue (US$ Mn) and Forecasts, By Modality
14.6.1.3.1.MRI

14.6.1.3.2.CT Scan

14.6.1.3.3.X-Ray

14.6.1.3.4.Ultrasound

14.6.1.3.5.Mammography

14.6.1.3.6.PET-CT

14.6.1.3.7.Others

14.6.1.4.China Radiology As A Service Market Revenue (US$ Mn) and Forecasts, By End Users
14.6.1.4.1.Hospitals and Clinics

14.6.1.4.2.Diagnostic Imaging Centers

14.6.1.4.3.Radiology Clinics

14.6.1.4.4.Others

14.6.2.Japan
14.6.2.1.Japan Radiology As A Service Market Revenue (US$ Mn) and Forecasts, By Services
14.6.2.1.1.Teleradiology

14.6.2.1.2.Remote scanning

14.6.2.1.3.Consulting

14.6.2.1.4.Others

14.6.2.2.Japan Radiology As A Service Market Revenue (US$ Mn) and Forecasts, By Type
14.6.2.2.1.Diagnostic radiology

14.6.2.2.2.Interventional radiology

14.6.2.2.3.Therapeutic radiology

14.6.2.3.Japan Radiology As A Service Market Revenue (US$ Mn) and Forecasts, By Modality
14.6.2.3.1.MRI

14.6.2.3.2.CT Scan

14.6.2.3.3.X-Ray

14.6.2.3.4.Ultrasound

14.6.2.3.5.Mammography

14.6.2.3.6.PET-CT

14.6.2.3.7.Others

14.6.2.4.Japan Radiology As A Service Market Revenue (US$ Mn) and Forecasts, By End Users
14.6.2.4.1.Hospitals and Clinics

14.6.2.4.2.Diagnostic Imaging Centers

14.6.2.4.3.Radiology Clinics

14.6.2.4.4.Others

14.6.3.India
14.6.3.1.India Radiology As A Service Market Revenue (US$ Mn) and Forecasts, By Services
14.6.3.1.1.Teleradiology

14.6.3.1.2.Remote scanning

14.6.3.1.3.Consulting

14.6.3.1.4.Others

14.6.3.2.India Radiology As A Service Market Revenue (US$ Mn) and Forecasts, By Type
14.6.3.2.1.Diagnostic radiology

14.6.3.2.2.Interventional radiology

14.6.3.2.3.Therapeutic radiology

14.6.3.3.India Radiology As A Service Market Revenue (US$ Mn) and Forecasts, By Modality
14.6.3.3.1.MRI

14.6.3.3.2.CT Scan

14.6.3.3.3.X-Ray

14.6.3.3.4.Ultrasound

14.6.3.3.5.Mammography

14.6.3.3.6.PET-CT

14.6.3.3.7.Others

14.6.3.4.India Radiology As A Service Market Revenue (US$ Mn) and Forecasts, By End Users
14.6.3.4.1.Hospitals and Clinics

14.6.3.4.2.Diagnostic Imaging Centers

14.6.3.4.3.Radiology Clinics

14.6.3.4.4.Others

14.6.4.New Zealand
14.6.4.1.New Zealand Radiology As A Service Market Revenue (US$ Mn) and Forecasts, By Services
14.6.4.1.1.Teleradiology

14.6.4.1.2.Remote scanning

14.6.4.1.3.Consulting

14.6.4.1.4.Others

14.6.4.2.New Zealand Radiology As A Service Market Revenue (US$ Mn) and Forecasts, By Type
14.6.4.2.1.Diagnostic radiology

14.6.4.2.2.Interventional radiology

14.6.4.2.3.Therapeutic radiology

14.6.4.3.New Zealand Radiology As A Service Market Revenue (US$ Mn) and Forecasts, By Modality
14.6.4.3.1.MRI

14.6.4.3.2.CT Scan

14.6.4.3.3.X-Ray

14.6.4.3.4.Ultrasound

14.6.4.3.5.Mammography

14.6.4.3.6.PET-CT

14.6.4.3.7.Others

14.6.4.4.New Zealand Radiology As A Service Market Revenue (US$ Mn) and Forecasts, By End Users
14.6.4.4.1.Hospitals and Clinics

14.6.4.4.2.Diagnostic Imaging Centers

14.6.4.4.3.Radiology Clinics

14.6.4.4.4.Others

14.6.5.Australia
14.6.5.1.Australia Radiology As A Service Market Revenue (US$ Mn) and Forecasts, By Services
14.6.5.1.1.Teleradiology

14.6.5.1.2.Remote scanning

14.6.5.1.3.Consulting

14.6.5.1.4.Others

14.6.5.2.Australia Radiology As A Service Market Revenue (US$ Mn) and Forecasts, By Type
14.6.5.2.1.Diagnostic radiology

14.6.5.2.2.Interventional radiology

14.6.5.2.3.Therapeutic radiology

14.6.5.3.Australia Radiology As A Service Market Revenue (US$ Mn) and Forecasts, By Modality
14.6.5.3.1.MRI

14.6.5.3.2.CT Scan

14.6.5.3.3.X-Ray

14.6.5.3.4.Ultrasound

14.6.5.3.5.Mammography

14.6.5.3.6.PET-CT

14.6.5.3.7.Others

14.6.5.4.Australia Radiology As A Service Market Revenue (US$ Mn) and Forecasts, By End Users
14.6.5.4.1.Hospitals and Clinics

14.6.5.4.2.Diagnostic Imaging Centers

14.6.5.4.3.Radiology Clinics

14.6.5.4.4.Others

14.6.6.South Korea
14.6.6.1.South Korea Radiology As A Service Market Revenue (US$ Mn) and Forecasts, By Services
14.6.6.1.1.Teleradiology

14.6.6.1.2.Remote scanning

14.6.6.1.3.Consulting

14.6.6.1.4.Others

14.6.6.2.South Korea Radiology As A Service Market Revenue (US$ Mn) and Forecasts, By Type
14.6.6.2.1.Diagnostic radiology

14.6.6.2.2.Interventional radiology

14.6.6.2.3.Therapeutic radiology

14.6.6.3.South Korea Radiology As A Service Market Revenue (US$ Mn) and Forecasts, By Modality
14.6.6.3.1.MRI

14.6.6.3.2.CT Scan

14.6.6.3.3.X-Ray

14.6.6.3.4.Ultrasound

14.6.6.3.5.Mammography

14.6.6.3.6.PET-CT

14.6.6.3.7.Others

14.6.6.4.South Korea Radiology As A Service Market Revenue (US$ Mn) and Forecasts, By End Users
14.6.6.4.1.Hospitals and Clinics

14.6.6.4.2.Diagnostic Imaging Centers

14.6.6.4.3.Radiology Clinics

14.6.6.4.4.Others

14.6.7.Southeast Asia
14.6.7.1.Southeast Asia Radiology As A Service Market Revenue (US$ Mn) and Forecasts, By Services
14.6.7.1.1.Teleradiology

14.6.7.1.2.Remote scanning

14.6.7.1.3.Consulting

14.6.7.1.4.Others

14.6.7.2.Southeast Asia Radiology As A Service Market Revenue (US$ Mn) and Forecasts, By Type
14.6.7.2.1.Diagnostic radiology

14.6.7.2.2.Interventional radiology

14.6.7.2.3.Therapeutic radiology

14.6.7.3.Southeast Asia Radiology As A Service Market Revenue (US$ Mn) and Forecasts, By Modality
14.6.7.3.1.MRI

14.6.7.3.2.CT Scan

14.6.7.3.3.X-Ray

14.6.7.3.4.Ultrasound

14.6.7.3.5.Mammography

14.6.7.3.6.PET-CT

14.6.7.3.7.Others

14.6.7.4.Southeast Asia Radiology As A Service Market Revenue (US$ Mn) and Forecasts, By End Users
14.6.7.4.1.Hospitals and Clinics

14.6.7.4.2.Diagnostic Imaging Centers

14.6.7.4.3.Radiology Clinics

14.6.7.4.4.Others

14.6.7.5.Southeast Asia Radiology As A Service Market Revenue (US$ Mn) and Forecasts, By Country
14.6.7.5.1.Indonesia

14.6.7.5.2.Thailand

14.6.7.5.3.Malaysia

14.6.7.5.4.Singapore

14.6.7.5.5.Rest of Southeast Asia

14.6.8.Rest of Asia Pacific
14.6.8.1.Rest of Asia Pacific Radiology As A Service Market Revenue (US$ Mn) and Forecasts, By Services
14.6.8.1.1.Teleradiology

14.6.8.1.2.Remote scanning

14.6.8.1.3.Consulting

14.6.8.1.4.Others

14.6.8.2.Rest of Asia Pacific Radiology As A Service Market Revenue (US$ Mn) and Forecasts, By Type
14.6.8.2.1.Diagnostic radiology

14.6.8.2.2.Interventional radiology

14.6.8.2.3.Therapeutic radiology

14.6.8.3.Rest of Asia Pacific Radiology As A Service Market Revenue (US$ Mn) and Forecasts, By Modality
14.6.8.3.1.MRI

14.6.8.3.2.CT Scan

14.6.8.3.3.X-Ray

14.6.8.3.4.Ultrasound

14.6.8.3.5.Mammography

14.6.8.3.6.PET-CT

14.6.8.3.7.Others

14.6.8.4.Rest of Asia Pacific Radiology As A Service Market Revenue (US$ Mn) and Forecasts, By End Users
14.6.8.4.1.Hospitals and Clinics

14.6.8.4.2.Diagnostic Imaging Centers

14.6.8.4.3.Radiology Clinics

14.6.8.4.4.Others

14.7.Key Segment for Channeling Investments
14.7.1.By Country

14.7.2.By Services

14.7.3.By Type

14.7.4.By Modality

14.7.5.By End Users

15.Middle East and Africa Radiology As A Service Market Analysis and Forecasts, 2024 – 2034
15.1.Overview
15.1.1.Middle East and Africa Radiology As A Service Market Revenue (US$ Mn)

15.2.Middle East and Africa Radiology As A Service Market Revenue (US$ Mn) and Forecasts, By Services
15.2.1.Teleradiology

15.2.2.Remote scanning

15.2.3.Consulting

15.2.4.Others

15.3.Middle East and Africa Radiology As A Service Market Revenue (US$ Mn) and Forecasts, By Type
15.3.1.Diagnostic radiology

15.3.2.Interventional radiology

15.3.3.Therapeutic radiology

15.4.Middle East and Africa Radiology As A Service Market Revenue (US$ Mn) and Forecasts, By Modality
15.4.1.MRI

15.4.2.CT Scan

15.4.3.X-Ray

15.4.4.Ultrasound

15.4.5.Mammography

15.4.6.PET-CT

15.4.7.Others

15.5.Middle East and Africa Radiology As A Service Market Revenue (US$ Mn) and Forecasts, By End Users
15.5.1.Hospitals and Clinics

15.5.2.Diagnostic Imaging Centers

15.5.3.Radiology Clinics

15.5.4.Others

15.6.Middle East and Africa Radiology As A Service Market Revenue (US$ Mn) and Forecasts, By Country
15.6.1.Saudi Arabia
15.6.1.1.Saudi Arabia Radiology As A Service Market Revenue (US$ Mn) and Forecasts, By Services
15.6.1.1.1.Teleradiology

15.6.1.1.2.Remote scanning

15.6.1.1.3.Consulting

15.6.1.1.4.Others

15.6.1.2.Saudi Arabia Radiology As A Service Market Revenue (US$ Mn) and Forecasts, By Type
15.6.1.2.1.Diagnostic radiology

15.6.1.2.2.Interventional radiology

15.6.1.2.3.Therapeutic radiology

15.6.1.3.Saudi Arabia Radiology As A Service Market Revenue (US$ Mn) and Forecasts, By Modality
15.6.1.3.1.MRI

15.6.1.3.2.CT Scan

15.6.1.3.3.X-Ray

15.6.1.3.4.Ultrasound

15.6.1.3.5.Mammography

15.6.1.3.6.PET-CT

15.6.1.3.7.Others

15.6.1.4.Saudi Arabia Radiology As A Service Market Revenue (US$ Mn) and Forecasts, By End Users
15.6.1.4.1.Hospitals and Clinics

15.6.1.4.2.Diagnostic Imaging Centers

15.6.1.4.3.Radiology Clinics

15.6.1.4.4.Others

15.6.2.UAE
15.6.2.1.UAE Radiology As A Service Market Revenue (US$ Mn) and Forecasts, By Services
15.6.2.1.1.Teleradiology

15.6.2.1.2.Remote scanning

15.6.2.1.3.Consulting

15.6.2.1.4.Others

15.6.2.2.UAE Radiology As A Service Market Revenue (US$ Mn) and Forecasts, By Type
15.6.2.2.1.Diagnostic radiology

15.6.2.2.2.Interventional radiology

15.6.2.2.3.Therapeutic radiology

15.6.2.3.UAE Radiology As A Service Market Revenue (US$ Mn) and Forecasts, By Modality
15.6.2.3.1.MRI

15.6.2.3.2.CT Scan

15.6.2.3.3.X-Ray

15.6.2.3.4.Ultrasound

15.6.2.3.5.Mammography

15.6.2.3.6.PET-CT

15.6.2.3.7.Others

15.6.2.4.UAE Radiology As A Service Market Revenue (US$ Mn) and Forecasts, By End Users
15.6.2.4.1.Hospitals and Clinics

15.6.2.4.2.Diagnostic Imaging Centers

15.6.2.4.3.Radiology Clinics

15.6.2.4.4.Others

15.6.3.Egypt
15.6.3.1.Egypt Radiology As A Service Market Revenue (US$ Mn) and Forecasts, By Services
15.6.3.1.1.Teleradiology

15.6.3.1.2.Remote scanning

15.6.3.1.3.Consulting

15.6.3.1.4.Others

15.6.3.2.Egypt Radiology As A Service Market Revenue (US$ Mn) and Forecasts, By Type
15.6.3.2.1.Diagnostic radiology

15.6.3.2.2.Interventional radiology

15.6.3.2.3.Therapeutic radiology

15.6.3.3.Egypt Radiology As A Service Market Revenue (US$ Mn) and Forecasts, By Modality
15.6.3.3.1.MRI

15.6.3.3.2.CT Scan

15.6.3.3.3.X-Ray

15.6.3.3.4.Ultrasound

15.6.3.3.5.Mammography

15.6.3.3.6.PET-CT

15.6.3.3.7.Others

15.6.3.4.Egypt Radiology As A Service Market Revenue (US$ Mn) and Forecasts, By End Users
15.6.3.4.1.Hospitals and Clinics

15.6.3.4.2.Diagnostic Imaging Centers

15.6.3.4.3.Radiology Clinics

15.6.3.4.4.Others

15.6.4.Kuwait
15.6.4.1.Kuwait Radiology As A Service Market Revenue (US$ Mn) and Forecasts, By Services
15.6.4.1.1.Teleradiology

15.6.4.1.2.Remote scanning

15.6.4.1.3.Consulting

15.6.4.1.4.Others

15.6.4.2.Kuwait Radiology As A Service Market Revenue (US$ Mn) and Forecasts, By Type
15.6.4.2.1.Diagnostic radiology

15.6.4.2.2.Interventional radiology

15.6.4.2.3.Therapeutic radiology

15.6.4.3.Kuwait Radiology As A Service Market Revenue (US$ Mn) and Forecasts, By Modality
15.6.4.3.1.MRI

15.6.4.3.2.CT Scan

15.6.4.3.3.X-Ray

15.6.4.3.4.Ultrasound

15.6.4.3.5.Mammography

15.6.4.3.6.PET-CT

15.6.4.3.7.Others

15.6.4.4.Kuwait Radiology As A Service Market Revenue (US$ Mn) and Forecasts, By End Users
15.6.4.4.1.Hospitals and Clinics

15.6.4.4.2.Diagnostic Imaging Centers

15.6.4.4.3.Radiology Clinics

15.6.4.4.4.Others

15.6.5.South Africa
15.6.5.1.South Africa Radiology As A Service Market Revenue (US$ Mn) and Forecasts, By Services
15.6.5.1.1.Teleradiology

15.6.5.1.2.Remote scanning

15.6.5.1.3.Consulting

15.6.5.1.4.Others

15.6.5.2.South Africa Radiology As A Service Market Revenue (US$ Mn) and Forecasts, By Type
15.6.5.2.1.Diagnostic radiology

15.6.5.2.2.Interventional radiology

15.6.5.2.3.Therapeutic radiology

15.6.5.3.South Africa Radiology As A Service Market Revenue (US$ Mn) and Forecasts, By Modality
15.6.5.3.1.MRI

15.6.5.3.2.CT Scan

15.6.5.3.3.X-Ray

15.6.5.3.4.Ultrasound

15.6.5.3.5.Mammography

15.6.5.3.6.PET-CT

15.6.5.3.7.Others

15.6.5.4.South Africa Radiology As A Service Market Revenue (US$ Mn) and Forecasts, By End Users
15.6.5.4.1.Hospitals and Clinics

15.6.5.4.2.Diagnostic Imaging Centers

15.6.5.4.3.Radiology Clinics

15.6.5.4.4.Others

15.6.6.Rest of Middle East & Africa
15.6.6.1.Rest of Middle East & Africa Radiology As A Service Market Revenue (US$ Mn) and Forecasts, By Services
15.6.6.1.1.Teleradiology

15.6.6.1.2.Remote scanning

15.6.6.1.3.Consulting

15.6.6.1.4.Others

15.6.6.2.Rest of Middle East & Africa Radiology As A Service Market Revenue (US$ Mn) and Forecasts, By Type
15.6.6.2.1.Diagnostic radiology

15.6.6.2.2.Interventional radiology

15.6.6.2.3.Therapeutic radiology

15.6.6.3.Rest of Middle East & Africa Radiology As A Service Market Revenue (US$ Mn) and Forecasts, By Modality
15.6.6.3.1.MRI

15.6.6.3.2.CT Scan

15.6.6.3.3.X-Ray

15.6.6.3.4.Ultrasound

15.6.6.3.5.Mammography

15.6.6.3.6.PET-CT

15.6.6.3.7.Others

15.6.6.4.Rest of Middle East & Africa Radiology As A Service Market Revenue (US$ Mn) and Forecasts, By End Users
15.6.6.4.1.Hospitals and Clinics

15.6.6.4.2.Diagnostic Imaging Centers

15.6.6.4.3.Radiology Clinics

15.6.6.4.4.Others

15.7.Key Segment for Channeling Investments
15.7.1.By Country

15.7.2.By Services

15.7.3.By Type

15.7.4.By Modality

15.7.5.By End Users

16.Latin America Radiology As A Service Market Analysis and Forecasts, 2024 – 2034
16.1.Overview
16.1.1.Latin America Radiology As A Service Market Revenue (US$ Mn)

16.2.Latin America Radiology As A Service Market Revenue (US$ Mn) and Forecasts, By Services
16.2.1.Teleradiology

16.2.2.Remote scanning

16.2.3.Consulting

16.2.4.Others

16.3.Latin America Radiology As A Service Market Revenue (US$ Mn) and Forecasts, By Type
16.3.1.Diagnostic radiology

16.3.2.Interventional radiology

16.3.3.Therapeutic radiology

16.4.Latin America Radiology As A Service Market Revenue (US$ Mn) and Forecasts, By Modality
16.4.1.MRI

16.4.2.CT Scan

16.4.3.X-Ray

16.4.4.Ultrasound

16.4.5.Mammography

16.4.6.PET-CT

16.4.7.Others

16.5.Latin America Radiology As A Service Market Revenue (US$ Mn) and Forecasts, By End Users
16.5.1.Hospitals and Clinics

16.5.2.Diagnostic Imaging Centers

16.5.3.Radiology Clinics

16.5.4.Others

16.6.Latin America Radiology As A Service Market Revenue (US$ Mn) and Forecasts, By Country
16.6.1.Brazil
16.6.1.1.Brazil Radiology As A Service Market Revenue (US$ Mn) and Forecasts, By Services
16.6.1.1.1.Teleradiology

16.6.1.1.2.Remote scanning

16.6.1.1.3.Consulting

16.6.1.1.4.Others

16.6.1.2.Brazil Radiology As A Service Market Revenue (US$ Mn) and Forecasts, By Type
16.6.1.2.1.Diagnostic radiology

16.6.1.2.2.Interventional radiology

16.6.1.2.3.Therapeutic radiology

16.6.1.3.Brazil Radiology As A Service Market Revenue (US$ Mn) and Forecasts, By Modality
16.6.1.3.1.MRI

16.6.1.3.2.CT Scan

16.6.1.3.3.X-Ray

16.6.1.3.4.Ultrasound

16.6.1.3.5.Mammography

16.6.1.3.6.PET-CT

16.6.1.3.7.Others

16.6.1.4.Brazil Radiology As A Service Market Revenue (US$ Mn) and Forecasts, By End Users
16.6.1.4.1.Hospitals and Clinics

16.6.1.4.2.Diagnostic Imaging Centers

16.6.1.4.3.Radiology Clinics

16.6.1.4.4.Others

16.6.2.Argentina
16.6.2.1.Argentina Radiology As A Service Market Revenue (US$ Mn) and Forecasts, By Services
16.6.2.1.1.Teleradiology

16.6.2.1.2.Remote scanning

16.6.2.1.3.Consulting

16.6.2.1.4.Others

16.6.2.2.Argentina Radiology As A Service Market Revenue (US$ Mn) and Forecasts, By Type
16.6.2.2.1.Diagnostic radiology

16.6.2.2.2.Interventional radiology

16.6.2.2.3.Therapeutic radiology

16.6.2.3.Argentina Radiology As A Service Market Revenue (US$ Mn) and Forecasts, By Modality
16.6.2.3.1.MRI

16.6.2.3.2.CT Scan

16.6.2.3.3.X-Ray

16.6.2.3.4.Ultrasound

16.6.2.3.5.Mammography

16.6.2.3.6.PET-CT

16.6.2.3.7.Others

16.6.2.4.Argentina Radiology As A Service Market Revenue (US$ Mn) and Forecasts, By End Users
16.6.2.4.1.Hospitals and Clinics

16.6.2.4.2.Diagnostic Imaging Centers

16.6.2.4.3.Radiology Clinics

16.6.2.4.4.Others

16.6.3.Rest of Latin America
16.6.3.1.Rest of Latin America Radiology As A Service Market Revenue (US$ Mn) and Forecasts, By Services
16.6.3.1.1.Teleradiology

16.6.3.1.2.Remote scanning

16.6.3.1.3.Consulting

16.6.3.1.4.Others

16.6.3.2.Rest of Latin America Radiology As A Service Market Revenue (US$ Mn) and Forecasts, By Type
16.6.3.2.1.Diagnostic radiology

16.6.3.2.2.Interventional radiology

16.6.3.2.3.Therapeutic radiology

16.6.3.3.Rest of Latin America Radiology As A Service Market Revenue (US$ Mn) and Forecasts, By Modality
16.6.3.3.1.MRI

16.6.3.3.2.CT Scan

16.6.3.3.3.X-Ray

16.6.3.3.4.Ultrasound

16.6.3.3.5.Mammography

16.6.3.3.6.PET-CT

16.6.3.3.7.Others

16.6.3.4.Rest of Latin America Radiology As A Service Market Revenue (US$ Mn) and Forecasts, By End Users
16.6.3.4.1.Hospitals and Clinics

16.6.3.4.2.Diagnostic Imaging Centers

16.6.3.4.3.Radiology Clinics

16.6.3.4.4.Others

16.7.Key Segment for Channeling Investments
16.7.1.By Country

16.7.2.By Services

16.7.3.By Type

16.7.4.By Modality

16.7.5.By End Users

17.Competitive Benchmarking
17.1.Brand Benchmarking

17.2.Market Share Analysis, 2023

17.3.Global Presence and Growth Strategies
17.3.1.Mergers and Acquisitions

17.3.2.Product Launches

17.3.3.Investments Trends

17.3.4.R&D Initiatives

18.Player Profiles
18.1.Aster Medical Imaging LLC.
18.1.1.Company Details

18.1.2.Company Overview

18.1.3.Product Offerings

18.1.4.Key Developments

18.1.5.Financial Analysis

18.1.6.SWOT Analysis

18.1.7.Business Strategies

18.2.Change Healthcare
18.2.1.Company Details

18.2.2.Company Overview

18.2.3.Product Offerings

18.2.4.Key Developments

18.2.5.Financial Analysis

18.2.6.SWOT Analysis

18.2.7.Business Strategies

18.3.DeepTek.ai, Inc.
18.3.1.Company Details

18.3.2.Company Overview

18.3.3.Product Offerings

18.3.4.Key Developments

18.3.5.Financial Analysis

18.3.6.SWOT Analysis

18.3.7.Business Strategies

18.4.Enlitic, Inc.
18.4.1.Company Details

18.4.2.Company Overview

18.4.3.Product Offerings

18.4.4.Key Developments

18.4.5.Financial Analysis

18.4.6.SWOT Analysis

18.4.7.Business Strategies

18.5.Everlight Radiology
18.5.1.Company Details

18.5.2.Company Overview

18.5.3.Product Offerings

18.5.4.Key Developments

18.5.5.Financial Analysis

18.5.6.SWOT Analysis

18.5.7.Business Strategies

18.6.Emergence Teleradiology
18.6.1.Company Details

18.6.2.Company Overview

18.6.3.Product Offerings

18.6.4.Key Developments

18.6.5.Financial Analysis

18.6.6.SWOT Analysis

18.6.7.Business Strategies

18.7.GE HealthCare
18.7.1.Company Details

18.7.2.Company Overview

18.7.3.Product Offerings

18.7.4.Key Developments

18.7.5.Financial Analysis

18.7.6.SWOT Analysis

18.7.7.Business Strategies

18.8.Koninklijke Philips N.V.
18.8.1.Company Details

18.8.2.Company Overview

18.8.3.Product Offerings

18.8.4.Key Developments

18.8.5.Financial Analysis

18.8.6.SWOT Analysis

18.8.7.Business Strategies

18.9.Medica Group PLC
18.9.1.Company Details

18.9.2.Company Overview

18.9.3.Product Offerings

18.9.4.Key Developments

18.9.5.Financial Analysis

18.9.6.SWOT Analysis

18.9.7.Business Strategies

18.10.ONRAD, Inc.
18.10.1.Company Details

18.10.2.Company Overview

18.10.3.Product Offerings

18.10.4.Key Developments

18.10.5.Financial Analysis

18.10.6.SWOT Analysis

18.10.7.Business Strategies

18.11.RamSoft, Inc.
18.11.1.Company Details

18.11.2.Company Overview

18.11.3.Product Offerings

18.11.4.Key Developments

18.11.5.Financial Analysis

18.11.6.SWOT Analysis

18.11.7.Business Strategies

18.12. Real Rads
18.12.1.Company Details

18.12.2.Company Overview

18.12.3.Product Offerings

18.12.4.Key Developments

18.12.5.Financial Analysis

18.12.6.SWOT Analysis

18.12.7.Business Strategies

18.13.TRG
18.13.1.Company Details

18.13.2.Company Overview

18.13.3.Product Offerings

18.13.4.Key Developments

18.13.5.Financial Analysis

18.13.6.SWOT Analysis

18.13.7.Business Strategies

18.14.Vesta Teleradiology
18.14.1.Company Details

18.14.2.Company Overview

18.14.3.Product Offerings

18.14.4.Key Developments

18.14.5.Financial Analysis

18.14.6.SWOT Analysis

18.14.7.Business Strategies

18.15.Other Market Participants

19.Key Findings

.

Note: This ToC is tentative and can be changed according to the research study conducted during the course of report completion.

**Exclusive for Multi-User and Enterprise User.

.

Global Radiology as a Service Market:

By Service Type

  • Teleradiology
    • Routine Reporting
    • Nighthawk Services
    • Preliminary Reads Services
    • Emergency Reporting
    • Final Reads Services
  • Consulting Services
  • Remote Scanning Services
  • Billing Services
  • Others

By Business Model

  • Subscription-based
  • Pay-per-Use

By Modality

  • X-ray
  • CT
  • MRI
  • Ultrasound
  • PET Scan
  • Nuclear Medicine
  • Mammography
  • Others

By End User

  • Hospitals and Clinics
  • Diagnostic Imaging Centers
  • Research and Academic Institutions
  • Others

By Region

  • North America (U.S., Canada, Mexico, Rest of North America)
  • Europe (France, The UK, Spain, Germany, Italy, Nordic Countries (Denmark, Finland, Iceland, Sweden, Norway), Benelux Union (Belgium, The Netherlands, Luxembourg), Rest of Europe
  • Asia Pacific (China, Japan, India, New Zealand, Australia, South Korea, Southeast Asia (Indonesia, Thailand, Malaysia, Singapore, Rest of Southeast Asia), Rest of Asia Pacific
  • Middle East & Africa (Saudi Arabia, UAE, Egypt, Kuwait, South Africa, Rest of Middle East & Africa)
  • Latin America (Brazil, Argentina, Rest of Latin America

The Niche Research approach encompasses both primary and secondary research methods to provide comprehensive insights. While primary research is the cornerstone of our studies, we also incorporate secondary research sources such as company annual reports, premium industry databases, press releases, industry journals, and white papers.

Within our primary research, we actively engage with various industry stakeholders, conducting paid interviews and surveys. Our meticulous analysis extends to every market participant in major countries, allowing us to thoroughly examine their portfolios, calculate market shares, and segment revenues.

Our data collection primarily focuses on individual countries within our research scope, enabling us to estimate regional market sizes. Typically, we employ a bottom-up approach, meticulously tracking trends in different countries. We analyze growth drivers, constraints, technological innovations, and opportunities for each country, ultimately arriving at regional figures.Our process begins by examining the growth prospects of each country. Building upon these insights, we project growth and trends for the entire region. Finally, we utilize our proprietary model to refine estimations and forecasts.

Our data validation standards are integral to ensuring the reliability and accuracy of our research findings. Here’s a breakdown of our data validation processes and the stakeholders we engage with during our primary research:

  • Supply Side Analysis: We initiate a supply side analysis by directly contacting market participants, through telephonic interviews and questionnaires containing both open-ended and close-ended questions. We gather information on their portfolios, segment revenues, developments, and growth strategies.
  • Demand Side Analysis: To gain insights into adoption trends and consumer preferences, we reach out to target customers and users (non-vendors). This information forms a vital part of the qualitative analysis section of our reports, covering market dynamics, adoption trends, consumer behavior, spending patterns, and other related aspects.
  • Consultant Insights: We tap into the expertise of our partner consultants from around the world to obtain their unique viewpoints and perspectives. Their insights contribute to a well-rounded understanding of the markets under investigation.
  • In-House Validation: To ensure data accuracy and reliability, we conduct cross-validation of data points and information through our in-house team of consultants and utilize advanced data modeling tools for thorough verification.

The forecasts we provide are based on a comprehensive assessment of various factors, including:

  • Market Trends and Past Performance (Last Five Years): We accurately analyze market trends and performance data from preceding five years to identify historical patterns and understand the market’s evolution.
  • Historical Performance and Growth of Market Participants: We assess the historical performance and growth trajectories of key market participants. This analysis provides insights into the competitive landscape and individual company strategies.
  • Market Determinants Impact Analysis (Next Eight Years): We conduct a rigorous analysis of the factors that are projected to influence the market over the next eight years. This includes assessing both internal and external determinants that can shape market dynamics.
  • Drivers and Challenges for the Forecast Period:Identify the factors expected to drive market growth during the forecast period, as well as the challenges that the industry may face. This analysis aids in deriving an accurate growth rate projection.
  • New Acquisitions, Collaborations, or Partnerships: We keep a close watch on any new acquisitions, collaborations, or partnerships within the industry. These developments can have a significant impact on market dynamics and competitiveness.
  • Macro and Micro Factors Analysis:A thorough examination of both macro-level factors (e.g., economic trends, regulatory changes) and micro-level factors (e.g., technological advancements, consumer preferences) that may influence the market during the forecast period.
  • End-User Sentiment Analysis: To understand the market from the end-user perspective, we conduct sentiment analysis. This involves assessing the sentiment, preferences, and feedback of the end-users, which can provide valuable insights into market trends.
  • Perspective of Primary Participants: Insights gathered directly from primary research participants play a crucial role in shaping our forecasts. Their perspectives and experiences provide valuable qualitative data.
  • Year-on-Year Growth Trend: We utilize a year-on-year growth trend based on historical market growth and expected future trends. This helps in formulating our growth projections, aligning them with the market’s historical performance.

Research process adopted by TNR involves multiple stages, including data collection, validation, quality checks, and presentation. It’s crucial that the data and information we provide add value to your existing market understanding and expertise. We have also established partnerships with business consulting, research, and survey organizations across regions and globally to collaborate on regional analysis and data validation, ensuring the highest level of accuracy and reliability in our reports.


Procure Comprehensive Study of

Global Radiology as a Service Market

Online Only

  • Online Access
  • Read Only File
  • Validity 3 Months
  • Print, Copy, Paste & Download
  • PPT, Excel
  • Cost-Free Report in the Next Update
$3300
Buy Now

Single User

  • Access to One User on One System
  • Read Only File
  • Validity 6 Months
  • Limited Print,Copy, Paste
  • PPT, Excel
  • Cost-Free Report in the Next Update
$4200
Buy Now

Multi User

  • Access to Fiver Users
  • PDF File
  • Validity 1 Year
  • Upto FivePrints
  • Cost-Free Report in the Next Update
  • PPT, Excel
$6000
Buy Now

Enterprise User

  • Access to Unlimited Users
  • PDF, PPT, Excel
  • Unlimited Validity, Prints&Downloads
  • 1 Hour Cost-Free & Dedicated Analyst Support
  • 10% Cost-Free Customization
  • Cost-Free Report Update Twice in a Year
  • Recommendations for Business Strategies
  • Authorization to Quote TNR, The Niche Research
$7300
Buy Now

Library Access

  • Online Access to Content Publications
  • Access Player Profiles Online
  • Get Immediate Access to Newly Added Content
  • Acquire 12 PDF Downloads
  • Acquire 5 Excel Data Sets
  • Gain Access to 290+ PDFs of Company Profiles
  • Round-the-clock Email and Phone Assistance
  • Dashboard Usage and Trends
  • Renewal & Upgrade Assistance
  • Assessing Customization Options and Alerts for New Reports
$10788
Buy Now
*Taxes/Fees, if applicable will be added during checkout. All prices in USD

Why TNR The Niche Research?

  • Unwavering Commitment to Excellence

  • Veteran Team of Researchers

  • Accurate and Timely Insights

  • Ethical Practices and Customized Service

  • Uninterrupted Availability Around the Clock

Scroll to Top