Global Renewable Energy Market: By Type, By Application, By Region & Segmental Insights Trends and Forecast, 2024 – 2034

  • Industry: Energy & Power
  • Report ID: TNR-110-1126
  • Number of Pages: 420
  • Table/Charts : Yes
  • June, 2024
  • Base Year : 2024
  • No. of Companies : 10+
  • No. of Countries : 29
  • Views : 10048
  • Covid Impact Covered: Yes
  • War Impact Covered: Yes
  • Formats : PDF, Excel, PPT

Renewable energy is energy derived from natural resources that are replenished on a human timescale, such as sunlight, wind, rain, tides, waves, and geothermal heat. Unlike fossil fuels, which are finite and emit greenhouse gases when burned, renewable energy sources are sustainable and environmentally friendly. Technologies used to harness renewable energy include solar panels, wind turbines, hydroelectric dams, and geothermal plants. These energy sources play a crucial role in reducing carbon emissions, combating climate change, and ensuring energy security. By leveraging the continuous availability of natural processes, renewable energy provides a reliable and clean alternative to conventional energy sources, contributing to a sustainable and resilient energy future.

Governments worldwide are implementing supportive policies and incentives, such as tax credits, subsidies, and renewable energy mandates, to encourage the adoption of clean energy sources. Technological advancements have significantly improved the efficiency and cost-effectiveness of renewable energy systems, making them more competitive with traditional fossil fuels. Additionally, the growing desire for energy security and independence drives nations to diversify their energy portfolios, reducing reliance on imported fossil fuels. Corporate sustainability initiatives and commitments to reduce carbon footprints further fuel the demand for renewable energy. Moreover, the declining costs of solar panels, wind turbines, and energy storage solutions make renewable energy more accessible to a broader range of consumers and businesses. These factors collectively accelerate the shift towards renewable energy, underscoring its critical role in achieving a sustainable and resilient energy future. In terms of revenue, the global renewable energy market was worth US$ 1.24 Trillion in 2023, anticipated to witness CAGR of 17.8% during 2024 – 2034.

Global Renewable Energy Market Dynamics

Government Policies and Incentives: Government regulations, subsidies, and incentives promote the adoption of renewable energy sources, driving market growth. Policies like tax credits, feed-in tariffs, and renewable energy mandates support investment and development. Innovations in renewable energy technologies, such as more efficient solar panels, advanced wind turbines, and improved energy storage systems, make renewable energy more viable and cost-effective.

Environmental Concerns: Increasing awareness of climate change and environmental degradation drives demand for clean energy solutions, leading to greater investment in renewable energy projects. Diversifying energy sources to include renewables reduces dependence on fossil fuels, enhancing energy security and stability.

High Initial Costs: The upfront capital investment required for renewable energy infrastructure, such as solar panels and wind turbines, can be significant, posing a barrier to entry. The variable nature of renewable energy sources, such as solar and wind, can lead to challenges in ensuring a stable and continuous energy supply.

Emerging Markets: Developing countries present significant growth opportunities as they invest in renewable energy infrastructure to meet rising energy demands and support economic growth. Advances in energy storage technologies, such as batteries and supercapacitors, provide Increasing corporate commitments to sustainability and carbon neutrality drive private sector investment in renewable energy projects.

Supply Chain Disruptions: The renewable energy sector relies on a complex supply chain for materials and components. Disruptions, such as those caused by geopolitical tensions or pandemics, can impact production and deployment timelines. Renewable energy projects, particularly large-scale ones like wind farms and solar parks, require significant land and can impact local ecosystems and wildlife. Changes in government policies and regulations can create uncertainty, affecting long-term planning and investment in renewable energy projects.

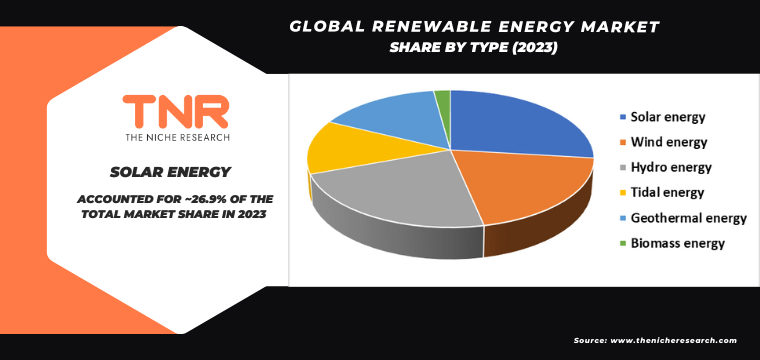
Solar Energy Segment Has Garnered Major Market Share in the Global Renewable Energy Market During the Forecast Period (2024 – 2034).

The growing adoption of solar energy is a major demand driver in the renewable energy sector. As countries worldwide strive to reduce carbon emissions and transition to sustainable energy sources, solar power emerges as a key solution due to its abundant availability and decreasing costs. Solar panels and related technologies require capacitors for efficient energy storage and management, ensuring stable power supply despite the intermittent nature of solar energy. Capacitors help in smoothing out voltage fluctuations and storing excess energy generated during peak sunlight hours for use during periods of low sunlight. Government incentives, subsidies, and favorable policies further accelerate the adoption of solar energy, driving demand for capacitors in solar power systems. Additionally, advancements in solar technology, such as improved photovoltaic cell efficiency and the integration of smart grid systems, increase the need for high-performance capacitors. As the global emphasis on clean energy continues to grow, the demand for capacitors in solar energy applications is expected to rise significantly, highlighting their critical role in the renewable energy landscape.

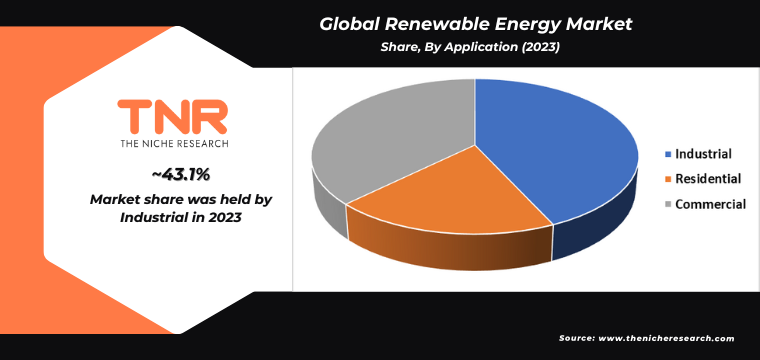
By Application Industrial Segment had the Highest Share in the Global Renewable Energy Market in 2023.

In the industrial sector, the push towards renewable energy adoption is a significant demand driver for capacitors. Industries are increasingly integrating renewable energy sources like solar and wind power to reduce their carbon footprint and enhance energy efficiency. Capacitors are vital in these systems for energy storage, power conditioning, and ensuring the stability of electrical networks. They help in managing fluctuations in power supply from renewable sources, providing a consistent and reliable energy output essential for industrial operations. Moreover, the transition to smart manufacturing and Industry 4.0 technologies emphasizes the need for stable and efficient power management solutions, further boosting capacitor demand. Government incentives and policies promoting renewable energy use in industries also play a crucial role in driving this demand. As industries strive to achieve sustainability goals and optimize energy usage, the need for advanced capacitors in renewable energy systems will continue to grow, underscoring their importance in industrial applications.

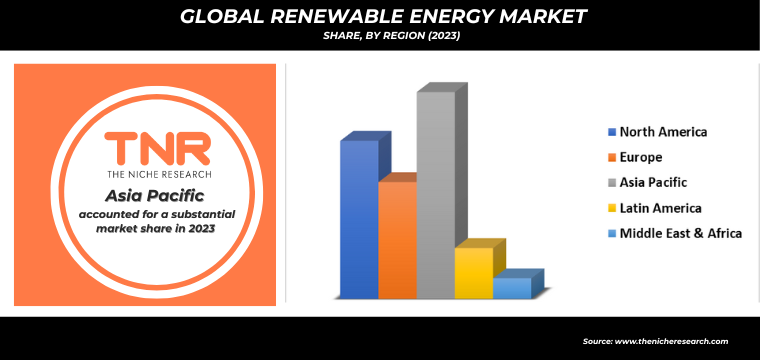
By Region, Asia Pacific Dominated the Global Renewable Energy Market in 2023.

In the Asia-Pacific region, the burgeoning renewable energy sector is a significant demand driver for capacitors. Countries like China, India, and Japan are heavily investing in renewable energy projects, including solar and wind power, to meet their growing energy needs and reduce carbon emissions. Capacitors are crucial components in these renewable energy systems for efficient energy storage and conversion. They help in smoothing out power fluctuations and ensuring stable and reliable energy supply from intermittent renewable sources. The region’s commitment to sustainability and the increasing implementation of smart grid technologies also drives the demand for advanced capacitors. Additionally, government initiatives and favorable policies supporting renewable energy adoption further bolster market growth. As the Asia-Pacific region continues to lead in renewable energy capacity expansion, the need for high-performance capacitors in energy storage and management systems will continue to rise, underpinning their crucial role in the renewable energy infrastructure.

Competitive Landscape: Global Renewable Energy Market:

  • ABB
  • ACCIONA
  • Enel Spa
  • ENGIE SA
  • General Electric Company
  • Innergex
  • LARSEN & TOUBRO LIMITED
  • Masdar
  • NextEra Energy, Inc.
  • Schneider Electric
  • Siemens Gamesa Renewable Energy, S.A.U.
  • Suzlon Energy Limited
  • Tata Power
  • Other Industry Participants

Global Renewable Energy Market Scope

Report Specifications Details
Market Revenue in 2023 US$ 1.24 Tn
Market Size Forecast by 2034 US$ 7.52 Tn
Growth Rate (CAGR) 17.8%
Historic Data 2016 – 2022
Base Year for Estimation 2023
Forecast Period 2024 – 2034
Report Inclusions Market Size & Estimates, Market Dynamics, Competitive Scenario, Trends, Growth Factors, Market Determinants, Key Investment Segmentation, Product/Service/Solutions Benchmarking
Segments Covered By Type, By Application, By Region
Regions Covered North America, Europe, Asia Pacific, Middle East & Africa, Latin America
Countries Covered U.S., Canada, Mexico, Rest of North America,  France, The UK, Spain, Germany, Italy, Nordic Countries (Denmark, Finland, Iceland, Sweden, Norway), Benelux Union (Belgium, The Netherlands, Luxembourg), Rest of Europe,  China, Japan, India, New Zealand, Australia, South Korea, Southeast Asia (Indonesia, Thailand, Malaysia, Singapore, Rest of Southeast Asia), Rest of Asia Pacific,  Saudi Arabia, UAE, Egypt, Kuwait, South Africa, Rest of Middle East & Africa,  Brazil, Argentina, Rest of Latin America
Key Players ABB, ACCIONA, Enel Spa, ENGIE SA, General Electric Company, Innergex, LARSEN & TOUBRO LIMITED, Masdar, NextEra Energy, Inc, Schneider Electric, Siemens Gamesa Renewable Energy, S.A.U., Suzlon Energy Limited, Tata Power
Customization Scope Customization allows for the inclusion/modification of content pertaining to geographical regions, countries, and specific market segments.
Pricing & Procurement Options Explore purchase options tailored to your specific research requirements
Contact Details Consult With Our Expert

Japan (Toll-Free):  +81 663-386-8111

South Korea (Toll-Free):  +82-808- 703-126

Saudi Arabia (Toll-Free):  +966 800-850-1643

United Kingdom: +44 753-710-5080

United States: +1 302-232-5106

E-mail:  askanexpert@thenicheresearch.com


 Global Renewable Energy Market

By Type

  • Solar energy
  • Wind energy
  • Hydro energy
  • Tidal energy
  • Geothermal energy
  • Biomass energy

By Application

  • Industrial
    • Food & Beverage industries
    • Aviation industry
    • Automotive industry
    • Others
  • Residential
  • Commercial
    • Hotels
    • Schools
    • Office Buildings
    • Others

By Region

  • North America (U.S., Canada, Mexico, Rest of North America)
  • Europe (France, The UK, Spain, Germany, Italy, Nordic Countries (Denmark, Finland, Iceland, Sweden, Norway), Benelux Union (Belgium, The Netherlands, Luxembourg), Rest of Europe)
  • Asia Pacific (China, Japan, India, New Zealand, Australia, South Korea, Southeast Asia (Indonesia, Thailand, Malaysia, Singapore, Rest of Southeast Asia), Rest of Asia Pacific)
  • Middle East & Africa (Saudi Arabia, UAE, Egypt, Kuwait, South Africa, Rest of Middle East & Africa)
  • Latin America (Brazil, Argentina, Rest of Latin America)

 Report Layout:


Table of Contents

.

1.Market Scope
1.1.Market Segmentation
1.2.Years Considered
1.2.1.Historic Years: 2016 – 2022
1.2.2.Base Year: 2023
1.2.3.Forecast Years: 2024 – 2034
2.Key Target Audiences
3.Research Methodology
3.1.Primary Research
3.1.1.Research Questionnaire
3.1.2.Global Percentage Breakdown
3.1.3.Primary Interviews: Key Opinion Leaders (KOLs)
3.2.Secondary Research
3.2.1.Paid Databases
3.2.2.Secondary Sources
3.3.Market Size Estimates
3.3.1.Top-Down Approach
3.3.2.Bottom-Up Approach
3.4.Data Triangulation Methodology
3.5.Research Assumptions
4.Recommendations and Insights from TNR’s Perspective**
5.Holistic Overview of Renewable Energy Market
6.Market Synopsis: Renewable Energy Market
7.Renewable Energy Market Analysis: Qualitative Perspective
7.1.Introduction
7.1.1.Product Definition
7.1.2.Industry Development
7.2.Market Dynamics
7.2.1.Drivers
7.2.2.Restraints
7.2.3.Opportunities
7.2.4.Challenges
7.3.Trends in Renewable Energy Market
7.4.Market Determinants Radar Chart
7.5.Macro-Economic and Micro-Economic Indicators: Renewable Energy Market
7.6.Industry Gross Margin Overview
7.7.Porter’s Five Force Analysis
7.8.Impact of Covid-19 on Renewable Energy Market
7.9.PESTEL Analysis
7.10.Value Chain Analysis
7.11.Pricing Analysis, By Region (2023)
7.11.1.North America
7.11.2.Europe
7.11.3.Asia Pacific
7.11.4.Middle East and Africa
7.11.5.Latin America
8.Global Renewable Energy Market Analysis and Forecasts, 2024 – 2034
8.1.Overview
8.1.1.Global Renewable Energy Market Revenue (US$ Mn)
8.2.Global Renewable Energy Market Revenue (US$ Mn) and Forecasts, By Type
8.2.1.Solar energy
8.2.1.1.Definition
8.2.1.2.Market Estimation and Penetration, 2016 – 2023
8.2.1.3.Market Forecast, 2024 – 2034
8.2.1.4.Compound Annual Growth Rate (CAGR)
8.2.1.5.Regional Bifurcation
8.2.1.5.1.North America
8.2.1.5.1.1.Market Estimation, 2016 – 2023
8.2.1.5.1.2.Market Forecast, 2024 – 2034
8.2.1.5.2.Europe
8.2.1.5.2.1.Market Estimation, 2016 – 2023
8.2.1.5.2.2.Market Forecast, 2024 – 2034
8.2.1.5.3.Asia Pacific
8.2.1.5.3.1.Market Estimation, 2016 – 2023
8.2.1.5.3.2.Market Forecast, 2024 – 2034
8.2.1.5.4.Middle East and Africa
8.2.1.5.4.1.Market Estimation, 2016 – 2023
8.2.1.5.4.2.Market Forecast, 2024 – 2034
8.2.1.5.5.Latin America
8.2.1.5.5.1.Market Estimation, 2016 – 2023
8.2.1.5.5.2.Market Forecast, 2024 – 2034
8.2.2.Wind energy
8.2.2.1.Definition
8.2.2.2.Market Estimation and Penetration, 2016 – 2023
8.2.2.3.Market Forecast, 2024 – 2034
8.2.2.4.Compound Annual Growth Rate (CAGR)
8.2.2.5.Regional Bifurcation
8.2.2.5.1.North America
8.2.2.5.1.1.Market Estimation, 2016 – 2023
8.2.2.5.1.2.Market Forecast, 2024 – 2034
8.2.2.5.2.Europe
8.2.2.5.2.1.Market Estimation, 2016 – 2023
8.2.2.5.2.2.Market Forecast, 2024 – 2034
8.2.2.5.3.Asia Pacific
8.2.2.5.3.1.Market Estimation, 2016 – 2023
8.2.2.5.3.2.Market Forecast, 2024 – 2034
8.2.2.5.4.Middle East and Africa
8.2.2.5.4.1.Market Estimation, 2016 – 2023
8.2.2.5.4.2.Market Forecast, 2024 – 2034
8.2.2.5.5.Latin America
8.2.2.5.5.1.Market Estimation, 2016 – 2023
8.2.2.5.5.2.Market Forecast, 2024 – 2034
8.2.3.Hydro energy
8.2.3.1.Definition
8.2.3.2.Market Estimation and Penetration, 2016 – 2023
8.2.3.3.Market Forecast, 2024 – 2034
8.2.3.4.Compound Annual Growth Rate (CAGR)
8.2.3.5.Regional Bifurcation
8.2.3.5.1.North America
8.2.3.5.1.1.Market Estimation, 2016 – 2023
8.2.3.5.1.2.Market Forecast, 2024 – 2034
8.2.3.5.2.Europe
8.2.3.5.2.1.Market Estimation, 2016 – 2023
8.2.3.5.2.2.Market Forecast, 2024 – 2034
8.2.3.5.3.Asia Pacific
8.2.3.5.3.1.Market Estimation, 2016 – 2023
8.2.3.5.3.2.Market Forecast, 2024 – 2034
8.2.3.5.4.Middle East and Africa
8.2.3.5.4.1.Market Estimation, 2016 – 2023
8.2.3.5.4.2.Market Forecast, 2024 – 2034
8.2.3.5.5.Latin America
8.2.3.5.5.1.Market Estimation, 2016 – 2023
8.2.3.5.5.2.Market Forecast, 2024 – 2034
8.2.4.Tidal energy
8.2.4.1.Definition
8.2.4.2.Market Estimation and Penetration, 2016 – 2023
8.2.4.3.Market Forecast, 2024 – 2034
8.2.4.4.Compound Annual Growth Rate (CAGR)
8.2.4.5.Regional Bifurcation
8.2.4.5.1.North America
8.2.4.5.1.1.Market Estimation, 2016 – 2023
8.2.4.5.1.2.Market Forecast, 2024 – 2034
8.2.4.5.2.Europe
8.2.4.5.2.1.Market Estimation, 2016 – 2023
8.2.4.5.2.2.Market Forecast, 2024 – 2034
8.2.4.5.3.Asia Pacific
8.2.4.5.3.1.Market Estimation, 2016 – 2023
8.2.4.5.3.2.Market Forecast, 2024 – 2034
8.2.4.5.4.Middle East and Africa
8.2.4.5.4.1.Market Estimation, 2016 – 2023
8.2.4.5.4.2.Market Forecast, 2024 – 2034
8.2.4.5.5.Latin America
8.2.4.5.5.1.Market Estimation, 2016 – 2023
8.2.4.5.5.2.Market Forecast, 2024 – 2034
8.2.5.Geothermal energy
8.2.5.1.Definition
8.2.5.2.Market Estimation and Penetration, 2016 – 2023
8.2.5.3.Market Forecast, 2024 – 2034
8.2.5.4.Compound Annual Growth Rate (CAGR)
8.2.5.5.Regional Bifurcation
8.2.5.5.1.North America
8.2.5.5.1.1.Market Estimation, 2016 – 2023
8.2.5.5.1.2.Market Forecast, 2024 – 2034
8.2.5.5.2.Europe
8.2.5.5.2.1.Market Estimation, 2016 – 2023
8.2.5.5.2.2.Market Forecast, 2024 – 2034
8.2.5.5.3.Asia Pacific
8.2.5.5.3.1.Market Estimation, 2016 – 2023
8.2.5.5.3.2.Market Forecast, 2024 – 2034
8.2.5.5.4.Middle East and Africa
8.2.5.5.4.1.Market Estimation, 2016 – 2023
8.2.5.5.4.2.Market Forecast, 2024 – 2034
8.2.5.5.5.Latin America
8.2.5.5.5.1.Market Estimation, 2016 – 2023
8.2.5.5.5.2.Market Forecast, 2024 – 2034
8.2.6.Biomass energy 
8.2.6.1.Definition
8.2.6.2.Market Estimation and Penetration, 2016 – 2023
8.2.6.3.Market Forecast, 2024 – 2034
8.2.6.4.Compound Annual Growth Rate (CAGR)
8.2.6.5.Regional Bifurcation
8.2.6.5.1.North America
8.2.6.5.1.1.Market Estimation, 2016 – 2023
8.2.6.5.1.2.Market Forecast, 2024 – 2034
8.2.6.5.2.Europe
8.2.6.5.2.1.Market Estimation, 2016 – 2023
8.2.6.5.2.2.Market Forecast, 2024 – 2034
8.2.6.5.3.Asia Pacific
8.2.6.5.3.1.Market Estimation, 2016 – 2023
8.2.6.5.3.2.Market Forecast, 2024 – 2034
8.2.6.5.4.Middle East and Africa
8.2.6.5.4.1.Market Estimation, 2016 – 2023
8.2.6.5.4.2.Market Forecast, 2024 – 2034
8.2.6.5.5.Latin America
8.2.6.5.5.1.Market Estimation, 2016 – 2023
8.2.6.5.5.2.Market Forecast, 2024 – 2034
8.3.Key Segment for Channeling Investments
8.3.1.By Type
9.Global Renewable Energy Market Analysis and Forecasts, 2024 – 2034
9.1.Overview
9.2.Global Renewable Energy Market Revenue (US$ Mn) and Forecasts, By Application
9.2.1.Industrial (Definition, Market Estimation and Penetration, 2016 – 2023, Market Estimation (2016 – 2023), Market Forecast (2024 – 2034), Compound Annual Growth Rate (CAGR), Regional Bifurcation (North America, Europe, Asia Pacific, Middle East and Africa, Latin America) and Information on Food and Beverage industries, Aviation industry, Automotive industry, Others)
9.2.1.1.Food and Beverage industries
9.2.1.2.Aviation industry
9.2.1.3.Automotive industry
9.2.1.4.Others
9.2.2.Residential
9.2.2.1.Definition
9.2.2.2.Market Estimation and Penetration, 2016 – 2023
9.2.2.3.Market Forecast, 2024 – 2034
9.2.2.4.Compound Annual Growth Rate (CAGR)
9.2.2.5.Regional Bifurcation
9.2.2.5.1.North America
9.2.2.5.1.1.Market Estimation, 2016 – 2023
9.2.2.5.1.2.Market Forecast, 2024 – 2034
9.2.2.5.2.Europe
9.2.2.5.2.1.Market Estimation, 2016 – 2023
9.2.2.5.2.2.Market Forecast, 2024 – 2034
9.2.2.5.3.Asia Pacific
9.2.2.5.3.1.Market Estimation, 2016 – 2023
9.2.2.5.3.2.Market Forecast, 2024 – 2034
9.2.2.5.4.Middle East and Africa
9.2.2.5.4.1.Market Estimation, 2016 – 2023
9.2.2.5.4.2.Market Forecast, 2024 – 2034
9.2.2.5.5.Latin America
9.2.2.5.5.1.Market Estimation, 2016 – 2023
9.2.2.5.5.2.Market Forecast, 2024 – 2034
9.2.3.Commercial (Definition, Market Estimation and Penetration, 2016 – 2023, Market Estimation (2016 – 2023), Market Forecast (2024 – 2034), Compound Annual Growth Rate (CAGR), Regional Bifurcation (North America, Europe, Asia Pacific, Middle East and Africa, Latin America) and Information on Hotels, Schools, Office Buildings, Others)
9.2.3.1.Hotels
9.2.3.2.Schools
9.2.3.3.Office Buildings
9.2.3.4.Others
9.3.Key Segment for Channeling Investments
9.3.1.By Application
10.North America Renewable Energy Market Analysis and Forecasts, 2024 – 2034
10.1.Overview
10.1.1.North America Renewable Energy Market Revenue (US$ Mn)
10.2.North America Renewable Energy Market Revenue (US$ Mn) and Forecasts, By Type
10.2.1.Solar energy
10.2.2.Wind energy
10.2.3.Hydro energy
10.2.4.Tidal energy
10.2.5.Geothermal energy
10.2.6.Biomass energy 
10.3.North America Renewable Energy Market Revenue (US$ Mn) and Forecasts, By Application
10.3.1.Industrial
10.3.1.1.Food and Beverage industries
10.3.1.2.Aviation industry
10.3.1.3.Automotive industry
10.3.1.4.Others
10.3.2.Residential
10.3.3.Commercial
10.3.3.1.Hotels
10.3.3.2.Schools
10.3.3.3.Office Buildings
10.3.3.4.Others
10.4.North America Renewable Energy Market Revenue (US$ Mn) and Forecasts, By Country
10.4.1.U.S
10.4.1.1.U.S Renewable Energy Market Revenue (US$ Mn) and Forecasts, By Type
10.4.1.1.1.Solar energy
10.4.1.1.2.Wind energy
10.4.1.1.3.Hydro energy
10.4.1.1.4.Tidal energy
10.4.1.1.5.Geothermal energy
10.4.1.1.6.Biomass energy 
10.4.1.2.U.S Renewable Energy Market Revenue (US$ Mn) and Forecasts, By Application
10.4.1.2.1.Industrial
10.4.1.2.1.1.Food and Beverage industries
10.4.1.2.1.2.Aviation industry
10.4.1.2.1.3.Automotive industry
10.4.1.2.1.4.Others
10.4.1.2.2.Residential
10.4.1.2.3.Commercial
10.4.1.2.3.1.Hotels
10.4.1.2.3.2.Schools
10.4.1.2.3.3.Office Buildings
10.4.1.2.3.4.Others
10.4.2.Canada
10.4.2.1.Canada Renewable Energy Market Revenue (US$ Mn) and Forecasts, By Type
10.4.2.1.1.Solar energy
10.4.2.1.2.Wind energy
10.4.2.1.3.Hydro energy
10.4.2.1.4.Tidal energy
10.4.2.1.5.Geothermal energy
10.4.2.1.6.Biomass energy 
10.4.2.2.Canada Renewable Energy Market Revenue (US$ Mn) and Forecasts, By Application
10.4.2.2.1.Industrial
10.4.2.2.1.1.Food and Beverage industries
10.4.2.2.1.2.Aviation industry
10.4.2.2.1.3.Automotive industry
10.4.2.2.1.4.Others
10.4.2.2.2.Residential
10.4.2.2.3.Commercial
10.4.2.2.3.1.Hotels
10.4.2.2.3.2.Schools
10.4.2.2.3.3.Office Buildings
10.4.2.2.3.4.Others
10.4.3.Mexico
10.4.3.1.Mexico Renewable Energy Market Revenue (US$ Mn) and Forecasts, By Type
10.4.3.1.1.Solar energy
10.4.3.1.2.Wind energy
10.4.3.1.3.Hydro energy
10.4.3.1.4.Tidal energy
10.4.3.1.5.Geothermal energy
10.4.3.1.6.Biomass energy 
10.4.3.2.Mexico Renewable Energy Market Revenue (US$ Mn) and Forecasts, By Application
10.4.3.2.1.Industrial
10.4.3.2.1.1.Food and Beverage industries
10.4.3.2.1.2.Aviation industry
10.4.3.2.1.3.Automotive industry
10.4.3.2.1.4.Others
10.4.3.2.2.Residential
10.4.3.2.3.Commercial
10.4.3.2.3.1.Hotels
10.4.3.2.3.2.Schools
10.4.3.2.3.3.Office Buildings
10.4.3.2.3.4.Others
10.4.4.Rest of North America
10.4.4.1.Rest of North America Renewable Energy Market Revenue (US$ Mn) and Forecasts, By Type
10.4.4.1.1.Solar energy
10.4.4.1.2.Wind energy
10.4.4.1.3.Hydro energy
10.4.4.1.4.Tidal energy
10.4.4.1.5.Geothermal energy
10.4.4.1.6.Biomass energy 
10.4.4.2.Rest of North America Renewable Energy Market Revenue (US$ Mn) and Forecasts, By Application
10.4.4.2.1.Industrial
10.4.4.2.1.1.Food and Beverage industries
10.4.4.2.1.2.Aviation industry
10.4.4.2.1.3.Automotive industry
10.4.4.2.1.4.Others
10.4.4.2.2.Residential
10.4.4.2.3.Commercial
10.4.4.2.3.1.Hotels
10.4.4.2.3.2.Schools
10.4.4.2.3.3.Office Buildings
10.4.4.2.3.4.Others
10.5.Key Segment for Channeling Investments
10.5.1.By Country
10.5.2.By Type
10.5.3.By Application
11.Europe Renewable Energy Market Analysis and Forecasts, 2024 – 2034
11.1.Overview
11.1.1.Europe Renewable Energy Market Revenue (US$ Mn)
11.2.Europe Renewable Energy Market Revenue (US$ Mn) and Forecasts, By Type
11.2.1.Solar energy
11.2.2.Wind energy
11.2.3.Hydro energy
11.2.4.Tidal energy
11.2.5.Geothermal energy
11.2.6.Biomass energy 
11.3.Europe Renewable Energy Market Revenue (US$ Mn) and Forecasts, By Application
11.3.1.Industrial
11.3.1.1.Food and Beverage industries
11.3.1.2.Aviation industry
11.3.1.3.Automotive industry
11.3.1.4.Others
11.3.2.Residential
11.3.3.Commercial
11.3.3.1.Hotels
11.3.3.2.Schools
11.3.3.3.Office Buildings
11.3.3.4.Others
11.4.Europe Renewable Energy Market Revenue (US$ Mn) and Forecasts, By Country
11.4.1.France
11.4.1.1.France Renewable Energy Market Revenue (US$ Mn) and Forecasts, By Type
11.4.1.1.1.Solar energy
11.4.1.1.2.Wind energy
11.4.1.1.3.Hydro energy
11.4.1.1.4.Tidal energy
11.4.1.1.5.Geothermal energy
11.4.1.1.6.Biomass energy 
11.4.1.2.France Renewable Energy Market Revenue (US$ Mn) and Forecasts, By Application
11.4.1.2.1.Industrial
11.4.1.2.1.1.Food and Beverage industries
11.4.1.2.1.2.Aviation industry
11.4.1.2.1.3.Automotive industry
11.4.1.2.1.4.Others
11.4.1.2.2.Residential
11.4.1.2.3.Commercial
11.4.1.2.3.1.Hotels
11.4.1.2.3.2.Schools
11.4.1.2.3.3.Office Buildings
11.4.1.2.3.4.Others
11.4.2.The UK
11.4.2.1.The UK Renewable Energy Market Revenue (US$ Mn) and Forecasts, By Type
11.4.2.1.1.Solar energy
11.4.2.1.2.Wind energy
11.4.2.1.3.Hydro energy
11.4.2.1.4.Tidal energy
11.4.2.1.5.Geothermal energy
11.4.2.1.6.Biomass energy 
11.4.2.2.The UK Renewable Energy Market Revenue (US$ Mn) and Forecasts, By Application
11.4.2.2.1.Industrial
11.4.2.2.1.1.Food and Beverage industries
11.4.2.2.1.2.Aviation industry
11.4.2.2.1.3.Automotive industry
11.4.2.2.1.4.Others
11.4.2.2.2.Residential
11.4.2.2.3.Commercial
11.4.2.2.3.1.Hotels
11.4.2.2.3.2.Schools
11.4.2.2.3.3.Office Buildings
11.4.2.2.3.4.Others
11.4.3.Spain
11.4.3.1.Spain Renewable Energy Market Revenue (US$ Mn) and Forecasts, By Type
11.4.3.1.1.Solar energy
11.4.3.1.2.Wind energy
11.4.3.1.3.Hydro energy
11.4.3.1.4.Tidal energy
11.4.3.1.5.Geothermal energy
11.4.3.1.6.Biomass energy 
11.4.3.2.Spain Renewable Energy Market Revenue (US$ Mn) and Forecasts, By Application
11.4.3.2.1.Industrial
11.4.3.2.1.1.Food and Beverage industries
11.4.3.2.1.2.Aviation industry
11.4.3.2.1.3.Automotive industry
11.4.3.2.1.4.Others
11.4.3.2.2.Residential
11.4.3.2.3.Commercial
11.4.3.2.3.1.Hotels
11.4.3.2.3.2.Schools
11.4.3.2.3.3.Office Buildings
11.4.3.2.3.4.Others
11.4.4.Germany
11.4.4.1.Germany Renewable Energy Market Revenue (US$ Mn) and Forecasts, By Type
11.4.4.1.1.Solar energy
11.4.4.1.2.Wind energy
11.4.4.1.3.Hydro energy
11.4.4.1.4.Tidal energy
11.4.4.1.5.Geothermal energy
11.4.4.1.6.Biomass energy 
11.4.4.2.Germany Renewable Energy Market Revenue (US$ Mn) and Forecasts, By Application
11.4.4.2.1.Industrial
11.4.4.2.1.1.Food and Beverage industries
11.4.4.2.1.2.Aviation industry
11.4.4.2.1.3.Automotive industry
11.4.4.2.1.4.Others
11.4.4.2.2.Residential
11.4.4.2.3.Commercial
11.4.4.2.3.1.Hotels
11.4.4.2.3.2.Schools
11.4.4.2.3.3.Office Buildings
11.4.4.2.3.4.Others
11.4.5.Italy
11.4.5.1.Italy Renewable Energy Market Revenue (US$ Mn) and Forecasts, By Type
11.4.5.1.1.Solar energy
11.4.5.1.2.Wind energy
11.4.5.1.3.Hydro energy
11.4.5.1.4.Tidal energy
11.4.5.1.5.Geothermal energy
11.4.5.1.6.Biomass energy 
11.4.5.2.Italy Renewable Energy Market Revenue (US$ Mn) and Forecasts, By Application
11.4.5.2.1.Industrial
11.4.5.2.1.1.Food and Beverage industries
11.4.5.2.1.2.Aviation industry
11.4.5.2.1.3.Automotive industry
11.4.5.2.1.4.Others
11.4.5.2.2.Residential
11.4.5.2.3.Commercial
11.4.5.2.3.1.Hotels
11.4.5.2.3.2.Schools
11.4.5.2.3.3.Office Buildings
11.4.5.2.3.4.Others
11.4.6.Nordic Countries
11.4.6.1.Nordic Countries Renewable Energy Market Revenue (US$ Mn) and Forecasts, By Type
11.4.6.1.1.Solar energy
11.4.6.1.2.Wind energy
11.4.6.1.3.Hydro energy
11.4.6.1.4.Tidal energy
11.4.6.1.5.Geothermal energy
11.4.6.1.6.Biomass energy 
11.4.6.2.Nordic Countries Renewable Energy Market Revenue (US$ Mn) and Forecasts, By Application
11.4.6.2.1.Industrial
11.4.6.2.1.1.Food and Beverage industries
11.4.6.2.1.2.Aviation industry
11.4.6.2.1.3.Automotive industry
11.4.6.2.1.4.Others
11.4.6.2.2.Residential
11.4.6.2.3.Commercial
11.4.6.2.3.1.Hotels
11.4.6.2.3.2.Schools
11.4.6.2.3.3.Office Buildings
11.4.6.2.3.4.Others
11.4.6.3.Nordic Countries Renewable Energy Market Revenue (US$ Mn) and Forecasts, By Country
11.4.6.3.1.Denmark
11.4.6.3.2.Finland
11.4.6.3.3.Iceland
11.4.6.3.4.Sweden
11.4.6.3.5.Norway
11.4.7.Benelux Union
11.4.7.1.Benelux Union Renewable Energy Market Revenue (US$ Mn) and Forecasts, By Type
11.4.7.1.1.Solar energy
11.4.7.1.2.Wind energy
11.4.7.1.3.Hydro energy
11.4.7.1.4.Tidal energy
11.4.7.1.5.Geothermal energy
11.4.7.1.6.Biomass energy 
11.4.7.2.Benelux Union Renewable Energy Market Revenue (US$ Mn) and Forecasts, By Application
11.4.7.2.1.Industrial
11.4.7.2.1.1.Food and Beverage industries
11.4.7.2.1.2.Aviation industry
11.4.7.2.1.3.Automotive industry
11.4.7.2.1.4.Others
11.4.7.2.2.Residential
11.4.7.2.3.Commercial
11.4.7.2.3.1.Hotels
11.4.7.2.3.2.Schools
11.4.7.2.3.3.Office Buildings
11.4.7.2.3.4.Others
11.4.7.3.Benelux Union Renewable Energy Market Revenue (US$ Mn) and Forecasts, By Country
11.4.7.3.1.Belgium
11.4.7.3.2.The Netherlands
11.4.7.3.3.Luxembourg
11.4.8.Rest of Europe
11.4.8.1.Rest of Europe Renewable Energy Market Revenue (US$ Mn) and Forecasts, By Type
11.4.8.1.1.Solar energy
11.4.8.1.2.Wind energy
11.4.8.1.3.Hydro energy
11.4.8.1.4.Tidal energy
11.4.8.1.5.Geothermal energy
11.4.8.1.6.Biomass energy 
11.4.8.2.Rest of Europe Renewable Energy Market Revenue (US$ Mn) and Forecasts, By Application
11.4.8.2.1.Industrial
11.4.8.2.1.1.Food and Beverage industries
11.4.8.2.1.2.Aviation industry
11.4.8.2.1.3.Automotive industry
11.4.8.2.1.4.Others
11.4.8.2.2.Residential
11.4.8.2.3.Commercial
11.4.8.2.3.1.Hotels
11.4.8.2.3.2.Schools
11.4.8.2.3.3.Office Buildings
11.4.8.2.3.4.Others
11.5.Key Segment for Channeling Investments
11.5.1.By Country
11.5.2.By Type
11.5.3.By Application
12.Asia Pacific Renewable Energy Market Analysis and Forecasts, 2024 – 2034
12.1.Overview
12.1.1.Asia Pacific Renewable Energy Market Revenue (US$ Mn)
12.2.Asia Pacific Renewable Energy Market Revenue (US$ Mn) and Forecasts, By Type
12.2.1.Solar energy
12.2.2.Wind energy
12.2.3.Hydro energy
12.2.4.Tidal energy
12.2.5.Geothermal energy
12.2.6.Biomass energy 
12.3.Asia Pacific Renewable Energy Market Revenue (US$ Mn) and Forecasts, By Application
12.3.1.Industrial
12.3.1.1.Food and Beverage industries
12.3.1.2.Aviation industry
12.3.1.3.Automotive industry
12.3.1.4.Others
12.3.2.Residential
12.3.3.Commercial
12.3.3.1.Hotels
12.3.3.2.Schools
12.3.3.3.Office Buildings
12.3.3.4.Others
12.4.Asia Pacific Renewable Energy Market Revenue (US$ Mn) and Forecasts, By Country
12.4.1.China
12.4.1.1.China Renewable Energy Market Revenue (US$ Mn) and Forecasts, By Type
12.4.1.1.1.Solar energy
12.4.1.1.2.Wind energy
12.4.1.1.3.Hydro energy
12.4.1.1.4.Tidal energy
12.4.1.1.5.Geothermal energy
12.4.1.1.6.Biomass energy 
12.4.1.2.China Renewable Energy Market Revenue (US$ Mn) and Forecasts, By Application
12.4.1.2.1.Industrial
12.4.1.2.1.1.Food and Beverage industries
12.4.1.2.1.2.Aviation industry
12.4.1.2.1.3.Automotive industry
12.4.1.2.1.4.Others
12.4.1.2.2.Residential
12.4.1.2.3.Commercial
12.4.1.2.3.1.Hotels
12.4.1.2.3.2.Schools
12.4.1.2.3.3.Office Buildings
12.4.1.2.3.4.Others
12.4.2.Japan
12.4.2.1.Japan Renewable Energy Market Revenue (US$ Mn) and Forecasts, By Type
12.4.2.1.1.Solar energy
12.4.2.1.2.Wind energy
12.4.2.1.3.Hydro energy
12.4.2.1.4.Tidal energy
12.4.2.1.5.Geothermal energy
12.4.2.1.6.Biomass energy 
12.4.2.2.Japan Renewable Energy Market Revenue (US$ Mn) and Forecasts, By Application
12.4.2.2.1.Industrial
12.4.2.2.1.1.Food and Beverage industries
12.4.2.2.1.2.Aviation industry
12.4.2.2.1.3.Automotive industry
12.4.2.2.1.4.Others
12.4.2.2.2.Residential
12.4.2.2.3.Commercial
12.4.2.2.3.1.Hotels
12.4.2.2.3.2.Schools
12.4.2.2.3.3.Office Buildings
12.4.2.2.3.4.Others
12.4.3.India
12.4.3.1.India Renewable Energy Market Revenue (US$ Mn) and Forecasts, By Type
12.4.3.1.1.Solar energy
12.4.3.1.2.Wind energy
12.4.3.1.3.Hydro energy
12.4.3.1.4.Tidal energy
12.4.3.1.5.Geothermal energy
12.4.3.1.6.Biomass energy 
12.4.3.2.India Renewable Energy Market Revenue (US$ Mn) and Forecasts, By Application
12.4.3.2.1.Industrial
12.4.3.2.1.1.Food and Beverage industries
12.4.3.2.1.2.Aviation industry
12.4.3.2.1.3.Automotive industry
12.4.3.2.1.4.Others
12.4.3.2.2.Residential
12.4.3.2.3.Commercial
12.4.3.2.3.1.Hotels
12.4.3.2.3.2.Schools
12.4.3.2.3.3.Office Buildings
12.4.3.2.3.4.Others
12.4.4.New Zealand
12.4.4.1.New Zealand Renewable Energy Market Revenue (US$ Mn) and Forecasts, By Type
12.4.4.1.1.Solar energy
12.4.4.1.2.Wind energy
12.4.4.1.3.Hydro energy
12.4.4.1.4.Tidal energy
12.4.4.1.5.Geothermal energy
12.4.4.1.6.Biomass energy 
12.4.4.2.New Zealand Renewable Energy Market Revenue (US$ Mn) and Forecasts, By Application
12.4.4.2.1.Industrial
12.4.4.2.1.1.Food and Beverage industries
12.4.4.2.1.2.Aviation industry
12.4.4.2.1.3.Automotive industry
12.4.4.2.1.4.Others
12.4.4.2.2.Residential
12.4.4.2.3.Commercial
12.4.4.2.3.1.Hotels
12.4.4.2.3.2.Schools
12.4.4.2.3.3.Office Buildings
12.4.4.2.3.4.Others
12.4.5.Australia
12.4.5.1.Australia Renewable Energy Market Revenue (US$ Mn) and Forecasts, By Type
12.4.5.1.1.Solar energy
12.4.5.1.2.Wind energy
12.4.5.1.3.Hydro energy
12.4.5.1.4.Tidal energy
12.4.5.1.5.Geothermal energy
12.4.5.1.6.Biomass energy 
12.4.5.2.Australia Renewable Energy Market Revenue (US$ Mn) and Forecasts, By Application
12.4.5.2.1.Industrial
12.4.5.2.1.1.Food and Beverage industries
12.4.5.2.1.2.Aviation industry
12.4.5.2.1.3.Automotive industry
12.4.5.2.1.4.Others
12.4.5.2.2.Residential
12.4.5.2.3.Commercial
12.4.5.2.3.1.Hotels
12.4.5.2.3.2.Schools
12.4.5.2.3.3.Office Buildings
12.4.5.2.3.4.Others
12.4.6.South Korea
12.4.6.1.South Korea Renewable Energy Market Revenue (US$ Mn) and Forecasts, By Type
12.4.6.1.1.Solar energy
12.4.6.1.2.Wind energy
12.4.6.1.3.Hydro energy
12.4.6.1.4.Tidal energy
12.4.6.1.5.Geothermal energy
12.4.6.1.6.Biomass energy 
12.4.6.2.South Korea Renewable Energy Market Revenue (US$ Mn) and Forecasts, By Application
12.4.6.2.1.Industrial
12.4.6.2.1.1.Food and Beverage industries
12.4.6.2.1.2.Aviation industry
12.4.6.2.1.3.Automotive industry
12.4.6.2.1.4.Others
12.4.6.2.2.Residential
12.4.6.2.3.Commercial
12.4.6.2.3.1.Hotels
12.4.6.2.3.2.Schools
12.4.6.2.3.3.Office Buildings
12.4.6.2.3.4.Others
12.4.7.Southeast Asia
12.4.7.1.Southeast Asia Renewable Energy Market Revenue (US$ Mn) and Forecasts, By Type
12.4.7.1.1.Solar energy
12.4.7.1.2.Wind energy
12.4.7.1.3.Hydro energy
12.4.7.1.4.Tidal energy
12.4.7.1.5.Geothermal energy
12.4.7.1.6.Biomass energy 
12.4.7.2.Southeast Asia Renewable Energy Market Revenue (US$ Mn) and Forecasts, By Application
12.4.7.2.1.Industrial
12.4.7.2.1.1.Food and Beverage industries
12.4.7.2.1.2.Aviation industry
12.4.7.2.1.3.Automotive industry
12.4.7.2.1.4.Others
12.4.7.2.2.Residential
12.4.7.2.3.Commercial
12.4.7.2.3.1.Hotels
12.4.7.2.3.2.Schools
12.4.7.2.3.3.Office Buildings
12.4.7.2.3.4.Others
12.4.7.3.Southeast Asia Renewable Energy Market Revenue (US$ Mn) and Forecasts, By Country
12.4.7.3.1.Indonesia
12.4.7.3.2.Thailand
12.4.7.3.3.Malaysia
12.4.7.3.4.Singapore
12.4.7.3.5.Rest of Southeast Asia
12.4.8.Rest of Asia Pacific
12.4.8.1.Rest of Asia Pacific Renewable Energy Market Revenue (US$ Mn) and Forecasts, By Type
12.4.8.1.1.Solar energy
12.4.8.1.2.Wind energy
12.4.8.1.3.Hydro energy
12.4.8.1.4.Tidal energy
12.4.8.1.5.Geothermal energy
12.4.8.1.6.Biomass energy 
12.4.8.2.Rest of Asia Pacific Renewable Energy Market Revenue (US$ Mn) and Forecasts, By Application
12.4.8.2.1.Industrial
12.4.8.2.1.1.Food and Beverage industries
12.4.8.2.1.2.Aviation industry
12.4.8.2.1.3.Automotive industry
12.4.8.2.1.4.Others
12.4.8.2.2.Residential
12.4.8.2.3.Commercial
12.4.8.2.3.1.Hotels
12.4.8.2.3.2.Schools
12.4.8.2.3.3.Office Buildings
12.4.8.2.3.4.Others
12.5.Key Segment for Channeling Investments
12.5.1.By Country
12.5.2.By Type
12.5.3.By Application
13.Middle East and Africa Renewable Energy Market Analysis and Forecasts, 2024 – 2034
13.1.Overview
13.1.1.Middle East and Africa Renewable Energy Market Revenue (US$ Mn)
13.2.Middle East and Africa Renewable Energy Market Revenue (US$ Mn) and Forecasts, By Type
13.2.1.Solar energy
13.2.2.Wind energy
13.2.3.Hydro energy
13.2.4.Tidal energy
13.2.5.Geothermal energy
13.2.6.Biomass energy 
13.3.Middle East and Africa Renewable Energy Market Revenue (US$ Mn) and Forecasts, By Application
13.3.1.Industrial
13.3.1.1.Food and Beverage industries
13.3.1.2.Aviation industry
13.3.1.3.Automotive industry
13.3.1.4.Others
13.3.2.Residential
13.3.3.Commercial
13.3.3.1.Hotels
13.3.3.2.Schools
13.3.3.3.Office Buildings
13.3.3.4.Others
13.4.Middle East and Africa Renewable Energy Market Revenue (US$ Mn) and Forecasts, By Country
13.4.1.Saudi Arabia
13.4.1.1.Saudi Arabia Renewable Energy Market Revenue (US$ Mn) and Forecasts, By Type
13.4.1.1.1.Solar energy
13.4.1.1.2.Wind energy
13.4.1.1.3.Hydro energy
13.4.1.1.4.Tidal energy
13.4.1.1.5.Geothermal energy
13.4.1.1.6.Biomass energy 
13.4.1.2.Saudi Arabia Renewable Energy Market Revenue (US$ Mn) and Forecasts, By Application
13.4.1.2.1.Industrial
13.4.1.2.1.1.Food and Beverage industries
13.4.1.2.1.2.Aviation industry
13.4.1.2.1.3.Automotive industry
13.4.1.2.1.4.Others
13.4.1.2.2.Residential
13.4.1.2.3.Commercial
13.4.1.2.3.1.Hotels
13.4.1.2.3.2.Schools
13.4.1.2.3.3.Office Buildings
13.4.1.2.3.4.Others
13.4.2.UAE
13.4.2.1.UAE Renewable Energy Market Revenue (US$ Mn) and Forecasts, By Type
13.4.2.1.1.Solar energy
13.4.2.1.2.Wind energy
13.4.2.1.3.Hydro energy
13.4.2.1.4.Tidal energy
13.4.2.1.5.Geothermal energy
13.4.2.1.6.Biomass energy 
13.4.2.2.UAE Renewable Energy Market Revenue (US$ Mn) and Forecasts, By Application
13.4.2.2.1.Industrial
13.4.2.2.1.1.Food and Beverage industries
13.4.2.2.1.2.Aviation industry
13.4.2.2.1.3.Automotive industry
13.4.2.2.1.4.Others
13.4.2.2.2.Residential
13.4.2.2.3.Commercial
13.4.2.2.3.1.Hotels
13.4.2.2.3.2.Schools
13.4.2.2.3.3.Office Buildings
13.4.2.2.3.4.Others
13.4.3.Egypt
13.4.3.1.Egypt Renewable Energy Market Revenue (US$ Mn) and Forecasts, By Type
13.4.3.1.1.Solar energy
13.4.3.1.2.Wind energy
13.4.3.1.3.Hydro energy
13.4.3.1.4.Tidal energy
13.4.3.1.5.Geothermal energy
13.4.3.1.6.Biomass energy 
13.4.3.2.Egypt Renewable Energy Market Revenue (US$ Mn) and Forecasts, By Application
13.4.3.2.1.Industrial
13.4.3.2.1.1.Food and Beverage industries
13.4.3.2.1.2.Aviation industry
13.4.3.2.1.3.Automotive industry
13.4.3.2.1.4.Others
13.4.3.2.2.Residential
13.4.3.2.3.Commercial
13.4.3.2.3.1.Hotels
13.4.3.2.3.2.Schools
13.4.3.2.3.3.Office Buildings
13.4.3.2.3.4.Others
13.4.4.Kuwait
13.4.4.1.Kuwait Renewable Energy Market Revenue (US$ Mn) and Forecasts, By Type
13.4.4.1.1.Solar energy
13.4.4.1.2.Wind energy
13.4.4.1.3.Hydro energy
13.4.4.1.4.Tidal energy
13.4.4.1.5.Geothermal energy
13.4.4.1.6.Biomass energy 
13.4.4.2.Kuwait Renewable Energy Market Revenue (US$ Mn) and Forecasts, By Application
13.4.4.2.1.Industrial
13.4.4.2.1.1.Food and Beverage industries
13.4.4.2.1.2.Aviation industry
13.4.4.2.1.3.Automotive industry
13.4.4.2.1.4.Others
13.4.4.2.2.Residential
13.4.4.2.3.Commercial
13.4.4.2.3.1.Hotels
13.4.4.2.3.2.Schools
13.4.4.2.3.3.Office Buildings
13.4.4.2.3.4.Others
13.4.5.South Africa
13.4.5.1.South Africa Renewable Energy Market Revenue (US$ Mn) and Forecasts, By Type
13.4.5.1.1.Solar energy
13.4.5.1.2.Wind energy
13.4.5.1.3.Hydro energy
13.4.5.1.4.Tidal energy
13.4.5.1.5.Geothermal energy
13.4.5.1.6.Biomass energy 
13.4.5.2.South Africa Renewable Energy Market Revenue (US$ Mn) and Forecasts, By Application
13.4.5.2.1.Industrial
13.4.5.2.1.1.Food and Beverage industries
13.4.5.2.1.2.Aviation industry
13.4.5.2.1.3.Automotive industry
13.4.5.2.1.4.Others
13.4.5.2.2.Residential
13.4.5.2.3.Commercial
13.4.5.2.3.1.Hotels
13.4.5.2.3.2.Schools
13.4.5.2.3.3.Office Buildings
13.4.5.2.3.4.Others
13.4.6.Rest of Middle East & Africa
13.4.6.1.Rest of Middle East & Africa Renewable Energy Market Revenue (US$ Mn) and Forecasts, By Type
13.4.6.1.1.Solar energy
13.4.6.1.2.Wind energy
13.4.6.1.3.Hydro energy
13.4.6.1.4.Tidal energy
13.4.6.1.5.Geothermal energy
13.4.6.1.6.Biomass energy 
13.4.6.2.Rest of Middle East & Africa Renewable Energy Market Revenue (US$ Mn) and Forecasts, By Application
13.4.6.2.1.Industrial
13.4.6.2.1.1.Food and Beverage industries
13.4.6.2.1.2.Aviation industry
13.4.6.2.1.3.Automotive industry
13.4.6.2.1.4.Others
13.4.6.2.2.Residential
13.4.6.2.3.Commercial
13.4.6.2.3.1.Hotels
13.4.6.2.3.2.Schools
13.4.6.2.3.3.Office Buildings
13.4.6.2.3.4.Others
13.5.Key Segment for Channeling Investments
13.5.1.By Country
13.5.2.By Type
13.5.3.By Application
14.Latin America Renewable Energy Market Analysis and Forecasts, 2024 – 2034
14.1.Overview
14.1.1.Latin America Renewable Energy Market Revenue (US$ Mn)
14.2.Latin America Renewable Energy Market Revenue (US$ Mn) and Forecasts, By Type
14.2.1.Solar energy
14.2.2.Wind energy
14.2.3.Hydro energy
14.2.4.Tidal energy
14.2.5.Geothermal energy
14.2.6.Biomass energy 
14.3.Latin America Renewable Energy Market Revenue (US$ Mn) and Forecasts, By Application
14.3.1.Industrial
14.3.1.1.Food and Beverage industries
14.3.1.2.Aviation industry
14.3.1.3.Automotive industry
14.3.1.4.Others
14.3.2.Residential
14.3.3.Commercial
14.3.3.1.Hotels
14.3.3.2.Schools
14.3.3.3.Office Buildings
14.3.3.4.Others
14.4.Latin America Renewable Energy Market Revenue (US$ Mn) and Forecasts, By Country
14.4.1.Brazil
14.4.1.1.Brazil Renewable Energy Market Revenue (US$ Mn) and Forecasts, By Type
14.4.1.1.1.Solar energy
14.4.1.1.2.Wind energy
14.4.1.1.3.Hydro energy
14.4.1.1.4.Tidal energy
14.4.1.1.5.Geothermal energy
14.4.1.1.6.Biomass energy 
14.4.1.2.Brazil Renewable Energy Market Revenue (US$ Mn) and Forecasts, By Application
14.4.1.2.1.Industrial
14.4.1.2.1.1.Food and Beverage industries
14.4.1.2.1.2.Aviation industry
14.4.1.2.1.3.Automotive industry
14.4.1.2.1.4.Others
14.4.1.2.2.Residential
14.4.1.2.3.Commercial
14.4.1.2.3.1.Hotels
14.4.1.2.3.2.Schools
14.4.1.2.3.3.Office Buildings
14.4.1.2.3.4.Others
14.4.2.Argentina
14.4.2.1.Argentina Renewable Energy Market Revenue (US$ Mn) and Forecasts, By Type
14.4.2.1.1.Solar energy
14.4.2.1.2.Wind energy
14.4.2.1.3.Hydro energy
14.4.2.1.4.Tidal energy
14.4.2.1.5.Geothermal energy
14.4.2.1.6.Biomass energy 
14.4.2.2.Argentina Renewable Energy Market Revenue (US$ Mn) and Forecasts, By Application
14.4.2.2.1.Industrial
14.4.2.2.1.1.Food and Beverage industries
14.4.2.2.1.2.Aviation industry
14.4.2.2.1.3.Automotive industry
14.4.2.2.1.4.Others
14.4.2.2.2.Residential
14.4.2.2.3.Commercial
14.4.2.2.3.1.Hotels
14.4.2.2.3.2.Schools
14.4.2.2.3.3.Office Buildings
14.4.2.2.3.4.Others
14.4.3.Rest of Latin America
14.4.3.1.Rest of Latin America Renewable Energy Market Revenue (US$ Mn) and Forecasts, By Type
14.4.3.1.1.Solar energy
14.4.3.1.2.Wind energy
14.4.3.1.3.Hydro energy
14.4.3.1.4.Tidal energy
14.4.3.1.5.Geothermal energy
14.4.3.1.6.Biomass energy 
14.4.3.2.Rest of Latin America Renewable Energy Market Revenue (US$ Mn) and Forecasts, By Application
14.4.3.2.1.Industrial
14.4.3.2.1.1.Food and Beverage industries
14.4.3.2.1.2.Aviation industry
14.4.3.2.1.3.Automotive industry
14.4.3.2.1.4.Others
14.4.3.2.2.Residential
14.4.3.2.3.Commercial
14.4.3.2.3.1.Hotels
14.4.3.2.3.2.Schools
14.4.3.2.3.3.Office Buildings
14.4.3.2.3.4.Others
14.5.Key Segment for Channeling Investments
14.5.1.By Country
14.5.2.By Type
14.5.3.By Application
15.Competitive Benchmarking
15.1.Brand Benchmarking
15.2.Market Share Analysis, 2023
15.3.Global Presence and Growth Strategies
15.3.1.Mergers and Acquisitions
15.3.2.Product Launches
15.3.3.Investments Trends
15.3.4.R&D Initiatives
16.Player Profiles
16.1.ABB 
16.1.1.Company Details
16.1.2.Company Overview
16.1.3.Product Offerings
16.1.4.Key Developments
16.1.5.Financial Analysis
16.1.6.SWOT Analysis
16.1.7.Business Strategies
16.2.ACCIONA
16.2.1.Company Details
16.2.2.Company Overview
16.2.3.Product Offerings
16.2.4.Key Developments
16.2.5.Financial Analysis
16.2.6.SWOT Analysis
16.2.7.Business Strategies
16.3.Enel Spa
16.3.1.Company Details
16.3.2.Company Overview
16.3.3.Product Offerings
16.3.4.Key Developments
16.3.5.Financial Analysis
16.3.6.SWOT Analysis
16.3.7.Business Strategies
16.4.ENGIE SA
16.4.1.Company Details
16.4.2.Company Overview
16.4.3.Product Offerings
16.4.4.Key Developments
16.4.5.Financial Analysis
16.4.6.SWOT Analysis
16.4.7.Business Strategies
16.5.General Electric Company
16.5.1.Company Details
16.5.2.Company Overview
16.5.3.Product Offerings
16.5.4.Key Developments
16.5.5.Financial Analysis
16.5.6.SWOT Analysis
16.5.7.Business Strategies
16.6.Innergex
16.6.1.Company Details
16.6.2.Company Overview
16.6.3.Product Offerings
16.6.4.Key Developments
16.6.5.Financial Analysis
16.6.6.SWOT Analysis
16.6.7.Business Strategies
16.7.LARSEN & TOUBRO LIMITED
16.7.1.Company Details
16.7.2.Company Overview
16.7.3.Product Offerings
16.7.4.Key Developments
16.7.5.Financial Analysis
16.7.6.SWOT Analysis
16.7.7.Business Strategies
16.8.Masdar
16.8.1.Company Details
16.8.2.Company Overview
16.8.3.Product Offerings
16.8.4.Key Developments
16.8.5.Financial Analysis
16.8.6.SWOT Analysis
16.8.7.Business Strategies
16.9.NextEra Energy, Inc.
16.9.1.Company Details
16.9.2.Company Overview
16.9.3.Product Offerings
16.9.4.Key Developments
16.9.5.Financial Analysis
16.9.6.SWOT Analysis
16.9.7.Business Strategies
16.10.Schneider Electric
16.10.1.Company Details
16.10.2.Company Overview
16.10.3.Product Offerings
16.10.4.Key Developments
16.10.5.Financial Analysis
16.10.6.SWOT Analysis
16.10.7.Business Strategies
16.11.Siemens Gamesa Renewable Energy, S.A.U.
16.11.1.Company Details
16.11.2.Company Overview
16.11.3.Product Offerings
16.11.4.Key Developments
16.11.5.Financial Analysis
16.11.6.SWOT Analysis
16.11.7.Business Strategies
16.12.Suzlon Energy Limited
16.12.1.Company Details
16.12.2.Company Overview
16.12.3.Product Offerings
16.12.4.Key Developments
16.12.5.Financial Analysis
16.12.6.SWOT Analysis
16.12.7.Business Strategies
16.13.Tata Power
16.13.1.Company Details
16.13.2.Company Overview
16.13.3.Product Offerings
16.13.4.Key Developments
16.13.5.Financial Analysis
16.13.6.SWOT Analysis
16.13.7.Business Strategies
16.14.Other Industry Participants
17.Key Findings

.

Note: This ToC is tentative and can be changed according to the research study conducted during the course of report completion.

.

**Exclusive for Multi-User and Enterprise User.

.

.

Global Renewable Energy Market

By Type

  • Solar energy
  • Wind energy
  • Hydro energy
  • Tidal energy
  • Geothermal energy
  • Biomass energy

By Application

  • Industrial
    • Food & Beverage industries
    • Aviation industry
    • Automotive industry
    • Others
  • Residential
  • Commercial
    • Hotels
    • Schools
    • Office Buildings
    • Others

By Region

  • North America (U.S., Canada, Mexico, Rest of North America)
  • Europe (France, The UK, Spain, Germany, Italy, Nordic Countries (Denmark, Finland, Iceland, Sweden, Norway), Benelux Union (Belgium, The Netherlands, Luxembourg), Rest of Europe)
  • Asia Pacific (China, Japan, India, New Zealand, Australia, South Korea, Southeast Asia (Indonesia, Thailand, Malaysia, Singapore, Rest of Southeast Asia), Rest of Asia Pacific)
  • Middle East & Africa (Saudi Arabia, UAE, Egypt, Kuwait, South Africa, Rest of Middle East & Africa)
  • Latin America (Brazil, Argentina, Rest of Latin America)

.

The Niche Research approach encompasses both primary and secondary research methods to provide comprehensive insights. While primary research is the cornerstone of our studies, we also incorporate secondary research sources such as company annual reports, premium industry databases, press releases, industry journals, and white papers.

Within our primary research, we actively engage with various industry stakeholders, conducting paid interviews and surveys. Our meticulous analysis extends to every market participant in major countries, allowing us to thoroughly examine their portfolios, calculate market shares, and segment revenues.

Our data collection primarily focuses on individual countries within our research scope, enabling us to estimate regional market sizes. Typically, we employ a bottom-up approach, meticulously tracking trends in different countries. We analyze growth drivers, constraints, technological innovations, and opportunities for each country, ultimately arriving at regional figures.Our process begins by examining the growth prospects of each country. Building upon these insights, we project growth and trends for the entire region. Finally, we utilize our proprietary model to refine estimations and forecasts.

Our data validation standards are integral to ensuring the reliability and accuracy of our research findings. Here’s a breakdown of our data validation processes and the stakeholders we engage with during our primary research:

  • Supply Side Analysis: We initiate a supply side analysis by directly contacting market participants, through telephonic interviews and questionnaires containing both open-ended and close-ended questions. We gather information on their portfolios, segment revenues, developments, and growth strategies.
  • Demand Side Analysis: To gain insights into adoption trends and consumer preferences, we reach out to target customers and users (non-vendors). This information forms a vital part of the qualitative analysis section of our reports, covering market dynamics, adoption trends, consumer behavior, spending patterns, and other related aspects.
  • Consultant Insights: We tap into the expertise of our partner consultants from around the world to obtain their unique viewpoints and perspectives. Their insights contribute to a well-rounded understanding of the markets under investigation.
  • In-House Validation: To ensure data accuracy and reliability, we conduct cross-validation of data points and information through our in-house team of consultants and utilize advanced data modeling tools for thorough verification.

The forecasts we provide are based on a comprehensive assessment of various factors, including:

  • Market Trends and Past Performance (Last Five Years): We accurately analyze market trends and performance data from preceding five years to identify historical patterns and understand the market’s evolution.
  • Historical Performance and Growth of Market Participants: We assess the historical performance and growth trajectories of key market participants. This analysis provides insights into the competitive landscape and individual company strategies.
  • Market Determinants Impact Analysis (Next Eight Years): We conduct a rigorous analysis of the factors that are projected to influence the market over the next eight years. This includes assessing both internal and external determinants that can shape market dynamics.
  • Drivers and Challenges for the Forecast Period:Identify the factors expected to drive market growth during the forecast period, as well as the challenges that the industry may face. This analysis aids in deriving an accurate growth rate projection.
  • New Acquisitions, Collaborations, or Partnerships: We keep a close watch on any new acquisitions, collaborations, or partnerships within the industry. These developments can have a significant impact on market dynamics and competitiveness.
  • Macro and Micro Factors Analysis:A thorough examination of both macro-level factors (e.g., economic trends, regulatory changes) and micro-level factors (e.g., technological advancements, consumer preferences) that may influence the market during the forecast period.
  • End-User Sentiment Analysis: To understand the market from the end-user perspective, we conduct sentiment analysis. This involves assessing the sentiment, preferences, and feedback of the end-users, which can provide valuable insights into market trends.
  • Perspective of Primary Participants: Insights gathered directly from primary research participants play a crucial role in shaping our forecasts. Their perspectives and experiences provide valuable qualitative data.
  • Year-on-Year Growth Trend: We utilize a year-on-year growth trend based on historical market growth and expected future trends. This helps in formulating our growth projections, aligning them with the market’s historical performance.

Research process adopted by TNR involves multiple stages, including data collection, validation, quality checks, and presentation. It’s crucial that the data and information we provide add value to your existing market understanding and expertise. We have also established partnerships with business consulting, research, and survey organizations across regions and globally to collaborate on regional analysis and data validation, ensuring the highest level of accuracy and reliability in our reports.


Procure Comprehensive Study of

Global Renewable Energy Market

Online Only

  • Online Access
  • Read Only File
  • Validity 3 Months
  • Print, Copy, Paste & Download
  • PPT, Excel
  • Cost-Free Report in the Next Update
$3300
Buy Now

Single User

  • Access to One User on One System
  • Read Only File
  • Validity 6 Months
  • Limited Print,Copy, Paste
  • PPT, Excel
  • Cost-Free Report in the Next Update
$4200
Buy Now

Multi User

  • Access to Fiver Users
  • PDF File
  • Validity 1 Year
  • Upto FivePrints
  • Cost-Free Report in the Next Update
  • PPT, Excel
$6000
Buy Now

Enterprise User

  • Access to Unlimited Users
  • PDF, PPT, Excel
  • Unlimited Validity, Prints&Downloads
  • 1 Hour Cost-Free & Dedicated Analyst Support
  • 10% Cost-Free Customization
  • Cost-Free Report Update Twice in a Year
  • Recommendations for Business Strategies
  • Authorization to Quote TNR, The Niche Research
$7300
Buy Now

Library Access

  • Online Access to Content Publications
  • Access Player Profiles Online
  • Get Immediate Access to Newly Added Content
  • Acquire 12 PDF Downloads
  • Acquire 5 Excel Data Sets
  • Gain Access to 290+ PDFs of Company Profiles
  • Round-the-clock Email and Phone Assistance
  • Dashboard Usage and Trends
  • Renewal & Upgrade Assistance
  • Assessing Customization Options and Alerts for New Reports
$10788
Buy Now
*Taxes/Fees, if applicable will be added during checkout. All prices in USD

Why TNR The Niche Research?

  • Unwavering Commitment to Excellence

  • Veteran Team of Researchers

  • Accurate and Timely Insights

  • Ethical Practices and Customized Service

  • Uninterrupted Availability Around the Clock

Scroll to Top