Global Reusable Packaging Market By Product Type, By Material, By End-Use Industry, By Region: Segmental & Global Trends and Forecast, 2023 – 2031
- Industry: Chemicals & Materials
- Report ID: TNR-110-997
- Number of Pages: 420
- Table/Charts : Yes
- November, 2023
- Base Year : 2024
- No. of Companies : 11+
- No. of Countries : 29
- Views : 10204
- Covid Impact Covered: Yes
- War Impact Covered: Yes
- Formats : PDF, Excel, PPT
Global Reusable Packaging Market was valued at US$ 108.65 Billion in 2022, growing at an estimated CAGR of 6.0% from 2023-2031.
Reusable packaging refers to durable containers designed for multiple cycles of use. These containers are utilized for transporting and storing products, replacing single-use options. By reducing waste and minimizing environmental impact, reusable packaging promotes sustainability and cost efficiency in various industries, from retail to logistics.
Pallets are dominating the global reusable packaging market by product type. They are widely used for efficient transport and storage across various industries. A study by Modern Materials Handling revealed that 70% of surveyed companies use reusable pallets. Their versatility and cost-saving benefits contribute to their dominant position in the market.
COVID-19 Impact Analysis on Global Reusable Packaging Market
Prior to the pandemic, the reusable packaging market was steadily growing, driven by sustainability initiatives and supply chain optimization. Industries recognized the environmental benefits and cost savings of reusable packaging solutions, fostering market expansion. The COVID-19 pandemic underscored the significance of hygiene and safety. While the reusable packaging market faced initial setbacks due to contamination concerns, it rebounded with heightened demand for safe and durable packaging. Industries sought eco-friendly alternatives that also ensured product integrity, driving innovation and reshaping the reusable packaging landscape.
Global Reusable Packaging Market Revenue & Forecast, (US$ Million), 2015 – 2031

The pressing need for environmental conservation acts as a prominent driver in the reusable packaging market. A study estimated that the equivalent of a garbage truck of plastic enters the ocean every minute. Reusable packaging reduces waste generation, conserves resources, and lowers carbon emissions. A survey revealed that 73% of consumers consider environmental impact while making purchasing decisions. This driver highlights how businesses and consumers alike are increasingly embracing reusable packaging to align with sustainability goals and reduce their ecological footprint.
High initial costs pose a significant restraint in the reusable packaging market. Implementing reusable packaging systems demands upfront investments in containers, logistics, and cleaning processes. A survey by the Reusable Packaging Association found that 61% of respondents cited initial costs as a major challenge. These expenses might deter some businesses from adopting reusable solutions despite the long-term benefits. This restraint underscores the importance of demonstrating the cost-effectiveness and environmental advantages of reusable packaging to encourage broader adoption.
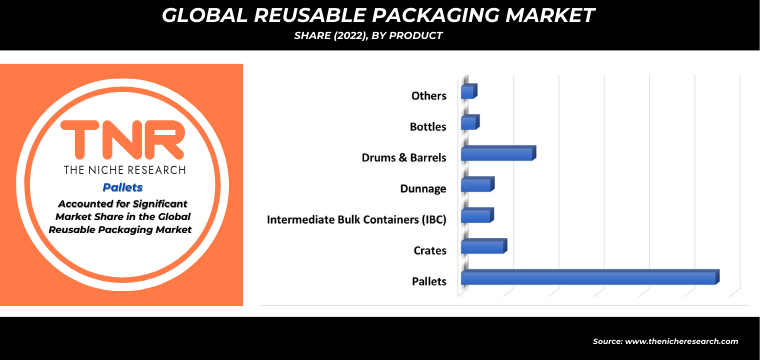 Pallets are a fundamental part of modern logistics and supply chain operations. They are used to stack, store, transport, and handle goods efficiently, making it easier to move products from manufacturers to distributors, retailers, and ultimately, to consumers. Pallets provide a stable platform for loading goods, making loading and unloading more streamlined and reducing the risk of damage.
One of the key factors that contribute to pallets’ significance (~ 60%) in the reusable packaging market is their reusability and durability. Pallets are typically made from materials like wood, plastic, or metal, which can withstand multiple trips and handling without significant wear and tear. For example, a plastic pallet used to transport goods from a manufacturer to a retailer can be returned to the manufacturer after use. This allows the pallet to be reused for multiple shipments, reducing the need for single-use packaging
A report indicated that reusable packaging in the food sector has gained traction due to its ability to reduce food waste and improve supply chain efficiency. The industry’s focus on sustainability and consumer demand for eco-friendly packaging solidifies its dominant position.
 Europe dominated the global reusable packaging market in 2022. The European Union’s Circular Economy Action Plan and ambitious recycling targets drive the adoption of sustainable practices. The European Environmental Agency highlighted that Europe recycles around 42% of plastic waste. The region’s strong regulatory framework, combined with consumer demand for eco-friendly options, solidifies its dominant position in embracing reusable packaging solutions.
Competitive Landscape: Global Reusable Packaging Market
- Brambles
- DS Smith
- IPL
- Menasha Corporation
- Myers Industries
- Nefab Group
- Rehrig Pacific Company
- Schoeller Allibert
- Schütz GmbH & Co. KGaA
- Vetropack
- Other Industry Participants
Global Reusable Packaging Market Key Insights
| Report Specifications | Details |
| Market Revenue in 2022 | US$ 108.65 Bn |
| Market Size Forecast by 2031 | US$ 180.64 Bn |
| Growth Rate (CAGR) | 6.0% |
| Historic Data | 2015 – 2021 |
| Base Year for Estimation | 2022 |
| Forecast Period | 2023 – 2031 |
| Report Inclusions | Market Size & Estimates, Market Dynamics, Competitive Scenario, Trends, Growth Factors, Market Determinants, Key Investment Segmentation, Product/Service/Solutions Benchmarking |
| Segments Covered | By Product Type, By Material, By End-Use Industry |
| Regions Covered | North America, Europe, Asia Pacific, Middle East & Africa, Latin America |
| Countries Covered | U.S., Canada, Mexico, Rest of North America, France, The UK, Spain, Germany, Italy, Nordic Countries (Denmark, Finland, Iceland, Sweden, Norway), Benelux Union (Belgium, The Netherlands, Luxembourg), Rest of Europe, China, Japan, India, New Zealand, Australia, South Korea, Southeast Asia (Indonesia, Thailand, Malaysia, Singapore, Rest of Southeast Asia), Rest of Asia Pacific, Saudi Arabia, UAE, Egypt, Kuwait, South Africa, Rest of Middle East & Africa, Brazil, Argentina, Rest of Latin America |
| Key Players | Brambles, DS Smith, IPL, Menasha Corporation, Myers Industries,
Nefab Group, Rehrig Pacific Company, Schoeller Allibert, Schütz GmbH & Co. KGaA, Vetropack, Other Industry Participants |
| Customization Scope | Customization allows for the inclusion/modification of content pertaining to geographical regions, countries, and specific market segments. |
| Pricing & Procurement Options | Explore purchase options tailored to your specific research requirements |
| Contact Details | Consult With Our Expert
Japan (Toll-Free): +81 663-386-8111 South Korea (Toll-Free): +82-808- 703-126 Saudi Arabia (Toll-Free): +966 800-850-1643 United Kingdom: +44 753-710-5080 United States: +1 302-232-5106 E-mail: askanexpert@thenicheresearch.com
|
Global Reusable Packaging Market
By Product Type
- Pallets
- Crates
- Intermediate Bulk Containers (IBC)
- Dunnage
- Drums & Barrels
- Bottles
- Others
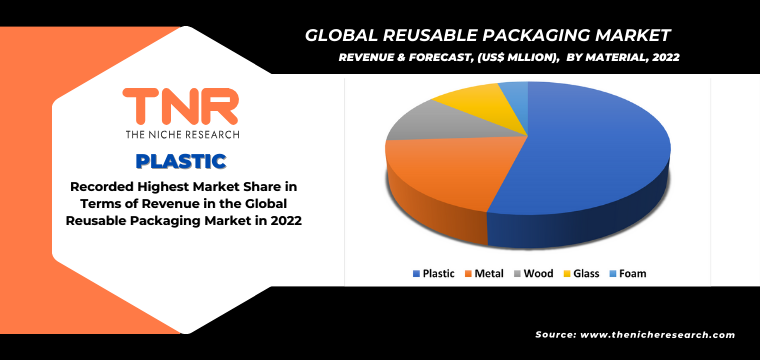
By Material
- Plastic
- Metal
- Wood
- Glass
- Foam
By End-Use Industry
- Automotive
- Food & Beverages
- Consumer Durables
- Healthcare
- Others
By Region
- North America (U.S., Canada, Mexico, Rest of North America)
- Europe (France, The UK, Spain, Germany, Italy, Nordic Countries (Denmark, Finland, Iceland, Sweden, Norway), Benelux Union (Belgium, The Netherlands, Luxembourg), Rest of Europe)
- Asia Pacific (China, Japan, India, New Zealand, Australia, South Korea, Southeast Asia (Indonesia, Thailand, Malaysia, Singapore, Rest of Southeast Asia), Rest of Asia Pacific)
- Middle East & Africa (Saudi Arabia, UAE, Egypt, Kuwait, South Africa, Rest of Middle East & Africa)
- Latin America (Brazil, Argentina, Rest of Latin America)
Report Coverage & Deliverables
Table of Contents
**Exclusive for Multi-User and Enterprise User.
Global Reusable Packaging Market
By Product Type
By Material
By End-Use Industry
By Region
**Note: The report covers cross-segmentation analysis by region further into countries
The Niche Research approach encompasses both primary and secondary research methods to provide comprehensive insights. While primary research is the cornerstone of our studies, we also incorporate secondary research sources such as company annual reports, premium industry databases, press releases, industry journals, and white papers.
Within our primary research, we actively engage with various industry stakeholders, conducting paid interviews and surveys. Our meticulous analysis extends to every market participant in major countries, allowing us to thoroughly examine their portfolios, calculate market shares, and segment revenues.
Our data collection primarily focuses on individual countries within our research scope, enabling us to estimate regional market sizes. Typically, we employ a bottom-up approach, meticulously tracking trends in different countries. We analyze growth drivers, constraints, technological innovations, and opportunities for each country, ultimately arriving at regional figures.Our process begins by examining the growth prospects of each country. Building upon these insights, we project growth and trends for the entire region. Finally, we utilize our proprietary model to refine estimations and forecasts.
Our data validation standards are integral to ensuring the reliability and accuracy of our research findings. Here’s a breakdown of our data validation processes and the stakeholders we engage with during our primary research:
- Supply Side Analysis: We initiate a supply side analysis by directly contacting market participants, through telephonic interviews and questionnaires containing both open-ended and close-ended questions. We gather information on their portfolios, segment revenues, developments, and growth strategies.
- Demand Side Analysis: To gain insights into adoption trends and consumer preferences, we reach out to target customers and users (non-vendors). This information forms a vital part of the qualitative analysis section of our reports, covering market dynamics, adoption trends, consumer behavior, spending patterns, and other related aspects.
- Consultant Insights: We tap into the expertise of our partner consultants from around the world to obtain their unique viewpoints and perspectives. Their insights contribute to a well-rounded understanding of the markets under investigation.
- In-House Validation: To ensure data accuracy and reliability, we conduct cross-validation of data points and information through our in-house team of consultants and utilize advanced data modeling tools for thorough verification.
The forecasts we provide are based on a comprehensive assessment of various factors, including:
- Market Trends and Past Performance (Last Five Years): We accurately analyze market trends and performance data from preceding five years to identify historical patterns and understand the market’s evolution.
- Historical Performance and Growth of Market Participants: We assess the historical performance and growth trajectories of key market participants. This analysis provides insights into the competitive landscape and individual company strategies.
- Market Determinants Impact Analysis (Next Eight Years): We conduct a rigorous analysis of the factors that are projected to influence the market over the next eight years. This includes assessing both internal and external determinants that can shape market dynamics.
- Drivers and Challenges for the Forecast Period:Identify the factors expected to drive market growth during the forecast period, as well as the challenges that the industry may face. This analysis aids in deriving an accurate growth rate projection.
- New Acquisitions, Collaborations, or Partnerships: We keep a close watch on any new acquisitions, collaborations, or partnerships within the industry. These developments can have a significant impact on market dynamics and competitiveness.
- Macro and Micro Factors Analysis:A thorough examination of both macro-level factors (e.g., economic trends, regulatory changes) and micro-level factors (e.g., technological advancements, consumer preferences) that may influence the market during the forecast period.
- End-User Sentiment Analysis: To understand the market from the end-user perspective, we conduct sentiment analysis. This involves assessing the sentiment, preferences, and feedback of the end-users, which can provide valuable insights into market trends.
- Perspective of Primary Participants: Insights gathered directly from primary research participants play a crucial role in shaping our forecasts. Their perspectives and experiences provide valuable qualitative data.
- Year-on-Year Growth Trend: We utilize a year-on-year growth trend based on historical market growth and expected future trends. This helps in formulating our growth projections, aligning them with the market’s historical performance.
Research process adopted by TNR involves multiple stages, including data collection, validation, quality checks, and presentation. It’s crucial that the data and information we provide add value to your existing market understanding and expertise. We have also established partnerships with business consulting, research, and survey organizations across regions and globally to collaborate on regional analysis and data validation, ensuring the highest level of accuracy and reliability in our reports.