Global Silicon Photonics Market Insights, Growth, Share, Size: By Product, By Application, By Region & Segmental Forecast, 2023-2031, Comparative Analysis and Trends
- Industry: Semiconductors & Electronics
- Report ID: TNR-110-974
- Number of Pages: 420
- Table/Charts : Yes
- November, 2023
- Base Year : 2024
- No. of Companies : 11+
- No. of Countries : 29
- Views : 10121
- Covid Impact Covered: Yes
- War Impact Covered: Yes
- Formats : PDF, Excel, PPT
Global Silicon Photonics Market was Valued USD 1.2 Bn in 2022, with an Estimated CAGR of 26.3% (2023- 2031)
Silicon photonics has emerged as a pivotal solution for addressing the escalating demands of high-speed data communication, energy efficiency, and advanced sensing applications. Its integration into data centers, telecommunications networks, and a wide array of emerging technologies has propelled its growth as a foundational enabler of modern connectivity and computing. This introduction explores the expanding silicon photonics market, shedding light on its pivotal role in shaping the future of high-speed data transmission and a multitude of industries.
Global Silicon Photonics Market Revenue & Forecast, (US$ Million), 2015 – 2031

Factors Supporting the Growth of the Global Silicon Photonics Market
Manufacturing photonic circuits with CMOS technology, commonly known as silicon photonics, not only provides the scale of semiconductor wafer-scale manufacture, but it also enables benefits in novel electronics applications that use light qualities in computing, communication, sensing, and imaging. Silicon photonics is rapidly being used in optical data communications, sensing, biomedical, automotive, virtual reality, and artificial intelligence (AI) applications for these reasons.
In addition, the ever-expanding volume of data traffic due to cloud computing, streaming services, social media, and IoT applications has created a strong demand for high-speed data transmission and efficient data center solutions. Silicon photonics addresses these needs by providing high-speed optical interconnects. Besides collaboration between academic institutions, research organizations, and industry players has accelerated the growth of global silicon photonics market.
Global Silicon Photonics Market Challenges
Global silicon photonics market has experienced significant growth and holds tremendous promise, it also faces several challenges that can impact its widespread adoption and development. Silicon photonics components and devices often involve high initial fabrication costs, particularly for specialized and custom applications. These costs can be a barrier to entry for smaller companies and startups looking to adopt the technology. Besides while silicon photonics can be integrated with existing semiconductor manufacturing processes, it can still be a complex process that requires specialized knowledge and expertise. Despite these challenges, ongoing research and development efforts, standardization initiatives, and increasing demand for high-speed data communication and sensing applications continue to drive the growth and evolution of the global silicon photonics market.
In the last few years, silicon photonics market is making significant strides into the automotive industry, transforming the way vehicles are designed, operated, and maintained. This technology, which combines the principles of optics with silicon-based integrated circuits, offers numerous advantages in the automotive sector. As in modern vehicles, there is a growing demand for high-speed data transmission and communication between onboard sensors, control units, and external networks, silicone photonics is gaining huge momentum. Thus, in the upcoming years, as the silicone photonics market advances, it’ll likely play a crucial role in shaping the future of transportation.
 In 2022, North America dominated the silicon photonics market due it rise in demand across number of data centers and and cloud service providers. Silicon photonics is being increasingly adopted in these facilities to enable high-speed optical interconnects between data center components. This helps in improving data transfer rates, reducing latency, and enhancing overall data center performance.
Additionally, the United States is a leader in high-performance computing (HPC), with applications in research, defense, and industry. Silicon photonics is crucial in HPC clusters and data centers, where rapid data transfer and low-latency communication are essential for scientific simulations and data analysis. In the upcoming North America will be a potential market for silicon photonics driven by its potential to address high-speed data communication and connectivity needs.
Competitive Landscape
The report examines the global silicon photonics market’s competitive landscape, which is characterised by a mix of established businesses, rising startups, and research institutes pushing innovation in the sector. The research also identifies and assesses significant business strategies employed by these industry leaders, such as mergers and acquisitions (M&A), affiliations, collaborations, and contracts.
List of major players in global silicon photonics market are:
- Adtran Networks
- Cisco Systems, Inc.
- Finisar Corporation
- GlobalFoundries Inc.
- Intel Corporation
- Lumentum Operations LLC
- Marvell
- Molex
- Rockley Photonics
- STMicroelectronics
- Other market participants
Global Silicon Photonics Market Report Coverage
| Report Specifications | Details |
| Market Revenue in 2022 | US$ 1.2 Million |
| Market Size Forecast by 2031 | US$ 9.2 Million |
| Growth Rate (CAGR) | 26.3% |
| Historic Data | 2015 – 2021 |
| Base Year for Estimation | 2022 |
| Forecast Period | 2023 – 2031 |
| Report Inclusions | Market Size & Estimates, Market Dynamics, Competitive Scenario, Trends, Growth Factors, Market Determinants, Key Investment Segmentation, Product/Service/Solutions Benchmarking |
| Segments Covered | By Product, By Application |
| Regions Covered | North America, Europe, Asia Pacific, Middle East & Africa, Latin America |
| Countries Covered | U.S., Canada, Mexico, Rest of North America, France, The UK, Spain, Germany, Italy, Nordic Countries (Denmark, Finland, Iceland, Sweden, Norway), Benelux Union (Belgium, The Netherlands, Luxembourg), Rest of Europe, China, Japan, India, New Zealand, Australia, South Korea, Southeast Asia (Indonesia, Thailand, Malaysia, Singapore, Rest of Southeast Asia), Rest of Asia Pacific, Saudi Arabia, UAE, Egypt, Kuwait, South Africa, Rest of Middle East & Africa, Brazil, Argentina, Rest of Latin America |
| Key Players | Adtran Networks, Cisco Systems, Inc., Finisar Corporation, GlobalFoundries Inc., Intel Corporation, Lumentum Operations LLC, Marvell, Molex, Rockley Photonics, STMicroelectronics, Other Industry Participants |
| Customization Scope | Customization allows for the inclusion/modification of content pertaining to geographical regions, countries, and specific market segments. |
| Pricing & Procurement Options | Explore purchase options tailored to your specific research requirements |
| Contact Details | Consult With Our Expert
Japan (Toll-Free): – +81 663-386-8111 South Korea (Toll-Free): – +82-808- 703-126 Saudi Arabia (Toll-Free): – +966 800 850 1643 United States: +1 302-232-5106 United Kingdom: +447537105080 E-mail: askanexpert@thenicheresearch.com
|
Global Silicon Photonics Market
By Product
- Optical transceivers
- Silicon Optical Modulators
- Wavelength Division Multiplexer Filters
- Silicon Photo Detectors
- Silicon Photonic Waveguides
- Others
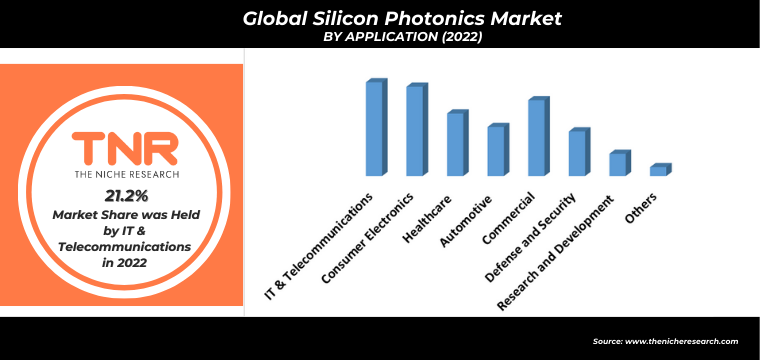
By Applications
- IT & Telecommunications
- Consumer Electronics
- Healthcare
- Automotive
- Commercial
- Defense and Security
- Research and Development
- Others
By Region
- North America (U.S., Canada, Mexico, Rest of North America)
- Europe (France, The UK, Spain, Germany, Italy, Nordic Countries (Denmark, Finland, Iceland, Sweden, Norway), Benelux Union (Belgium, The Netherlands, Luxembourg), Rest of Europe)
- Asia Pacific (China, Japan, India, New Zealand, Australia, South Korea, Southeast Asia (Indonesia, Thailand, Malaysia, Singapore, Rest of Southeast Asia), Rest of Asia Pacific)
- Middle East & Africa (Saudi Arabia, UAE, Egypt, Kuwait, South Africa, Rest of Middle East & Africa)
- Latin America (Brazil, Argentina, Rest of Latin America)
Report Coverage and Deliverables
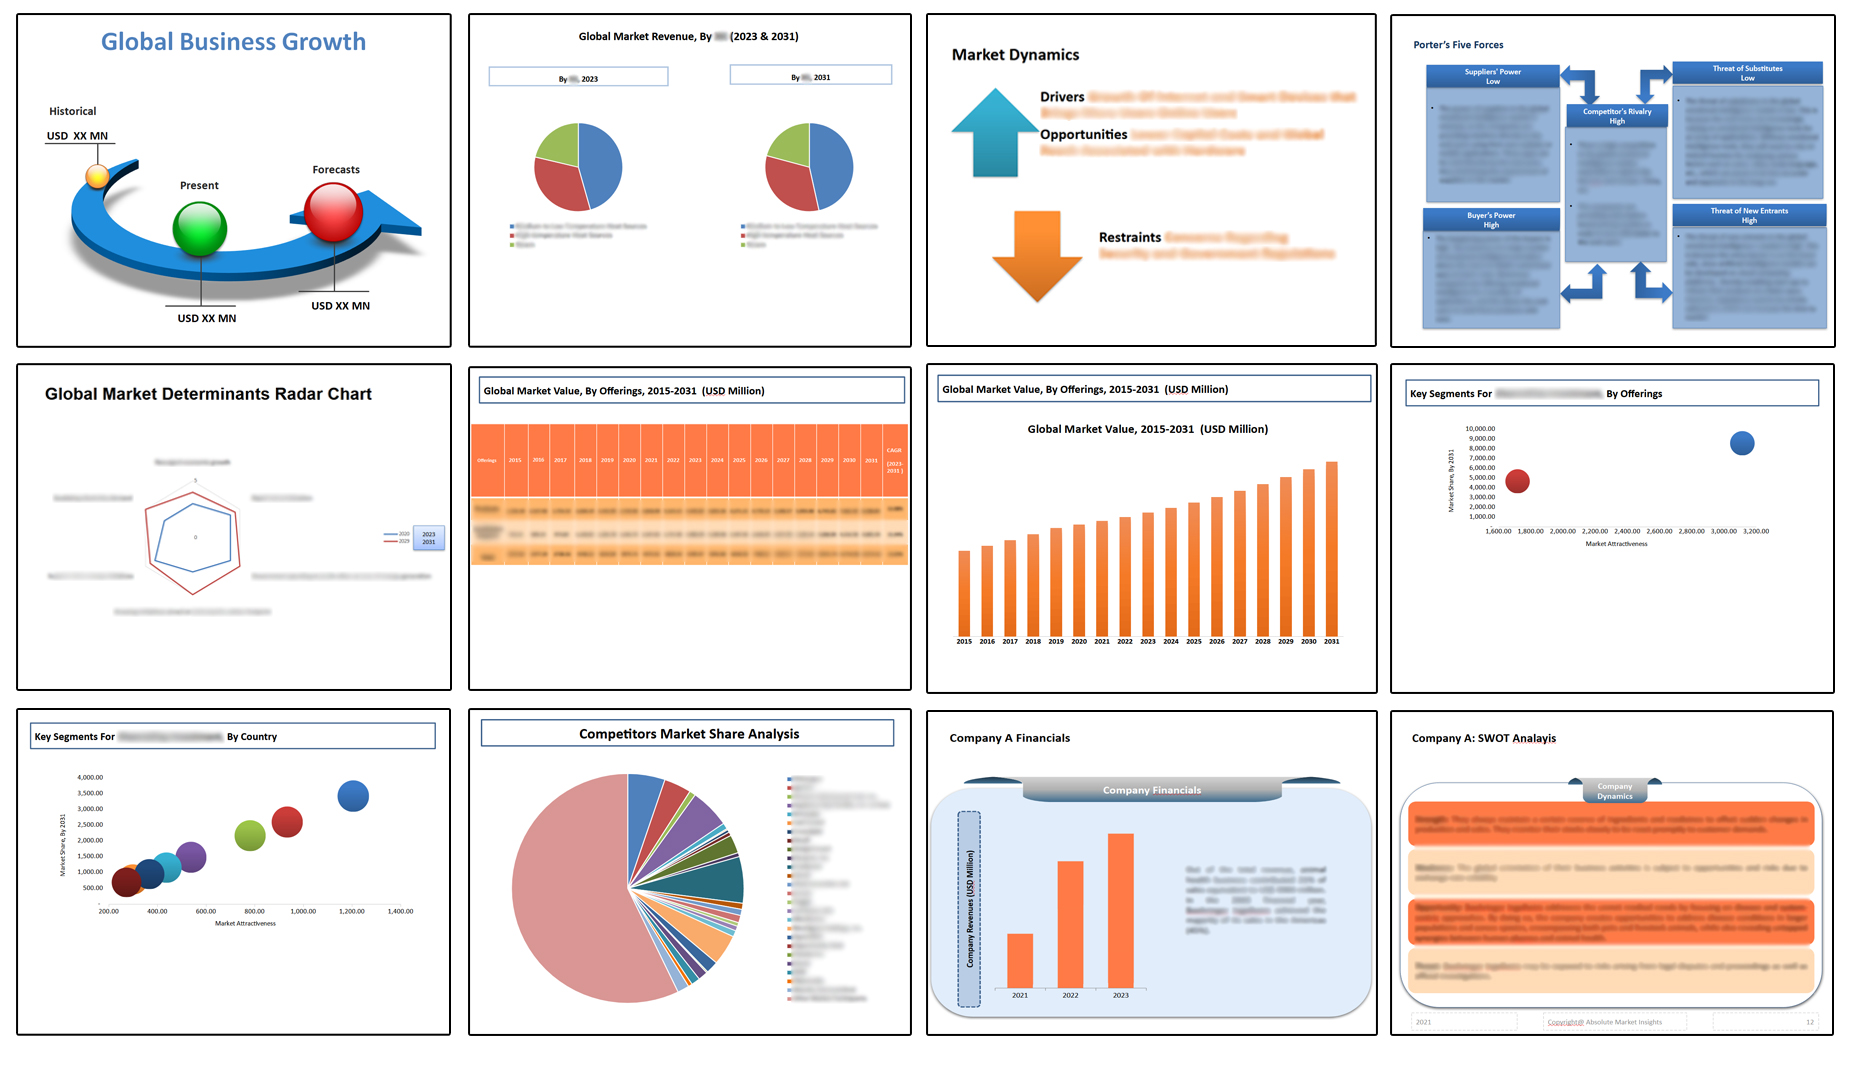
Table of Contents
Note: This ToC is tentative and can be changed according to the research study conducted during the course of report completion.
**Exclusive for Multi-User and Enterprise User.
Global Silicon Photonics Market Segmentation
By Product
By Applications
By Region
**Note: The report covers cross-segmentation analysis by region further into countries
The Niche Research approach encompasses both primary and secondary research methods to provide comprehensive insights. While primary research is the cornerstone of our studies, we also incorporate secondary research sources such as company annual reports, premium industry databases, press releases, industry journals, and white papers.
Within our primary research, we actively engage with various industry stakeholders, conducting paid interviews and surveys. Our meticulous analysis extends to every market participant in major countries, allowing us to thoroughly examine their portfolios, calculate market shares, and segment revenues.
Our data collection primarily focuses on individual countries within our research scope, enabling us to estimate regional market sizes. Typically, we employ a bottom-up approach, meticulously tracking trends in different countries. We analyze growth drivers, constraints, technological innovations, and opportunities for each country, ultimately arriving at regional figures.Our process begins by examining the growth prospects of each country. Building upon these insights, we project growth and trends for the entire region. Finally, we utilize our proprietary model to refine estimations and forecasts.
Our data validation standards are integral to ensuring the reliability and accuracy of our research findings. Here’s a breakdown of our data validation processes and the stakeholders we engage with during our primary research:
- Supply Side Analysis: We initiate a supply side analysis by directly contacting market participants, through telephonic interviews and questionnaires containing both open-ended and close-ended questions. We gather information on their portfolios, segment revenues, developments, and growth strategies.
- Demand Side Analysis: To gain insights into adoption trends and consumer preferences, we reach out to target customers and users (non-vendors). This information forms a vital part of the qualitative analysis section of our reports, covering market dynamics, adoption trends, consumer behavior, spending patterns, and other related aspects.
- Consultant Insights: We tap into the expertise of our partner consultants from around the world to obtain their unique viewpoints and perspectives. Their insights contribute to a well-rounded understanding of the markets under investigation.
- In-House Validation: To ensure data accuracy and reliability, we conduct cross-validation of data points and information through our in-house team of consultants and utilize advanced data modeling tools for thorough verification.
The forecasts we provide are based on a comprehensive assessment of various factors, including:
- Market Trends and Past Performance (Last Five Years): We accurately analyze market trends and performance data from preceding five years to identify historical patterns and understand the market’s evolution.
- Historical Performance and Growth of Market Participants: We assess the historical performance and growth trajectories of key market participants. This analysis provides insights into the competitive landscape and individual company strategies.
- Market Determinants Impact Analysis (Next Eight Years): We conduct a rigorous analysis of the factors that are projected to influence the market over the next eight years. This includes assessing both internal and external determinants that can shape market dynamics.
- Drivers and Challenges for the Forecast Period:Identify the factors expected to drive market growth during the forecast period, as well as the challenges that the industry may face. This analysis aids in deriving an accurate growth rate projection.
- New Acquisitions, Collaborations, or Partnerships: We keep a close watch on any new acquisitions, collaborations, or partnerships within the industry. These developments can have a significant impact on market dynamics and competitiveness.
- Macro and Micro Factors Analysis:A thorough examination of both macro-level factors (e.g., economic trends, regulatory changes) and micro-level factors (e.g., technological advancements, consumer preferences) that may influence the market during the forecast period.
- End-User Sentiment Analysis: To understand the market from the end-user perspective, we conduct sentiment analysis. This involves assessing the sentiment, preferences, and feedback of the end-users, which can provide valuable insights into market trends.
- Perspective of Primary Participants: Insights gathered directly from primary research participants play a crucial role in shaping our forecasts. Their perspectives and experiences provide valuable qualitative data.
- Year-on-Year Growth Trend: We utilize a year-on-year growth trend based on historical market growth and expected future trends. This helps in formulating our growth projections, aligning them with the market’s historical performance.
Research process adopted by TNR involves multiple stages, including data collection, validation, quality checks, and presentation. It’s crucial that the data and information we provide add value to your existing market understanding and expertise. We have also established partnerships with business consulting, research, and survey organizations across regions and globally to collaborate on regional analysis and data validation, ensuring the highest level of accuracy and reliability in our reports.