Global Smart TV Market: By Screen Shape, By Operating System, By Resolution, By Screen Size, By Technology, By Distribution Channel, By Region & Segmental Insights Trends and Forecast, 2024 – 2034
- Industry: Semiconductors & Electronics
- Report ID: TNR-110-1122
- Number of Pages: 420
- Table/Charts : Yes
- June, 2024
- Base Year : 2024
- No. of Companies : 10+
- No. of Countries : 29
- Views : 10218
- Covid Impact Covered: Yes
- War Impact Covered: Yes
- Formats : PDF, Excel, PPT
A smart TV is an advanced television set integrated with internet connectivity and interactive web features, allowing users to stream content, browse the web, and access a wide range of applications. Unlike traditional TVs, smart TVs come equipped with operating systems similar to those found in smartphones and computers, such as Android TV, webOS, or Tizen. This integration enables users to download and use various apps from app stores, stream movies and shows from services like Netflix, Hulu, and Amazon Prime, and even play games. Smart TVs also often include voice recognition capabilities, enabling hands-free control via virtual assistants like Amazon Alexa, Google Assistant, or Samsung Bixby.
They typically support connectivity with other smart home devices, creating a cohesive and convenient ecosystem. The ability to mirror or cast content from smartphones, tablets, or computers further enhances their functionality, making smart TVs a versatile hub for entertainment and digital interaction in modern households.
The demand for smart TVs is driven by several key factors. The increasing availability of high-speed internet allows consumers to stream high-definition and 4K content from platforms like Netflix and Amazon Prime. Technological advancements, such as enhanced display technologies (OLED, QLED) and integration of AI for personalized recommendations, make smart TVs highly appealing.
The shift in consumer preferences towards on-demand content over traditional broadcasting further boosts demand. Rising disposable incomes and competitive pricing have made smart TVs more accessible to a wider audience. Additionally, smart features like voice control, app integration, and seamless connectivity with other smart home devices add significant value, driving consumer interest and adoption in the global market.
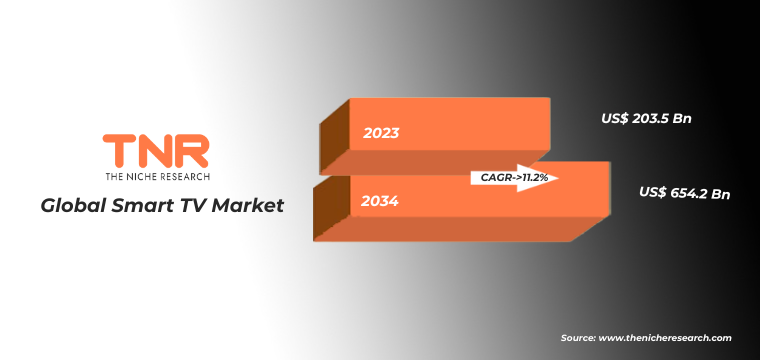
In terms of revenue, the global smart TV market was worth US$ 203.5 Bn in 2023, anticipated to witness CAGR of 11.2%during 2024 – 2034.
Global Smart TV Market Dynamics
Technological Advancements: Innovations in display technology, such as OLED, QLED, and 4K/8K resolutions, are enhancing viewing experiences and driving consumer interest. Smart features like voice control, AI integration, and IoT connectivity are making smart TVs more appealing. The rise in high-speed internet availability worldwide is enabling more households to access and stream online content, thus boosting the demand for smart TVs.
Rising Disposable Incomes: Economic growth in emerging markets has led to higher disposable incomes, enabling more consumers to afford advanced home entertainment systems, including smart TVs. Various government initiatives promoting digitalization and the transition to digital broadcasting are contributing to the growth of the smart TV market. Subsidies and incentives for purchasing digital devices in certain regions also play a role.
Competitive Pricing and Variety: Increased competition among manufacturers has led to more affordable pricing and a wider range of options, making smart TVs accessible to a broader audience. The trend towards minimalism and the demand for multifunctional devices are influencing consumers to choose smart TVs that offer both superior picture quality and smart functionalities.
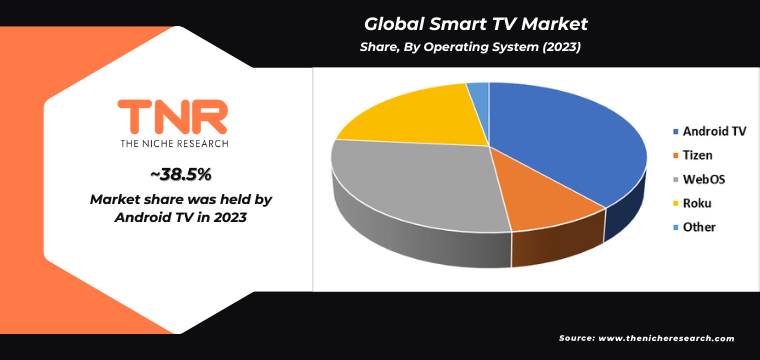
Android Segment Has Garnered Major Market Share in the Global Smart TV Market During the Forecast Period (2024 – 2034).
The growing demand for Android smart TVs is driven by several key factors. One of the primary drivers is the seamless integration with the Android ecosystem, which allows users to access a vast array of apps, games, and services available on the Google Play Store. This extensive app compatibility ensures that Android smart TVs can meet diverse entertainment and productivity needs, making them highly versatile. Additionally, the user-friendly interface and frequent software updates provided by Google enhance the overall user experience, keeping the system up-to-date with the latest features and security improvements.
The popularity of Android smartphones also plays a significant role, as consumers are more inclined to choose smart TVs that offer a familiar operating system and easy synchronization with their mobile devices. Moreover, competitive pricing and a wide range of options from various manufacturers make Android smart TVs accessible to a broad consumer base. These factors collectively drive the growing adoption of Android smart TVs in the market.
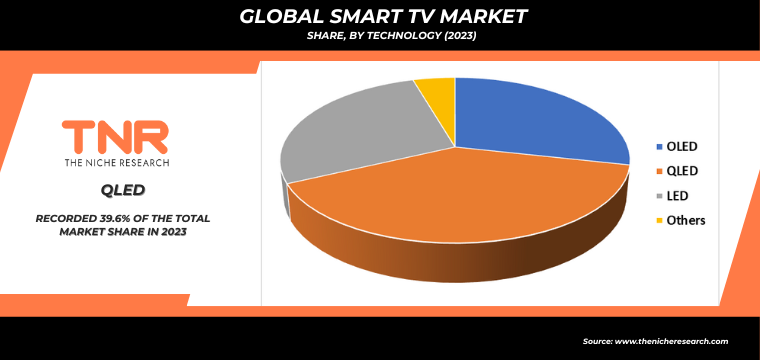
By Technology QLED Segment had the Highest Share in the Global Smart TV Market in 2023.
QLED technology, which utilizes quantum dots to enhance brightness and color accuracy, offers a superior viewing experience compared to traditional LED TVs. This technological advancement is a significant draw for consumers seeking high-quality home entertainment. The increasing availability of high-definition and 4K content on streaming platforms amplifies the need for advanced display technologies like QLED, which can deliver the full visual impact of these formats.
Moreover, smart features integrated into QLED TVs, such as voice control, personalized content recommendations, and seamless integration with other smart home devices, are attracting tech-savvy consumers. The ongoing trend of upgrading home entertainment systems, fueled by rising disposable incomes and greater digital content consumption, further boosts QLED TV sales. As consumers prioritize both cutting-edge picture quality and smart functionalities, QLED smart TVs are becoming a popular choice in the market.
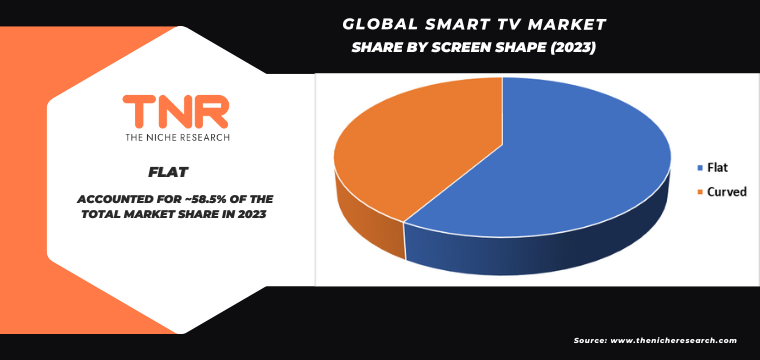
By Screen Shape Flat TV Segment had the Highest Share in the Global Smart TV Market in 2023.
Flat smart TVs are known for their sleek, modern design, which fits seamlessly into any home decor, making them a popular choice for aesthetically conscious consumers. Their slim profile allows for easy wall mounting, maximizing living space and providing a clean, uncluttered look. The advancements in display technology have significantly improved the picture quality of flat smart TVs, offering vivid colors, sharp images, and better viewing angles. Coupled with the increasing availability of high-definition and 4K content on streaming platforms, consumers are motivated to upgrade to these enhanced viewing experiences.
Additionally, the integration of smart features such as voice control, app access, and connectivity with other smart home devices adds significant value. The convenience of accessing streaming services, internet browsing, and home automation through a single device appeals to tech-savvy users. These combined factors are driving the robust demand for flat smart TVs.
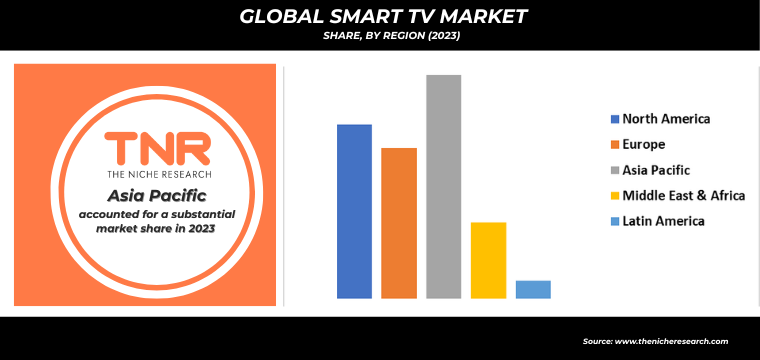
By Region, Asia Pacific Dominated the Global Smart TV Market in 2023.
The Asia-Pacific region is witnessing a robust growth in the demand for smart TVs, driven by several key factors. Rapid urbanization and increasing disposable incomes are enabling more households to afford advanced home entertainment systems. The rise of digital content consumption, fueled by the proliferation of streaming services like Netflix, Amazon Prime, and regional platforms, has significantly boosted the appeal of smart TVs.
Additionally, the integration of AI and IoT technologies is enhancing user experiences through features like voice control, personalized content recommendations, and seamless connectivity with other smart devices. Governments across the region are also promoting digital infrastructure development, improving internet penetration, and supporting the shift to digital broadcasting, further propelling smart TV adoption. These combined elements are creating a fertile market for smart TVs, making the Asia-Pacific a pivotal area for manufacturers and service providers looking to capitalize on the growing appetite for connected home entertainment solutions.
Competitive Landscape: Global Smart TV Market:
- Haier Inc.
- Hisense International
- Intex Technologies
- Koninklijke Philips N.V
- LG Electronics Inc
- Panasonic Corporation
- Samsung Electronics Co. Ltd
- Sansui Electric Co. Ltd
- Sony Corporation
- TCL Electronics Holdings Limited
- Toshiba Visual Solutions
- Other Industry Participants
Global Smart TV Market Scope
| Report Specifications | Details |
| Market Revenue in 2023 | US$ 203.5 Bn |
| Market Size Forecast by 2034 | US$ 654.2 Bn |
| Growth Rate (CAGR) | 11.2% |
| Historic Data | 2016 – 2022 |
| Base Year for Estimation | 2023 |
| Forecast Period | 2024 – 2034 |
| Report Inclusions | Market Size & Estimates, Market Dynamics, Competitive Scenario, Trends, Growth Factors, Market Determinants, Key Investment Segmentation, Product/Service/Solutions Benchmarking |
| Segments Covered | By Screen Shape, By Operating System, By Resolution, By Screen Size, By Technology, By Distribution Channel, By Region |
| Regions Covered | North America, Europe, Asia Pacific, Middle East & Africa, Latin America |
| Countries Covered | U.S., Canada, Mexico, Rest of North America, France, The UK, Spain, Germany, Italy, Nordic Countries (Denmark, Finland, Iceland, Sweden, Norway), Benelux Union (Belgium, The Netherlands, Luxembourg), Rest of Europe, China, Japan, India, New Zealand, Australia, South Korea, Southeast Asia (Indonesia, Thailand, Malaysia, Singapore, Rest of Southeast Asia), Rest of Asia Pacific, Saudi Arabia, UAE, Egypt, Kuwait, South Africa, Rest of Middle East & Africa, Brazil, Argentina, Rest of Latin America |
| Key Players | Haier Inc., Hisense International, Intex Technologies, Koninklijke Philips N.V, LG Electronics Inc, Panasonic Corporation, Samsung Electronics Co. Ltd, Sansui Electric Co. Ltd, Sony Corporation, TCL Electronics Holdings Limited, Toshiba Visual Solutions |
| Customization Scope | Customization allows for the inclusion/modification of content pertaining to geographical regions, countries, and specific market segments. |
| Pricing & Procurement Options | Explore purchase options tailored to your specific research requirements |
| Contact Details | Consult With Our Expert
Japan (Toll-Free): +81 663-386-8111 South Korea (Toll-Free): +82-808- 703-126 Saudi Arabia (Toll-Free): +966 800-850-1643 United Kingdom: +44 753-710-5080 United States: +1 302-232-5106 E-mail: askanexpert@thenicheresearch.com
|
Global Smart TV Market
By Screen Shape
- Flat
- Curved
By Operating System
- Android TV
- Tizen
- WebOS
- Roku
- Other
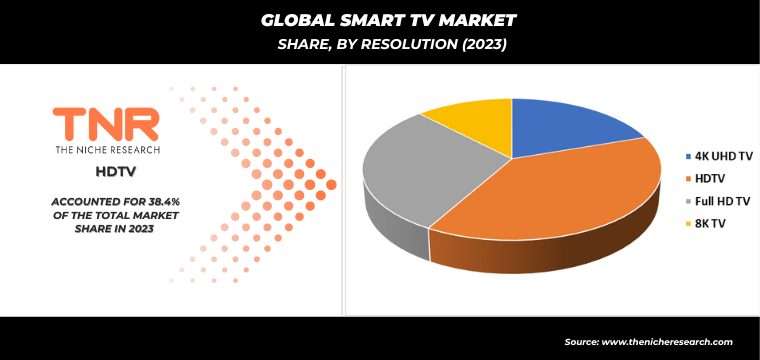
By Resolution
- 4K UHD TV
- HDTV
- Full HD TV
- 8K TV
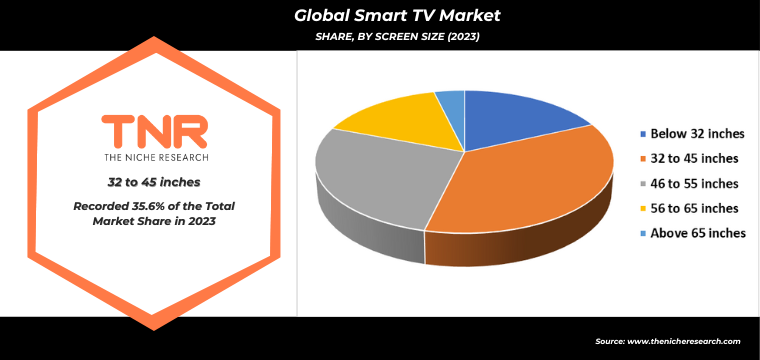
By Screen Size
- Below 32 inches
- 32 to 45 inches
- 46 to 55 inches
- 56 to 65 inches
- Above 65 inches
By Technology
- OLED
- QLED
- LED
- Others
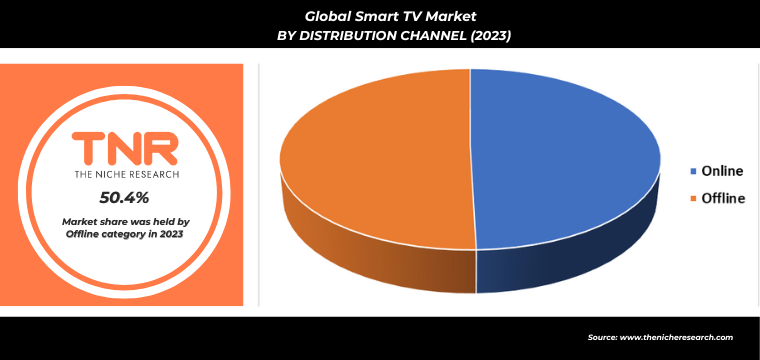
By Distribution Channel
- Online
- Offline
By Region
- North America (U.S., Canada, Mexico, Rest of North America)
- Europe (France, The UK, Spain, Germany, Italy, Nordic Countries (Denmark, Finland, Iceland, Sweden, Norway), Benelux Union (Belgium, The Netherlands, Luxembourg), Rest of Europe)
- Asia Pacific (China, Japan, India, New Zealand, Australia, South Korea, Southeast Asia (Indonesia, Thailand, Malaysia, Singapore, Rest of Southeast Asia), Rest of Asia Pacific)
- Middle East & Africa (Saudi Arabia, UAE, Egypt, Kuwait, South Africa, Rest of Middle East & Africa)
- Latin America (Brazil, Argentina, Rest of Latin America)
Report Layout:
Table of Contents
Note: This ToC is tentative and can be changed according to the research study conducted during the course of report completion.
**Exclusive for Multi-User and Enterprise User.
Global Smart TV Market
By Screen Shape
- Flat
- Curved
By Operating System
- Android TV
- Tizen
- WebOS
- Roku
- Other
By Resolution
- 4K UHD TV
- HDTV
- Full HD TV
- 8K TV
By Screen Size
- Below 32 inches
- 32 to 45 inches
- 46 to 55 inches
- 56 to 65 inches
- Above 65 inches
By Technology
- OLED
- QLED
- LED
- Others
By Distribution Channel
- Online
- Offline
By Region
- North America (U.S., Canada, Mexico, Rest of North America)
- Europe (France, The UK, Spain, Germany, Italy, Nordic Countries (Denmark, Finland, Iceland, Sweden, Norway), Benelux Union (Belgium, The Netherlands, Luxembourg), Rest of Europe)
- Asia Pacific (China, Japan, India, New Zealand, Australia, South Korea, Southeast Asia (Indonesia, Thailand, Malaysia, Singapore, Rest of Southeast Asia), Rest of Asia Pacific)
- Middle East & Africa (Saudi Arabia, UAE, Egypt, Kuwait, South Africa, Rest of Middle East & Africa)
- Latin America (Brazil, Argentina, Rest of Latin America)
The Niche Research approach encompasses both primary and secondary research methods to provide comprehensive insights. While primary research is the cornerstone of our studies, we also incorporate secondary research sources such as company annual reports, premium industry databases, press releases, industry journals, and white papers.
Within our primary research, we actively engage with various industry stakeholders, conducting paid interviews and surveys. Our meticulous analysis extends to every market participant in major countries, allowing us to thoroughly examine their portfolios, calculate market shares, and segment revenues.
Our data collection primarily focuses on individual countries within our research scope, enabling us to estimate regional market sizes. Typically, we employ a bottom-up approach, meticulously tracking trends in different countries. We analyze growth drivers, constraints, technological innovations, and opportunities for each country, ultimately arriving at regional figures.Our process begins by examining the growth prospects of each country. Building upon these insights, we project growth and trends for the entire region. Finally, we utilize our proprietary model to refine estimations and forecasts.
Our data validation standards are integral to ensuring the reliability and accuracy of our research findings. Here’s a breakdown of our data validation processes and the stakeholders we engage with during our primary research:
- Supply Side Analysis: We initiate a supply side analysis by directly contacting market participants, through telephonic interviews and questionnaires containing both open-ended and close-ended questions. We gather information on their portfolios, segment revenues, developments, and growth strategies.
- Demand Side Analysis: To gain insights into adoption trends and consumer preferences, we reach out to target customers and users (non-vendors). This information forms a vital part of the qualitative analysis section of our reports, covering market dynamics, adoption trends, consumer behavior, spending patterns, and other related aspects.
- Consultant Insights: We tap into the expertise of our partner consultants from around the world to obtain their unique viewpoints and perspectives. Their insights contribute to a well-rounded understanding of the markets under investigation.
- In-House Validation: To ensure data accuracy and reliability, we conduct cross-validation of data points and information through our in-house team of consultants and utilize advanced data modeling tools for thorough verification.
The forecasts we provide are based on a comprehensive assessment of various factors, including:
- Market Trends and Past Performance (Last Five Years): We accurately analyze market trends and performance data from preceding five years to identify historical patterns and understand the market’s evolution.
- Historical Performance and Growth of Market Participants: We assess the historical performance and growth trajectories of key market participants. This analysis provides insights into the competitive landscape and individual company strategies.
- Market Determinants Impact Analysis (Next Eight Years): We conduct a rigorous analysis of the factors that are projected to influence the market over the next eight years. This includes assessing both internal and external determinants that can shape market dynamics.
- Drivers and Challenges for the Forecast Period:Identify the factors expected to drive market growth during the forecast period, as well as the challenges that the industry may face. This analysis aids in deriving an accurate growth rate projection.
- New Acquisitions, Collaborations, or Partnerships: We keep a close watch on any new acquisitions, collaborations, or partnerships within the industry. These developments can have a significant impact on market dynamics and competitiveness.
- Macro and Micro Factors Analysis:A thorough examination of both macro-level factors (e.g., economic trends, regulatory changes) and micro-level factors (e.g., technological advancements, consumer preferences) that may influence the market during the forecast period.
- End-User Sentiment Analysis: To understand the market from the end-user perspective, we conduct sentiment analysis. This involves assessing the sentiment, preferences, and feedback of the end-users, which can provide valuable insights into market trends.
- Perspective of Primary Participants: Insights gathered directly from primary research participants play a crucial role in shaping our forecasts. Their perspectives and experiences provide valuable qualitative data.
- Year-on-Year Growth Trend: We utilize a year-on-year growth trend based on historical market growth and expected future trends. This helps in formulating our growth projections, aligning them with the market’s historical performance.
Research process adopted by TNR involves multiple stages, including data collection, validation, quality checks, and presentation. It’s crucial that the data and information we provide add value to your existing market understanding and expertise. We have also established partnerships with business consulting, research, and survey organizations across regions and globally to collaborate on regional analysis and data validation, ensuring the highest level of accuracy and reliability in our reports.