Global Solar Powered Cars Market By Type, By Solar Panel, By Car Type, By Battery Type, By Application, By Region & Segmental Insights Trends and Forecast, By Value (US$ Bn) & By Volume (Mn Units)- 2024 – 2034
- Industry: Automotive & Transportation
- Report ID: TNR-110-1315
- Number of Pages: 420
- Table/Charts : Yes
- September, 2024
- Base Year : 2024
- No. of Companies : 10+
- No. of Countries : 29
- Views : 10068
- Covid Impact Covered: Yes
- War Impact Covered: Yes
- Formats : PDF, Excel, PPT
Solar-powered cars harness energy from the sun using photovoltaic (PV) cells embedded in their surfaces. These cars offer a sustainable transportation solution, helping reduce reliance on fossil fuels. The solar-powered car market is gaining traction due to the rise in eco-friendly initiatives across various sectors such as transportation, logistics, and agriculture.
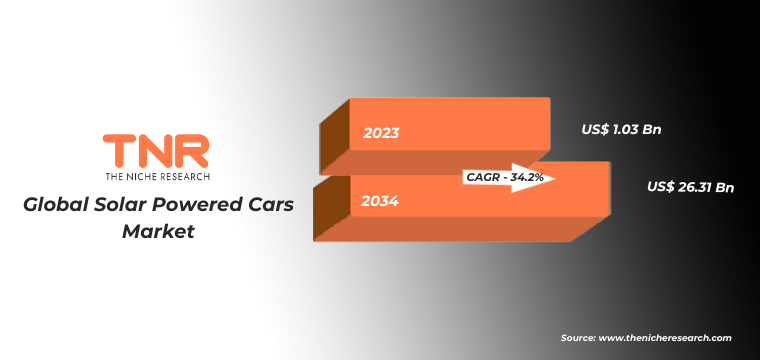
For instance, Lightyear 0, introduced in 2022, is a solar-powered vehicle designed for everyday use, demonstrating how solar technology can power personal mobility. Additionally, solar cars are essential in day-to-day life as they lower emissions and contribute to reducing air pollution. In agriculture, solar-powered vehicles are used for farming operations, like tractors. “In terms of revenue, the global Solar Powered Cars Market was worth US$ 1.03 Bn in 2023, anticipated to witness a CAGR of 34.2% during 2024 – 2034”. As solar energy is renewable, solar-powered cars have a minimal carbon footprint, making them an environmentally friendly alternative to traditional vehicles.
Comparison Between Normal Cars and Solar Powered Cars
| Feature | Normal Cars | Solar Powered Cars |
| Fuel Source | Depend on fossil fuels like gasoline or diesel. | Powered by solar energy harnessed through photovoltaic panels. |
| Environmental Impact | Emit CO2 and other harmful pollutants, contributing to global warming. | Minimal to zero emissions, reducing carbon footprint significantly. |
| Fuel Costs | Prone to fluctuations in fuel prices. | Free energy from the sun, significantly reducing fuel costs. |
| Maintenance | Requires regular maintenance for engines, oil changes, etc. | Fewer moving parts, leading to lower maintenance needs. |
| Range | Long range with access to fuel stations. | Currently limited range, though improving (e.g., Lightyear 0, 2022). |
| Performance in Bad Weather | Unaffected by weather conditions. | Performance can be reduced in cloudy or low sunlight conditions. |
| Examples | Toyota Corolla (2023) with gasoline engine. | Lightyear 0 (2022) and Aptera (2021), both solar-powered models. |
| Refueling Time | Quick refueling at gas stations. | Slower charging, though some models like Lightyear 0 offer solar-assisted charging. |
| Carbon Emissions | Significant CO2 emissions from fuel combustion. | Near-zero emissions due to renewable solar power use. |
| Cost | Wide range of prices based on model and fuel type. | Higher upfront costs due to solar technology, but lower running costs. |
Global Solar Powered Cars Market Dynamics
Global Solar Powered Cars Market Growth Drivers:
- Rising Demand for Sustainable Transportation: The increasing focus on reducing carbon emissions is driving the adoption of solar-powered cars. Governments worldwide are implementing eco-friendly policies, such as the EU’s Green Deal (2020), encouraging innovations like Lightyear 0 (2022), a solar-powered car, to promote clean transportation solutions.
- Advancements in Solar Technology: Technological innovations in photovoltaic cells and battery efficiency are accelerating the growth of the solar-powered car market. For example, companies like Aptera (2021) have developed cars that use ultra-efficient solar panels, enhancing the performance and driving range of these vehicles, thus attracting environmentally conscious consumers.
Global Solar Powered Cars Market Restraints:
- Limited Driving Range in Low Sunlight Conditions: Solar-powered cars struggle in regions with minimal sunlight, reducing their efficiency. For instance, in countries with prolonged winters like Norway, even advanced models like Lightyear 0 (2022) face performance limitations due to the lack of consistent sunlight, restricting widespread adoption.
- High Initial Costs of Solar Vehicles: The high cost of solar-powered cars, driven by expensive photovoltaic technology, acts as a restraint. Models like Lightyear 0 (2022) and Aptera (2021) come with steep price tags, making them less accessible compared to traditional vehicles, limiting their appeal to a niche, eco-conscious market.
Global Solar Powered Cars Market Opportunities:
- Growing Focus on Renewable Energy Initiatives: Government initiatives promoting renewable energy create opportunities for solar-powered cars. For instance, the U.S. Clean Energy Plan (2021) encourages the shift to eco-friendly technologies, opening doors for manufacturers like Aptera (2021) to develop affordable solar vehicles and expand their market reach.
- Expansion in Emerging Markets: Emerging economies like India and Brazil, with abundant sunlight, present vast opportunities for solar-powered cars. For example, the Indian government’s push for electric vehicles under the Faster Adoption of Manufacturing of Hybrid and Electric Vehicles (FAME) scheme (2021) can foster the growth of solar-powered vehicles in the region.
Global Solar Powered Cars Market Trends:
- Integration of Solar Panels with Electric Vehicles: The integration of solar panels into electric vehicles (EVs) is a rising trend. For example, Hyundai’s Sonata Hybrid (2020) features a solar roof that extends battery range, signaling a growing interest in combining solar technology with EVs for enhanced sustainability and efficiency.
- Advancements in Lightweight Materials: To improve efficiency, solar-powered cars are adopting lightweight materials. Aptera’s solar car (2021) uses aerospace-grade composites, reducing weight and maximizing energy use from solar panels. This trend of using innovative materials is helping extend the range and performance of solar vehicles in various driving conditions.
Global Solar Powered Cars Market Segmental Analysis:
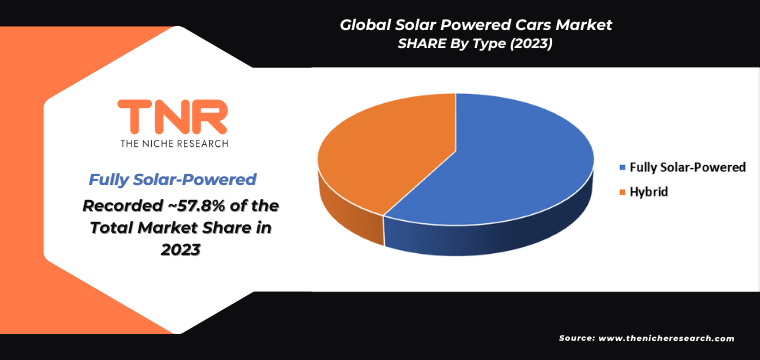
Solar Powered Cars Market By Type
- Fully Solar-Powered
- Hybrid
In 2023, fully solar-powered cars dominated the global market with a significant 57.8% revenue share, reflecting the growing preference for zero-emission vehicles. Models like Lightyear 0 (2022) and Aptera (2021) showcased the potential of fully solar-powered cars by offering extended driving ranges through efficient solar panel systems. The demand for these vehicles is driven by increasing environmental concerns and government initiatives, positioning fully solar-powered cars as a key segment in the push for sustainable transportation solutions.
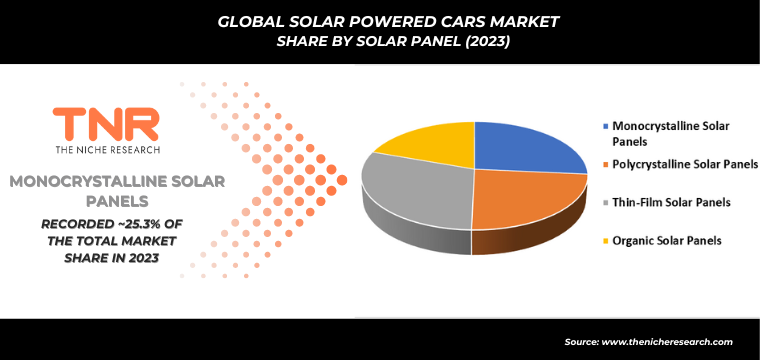
Solar Powered Cars Market By Solar Panel
- Monocrystalline Solar Panels
- Polycrystalline Solar Panels
- Thin-Film Solar Panels
- Organic Solar Panels
- Others
Polycrystalline solar panels segment is projected to be the fastest-growing segment in the global solar powered cars market, capturing a notable revenue share of 22.9%. These panels, known for their cost-effectiveness and efficiency, are increasingly used in models like the Lightyear 0 (2022). As manufacturers seek to optimize performance while reducing production costs, polycrystalline panels provide a viable solution, driving adoption and innovation in solar-powered vehicles and contributing to a more sustainable automotive industry.
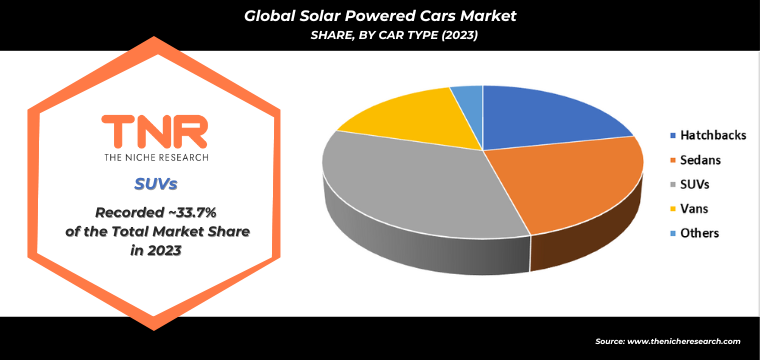
Solar Powered Cars Market By Car Type
- Hatchbacks
- Sedans
- SUVs
- Vans
- Others
SUVs dominated the global solar powered cars market in 2023, commanding a significant revenue share of 33.7%. This dominance can be attributed to the increasing consumer preference for larger vehicles that offer versatility and space. Models like the Aptera (2021), designed as a solar-powered SUV, exemplify this trend by combining eco-friendliness with practicality. Additionally, established automakers, such as Hyundai with their solar-assisted Santa Fe, are entering this segment, further enhancing the appeal of solar technology in the SUV market while addressing sustainability concerns.
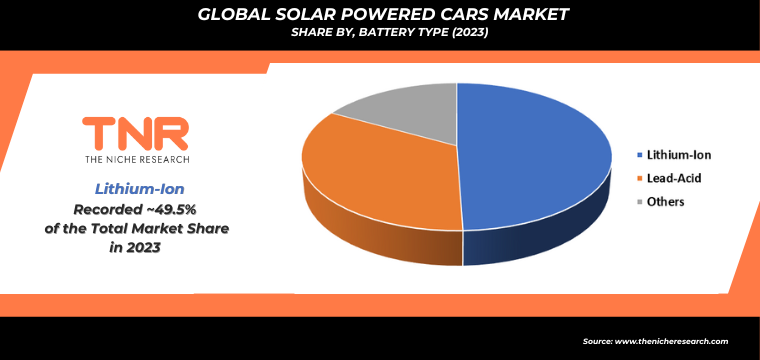
Solar Powered Cars Market By Battery Type
- Lithium-Ion
- Lead-Acid
- Others
In 2023, lead-acid emerged as the second-largest segment in the global solar powered cars market, holding a substantial revenue share of 33.7% These batteries are favored for their reliability and affordability, making them a popular choice in entry-level solar vehicles. For example, models like the Solar Electric Vehicle (SEV) utilize lead-acid batteries for efficient energy storage. While advancements in lithium-ion technology are gaining traction, lead-acid remains a practical option, especially for manufacturers aiming to keep costs low while promoting solar mobility.
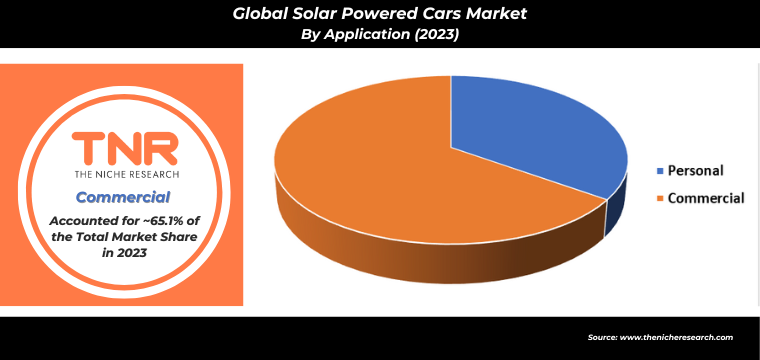
Solar Powered Cars Market By Application
- Personal
- Commercial
Commercial led the global solar powered cars market in 2023, capturing a significant revenue share of 65.1%. This growth is driven by the rising demand for sustainable transportation solutions in logistics and public transportation. Companies like Amazon are exploring solar-powered delivery vans to reduce emissions, while municipal transit systems, such as the Los Angeles Metro, have begun integrating solar-powered buses into their fleets. These initiatives highlight the potential of solar technology to enhance operational efficiency and environmental sustainability in commercial applications.
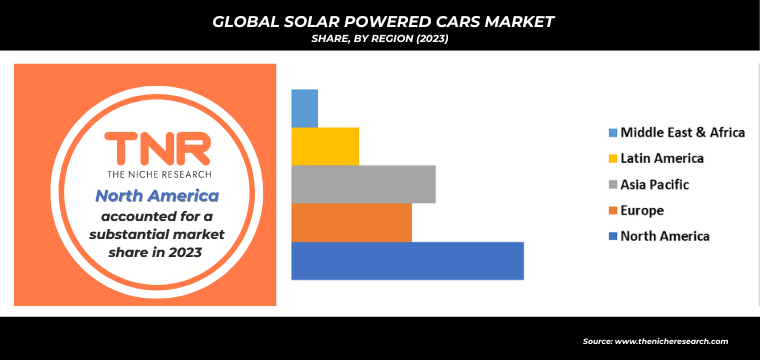
Solar Powered Cars Market By Region
- North America (U.S., Canada, Mexico, Rest of North America)
- Europe (France, The UK, Spain, Germany, Italy, Nordic Countries (Denmark, Finland, Iceland, Sweden, Norway), Benelux Union (Belgium, The Netherlands, Luxembourg), Rest of Europe)
- Asia Pacific (China, Japan, India, New Zealand, Australia, South Korea, Southeast Asia (Indonesia, Thailand, Malaysia, Singapore, Rest of Southeast Asia), Rest of Asia Pacific)
- Middle East & Africa (Saudi Arabia, UAE, Egypt, Kuwait, South Africa, Rest of Middle East & Africa)
- Latin America (Brazil, Argentina, Rest of Latin America)
Europe is projected to be the fastest-growing region in the solar powered cars market during the forecast period, driven by stringent environmental regulations and strong government incentives. Countries like Germany and the Netherlands are leading the charge with initiatives such as Germany’s “Climate Protection Program” (2021), promoting electric and solar vehicles. Additionally, manufacturers like Lightyear are establishing production facilities in the region, enhancing local supply chains. The European focus on sustainability and innovation positions the region as a key player in advancing solar-powered automotive technology.
Competitive Landscape
Innovations in the global solar-powered cars market are centered around advanced photovoltaic technology, lightweight materials, and integrated energy management systems. For instance, the Lightyear 0 (2022) utilizes high-efficiency solar panels to extend its driving range significantly.
Competition is intensifying as established automakers like Hyundai and Toyota explore solar technology integration, exemplified by Hyundai’s Sonata Hybrid, which features solar roof technology. New entrants, such as Aptera (2021), are also vying for market share with their unique designs and sustainability focus. This dynamic landscape fosters rapid advancements, enhancing vehicle efficiency and appealing to eco-conscious consumers globally.
- In January 2023, Toyota announced plans to incorporate solar panel technology into the RAV4 model, enhancing its hybrid offerings with renewable energy capabilities to support its sustainability goals.
- In March 2023, Hyundai expanded its hybrid vehicle lineup by integrating solar panels into the Sonata Hybrid, enhancing energy efficiency and battery performance through innovative solar technology.
Global Solar Powered Cars Market Scope:
| Report Specifications | Details |
| Market Revenue in 2023 | US$ 1.03 Bn |
| Market Size Forecast by 2034 | US$ 26.31 Bn |
| Growth Rate (CAGR) | 34.2% |
| Historic Data | 2018 – 2022 |
| Base Year for Estimation | 2023 |
| Forecast Period | 2024 – 2034 |
| Report Inclusions | Market Size & Estimates, Market Dynamics, Competitive Scenario, Trends, Growth Factors, Market Determinants, Key Investment Segmentation, Product/Service/Solutions Benchmarking |
| Segments Covered | By Type, By Solar Panel, By Car Type, By Battery Type, By Application, By Region |
| Regions Covered | North America, Europe, Asia Pacific, Middle East & Africa, Latin America |
| Countries Covered | U.S., Canada, Mexico, Rest of North America, France, The UK, Spain, Germany, Italy, Nordic Countries (Denmark, Finland, Iceland, Sweden, Norway), Benelux Union (Belgium, The Netherlands, Luxembourg), Rest of Europe, China, Japan, India, New Zealand, Australia, South Korea, Southeast Asia (Indonesia, Thailand, Malaysia, Singapore, Rest of Southeast Asia), Rest of Asia Pacific, Saudi Arabia, UAE, Egypt, Kuwait, South Africa, Rest of Middle East & Africa, Brazil, Argentina, Rest of Latin America |
| Key Players | Audi AG, Clenergy TeamArrow, Cruise Car Inc., Ford Motor Company, General Motors, Hanergy Holding Group, Lightyear, Mahindra & Mahindra Limited, Solar Electric Vehicle Company, Sono Motors GmbH, Toyota Motor Corp, Venturi, Volkswagen AG |
| Customization Scope | Customization allows for the inclusion/modification of content pertaining to geographical regions, countries, and specific market segments. |
| Pricing & Procurement Options | Explore purchase options tailored to your specific research requirements |
| Contact Details | Consult With Our Expert
Japan (Toll-Free): +81 663-386-8111 South Korea (Toll-Free): +82-808- 703-126 Saudi Arabia (Toll-Free): +966 800-850-1643 United Kingdom: +44 753-710-5080 United States: +1 302-232-5106 E-mail: askanexpert@thenicheresearch.com
|
Some of the players operating in the solar powered cars market are:
- Audi AG
- Clenergy TeamArrow
- Cruise Car Inc.
- Ford Motor Company
- General Motors
- Hanergy Holding Group
- Lightyear
- Mahindra & Mahindra Limited
- Solar Electric Vehicle Company
- Sono Motors GmbH
- Toyota Motor Corp
- Venturi
- Volkswagen AG
- Other Industry Participants
Report Layout:
Table of Contents
Note: This ToC is tentative and can be changed according to the research study conducted during the course of report completion.
**Exclusive for Multi-User and Enterprise User.
Global Solar Powered Cars Market:
By Type
- Fully Solar-Powered
- Hybrid
By Solar Panel
- Monocrystalline Solar Panels
- Polycrystalline Solar Panels
- Thin-Film Solar Panels
- Organic Solar Panels
- Others
By Car Type
- Hatchbacks
- Sedans
- SUVs
- Vans
- Others
By Battery Type
- Lithium-Ion
- Lead-Acid
- Others
By Application
- Personal
- Commercial
By Region
- North America
- S.
- Canada
- Mexico
- Rest of North America
- Europe
- France
- The UK
- Spain
- Germany
- Italy
- Nordic Countries
- Denmark
- Finland
- Iceland
- Sweden
- Norway
- Benelux Union
- Belgium
- The Netherlands
- Luxembourg
- Rest of Europe
- Asia Pacific
- China
- Japan
- India
- New Zealand
- Australia
- South Korea
- Southeast Asia
- Indonesia
- Thailand
- Malaysia
- Singapore
- Rest of Southeast Asia
- Rest of Asia Pacific
- Middle East & Africa
- Saudi Arabia
- UAE
- Egypt
- Kuwait
- South Africa
- Rest of Middle East & Africa
- Latin America
- Brazil
- Argentina
- Rest of Latin America
The Niche Research approach encompasses both primary and secondary research methods to provide comprehensive insights. While primary research is the cornerstone of our studies, we also incorporate secondary research sources such as company annual reports, premium industry databases, press releases, industry journals, and white papers.
Within our primary research, we actively engage with various industry stakeholders, conducting paid interviews and surveys. Our meticulous analysis extends to every market participant in major countries, allowing us to thoroughly examine their portfolios, calculate market shares, and segment revenues.
Our data collection primarily focuses on individual countries within our research scope, enabling us to estimate regional market sizes. Typically, we employ a bottom-up approach, meticulously tracking trends in different countries. We analyze growth drivers, constraints, technological innovations, and opportunities for each country, ultimately arriving at regional figures.Our process begins by examining the growth prospects of each country. Building upon these insights, we project growth and trends for the entire region. Finally, we utilize our proprietary model to refine estimations and forecasts.
Our data validation standards are integral to ensuring the reliability and accuracy of our research findings. Here’s a breakdown of our data validation processes and the stakeholders we engage with during our primary research:
- Supply Side Analysis: We initiate a supply side analysis by directly contacting market participants, through telephonic interviews and questionnaires containing both open-ended and close-ended questions. We gather information on their portfolios, segment revenues, developments, and growth strategies.
- Demand Side Analysis: To gain insights into adoption trends and consumer preferences, we reach out to target customers and users (non-vendors). This information forms a vital part of the qualitative analysis section of our reports, covering market dynamics, adoption trends, consumer behavior, spending patterns, and other related aspects.
- Consultant Insights: We tap into the expertise of our partner consultants from around the world to obtain their unique viewpoints and perspectives. Their insights contribute to a well-rounded understanding of the markets under investigation.
- In-House Validation: To ensure data accuracy and reliability, we conduct cross-validation of data points and information through our in-house team of consultants and utilize advanced data modeling tools for thorough verification.
The forecasts we provide are based on a comprehensive assessment of various factors, including:
- Market Trends and Past Performance (Last Five Years): We accurately analyze market trends and performance data from preceding five years to identify historical patterns and understand the market’s evolution.
- Historical Performance and Growth of Market Participants: We assess the historical performance and growth trajectories of key market participants. This analysis provides insights into the competitive landscape and individual company strategies.
- Market Determinants Impact Analysis (Next Eight Years): We conduct a rigorous analysis of the factors that are projected to influence the market over the next eight years. This includes assessing both internal and external determinants that can shape market dynamics.
- Drivers and Challenges for the Forecast Period:Identify the factors expected to drive market growth during the forecast period, as well as the challenges that the industry may face. This analysis aids in deriving an accurate growth rate projection.
- New Acquisitions, Collaborations, or Partnerships: We keep a close watch on any new acquisitions, collaborations, or partnerships within the industry. These developments can have a significant impact on market dynamics and competitiveness.
- Macro and Micro Factors Analysis:A thorough examination of both macro-level factors (e.g., economic trends, regulatory changes) and micro-level factors (e.g., technological advancements, consumer preferences) that may influence the market during the forecast period.
- End-User Sentiment Analysis: To understand the market from the end-user perspective, we conduct sentiment analysis. This involves assessing the sentiment, preferences, and feedback of the end-users, which can provide valuable insights into market trends.
- Perspective of Primary Participants: Insights gathered directly from primary research participants play a crucial role in shaping our forecasts. Their perspectives and experiences provide valuable qualitative data.
- Year-on-Year Growth Trend: We utilize a year-on-year growth trend based on historical market growth and expected future trends. This helps in formulating our growth projections, aligning them with the market’s historical performance.
Research process adopted by TNR involves multiple stages, including data collection, validation, quality checks, and presentation. It’s crucial that the data and information we provide add value to your existing market understanding and expertise. We have also established partnerships with business consulting, research, and survey organizations across regions and globally to collaborate on regional analysis and data validation, ensuring the highest level of accuracy and reliability in our reports.