Global Thermal Interface Materials Market Insights, Growth, Share, Size: By Type, By Distribution Channel, By End User Industry, By Region & Segmental Forecast, 2023-2031, Comparative Analysis and Trends

  • Industry: Chemicals & Materials
  • Report ID: TNR-110-979
  • Number of Pages: 420
  • Table/Charts : Yes
  • December, 2023
  • Base Year : 2024
  • No. of Companies : 12+
  • No. of Countries : 29
  • Views : 10128
  • Covid Impact Covered: Yes
  • War Impact Covered: Yes
  • Formats : PDF, Excel, PPT

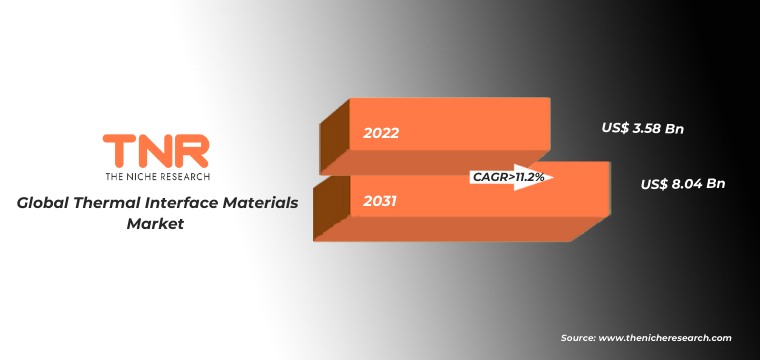
Global Thermal Interface Materials Market Valued USD 3.58 Bn in 2022, with an Estimated CAGR of 11.2% (2023- 2031)

Thermal Interface Materials, or TIMs, are heat-conducting materials that connect two or more solid mating surfaces. These materials, for example, can help with thermal management in semiconductor devices and heat sinks by acting as gap fillers between the two mating surfaces. These materials facilitate heat transmission between the two surfaces while also increasing the effectiveness of the thermal management system.

Thermal interface materials are an important component of any efficient thermal management system. These materials are widely employed in consumer and industrial electronic systems to provide effective heat dissipation and to minimize local temperature overloads. Rise in demand for thermal interface materials  across telecommunications, servers, gaming, cars, and aerospace industries has led to exponential rise in the overall thermal interface materials market.

Global Thermal Interface Materials Market Challenges

Thermal interface materials market faces several challenges due to various technical and thermal drawbacks of the materials. Achieving efficient heat transfer across interfaces remains a challenge due to factors such as air gaps, surface irregularities, and differences in thermal expansion coefficients between materials. Besides over time, some thermal interface materials can degrade due to temperature fluctuations, environmental exposure, and other factors. This degradation can negatively impact their thermal performance. Thus to overcome these challenges ongoing research and development, collaboration across market participants and a focus on understanding the unique thermal requirements of each application will upsurge the growth of the global thermal interface materials market.

Report Coverage and Deliverables

Modern electrical gadgets are distinguished by high power and frequency, as well as significant heat accumulation. Thermal interface materials are critical for effective heat dissipation in order to maintain optimum device functionality and lifetime. Polymer-based nanocomposites composed of polymers and low-dimensional materials with high thermal conductivity (TC) are the most promising TIMs.

In addition, PCTIMs (Phase Change Thermal Interface Materials) are developing as a game-changing solution to heat control in electrical systems. These cutting-edge materials are intended to improve the thermal performance of electronic devices, therefore increasing their efficiency and lifetime. These materials can aid to maintain optimal operating temperatures in electrical equipment by offering a more efficient conduit for heat transfer. This not only improves device performance but also increases device longevity by lowering the danger of heat damage. As a result, phase change thermal interface materials are positioned to play a crucial role in the thermal interface materials market’s future.

Furthermore, thermal interface materials market is gaining huge traction in the automotive industry and is anticipated to be the fastest growing segment in the global thermal interface materials market during the forecast period. Electric energy storage and traction drive systems with increased performance, expanded range, and fast-charging alternatives are required for the widespread adoption of electric transportation technologies. To offer improved thermal management of the batteries and power electronics, the ever-increasing power density of electric vehicle (EV) battery packs needs innovative thermal interface materials (TIMs). Current TIMs serve a critical role in ensuring the safe operation and consistent performance of current EVs. In thermal management applications, metal foams, phase-change materials, and carbon nanotube (CNT)-based materials show unique potential.

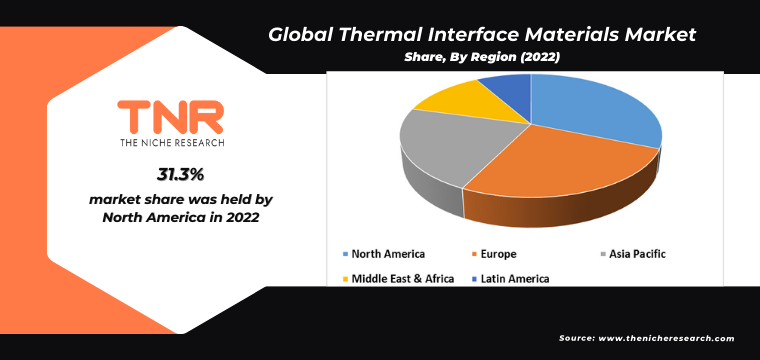
Thermal interface materials market in North America is experiencing growth driven by factors like the transition towards electric and hybrid vehicles creating a strong demand for TIMs to manage the thermal challenges associated with high-capacity battery systems and power electronics. Additionally the strong presence of the leading market players in United States and Canada is proving to be an advantage for the overall growth of the thermal interface materials market.

Competitive Landscape

The report also offers extensive research on the key players in the global thermal interface materials market and details on the competitiveness of these players. The competitive landscape is characterized by partnerships, joint ventures, mergers and acquisitions, and collaborations aimed at accelerating the development and deployment of thermal interface materials.

Key players operating in the global thermal interface materials market are

  • Arieca Inc
  • Boyd
  • DuPont
  • Henkel Corporation.
  • Honeywell International Inc
  • Indium Corporation
  • Infineon Technologies AG
  • Laird Technologies, Inc.
  • Linseis GmbH
  • Nordson Corporation
  • PARKER HANNIFIN CORP
  • Prostech.
  • Robert McKeown Company, Inc.
  • Saint-Gobain
  • Semikron Danfoss
  • Shin-Etsu Chemical Co., Ltd
  • STOCKWELL ELASTOMERICS, INC.
  • SUR-SEAL
  • T-Global Technology
  • Other Industry Participants

Global Thermal Interface Materials Market Report Coverage

Report Specifications Details
Market Revenue in 2022 US$ 3.58 Billion
Market Size Forecast by 2031 US$ 8.04 Billion
Growth Rate (CAGR) 11.2%
Historic Data 2015 – 2021
Base Year for Estimation 2022
Forecast Period 2023 – 2031
Report Inclusions Market Size & Estimates, Market Dynamics, Competitive Scenario, Trends, Growth Factors, Market Determinants, Key Investment Segmentation, Product/Service/Solutions Benchmarking
Segments Covered By Type, By Distribution Channel, By End User Industry
Regions Covered North America, Europe, Asia Pacific, Middle East & Africa, Latin America
Countries Covered U.S., Canada, Mexico, Rest of North America,  France, The UK, Spain, Germany, Italy, Nordic Countries (Denmark, Finland, Iceland, Sweden, Norway), Benelux Union (Belgium, The Netherlands, Luxembourg), Rest of Europe,  China, Japan, India, New Zealand, Australia, South Korea, Southeast Asia (Indonesia, Thailand, Malaysia, Singapore, Rest of Southeast Asia), Rest of Asia Pacific,  Saudi Arabia, UAE, Egypt, Kuwait, South Africa, Rest of Middle East & Africa,  Brazil, Argentina, Rest of Latin America
Key Players Arieca Inc, Boyd, DuPont, Henkel Corporation., Honeywell International Inc, Indium Corporation, Infineon Technologies AG, Laird Technologies, Inc., Linseis GmbH, Nordson Corporation, PARKER HANNIFIN CORP, Prostech., Robert McKeown Company, Inc., Saint-Gobain, Semikron Danfoss, Shin-Etsu Chemical Co., Ltd, STOCKWELL ELASTOMERICS, INC., SUR-SEAL, T-Global Technology, Other Industry Participants
Customization Scope Customization allows for the inclusion/modification of content pertaining to geographical regions, countries, and specific market segments.
Pricing & Procurement Options Explore purchase options tailored to your specific research requirements
Contact Details Consult With Our Expert

United States: +1 302-232-5106

United Kingdom: +447537105080

South Korea: +82-808- 703-126

Japan: +81

Saudi Arabia: +

E-mail:  askanexpert@thenicheresearh.com


Global Thermal Interface Materials Market

By Type

  • Thermal Tapes
  • Thermal Pads
  • Thermal Putty
  • Greases
  • Gels
  • Thermal Adhesives
  • Dielectric Pads
  • Gap Fillers
  • Phase Change Materials
  • Others

By Distribution Channel

  • Direct
  • Indirect

By End Users Industry

  • Automotive
  • Electronics
  • Gaming and Entertainment
  • Aerospace
  • Industrial
  • Healthcare
  • IT and Telecommunication
  • Defense
  • Others

By Region

  • North America (U.S., Canada, Mexico, Rest of North America)
  • Europe (France, The UK, Spain, Germany, Italy, Nordic Countries (Denmark, Finland, Iceland, Sweden, Norway), Benelux Union (Belgium, The Netherlands, Luxembourg), Rest of Europe)
  • Asia Pacific (China, Japan, India, New Zealand, Australia, South Korea, Southeast Asia (Indonesia, Thailand, Malaysia, Singapore, Rest of Southeast Asia), Rest of Asia Pacific)
  • Middle East & Africa (Saudi Arabia, UAE, Egypt, Kuwait, South Africa, Rest of Middle East & Africa)
  • Latin America (Brazil, Argentina, Rest of Latin America)

Table of Contents

.

1.Market Scope
1.1.Market Segmentation
1.2.Years Considered
1.2.1.Historic Years: 2015 – 2021
1.2.2.Base Year: 2022
1.2.3.Forecast Years: 2023 – 2031
2.Key Target Audiences
3.Research Methodology
3.1.Primary Research
3.1.1.Research Questionnaire
3.1.2.Global Percentage Breakdown
3.1.3.Primary Interviews: Key Opinion Leaders (KOLs)
3.2.Secondary Research
3.2.1.Paid Databases
3.2.2.Secondary Sources
3.3.Market Size Estimates
3.3.1.Top-Down Approach
3.3.2.Bottom-Up Approach
3.4.Data Triangulation Methodology
3.5.Research Assumptions
4.Recommendations and Insights from TNR’s Perspective**
5.Holistic Overview of Thermal Interface Materials Market
6.Market Synopsis: Thermal Interface Materials Market
7.Thermal Interface Materials Market Analysis: Qualitative Perspective
7.1.Introduction
7.1.1.Product Definition
7.1.2.Industry Development
7.2.Market Dynamics
7.2.1.Drivers
7.2.2.Restraints
7.2.3.Opportunities
7.3.Trends in Thermal Interface Materials Market
7.4.Market Determinants Radar Chart
7.5.Macro-Economic and Micro-Economic Indicators: Thermal Interface Materials Market
7.6.Porter’s Five Force Analysis
8.Global Thermal Interface Materials Market Analysis and Forecasts, 2023 – 2031
8.1.Overview
8.1.1.Global Thermal Interface Materials Market Revenue (US$ Mn)
8.2.Global Thermal Interface Materials Market Revenue (US$ Mn) and Forecasts, By Type
8.2.1.Thermal Tapes
8.2.1.1.Definition
8.2.1.2.Market Estimation and Penetration, 2015 – 2022
8.2.1.3.Market Forecast, 2023 – 2031
8.2.1.4.Compound Annual Growth Rate (CAGR)
8.2.1.5.Regional Bifurcation
8.2.1.5.1.North America
8.2.1.5.1.1.Market Estimation, 2015 – 2022
8.2.1.5.1.2.Market Forecast, 2023 – 2031
8.2.1.5.2.Europe
8.2.1.5.2.1.Market Estimation, 2015 – 2022
8.2.1.5.2.2.Market Forecast, 2023 – 2031
8.2.1.5.3.Asia Pacific
8.2.1.5.3.1.Market Estimation, 2015 – 2022
8.2.1.5.3.2.Market Forecast, 2023 – 2031
8.2.1.5.4.Middle East and Africa
8.2.1.5.4.1.Market Estimation, 2015 – 2022
8.2.1.5.4.2.Market Forecast, 2023 – 2031
8.2.1.5.5.Latin America
8.2.1.5.5.1.Market Estimation, 2015 – 2022
8.2.1.5.5.2.Market Forecast, 2023 – 2031
8.2.2.Thermal Pads
8.2.2.1.Definition
8.2.2.2.Market Estimation and Penetration, 2015 – 2022
8.2.2.3.Market Forecast, 2023 – 2031
8.2.2.4.Compound Annual Growth Rate (CAGR)
8.2.2.5.Regional Bifurcation
8.2.2.5.1.North America
8.2.2.5.1.1.Market Estimation, 2015 – 2022
8.2.2.5.1.2.Market Forecast, 2023 – 2031
8.2.2.5.2.Europe
8.2.2.5.2.1.Market Estimation, 2015 – 2022
8.2.2.5.2.2.Market Forecast, 2023 – 2031
8.2.2.5.3.Asia Pacific
8.2.2.5.3.1.Market Estimation, 2015 – 2022
8.2.2.5.3.2.Market Forecast, 2023 – 2031
8.2.2.5.4.Middle East and Africa
8.2.2.5.4.1.Market Estimation, 2015 – 2022
8.2.2.5.4.2.Market Forecast, 2023 – 2031
8.2.2.5.5.Latin America
8.2.2.5.5.1.Market Estimation, 2015 – 2022
8.2.2.5.5.2.Market Forecast, 2023 – 2031
8.2.3.Thermal Putty
8.2.3.1.Definition
8.2.3.2.Market Estimation and Penetration, 2015 – 2022
8.2.3.3.Market Forecast, 2023 – 2031
8.2.3.4.Compound Annual Growth Rate (CAGR)
8.2.3.5.Regional Bifurcation
8.2.3.5.1.North America
8.2.3.5.1.1.Market Estimation, 2015 – 2022
8.2.3.5.1.2.Market Forecast, 2023 – 2031
8.2.3.5.2.Europe
8.2.3.5.2.1.Market Estimation, 2015 – 2022
8.2.3.5.2.2.Market Forecast, 2023 – 2031
8.2.3.5.3.Asia Pacific
8.2.3.5.3.1.Market Estimation, 2015 – 2022
8.2.3.5.3.2.Market Forecast, 2023 – 2031
8.2.3.5.4.Middle East and Africa
8.2.3.5.4.1.Market Estimation, 2015 – 2022
8.2.3.5.4.2.Market Forecast, 2023 – 2031
8.2.3.5.5.Latin America
8.2.3.5.5.1.Market Estimation, 2015 – 2022
8.2.3.5.5.2.Market Forecast, 2023 – 2031
8.2.4.Greases
8.2.4.1.Definition
8.2.4.2.Market Estimation and Penetration, 2015 – 2022
8.2.4.3.Market Forecast, 2023 – 2031
8.2.4.4.Compound Annual Growth Rate (CAGR)
8.2.4.5.Regional Bifurcation
8.2.4.5.1.North America
8.2.4.5.1.1.Market Estimation, 2015 – 2022
8.2.4.5.1.2.Market Forecast, 2023 – 2031
8.2.4.5.2.Europe
8.2.4.5.2.1.Market Estimation, 2015 – 2022
8.2.4.5.2.2.Market Forecast, 2023 – 2031
8.2.4.5.3.Asia Pacific
8.2.4.5.3.1.Market Estimation, 2015 – 2022
8.2.4.5.3.2.Market Forecast, 2023 – 2031
8.2.4.5.4.Middle East and Africa
8.2.4.5.4.1.Market Estimation, 2015 – 2022
8.2.4.5.4.2.Market Forecast, 2023 – 2031
8.2.4.5.5.Latin America
8.2.4.5.5.1.Market Estimation, 2015 – 2022
8.2.4.5.5.2.Market Forecast, 2023 – 2031
8.2.5.Gels
8.2.5.1.Definition
8.2.5.2.Market Estimation and Penetration, 2015 – 2022
8.2.5.3.Market Forecast, 2023 – 2031
8.2.5.4.Compound Annual Growth Rate (CAGR)
8.2.5.5.Regional Bifurcation
8.2.5.5.1.North America
8.2.5.5.1.1.Market Estimation, 2015 – 2022
8.2.5.5.1.2.Market Forecast, 2023 – 2031
8.2.5.5.2.Europe
8.2.5.5.2.1.Market Estimation, 2015 – 2022
8.2.5.5.2.2.Market Forecast, 2023 – 2031
8.2.5.5.3.Asia Pacific
8.2.5.5.3.1.Market Estimation, 2015 – 2022
8.2.5.5.3.2.Market Forecast, 2023 – 2031
8.2.5.5.4.Middle East and Africa
8.2.5.5.4.1.Market Estimation, 2015 – 2022
8.2.5.5.4.2.Market Forecast, 2023 – 2031
8.2.5.5.5.Latin America
8.2.5.5.5.1.Market Estimation, 2015 – 2022
8.2.5.5.5.2.Market Forecast, 2023 – 2031
8.2.6.Thermal Adhesives
8.2.6.1.Definition
8.2.6.2.Market Estimation and Penetration, 2015 – 2022
8.2.6.3.Market Forecast, 2023 – 2031
8.2.6.4.Compound Annual Growth Rate (CAGR)
8.2.6.5.Regional Bifurcation
8.2.6.5.1.North America
8.2.6.5.1.1.Market Estimation, 2015 – 2022
8.2.6.5.1.2.Market Forecast, 2023 – 2031
8.2.6.5.2.Europe
8.2.6.5.2.1.Market Estimation, 2015 – 2022
8.2.6.5.2.2.Market Forecast, 2023 – 2031
8.2.6.5.3.Asia Pacific
8.2.6.5.3.1.Market Estimation, 2015 – 2022
8.2.6.5.3.2.Market Forecast, 2023 – 2031
8.2.6.5.4.Middle East and Africa
8.2.6.5.4.1.Market Estimation, 2015 – 2022
8.2.6.5.4.2.Market Forecast, 2023 – 2031
8.2.6.5.5.Latin America
8.2.6.5.5.1.Market Estimation, 2015 – 2022
8.2.6.5.5.2.Market Forecast, 2023 – 2031
8.2.7.Dielectric Pads
8.2.7.1.Definition
8.2.7.2.Market Estimation and Penetration, 2015 – 2022
8.2.7.3.Market Forecast, 2023 – 2031
8.2.7.4.Compound Annual Growth Rate (CAGR)
8.2.7.5.Regional Bifurcation
8.2.7.5.1.North America
8.2.7.5.1.1.Market Estimation, 2015 – 2022
8.2.7.5.1.2.Market Forecast, 2023 – 2031
8.2.7.5.2.Europe
8.2.7.5.2.1.Market Estimation, 2015 – 2022
8.2.7.5.2.2.Market Forecast, 2023 – 2031
8.2.7.5.3.Asia Pacific
8.2.7.5.3.1.Market Estimation, 2015 – 2022
8.2.7.5.3.2.Market Forecast, 2023 – 2031
8.2.7.5.4.Middle East and Africa
8.2.7.5.4.1.Market Estimation, 2015 – 2022
8.2.7.5.4.2.Market Forecast, 2023 – 2031
8.2.7.5.5.Latin America
8.2.7.5.5.1.Market Estimation, 2015 – 2022
8.2.7.5.5.2.Market Forecast, 2023 – 2031
8.2.8.Gap Fillers
8.2.8.1.Definition
8.2.8.2.Market Estimation and Penetration, 2015 – 2022
8.2.8.3.Market Forecast, 2023 – 2031
8.2.8.4.Compound Annual Growth Rate (CAGR)
8.2.8.5.Regional Bifurcation
8.2.8.5.1.North America
8.2.8.5.1.1.Market Estimation, 2015 – 2022
8.2.8.5.1.2.Market Forecast, 2023 – 2031
8.2.8.5.2.Europe
8.2.8.5.2.1.Market Estimation, 2015 – 2022
8.2.8.5.2.2.Market Forecast, 2023 – 2031
8.2.8.5.3.Asia Pacific
8.2.8.5.3.1.Market Estimation, 2015 – 2022
8.2.8.5.3.2.Market Forecast, 2023 – 2031
8.2.8.5.4.Middle East and Africa
8.2.8.5.4.1.Market Estimation, 2015 – 2022
8.2.8.5.4.2.Market Forecast, 2023 – 2031
8.2.8.5.5.Latin America
8.2.8.5.5.1.Market Estimation, 2015 – 2022
8.2.8.5.5.2.Market Forecast, 2023 – 2031
8.2.9.Phase Change Materials
8.2.9.1.Definition
8.2.9.2.Market Estimation and Penetration, 2015 – 2022
8.2.9.3.Market Forecast, 2023 – 2031
8.2.9.4.Compound Annual Growth Rate (CAGR)
8.2.9.5.Regional Bifurcation
8.2.9.5.1.North America
8.2.9.5.1.1.Market Estimation, 2015 – 2022
8.2.9.5.1.2.Market Forecast, 2023 – 2031
8.2.9.5.2.Europe
8.2.9.5.2.1.Market Estimation, 2015 – 2022
8.2.9.5.2.2.Market Forecast, 2023 – 2031
8.2.9.5.3.Asia Pacific
8.2.9.5.3.1.Market Estimation, 2015 – 2022
8.2.9.5.3.2.Market Forecast, 2023 – 2031
8.2.9.5.4.Middle East and Africa
8.2.9.5.4.1.Market Estimation, 2015 – 2022
8.2.9.5.4.2.Market Forecast, 2023 – 2031
8.2.9.5.5.Latin America
8.2.9.5.5.1.Market Estimation, 2015 – 2022
8.2.9.5.5.2.Market Forecast, 2023 – 2031
8.2.10.Others
8.2.10.1.Definition
8.2.10.2.Market Estimation and Penetration, 2015 – 2022
8.2.10.3.Market Forecast, 2023 – 2031
8.2.10.4.Compound Annual Growth Rate (CAGR)
8.2.10.5.Regional Bifurcation
8.2.10.5.1.North America
8.2.10.5.1.1.Market Estimation, 2015 – 2022
8.2.10.5.1.2.Market Forecast, 2023 – 2031
8.2.10.5.2.Europe
8.2.10.5.2.1.Market Estimation, 2015 – 2022
8.2.10.5.2.2.Market Forecast, 2023 – 2031
8.2.10.5.3.Asia Pacific
8.2.10.5.3.1.Market Estimation, 2015 – 2022
8.2.10.5.3.2.Market Forecast, 2023 – 2031
8.2.10.5.4.Middle East and Africa
8.2.10.5.4.1.Market Estimation, 2015 – 2022
8.2.10.5.4.2.Market Forecast, 2023 – 2031
8.2.10.5.5.Latin America
8.2.10.5.5.1.Market Estimation, 2015 – 2022
8.2.10.5.5.2.Market Forecast, 2023 – 2031
8.3.Key Segment for Channeling Investments
8.3.1.By Type
9.Global Thermal Interface Materials Market Analysis and Forecasts, 2023 – 2031
9.1.Overview
9.2.Global Thermal Interface Materials Market Revenue (US$ Mn) and Forecasts, By Distribution Channel
9.2.1.Direct
9.2.1.1.Definition
9.2.1.2.Market Estimation and Penetration, 2015 – 2022
9.2.1.3.Market Forecast, 2023 – 2031
9.2.1.4.Compound Annual Growth Rate (CAGR)
9.2.1.5.Regional Bifurcation
9.2.1.5.1.North America
9.2.1.5.1.1.Market Estimation, 2015 – 2022
9.2.1.5.1.2.Market Forecast, 2023 – 2031
9.2.1.5.2.Europe
9.2.1.5.2.1.Market Estimation, 2015 – 2022
9.2.1.5.2.2.Market Forecast, 2023 – 2031
9.2.1.5.3.Asia Pacific
9.2.1.5.3.1.Market Estimation, 2015 – 2022
9.2.1.5.3.2.Market Forecast, 2023 – 2031
9.2.1.5.4.Middle East and Africa
9.2.1.5.4.1.Market Estimation, 2015 – 2022
9.2.1.5.4.2.Market Forecast, 2023 – 2031
9.2.1.5.5.Latin America
9.2.1.5.5.1.Market Estimation, 2015 – 2022
9.2.1.5.5.2.Market Forecast, 2023 – 2031
9.2.2.Indirect
9.2.2.1.Definition
9.2.2.2.Market Estimation and Penetration, 2015 – 2022
9.2.2.3.Market Forecast, 2023 – 2031
9.2.2.4.Compound Annual Growth Rate (CAGR)
9.2.2.5.Regional Bifurcation
9.2.2.5.1.North America
9.2.2.5.1.1.Market Estimation, 2015 – 2022
9.2.2.5.1.2.Market Forecast, 2023 – 2031
9.2.2.5.2.Europe
9.2.2.5.2.1.Market Estimation, 2015 – 2022
9.2.2.5.2.2.Market Forecast, 2023 – 2031
9.2.2.5.3.Asia Pacific
9.2.2.5.3.1.Market Estimation, 2015 – 2022
9.2.2.5.3.2.Market Forecast, 2023 – 2031
9.2.2.5.4.Middle East and Africa
9.2.2.5.4.1.Market Estimation, 2015 – 2022
9.2.2.5.4.2.Market Forecast, 2023 – 2031
9.2.2.5.5.Latin America
9.2.2.5.5.1.Market Estimation, 2015 – 2022
9.2.2.5.5.2.Market Forecast, 2023 – 2031
9.3.Key Segment for Channeling Investments
9.3.1.By Distribution Channel
10.Global Thermal Interface Materials Market Analysis and Forecasts, 2023 – 2031
10.1.Overview
10.2.Global Thermal Interface Materials Market Revenue (US$ Mn) and Forecasts, By End Users Industry
10.2.1.Automotive
10.2.1.1.Definition
10.2.1.2.Market Estimation and Penetration, 2015 – 2022
10.2.1.3.Market Forecast, 2023 – 2031
10.2.1.4.Compound Annual Growth Rate (CAGR)
10.2.1.5.Regional Bifurcation
10.2.1.5.1.North America
10.2.1.5.1.1.Market Estimation, 2015 – 2022
10.2.1.5.1.2.Market Forecast, 2023 – 2031
10.2.1.5.2.Europe
10.2.1.5.2.1.Market Estimation, 2015 – 2022
10.2.1.5.2.2.Market Forecast, 2023 – 2031
10.2.1.5.3.Asia Pacific
10.2.1.5.3.1.Market Estimation, 2015 – 2022
10.2.1.5.3.2.Market Forecast, 2023 – 2031
10.2.1.5.4.Middle East and Africa
10.2.1.5.4.1.Market Estimation, 2015 – 2022
10.2.1.5.4.2.Market Forecast, 2023 – 2031
10.2.1.5.5.Latin America
10.2.1.5.5.1.Market Estimation, 2015 – 2022
10.2.1.5.5.2.Market Forecast, 2023 – 2031
10.2.2.Electronics
10.2.2.1.Definition
10.2.2.2.Market Estimation and Penetration, 2015 – 2022
10.2.2.3.Market Forecast, 2023 – 2031
10.2.2.4.Compound Annual Growth Rate (CAGR)
10.2.2.5.Regional Bifurcation
10.2.2.5.1.North America
10.2.2.5.1.1.Market Estimation, 2015 – 2022
10.2.2.5.1.2.Market Forecast, 2023 – 2031
10.2.2.5.2.Europe
10.2.2.5.2.1.Market Estimation, 2015 – 2022
10.2.2.5.2.2.Market Forecast, 2023 – 2031
10.2.2.5.3.Asia Pacific
10.2.2.5.3.1.Market Estimation, 2015 – 2022
10.2.2.5.3.2.Market Forecast, 2023 – 2031
10.2.2.5.4.Middle East and Africa
10.2.2.5.4.1.Market Estimation, 2015 – 2022
10.2.2.5.4.2.Market Forecast, 2023 – 2031
10.2.2.5.5.Latin America
10.2.2.5.5.1.Market Estimation, 2015 – 2022
10.2.2.5.5.2.Market Forecast, 2023 – 2031
10.2.3.Gaming and Entertainment
10.2.3.1.Definition
10.2.3.2.Market Estimation and Penetration, 2015 – 2022
10.2.3.3.Market Forecast, 2023 – 2031
10.2.3.4.Compound Annual Growth Rate (CAGR)
10.2.3.5.Regional Bifurcation
10.2.3.5.1.North America
10.2.3.5.1.1.Market Estimation, 2015 – 2022
10.2.3.5.1.2.Market Forecast, 2023 – 2031
10.2.3.5.2.Europe
10.2.3.5.2.1.Market Estimation, 2015 – 2022
10.2.3.5.2.2.Market Forecast, 2023 – 2031
10.2.3.5.3.Asia Pacific
10.2.3.5.3.1.Market Estimation, 2015 – 2022
10.2.3.5.3.2.Market Forecast, 2023 – 2031
10.2.3.5.4.Middle East and Africa
10.2.3.5.4.1.Market Estimation, 2015 – 2022
10.2.3.5.4.2.Market Forecast, 2023 – 2031
10.2.3.5.5.Latin America
10.2.3.5.5.1.Market Estimation, 2015 – 2022
10.2.3.5.5.2.Market Forecast, 2023 – 2031
10.2.4.Aerospace
10.2.4.1.Definition
10.2.4.2.Market Estimation and Penetration, 2015 – 2022
10.2.4.3.Market Forecast, 2023 – 2031
10.2.4.4.Compound Annual Growth Rate (CAGR)
10.2.4.5.Regional Bifurcation
10.2.4.5.1.North America
10.2.4.5.1.1.Market Estimation, 2015 – 2022
10.2.4.5.1.2.Market Forecast, 2023 – 2031
10.2.4.5.2.Europe
10.2.4.5.2.1.Market Estimation, 2015 – 2022
10.2.4.5.2.2.Market Forecast, 2023 – 2031
10.2.4.5.3.Asia Pacific
10.2.4.5.3.1.Market Estimation, 2015 – 2022
10.2.4.5.3.2.Market Forecast, 2023 – 2031
10.2.4.5.4.Middle East and Africa
10.2.4.5.4.1.Market Estimation, 2015 – 2022
10.2.4.5.4.2.Market Forecast, 2023 – 2031
10.2.4.5.5.Latin America
10.2.4.5.5.1.Market Estimation, 2015 – 2022
10.2.4.5.5.2.Market Forecast, 2023 – 2031
10.2.5.Industrial
10.2.5.1.Definition
10.2.5.2.Market Estimation and Penetration, 2015 – 2022
10.2.5.3.Market Forecast, 2023 – 2031
10.2.5.4.Compound Annual Growth Rate (CAGR)
10.2.5.5.Regional Bifurcation
10.2.5.5.1.North America
10.2.5.5.1.1.Market Estimation, 2015 – 2022
10.2.5.5.1.2.Market Forecast, 2023 – 2031
10.2.5.5.2.Europe
10.2.5.5.2.1.Market Estimation, 2015 – 2022
10.2.5.5.2.2.Market Forecast, 2023 – 2031
10.2.5.5.3.Asia Pacific
10.2.5.5.3.1.Market Estimation, 2015 – 2022
10.2.5.5.3.2.Market Forecast, 2023 – 2031
10.2.5.5.4.Middle East and Africa
10.2.5.5.4.1.Market Estimation, 2015 – 2022
10.2.5.5.4.2.Market Forecast, 2023 – 2031
10.2.5.5.5.Latin America
10.2.5.5.5.1.Market Estimation, 2015 – 2022
10.2.5.5.5.2.Market Forecast, 2023 – 2031
10.2.6.Healthcare
10.2.6.1.Definition
10.2.6.2.Market Estimation and Penetration, 2015 – 2022
10.2.6.3.Market Forecast, 2023 – 2031
10.2.6.4.Compound Annual Growth Rate (CAGR)
10.2.6.5.Regional Bifurcation
10.2.6.5.1.North America
10.2.6.5.1.1.Market Estimation, 2015 – 2022
10.2.6.5.1.2.Market Forecast, 2023 – 2031
10.2.6.5.2.Europe
10.2.6.5.2.1.Market Estimation, 2015 – 2022
10.2.6.5.2.2.Market Forecast, 2023 – 2031
10.2.6.5.3.Asia Pacific
10.2.6.5.3.1.Market Estimation, 2015 – 2022
10.2.6.5.3.2.Market Forecast, 2023 – 2031
10.2.6.5.4.Middle East and Africa
10.2.6.5.4.1.Market Estimation, 2015 – 2022
10.2.6.5.4.2.Market Forecast, 2023 – 2031
10.2.6.5.5.Latin America
10.2.6.5.5.1.Market Estimation, 2015 – 2022
10.2.6.5.5.2.Market Forecast, 2023 – 2031
10.2.7.IT and Telecommunication
10.2.7.1.Definition
10.2.7.2.Market Estimation and Penetration, 2015 – 2022
10.2.7.3.Market Forecast, 2023 – 2031
10.2.7.4.Compound Annual Growth Rate (CAGR)
10.2.7.5.Regional Bifurcation
10.2.7.5.1.North America
10.2.7.5.1.1.Market Estimation, 2015 – 2022
10.2.7.5.1.2.Market Forecast, 2023 – 2031
10.2.7.5.2.Europe
10.2.7.5.2.1.Market Estimation, 2015 – 2022
10.2.7.5.2.2.Market Forecast, 2023 – 2031
10.2.7.5.3.Asia Pacific
10.2.7.5.3.1.Market Estimation, 2015 – 2022
10.2.7.5.3.2.Market Forecast, 2023 – 2031
10.2.7.5.4.Middle East and Africa
10.2.7.5.4.1.Market Estimation, 2015 – 2022
10.2.7.5.4.2.Market Forecast, 2023 – 2031
10.2.7.5.5.Latin America
10.2.7.5.5.1.Market Estimation, 2015 – 2022
10.2.7.5.5.2.Market Forecast, 2023 – 2031
10.2.8.Defense
10.2.8.1.Definition
10.2.8.2.Market Estimation and Penetration, 2015 – 2022
10.2.8.3.Market Forecast, 2023 – 2031
10.2.8.4.Compound Annual Growth Rate (CAGR)
10.2.8.5.Regional Bifurcation
10.2.8.5.1.North America
10.2.8.5.1.1.Market Estimation, 2015 – 2022
10.2.8.5.1.2.Market Forecast, 2023 – 2031
10.2.8.5.2.Europe
10.2.8.5.2.1.Market Estimation, 2015 – 2022
10.2.8.5.2.2.Market Forecast, 2023 – 2031
10.2.8.5.3.Asia Pacific
10.2.8.5.3.1.Market Estimation, 2015 – 2022
10.2.8.5.3.2.Market Forecast, 2023 – 2031
10.2.8.5.4.Middle East and Africa
10.2.8.5.4.1.Market Estimation, 2015 – 2022
10.2.8.5.4.2.Market Forecast, 2023 – 2031
10.2.8.5.5.Latin America
10.2.8.5.5.1.Market Estimation, 2015 – 2022
10.2.8.5.5.2.Market Forecast, 2023 – 2031
10.2.9.Others
10.2.9.1.Definition
10.2.9.2.Market Estimation and Penetration, 2015 – 2022
10.2.9.3.Market Forecast, 2023 – 2031
10.2.9.4.Compound Annual Growth Rate (CAGR)
10.2.9.5.Regional Bifurcation
10.2.9.5.1.North America
10.2.9.5.1.1.Market Estimation, 2015 – 2022
10.2.9.5.1.2.Market Forecast, 2023 – 2031
10.2.9.5.2.Europe
10.2.9.5.2.1.Market Estimation, 2015 – 2022
10.2.9.5.2.2.Market Forecast, 2023 – 2031
10.2.9.5.3.Asia Pacific
10.2.9.5.3.1.Market Estimation, 2015 – 2022
10.2.9.5.3.2.Market Forecast, 2023 – 2031
10.2.9.5.4.Middle East and Africa
10.2.9.5.4.1.Market Estimation, 2015 – 2022
10.2.9.5.4.2.Market Forecast, 2023 – 2031
10.2.9.5.5.Latin America
10.2.9.5.5.1.Market Estimation, 2015 – 2022
10.2.9.5.5.2.Market Forecast, 2023 – 2031
10.3.Key Segment for Channeling Investments
10.3.1.By End Users Industry
11.North America Thermal Interface Materials Market Analysis and Forecasts, 2023 – 2031
11.1.Overview
11.1.1.North America Thermal Interface Materials Market Revenue (US$ Mn)
11.2.North America Thermal Interface Materials Market Revenue (US$ Mn) and Forecasts, By Type
11.2.1.Thermal Tapes
11.2.2.Thermal Pads
11.2.3.Thermal Putty
11.2.4.Greases
11.2.5.Gels
11.2.6.Thermal Adhesives
11.2.7.Dielectric Pads
11.2.8.Gap Fillers
11.2.9.Phase Change Materials
11.2.10.Others
11.3.North America Thermal Interface Materials Market Revenue (US$ Mn) and Forecasts, By Distribution Channel
11.3.1.Direct
11.3.2.Indirect
11.4.North America Thermal Interface Materials Market Revenue (US$ Mn) and Forecasts, By End Users Industry
11.4.1.Automotive
11.4.2.Electronics
11.4.3.Gaming and Entertainment
11.4.4.Aerospace
11.4.5.Industrial
11.4.6.Healthcare
11.4.7.IT and Telecommunication
11.4.8.Defense
11.4.9.Others
11.5.North America Thermal Interface Materials Market Revenue (US$ Mn) and Forecasts, By Country
11.5.1.U.S
11.5.1.1.U.S Thermal Interface Materials Market Revenue (US$ Mn) and Forecasts, By Type
11.5.1.1.1.Thermal Tapes
11.5.1.1.2.Thermal Pads
11.5.1.1.3.Thermal Putty
11.5.1.1.4.Greases
11.5.1.1.5.Gels
11.5.1.1.6.Thermal Adhesives
11.5.1.1.7.Dielectric Pads
11.5.1.1.8.Gap Fillers
11.5.1.1.9.Phase Change Materials
11.5.1.1.10.Others
11.5.1.2.U.S Thermal Interface Materials Market Revenue (US$ Mn) and Forecasts, By Distribution Channel
11.5.1.2.1.Direct
11.5.1.2.2.Indirect
11.5.1.3.U.S Thermal Interface Materials Market Revenue (US$ Mn) and Forecasts, By End Users Industry
11.5.1.3.1.Automotive
11.5.1.3.2.Electronics
11.5.1.3.3.Gaming and Entertainment
11.5.1.3.4.Aerospace
11.5.1.3.5.Industrial
11.5.1.3.6.Healthcare
11.5.1.3.7.IT and Telecommunication
11.5.1.3.8.Defense
11.5.1.3.9.Others
11.5.2.Canada
11.5.2.1.Canada Thermal Interface Materials Market Revenue (US$ Mn) and Forecasts, By Type
11.5.2.1.1.Thermal Tapes
11.5.2.1.2.Thermal Pads
11.5.2.1.3.Thermal Putty
11.5.2.1.4.Greases
11.5.2.1.5.Gels
11.5.2.1.6.Thermal Adhesives
11.5.2.1.7.Dielectric Pads
11.5.2.1.8.Gap Fillers
11.5.2.1.9.Phase Change Materials
11.5.2.1.10.Others
11.5.2.2.Canada Thermal Interface Materials Market Revenue (US$ Mn) and Forecasts, By Distribution Channel
11.5.2.2.1.Direct
11.5.2.2.2.Indirect
11.5.2.3.Canada Thermal Interface Materials Market Revenue (US$ Mn) and Forecasts, By End Users Industry
11.5.2.3.1.Automotive
11.5.2.3.2.Electronics
11.5.2.3.3.Gaming and Entertainment
11.5.2.3.4.Aerospace
11.5.2.3.5.Industrial
11.5.2.3.6.Healthcare
11.5.2.3.7.IT and Telecommunication
11.5.2.3.8.Defense
11.5.2.3.9.Others
11.5.3.Mexico
11.5.3.1.Mexico Thermal Interface Materials Market Revenue (US$ Mn) and Forecasts, By Type
11.5.3.1.1.Thermal Tapes
11.5.3.1.2.Thermal Pads
11.5.3.1.3.Thermal Putty
11.5.3.1.4.Greases
11.5.3.1.5.Gels
11.5.3.1.6.Thermal Adhesives
11.5.3.1.7.Dielectric Pads
11.5.3.1.8.Gap Fillers
11.5.3.1.9.Phase Change Materials
11.5.3.1.10.Others
11.5.3.2.Mexico Thermal Interface Materials Market Revenue (US$ Mn) and Forecasts, By Distribution Channel
11.5.3.2.1.Direct
11.5.3.2.2.Indirect
11.5.3.3.Mexico Thermal Interface Materials Market Revenue (US$ Mn) and Forecasts, By End Users Industry
11.5.3.3.1.Automotive
11.5.3.3.2.Electronics
11.5.3.3.3.Gaming and Entertainment
11.5.3.3.4.Aerospace
11.5.3.3.5.Industrial
11.5.3.3.6.Healthcare
11.5.3.3.7.IT and Telecommunication
11.5.3.3.8.Defense
11.5.3.3.9.Others
11.5.4.Rest of North America
11.5.4.1.Rest of North America Thermal Interface Materials Market Revenue (US$ Mn) and Forecasts, By Type
11.5.4.1.1.Thermal Tapes
11.5.4.1.2.Thermal Pads
11.5.4.1.3.Thermal Putty
11.5.4.1.4.Greases
11.5.4.1.5.Gels
11.5.4.1.6.Thermal Adhesives
11.5.4.1.7.Dielectric Pads
11.5.4.1.8.Gap Fillers
11.5.4.1.9.Phase Change Materials
11.5.4.1.10.Others
11.5.4.2.Rest of North America Thermal Interface Materials Market Revenue (US$ Mn) and Forecasts, By Distribution Channel
11.5.4.2.1.Direct
11.5.4.2.2.Indirect
11.5.4.3.Rest of North America Thermal Interface Materials Market Revenue (US$ Mn) and Forecasts, By End Users Industry
11.5.4.3.1.Automotive
11.5.4.3.2.Electronics
11.5.4.3.3.Gaming and Entertainment
11.5.4.3.4.Aerospace
11.5.4.3.5.Industrial
11.5.4.3.6.Healthcare
11.5.4.3.7.IT and Telecommunication
11.5.4.3.8.Defense
11.5.4.3.9.Others
11.6.Key Segment for Channeling Investments
11.6.1.By Country
11.6.2.By Type
11.6.3.By Distribution Channel
11.6.4.By End Users Industry
12.Europe Thermal Interface Materials Market Analysis and Forecasts, 2023 – 2031
12.1.Overview
12.1.1.Europe Thermal Interface Materials Market Revenue (US$ Mn)
12.2.Europe Thermal Interface Materials Market Revenue (US$ Mn) and Forecasts, By Type
12.2.1.Thermal Tapes
12.2.2.Thermal Pads
12.2.3.Thermal Putty
12.2.4.Greases
12.2.5.Gels
12.2.6.Thermal Adhesives
12.2.7.Dielectric Pads
12.2.8.Gap Fillers
12.2.9.Phase Change Materials
12.2.10.Others
12.3.Europe Thermal Interface Materials Market Revenue (US$ Mn) and Forecasts, By Distribution Channel
12.3.1.Direct
12.3.2.Indirect
12.4.Europe Thermal Interface Materials Market Revenue (US$ Mn) and Forecasts, By End Users Industry
12.4.1.Automotive
12.4.2.Electronics
12.4.3.Gaming and Entertainment
12.4.4.Aerospace
12.4.5.Industrial
12.4.6.Healthcare
12.4.7.IT and Telecommunication
12.4.8.Defense
12.4.9.Others
12.5.Europe Thermal Interface Materials Market Revenue (US$ Mn) and Forecasts, By Country
12.5.1.France
12.5.1.1.France Thermal Interface Materials Market Revenue (US$ Mn) and Forecasts, By Type
12.5.1.1.1.Thermal Tapes
12.5.1.1.2.Thermal Pads
12.5.1.1.3.Thermal Putty
12.5.1.1.4.Greases
12.5.1.1.5.Gels
12.5.1.1.6.Thermal Adhesives
12.5.1.1.7.Dielectric Pads
12.5.1.1.8.Gap Fillers
12.5.1.1.9.Phase Change Materials
12.5.1.1.10.Others
12.5.1.2.France Thermal Interface Materials Market Revenue (US$ Mn) and Forecasts, By Distribution Channel
12.5.1.2.1.Direct
12.5.1.2.2.Indirect
12.5.1.3.France Thermal Interface Materials Market Revenue (US$ Mn) and Forecasts, By End Users Industry
12.5.1.3.1.Automotive
12.5.1.3.2.Electronics
12.5.1.3.3.Gaming and Entertainment
12.5.1.3.4.Aerospace
12.5.1.3.5.Industrial
12.5.1.3.6.Healthcare
12.5.1.3.7.IT and Telecommunication
12.5.1.3.8.Defense
12.5.1.3.9.Others
12.5.2.The UK
12.5.2.1.The UK Thermal Interface Materials Market Revenue (US$ Mn) and Forecasts, By Type
12.5.2.1.1.Thermal Tapes
12.5.2.1.2.Thermal Pads
12.5.2.1.3.Thermal Putty
12.5.2.1.4.Greases
12.5.2.1.5.Gels
12.5.2.1.6.Thermal Adhesives
12.5.2.1.7.Dielectric Pads
12.5.2.1.8.Gap Fillers
12.5.2.1.9.Phase Change Materials
12.5.2.1.10.Others
12.5.2.2.The UK Thermal Interface Materials Market Revenue (US$ Mn) and Forecasts, By Distribution Channel
12.5.2.2.1.Direct
12.5.2.2.2.Indirect
12.5.2.3.The UK Thermal Interface Materials Market Revenue (US$ Mn) and Forecasts, By End Users Industry
12.5.2.3.1.Automotive
12.5.2.3.2.Electronics
12.5.2.3.3.Gaming and Entertainment
12.5.2.3.4.Aerospace
12.5.2.3.5.Industrial
12.5.2.3.6.Healthcare
12.5.2.3.7.IT and Telecommunication
12.5.2.3.8.Defense
12.5.2.3.9.Others
12.5.3.Spain
12.5.3.1.Spain Thermal Interface Materials Market Revenue (US$ Mn) and Forecasts, By Type
12.5.3.1.1.Thermal Tapes
12.5.3.1.2.Thermal Pads
12.5.3.1.3.Thermal Putty
12.5.3.1.4.Greases
12.5.3.1.5.Gels
12.5.3.1.6.Thermal Adhesives
12.5.3.1.7.Dielectric Pads
12.5.3.1.8.Gap Fillers
12.5.3.1.9.Phase Change Materials
12.5.3.1.10.Others
12.5.3.2.Spain Thermal Interface Materials Market Revenue (US$ Mn) and Forecasts, By Distribution Channel
12.5.3.2.1.Direct
12.5.3.2.2.Indirect
12.5.3.3.Spain Thermal Interface Materials Market Revenue (US$ Mn) and Forecasts, By End Users Industry
12.5.3.3.1.Automotive
12.5.3.3.2.Electronics
12.5.3.3.3.Gaming and Entertainment
12.5.3.3.4.Aerospace
12.5.3.3.5.Industrial
12.5.3.3.6.Healthcare
12.5.3.3.7.IT and Telecommunication
12.5.3.3.8.Defense
12.5.3.3.9.Others
12.5.4.Germany
12.5.4.1.Germany Thermal Interface Materials Market Revenue (US$ Mn) and Forecasts, By Type
12.5.4.1.1.Thermal Tapes
12.5.4.1.2.Thermal Pads
12.5.4.1.3.Thermal Putty
12.5.4.1.4.Greases
12.5.4.1.5.Gels
12.5.4.1.6.Thermal Adhesives
12.5.4.1.7.Dielectric Pads
12.5.4.1.8.Gap Fillers
12.5.4.1.9.Phase Change Materials
12.5.4.1.10.Others
12.5.4.2.Germany Thermal Interface Materials Market Revenue (US$ Mn) and Forecasts, By Distribution Channel
12.5.4.2.1.Direct
12.5.4.2.2.Indirect
12.5.4.3.Germany Thermal Interface Materials Market Revenue (US$ Mn) and Forecasts, By End Users Industry
12.5.4.3.1.Automotive
12.5.4.3.2.Electronics
12.5.4.3.3.Gaming and Entertainment
12.5.4.3.4.Aerospace
12.5.4.3.5.Industrial
12.5.4.3.6.Healthcare
12.5.4.3.7.IT and Telecommunication
12.5.4.3.8.Defense
12.5.4.3.9.Others
12.5.5.Italy
12.5.5.1.Italy Thermal Interface Materials Market Revenue (US$ Mn) and Forecasts, By Type
12.5.5.1.1.Thermal Tapes
12.5.5.1.2.Thermal Pads
12.5.5.1.3.Thermal Putty
12.5.5.1.4.Greases
12.5.5.1.5.Gels
12.5.5.1.6.Thermal Adhesives
12.5.5.1.7.Dielectric Pads
12.5.5.1.8.Gap Fillers
12.5.5.1.9.Phase Change Materials
12.5.5.1.10.Others
12.5.5.2.Italy Thermal Interface Materials Market Revenue (US$ Mn) and Forecasts, By Distribution Channel
12.5.5.2.1.Direct
12.5.5.2.2.Indirect
12.5.5.3.Italy Thermal Interface Materials Market Revenue (US$ Mn) and Forecasts, By End Users Industry
12.5.5.3.1.Automotive
12.5.5.3.2.Electronics
12.5.5.3.3.Gaming and Entertainment
12.5.5.3.4.Aerospace
12.5.5.3.5.Industrial
12.5.5.3.6.Healthcare
12.5.5.3.7.IT and Telecommunication
12.5.5.3.8.Defense
12.5.5.3.9.Others
12.5.6.Nordic Countries
12.5.6.1.Nordic Countries Thermal Interface Materials Market Revenue (US$ Mn) and Forecasts, By Type
12.5.6.1.1.Thermal Tapes
12.5.6.1.2.Thermal Pads
12.5.6.1.3.Thermal Putty
12.5.6.1.4.Greases
12.5.6.1.5.Gels
12.5.6.1.6.Thermal Adhesives
12.5.6.1.7.Dielectric Pads
12.5.6.1.8.Gap Fillers
12.5.6.1.9.Phase Change Materials
12.5.6.1.10.Others
12.5.6.2.Nordic Countries Thermal Interface Materials Market Revenue (US$ Mn) and Forecasts, By Distribution Channel
12.5.6.2.1.Direct
12.5.6.2.2.Indirect
12.5.6.3.Nordic Countries Thermal Interface Materials Market Revenue (US$ Mn) and Forecasts, By End Users Industry
12.5.6.3.1.Automotive
12.5.6.3.2.Electronics
12.5.6.3.3.Gaming and Entertainment
12.5.6.3.4.Aerospace
12.5.6.3.5.Industrial
12.5.6.3.6.Healthcare
12.5.6.3.7.IT and Telecommunication
12.5.6.3.8.Defense
12.5.6.3.9.Others
12.5.6.4.Nordic Countries Thermal Interface Materials Market Revenue (US$ Mn) and Forecasts, By Country
12.5.6.4.1.Denmark
12.5.6.4.2.Finland
12.5.6.4.3.Iceland
12.5.6.4.4.Sweden
12.5.6.4.5.Norway
12.5.7.Benelux Union
12.5.7.1.Benelux Union Thermal Interface Materials Market Revenue (US$ Mn) and Forecasts, By Type
12.5.7.1.1.Thermal Tapes
12.5.7.1.2.Thermal Pads
12.5.7.1.3.Thermal Putty
12.5.7.1.4.Greases
12.5.7.1.5.Gels
12.5.7.1.6.Thermal Adhesives
12.5.7.1.7.Dielectric Pads
12.5.7.1.8.Gap Fillers
12.5.7.1.9.Phase Change Materials
12.5.7.1.10.Others
12.5.7.2.Benelux Union Thermal Interface Materials Market Revenue (US$ Mn) and Forecasts, By Distribution Channel
12.5.7.2.1.Direct
12.5.7.2.2.Indirect
12.5.7.3.Benelux Union Thermal Interface Materials Market Revenue (US$ Mn) and Forecasts, By End Users Industry
12.5.7.3.1.Automotive
12.5.7.3.2.Electronics
12.5.7.3.3.Gaming and Entertainment
12.5.7.3.4.Aerospace
12.5.7.3.5.Industrial
12.5.7.3.6.Healthcare
12.5.7.3.7.IT and Telecommunication
12.5.7.3.8.Defense
12.5.7.3.9.Others
12.5.7.4.Benelux Union Thermal Interface Materials Market Revenue (US$ Mn) and Forecasts, By Country
12.5.7.4.1.Belgium
12.5.7.4.2.The Netherlands
12.5.7.4.3.Luxembourg
12.5.8.Rest of Europe
12.5.8.1.Rest of Europe Thermal Interface Materials Market Revenue (US$ Mn) and Forecasts, By Type
12.5.8.1.1.Thermal Tapes
12.5.8.1.2.Thermal Pads
12.5.8.1.3.Thermal Putty
12.5.8.1.4.Greases
12.5.8.1.5.Gels
12.5.8.1.6.Thermal Adhesives
12.5.8.1.7.Dielectric Pads
12.5.8.1.8.Gap Fillers
12.5.8.1.9.Phase Change Materials
12.5.8.1.10.Others
12.5.8.2.Rest of Europe Thermal Interface Materials Market Revenue (US$ Mn) and Forecasts, By Distribution Channel
12.5.8.2.1.Direct
12.5.8.2.2.Indirect
12.5.8.3.Rest of Europe Thermal Interface Materials Market Revenue (US$ Mn) and Forecasts, By End Users Industry
12.5.8.3.1.Automotive
12.5.8.3.2.Electronics
12.5.8.3.3.Gaming and Entertainment
12.5.8.3.4.Aerospace
12.5.8.3.5.Industrial
12.5.8.3.6.Healthcare
12.5.8.3.7.IT and Telecommunication
12.5.8.3.8.Defense
12.5.8.3.9.Others
12.6.Key Segment for Channeling Investments
12.6.1.By Country
12.6.2.By Type
12.6.3.By Distribution Channel
12.6.4.By End Users Industry
13.Asia Pacific Thermal Interface Materials Market Analysis and Forecasts, 2023 – 2031
13.1.Overview
13.1.1.Asia Pacific Thermal Interface Materials Market Revenue (US$ Mn)
13.2.Asia Pacific Thermal Interface Materials Market Revenue (US$ Mn) and Forecasts, By Type
13.2.1.Thermal Tapes
13.2.2.Thermal Pads
13.2.3.Thermal Putty
13.2.4.Greases
13.2.5.Gels
13.2.6.Thermal Adhesives
13.2.7.Dielectric Pads
13.2.8.Gap Fillers
13.2.9.Phase Change Materials
13.2.10.Others
13.3.Asia Pacific Thermal Interface Materials Market Revenue (US$ Mn) and Forecasts, By Distribution Channel
13.3.1.Direct
13.3.2.Indirect
13.4.Asia Pacific Thermal Interface Materials Market Revenue (US$ Mn) and Forecasts, By End Users Industry
13.4.1.Automotive
13.4.2.Electronics
13.4.3.Gaming and Entertainment
13.4.4.Aerospace
13.4.5.Industrial
13.4.6.Healthcare
13.4.7.IT and Telecommunication
13.4.8.Defense
13.4.9.Others
13.5.Asia Pacific Thermal Interface Materials Market Revenue (US$ Mn) and Forecasts, By Country
13.5.1.China
13.5.1.1.China Thermal Interface Materials Market Revenue (US$ Mn) and Forecasts, By Type
13.5.1.1.1.Thermal Tapes
13.5.1.1.2.Thermal Pads
13.5.1.1.3.Thermal Putty
13.5.1.1.4.Greases
13.5.1.1.5.Gels
13.5.1.1.6.Thermal Adhesives
13.5.1.1.7.Dielectric Pads
13.5.1.1.8.Gap Fillers
13.5.1.1.9.Phase Change Materials
13.5.1.1.10.Others
13.5.1.2.China Thermal Interface Materials Market Revenue (US$ Mn) and Forecasts, By Distribution Channel
13.5.1.2.1.Direct
13.5.1.2.2.Indirect
13.5.1.3.China Thermal Interface Materials Market Revenue (US$ Mn) and Forecasts, By End Users Industry
13.5.1.3.1.Automotive
13.5.1.3.2.Electronics
13.5.1.3.3.Gaming and Entertainment
13.5.1.3.4.Aerospace
13.5.1.3.5.Industrial
13.5.1.3.6.Healthcare
13.5.1.3.7.IT and Telecommunication
13.5.1.3.8.Defense
13.5.1.3.9.Others
13.5.2.Japan
13.5.2.1.Japan Thermal Interface Materials Market Revenue (US$ Mn) and Forecasts, By Type
13.5.2.1.1.Thermal Tapes
13.5.2.1.2.Thermal Pads
13.5.2.1.3.Thermal Putty
13.5.2.1.4.Greases
13.5.2.1.5.Gels
13.5.2.1.6.Thermal Adhesives
13.5.2.1.7.Dielectric Pads
13.5.2.1.8.Gap Fillers
13.5.2.1.9.Phase Change Materials
13.5.2.1.10.Others
13.5.2.2.Japan Thermal Interface Materials Market Revenue (US$ Mn) and Forecasts, By Distribution Channel
13.5.2.2.1.Direct
13.5.2.2.2.Indirect
13.5.2.3.Japan Thermal Interface Materials Market Revenue (US$ Mn) and Forecasts, By End Users Industry
13.5.2.3.1.Automotive
13.5.2.3.2.Electronics
13.5.2.3.3.Gaming and Entertainment
13.5.2.3.4.Aerospace
13.5.2.3.5.Industrial
13.5.2.3.6.Healthcare
13.5.2.3.7.IT and Telecommunication
13.5.2.3.8.Defense
13.5.2.3.9.Others
13.5.3.India
13.5.3.1.India Thermal Interface Materials Market Revenue (US$ Mn) and Forecasts, By Type
13.5.3.1.1.Thermal Tapes
13.5.3.1.2.Thermal Pads
13.5.3.1.3.Thermal Putty
13.5.3.1.4.Greases
13.5.3.1.5.Gels
13.5.3.1.6.Thermal Adhesives
13.5.3.1.7.Dielectric Pads
13.5.3.1.8.Gap Fillers
13.5.3.1.9.Phase Change Materials
13.5.3.1.10.Others
13.5.3.2.India Thermal Interface Materials Market Revenue (US$ Mn) and Forecasts, By Distribution Channel
13.5.3.2.1.Direct
13.5.3.2.2.Indirect
13.5.3.3.India Thermal Interface Materials Market Revenue (US$ Mn) and Forecasts, By End Users Industry
13.5.3.3.1.Automotive
13.5.3.3.2.Electronics
13.5.3.3.3.Gaming and Entertainment
13.5.3.3.4.Aerospace
13.5.3.3.5.Industrial
13.5.3.3.6.Healthcare
13.5.3.3.7.IT and Telecommunication
13.5.3.3.8.Defense
13.5.3.3.9.Others
13.5.4.New Zealand
13.5.4.1.New Zealand Thermal Interface Materials Market Revenue (US$ Mn) and Forecasts, By Type
13.5.4.1.1.Thermal Tapes
13.5.4.1.2.Thermal Pads
13.5.4.1.3.Thermal Putty
13.5.4.1.4.Greases
13.5.4.1.5.Gels
13.5.4.1.6.Thermal Adhesives
13.5.4.1.7.Dielectric Pads
13.5.4.1.8.Gap Fillers
13.5.4.1.9.Phase Change Materials
13.5.4.1.10.Others
13.5.4.2.New Zealand Thermal Interface Materials Market Revenue (US$ Mn) and Forecasts, By Distribution Channel
13.5.4.2.1.Direct
13.5.4.2.2.Indirect
13.5.4.3.New Zealand Thermal Interface Materials Market Revenue (US$ Mn) and Forecasts, By End Users Industry
13.5.4.3.1.Automotive
13.5.4.3.2.Electronics
13.5.4.3.3.Gaming and Entertainment
13.5.4.3.4.Aerospace
13.5.4.3.5.Industrial
13.5.4.3.6.Healthcare
13.5.4.3.7.IT and Telecommunication
13.5.4.3.8.Defense
13.5.4.3.9.Others
13.5.5.Australia
13.5.5.1.Australia Thermal Interface Materials Market Revenue (US$ Mn) and Forecasts, By Type
13.5.5.1.1.Thermal Tapes
13.5.5.1.2.Thermal Pads
13.5.5.1.3.Thermal Putty
13.5.5.1.4.Greases
13.5.5.1.5.Gels
13.5.5.1.6.Thermal Adhesives
13.5.5.1.7.Dielectric Pads
13.5.5.1.8.Gap Fillers
13.5.5.1.9.Phase Change Materials
13.5.5.1.10.Others
13.5.5.2.Australia Thermal Interface Materials Market Revenue (US$ Mn) and Forecasts, By Distribution Channel
13.5.5.2.1.Direct
13.5.5.2.2.Indirect
13.5.5.3.Australia Thermal Interface Materials Market Revenue (US$ Mn) and Forecasts, By End Users Industry
13.5.5.3.1.Automotive
13.5.5.3.2.Electronics
13.5.5.3.3.Gaming and Entertainment
13.5.5.3.4.Aerospace
13.5.5.3.5.Industrial
13.5.5.3.6.Healthcare
13.5.5.3.7.IT and Telecommunication
13.5.5.3.8.Defense
13.5.5.3.9.Others
13.5.6.South Korea
13.5.6.1.South Korea Thermal Interface Materials Market Revenue (US$ Mn) and Forecasts, By Type
13.5.6.1.1.Thermal Tapes
13.5.6.1.2.Thermal Pads
13.5.6.1.3.Thermal Putty
13.5.6.1.4.Greases
13.5.6.1.5.Gels
13.5.6.1.6.Thermal Adhesives
13.5.6.1.7.Dielectric Pads
13.5.6.1.8.Gap Fillers
13.5.6.1.9.Phase Change Materials
13.5.6.1.10.Others
13.5.6.2.South Korea Thermal Interface Materials Market Revenue (US$ Mn) and Forecasts, By Distribution Channel
13.5.6.2.1.Direct
13.5.6.2.2.Indirect
13.5.6.3.South Korea Thermal Interface Materials Market Revenue (US$ Mn) and Forecasts, By End Users Industry
13.5.6.3.1.Automotive
13.5.6.3.2.Electronics
13.5.6.3.3.Gaming and Entertainment
13.5.6.3.4.Aerospace
13.5.6.3.5.Industrial
13.5.6.3.6.Healthcare
13.5.6.3.7.IT and Telecommunication
13.5.6.3.8.Defense
13.5.6.3.9.Others
13.5.7.Southeast Asia
13.5.7.1.Southeast Asia Thermal Interface Materials Market Revenue (US$ Mn) and Forecasts, By Type
13.5.7.1.1.Thermal Tapes
13.5.7.1.2.Thermal Pads
13.5.7.1.3.Thermal Putty
13.5.7.1.4.Greases
13.5.7.1.5.Gels
13.5.7.1.6.Thermal Adhesives
13.5.7.1.7.Dielectric Pads
13.5.7.1.8.Gap Fillers
13.5.7.1.9.Phase Change Materials
13.5.7.1.10.Others
13.5.7.2.Southeast Asia Thermal Interface Materials Market Revenue (US$ Mn) and Forecasts, By Distribution Channel
13.5.7.2.1.Direct
13.5.7.2.2.Indirect
13.5.7.3.Southeast Asia Thermal Interface Materials Market Revenue (US$ Mn) and Forecasts, By End Users Industry
13.5.7.3.1.Automotive
13.5.7.3.2.Electronics
13.5.7.3.3.Gaming and Entertainment
13.5.7.3.4.Aerospace
13.5.7.3.5.Industrial
13.5.7.3.6.Healthcare
13.5.7.3.7.IT and Telecommunication
13.5.7.3.8.Defense
13.5.7.3.9.Others
13.5.7.4.Southeast Asia Thermal Interface Materials Market Revenue (US$ Mn) and Forecasts, By Country
13.5.7.4.1.Indonesia
13.5.7.4.2.Thailand
13.5.7.4.3.Malaysia
13.5.7.4.4.Singapore
13.5.7.4.5.Rest of Southeast Asia
13.5.8.Rest of Asia Pacific
13.5.8.1.Rest of Asia Pacific Thermal Interface Materials Market Revenue (US$ Mn) and Forecasts, By Type
13.5.8.1.1.Thermal Tapes
13.5.8.1.2.Thermal Pads
13.5.8.1.3.Thermal Putty
13.5.8.1.4.Greases
13.5.8.1.5.Gels
13.5.8.1.6.Thermal Adhesives
13.5.8.1.7.Dielectric Pads
13.5.8.1.8.Gap Fillers
13.5.8.1.9.Phase Change Materials
13.5.8.1.10.Others
13.5.8.2.Rest of Asia Pacific Thermal Interface Materials Market Revenue (US$ Mn) and Forecasts, By Distribution Channel
13.5.8.2.1.Direct
13.5.8.2.2.Indirect
13.5.8.3.Rest of Asia Pacific Thermal Interface Materials Market Revenue (US$ Mn) and Forecasts, By End Users Industry
13.5.8.3.1.Automotive
13.5.8.3.2.Electronics
13.5.8.3.3.Gaming and Entertainment
13.5.8.3.4.Aerospace
13.5.8.3.5.Industrial
13.5.8.3.6.Healthcare
13.5.8.3.7.IT and Telecommunication
13.5.8.3.8.Defense
13.5.8.3.9.Others
13.6.Key Segment for Channeling Investments
13.6.1.By Country
13.6.2.By Type
13.6.3.By Distribution Channel
13.6.4.By End Users Industry
14.Middle East and Africa Thermal Interface Materials Market Analysis and Forecasts, 2023 – 2031
14.1.Overview
14.1.1.Middle East and Africa Thermal Interface Materials Market Revenue (US$ Mn)
14.2.Middle East and Africa Thermal Interface Materials Market Revenue (US$ Mn) and Forecasts, By Type
14.2.1.Thermal Tapes
14.2.2.Thermal Pads
14.2.3.Thermal Putty
14.2.4.Greases
14.2.5.Gels
14.2.6.Thermal Adhesives
14.2.7.Dielectric Pads
14.2.8.Gap Fillers
14.2.9.Phase Change Materials
14.2.10.Others
14.3.Middle East and Africa Thermal Interface Materials Market Revenue (US$ Mn) and Forecasts, By Distribution Channel
14.3.1.Direct
14.3.2.Indirect
14.4.Middle East and Africa Thermal Interface Materials Market Revenue (US$ Mn) and Forecasts, By End Users Industry
14.4.1.Automotive
14.4.2.Electronics
14.4.3.Gaming and Entertainment
14.4.4.Aerospace
14.4.5.Industrial
14.4.6.Healthcare
14.4.7.IT and Telecommunication
14.4.8.Defense
14.4.9.Others
14.5.Middle East and Africa Thermal Interface Materials Market Revenue (US$ Mn) and Forecasts, By Country
14.5.1.Saudi Arabia
14.5.1.1.Saudi Arabia Thermal Interface Materials Market Revenue (US$ Mn) and Forecasts, By Type
14.5.1.1.1.Thermal Tapes
14.5.1.1.2.Thermal Pads
14.5.1.1.3.Thermal Putty
14.5.1.1.4.Greases
14.5.1.1.5.Gels
14.5.1.1.6.Thermal Adhesives
14.5.1.1.7.Dielectric Pads
14.5.1.1.8.Gap Fillers
14.5.1.1.9.Phase Change Materials
14.5.1.1.10.Others
14.5.1.2.Saudi Arabia Thermal Interface Materials Market Revenue (US$ Mn) and Forecasts, By Distribution Channel
14.5.1.2.1.Direct
14.5.1.2.2.Indirect
14.5.1.3.Saudi Arabia Thermal Interface Materials Market Revenue (US$ Mn) and Forecasts, By End Users Industry
14.5.1.3.1.Automotive
14.5.1.3.2.Electronics
14.5.1.3.3.Gaming and Entertainment
14.5.1.3.4.Aerospace
14.5.1.3.5.Industrial
14.5.1.3.6.Healthcare
14.5.1.3.7.IT and Telecommunication
14.5.1.3.8.Defense
14.5.1.3.9.Others
14.5.2.UAE
14.5.2.1.UAE Thermal Interface Materials Market Revenue (US$ Mn) and Forecasts, By Type
14.5.2.1.1.Thermal Tapes
14.5.2.1.2.Thermal Pads
14.5.2.1.3.Thermal Putty
14.5.2.1.4.Greases
14.5.2.1.5.Gels
14.5.2.1.6.Thermal Adhesives
14.5.2.1.7.Dielectric Pads
14.5.2.1.8.Gap Fillers
14.5.2.1.9.Phase Change Materials
14.5.2.1.10.Others
14.5.2.2.UAE Thermal Interface Materials Market Revenue (US$ Mn) and Forecasts, By Distribution Channel
14.5.2.2.1.Direct
14.5.2.2.2.Indirect
14.5.2.3.UAE Thermal Interface Materials Market Revenue (US$ Mn) and Forecasts, By End Users Industry
14.5.2.3.1.Automotive
14.5.2.3.2.Electronics
14.5.2.3.3.Gaming and Entertainment
14.5.2.3.4.Aerospace
14.5.2.3.5.Industrial
14.5.2.3.6.Healthcare
14.5.2.3.7.IT and Telecommunication
14.5.2.3.8.Defense
14.5.2.3.9.Others
14.5.3.Egypt
14.5.3.1.Egypt Thermal Interface Materials Market Revenue (US$ Mn) and Forecasts, By Type
14.5.3.1.1.Thermal Tapes
14.5.3.1.2.Thermal Pads
14.5.3.1.3.Thermal Putty
14.5.3.1.4.Greases
14.5.3.1.5.Gels
14.5.3.1.6.Thermal Adhesives
14.5.3.1.7.Dielectric Pads
14.5.3.1.8.Gap Fillers
14.5.3.1.9.Phase Change Materials
14.5.3.1.10.Others
14.5.3.2.Egypt Thermal Interface Materials Market Revenue (US$ Mn) and Forecasts, By Distribution Channel
14.5.3.2.1.Direct
14.5.3.2.2.Indirect
14.5.3.3.Egypt Thermal Interface Materials Market Revenue (US$ Mn) and Forecasts, By End Users Industry
14.5.3.3.1.Automotive
14.5.3.3.2.Electronics
14.5.3.3.3.Gaming and Entertainment
14.5.3.3.4.Aerospace
14.5.3.3.5.Industrial
14.5.3.3.6.Healthcare
14.5.3.3.7.IT and Telecommunication
14.5.3.3.8.Defense
14.5.3.3.9.Others
14.5.4.Kuwait
14.5.4.1.Kuwait Thermal Interface Materials Market Revenue (US$ Mn) and Forecasts, By Type
14.5.4.1.1.Thermal Tapes
14.5.4.1.2.Thermal Pads
14.5.4.1.3.Thermal Putty
14.5.4.1.4.Greases
14.5.4.1.5.Gels
14.5.4.1.6.Thermal Adhesives
14.5.4.1.7.Dielectric Pads
14.5.4.1.8.Gap Fillers
14.5.4.1.9.Phase Change Materials
14.5.4.1.10.Others
14.5.4.2.Kuwait Thermal Interface Materials Market Revenue (US$ Mn) and Forecasts, By Distribution Channel
14.5.4.2.1.Direct
14.5.4.2.2.Indirect
14.5.4.3.Kuwait Thermal Interface Materials Market Revenue (US$ Mn) and Forecasts, By End Users Industry
14.5.4.3.1.Automotive
14.5.4.3.2.Electronics
14.5.4.3.3.Gaming and Entertainment
14.5.4.3.4.Aerospace
14.5.4.3.5.Industrial
14.5.4.3.6.Healthcare
14.5.4.3.7.IT and Telecommunication
14.5.4.3.8.Defense
14.5.4.3.9.Others
14.5.5.South Africa
14.5.5.1.South Africa Thermal Interface Materials Market Revenue (US$ Mn) and Forecasts, By Type
14.5.5.1.1.Thermal Tapes
14.5.5.1.2.Thermal Pads
14.5.5.1.3.Thermal Putty
14.5.5.1.4.Greases
14.5.5.1.5.Gels
14.5.5.1.6.Thermal Adhesives
14.5.5.1.7.Dielectric Pads
14.5.5.1.8.Gap Fillers
14.5.5.1.9.Phase Change Materials
14.5.5.1.10.Others
14.5.5.2.South Africa Thermal Interface Materials Market Revenue (US$ Mn) and Forecasts, By Distribution Channel
14.5.5.2.1.Direct
14.5.5.2.2.Indirect
14.5.5.3.South Africa Thermal Interface Materials Market Revenue (US$ Mn) and Forecasts, By End Users Industry
14.5.5.3.1.Automotive
14.5.5.3.2.Electronics
14.5.5.3.3.Gaming and Entertainment
14.5.5.3.4.Aerospace
14.5.5.3.5.Industrial
14.5.5.3.6.Healthcare
14.5.5.3.7.IT and Telecommunication
14.5.5.3.8.Defense
14.5.5.3.9.Others
14.5.6.Rest of Middle East & Africa
14.5.6.1.Rest of Middle East & Africa Thermal Interface Materials Market Revenue (US$ Mn) and Forecasts, By Type
14.5.6.1.1.Thermal Tapes
14.5.6.1.2.Thermal Pads
14.5.6.1.3.Thermal Putty
14.5.6.1.4.Greases
14.5.6.1.5.Gels
14.5.6.1.6.Thermal Adhesives
14.5.6.1.7.Dielectric Pads
14.5.6.1.8.Gap Fillers
14.5.6.1.9.Phase Change Materials
14.5.6.1.10.Others
14.5.6.2.Rest of Middle East & Africa Thermal Interface Materials Market Revenue (US$ Mn) and Forecasts, By Distribution Channel
14.5.6.2.1.Direct
14.5.6.2.2.Indirect
14.5.6.3.Rest of Middle East & Africa Thermal Interface Materials Market Revenue (US$ Mn) and Forecasts, By End Users Industry
14.5.6.3.1.Automotive
14.5.6.3.2.Electronics
14.5.6.3.3.Gaming and Entertainment
14.5.6.3.4.Aerospace
14.5.6.3.5.Industrial
14.5.6.3.6.Healthcare
14.5.6.3.7.IT and Telecommunication
14.5.6.3.8.Defense
14.5.6.3.9.Others
14.6.Key Segment for Channeling Investments
14.6.1.By Country
14.6.2.By Type
14.6.3.By Distribution Channel
14.6.4.By End Users Industry
15.Latin America Thermal Interface Materials Market Analysis and Forecasts, 2023 – 2031
15.1.Overview
15.1.1.Latin America Thermal Interface Materials Market Revenue (US$ Mn)
15.2.Latin America Thermal Interface Materials Market Revenue (US$ Mn) and Forecasts, By Type
15.2.1.Thermal Tapes
15.2.2.Thermal Pads
15.2.3.Thermal Putty
15.2.4.Greases
15.2.5.Gels
15.2.6.Thermal Adhesives
15.2.7.Dielectric Pads
15.2.8.Gap Fillers
15.2.9.Phase Change Materials
15.2.10.Others
15.3.Latin America Thermal Interface Materials Market Revenue (US$ Mn) and Forecasts, By Distribution Channel
15.3.1.Direct
15.3.2.Indirect
15.4.Latin America Thermal Interface Materials Market Revenue (US$ Mn) and Forecasts, By End Users Industry
15.4.1.Automotive
15.4.2.Electronics
15.4.3.Gaming and Entertainment
15.4.4.Aerospace
15.4.5.Industrial
15.4.6.Healthcare
15.4.7.IT and Telecommunication
15.4.8.Defense
15.4.9.Others
15.5.Latin America Thermal Interface Materials Market Revenue (US$ Mn) and Forecasts, By Country
15.5.1.Brazil
15.5.1.1.Brazil Thermal Interface Materials Market Revenue (US$ Mn) and Forecasts, By Type
15.5.1.1.1.Thermal Tapes
15.5.1.1.2.Thermal Pads
15.5.1.1.3.Thermal Putty
15.5.1.1.4.Greases
15.5.1.1.5.Gels
15.5.1.1.6.Thermal Adhesives
15.5.1.1.7.Dielectric Pads
15.5.1.1.8.Gap Fillers
15.5.1.1.9.Phase Change Materials
15.5.1.1.10.Others
15.5.1.2.Brazil Thermal Interface Materials Market Revenue (US$ Mn) and Forecasts, By Distribution Channel
15.5.1.2.1.Direct
15.5.1.2.2.Indirect
15.5.1.3.Brazil Thermal Interface Materials Market Revenue (US$ Mn) and Forecasts, By End Users Industry
15.5.1.3.1.Automotive
15.5.1.3.2.Electronics
15.5.1.3.3.Gaming and Entertainment
15.5.1.3.4.Aerospace
15.5.1.3.5.Industrial
15.5.1.3.6.Healthcare
15.5.1.3.7.IT and Telecommunication
15.5.1.3.8.Defense
15.5.1.3.9.Others
15.5.2.Argentina
15.5.2.1.Argentina Thermal Interface Materials Market Revenue (US$ Mn) and Forecasts, By Type
15.5.2.1.1.Thermal Tapes
15.5.2.1.2.Thermal Pads
15.5.2.1.3.Thermal Putty
15.5.2.1.4.Greases
15.5.2.1.5.Gels
15.5.2.1.6.Thermal Adhesives
15.5.2.1.7.Dielectric Pads
15.5.2.1.8.Gap Fillers
15.5.2.1.9.Phase Change Materials
15.5.2.1.10.Others
15.5.2.2.Argentina Thermal Interface Materials Market Revenue (US$ Mn) and Forecasts, By Distribution Channel
15.5.2.2.1.Direct
15.5.2.2.2.Indirect
15.5.2.3.Argentina Thermal Interface Materials Market Revenue (US$ Mn) and Forecasts, By End Users Industry
15.5.2.3.1.Automotive
15.5.2.3.2.Electronics
15.5.2.3.3.Gaming and Entertainment
15.5.2.3.4.Aerospace
15.5.2.3.5.Industrial
15.5.2.3.6.Healthcare
15.5.2.3.7.IT and Telecommunication
15.5.2.3.8.Defense
15.5.2.3.9.Others
15.5.3.Rest of Latin America
15.5.3.1.Rest of Latin America Thermal Interface Materials Market Revenue (US$ Mn) and Forecasts, By Type
15.5.3.1.1.Thermal Tapes
15.5.3.1.2.Thermal Pads
15.5.3.1.3.Thermal Putty
15.5.3.1.4.Greases
15.5.3.1.5.Gels
15.5.3.1.6.Thermal Adhesives
15.5.3.1.7.Dielectric Pads
15.5.3.1.8.Gap Fillers
15.5.3.1.9.Phase Change Materials
15.5.3.1.10.Others
15.5.3.2.Rest of Latin America Thermal Interface Materials Market Revenue (US$ Mn) and Forecasts, By Distribution Channel
15.5.3.2.1.Direct
15.5.3.2.2.Indirect
15.5.3.3.Rest of Latin America Thermal Interface Materials Market Revenue (US$ Mn) and Forecasts, By End Users Industry
15.5.3.3.1.Automotive
15.5.3.3.2.Electronics
15.5.3.3.3.Gaming and Entertainment
15.5.3.3.4.Aerospace
15.5.3.3.5.Industrial
15.5.3.3.6.Healthcare
15.5.3.3.7.IT and Telecommunication
15.5.3.3.8.Defense
15.5.3.3.9.Others
15.6.Key Segment for Channeling Investments
15.6.1.By Country
15.6.2.By Type
15.6.3.By Distribution Channel
15.6.4.By End Users Industry
16.Competitive Benchmarking
16.1.Market Share Analysis, 2022
16.2.Global Presence and Growth Strategies
16.2.1.Mergers and Acquisitions
16.2.2.Product Launches
16.2.3.Investments Trends
16.2.4.R&D Initiatives
17.Player Profiles
17.1.Boyd
17.1.1.Company Details
17.1.2.Company Overview
17.1.3.Product Offerings
17.1.4.Key Developments
17.1.5.Financial Analysis
17.1.6.SWOT Analysis
17.1.7.Business Strategies
17.2.DuPont
17.2.1.Company Details
17.2.2.Company Overview
17.2.3.Product Offerings
17.2.4.Key Developments
17.2.5.Financial Analysis
17.2.6.SWOT Analysis
17.2.7.Business Strategies
17.3.Henkel Corporation
17.3.1.Company Details
17.3.2.Company Overview
17.3.3.Product Offerings
17.3.4.Key Developments
17.3.5.Financial Analysis
17.3.6.SWOT Analysis
17.3.7.Business Strategies
17.4.Honeywell International Inc.
17.4.1.Company Details
17.4.2.Company Overview
17.4.3.Product Offerings
17.4.4.Key Developments
17.4.5.Financial Analysis
17.4.6.SWOT Analysis
17.4.7.Business Strategies
17.5.Indium Corporation
17.5.1.Company Details
17.5.2.Company Overview
17.5.3.Product Offerings
17.5.4.Key Developments
17.5.5.Financial Analysis
17.5.6.SWOT Analysis
17.5.7.Business Strategies
17.6.Infineon Technologies AG
17.6.1.Company Details
17.6.2.Company Overview
17.6.3.Product Offerings
17.6.4.Key Developments
17.6.5.Financial Analysis
17.6.6.SWOT Analysis
17.6.7.Business Strategies
17.7.Laird Technologies, Inc.
17.7.1.Company Details
17.7.2.Company Overview
17.7.3.Product Offerings
17.7.4.Key Developments
17.7.5.Financial Analysis
17.7.6.SWOT Analysis
17.7.7.Business Strategies
17.8.Linseis GmbH
17.8.1.Company Details
17.8.2.Company Overview
17.8.3.Product Offerings
17.8.4.Key Developments
17.8.5.Financial Analysis
17.8.6.SWOT Analysis
17.8.7.Business Strategies
17.9.Nordson Corporation
17.9.1.Company Details
17.9.2.Company Overview
17.9.3.Product Offerings
17.9.4.Key Developments
17.9.5.Financial Analysis
17.9.6.SWOT Analysis
17.9.7.Business Strategies
17.10.PARKER HANNIFIN CORP
17.10.1.Company Details
17.10.2.Company Overview
17.10.3.Product Offerings
17.10.4.Key Developments
17.10.5.Financial Analysis
17.10.6.SWOT Analysis
17.10.7.Business Strategies
17.11.Prostech.
17.11.1.Company Details
17.11.2.Company Overview
17.11.3.Product Offerings
17.11.4.Key Developments
17.11.5.Financial Analysis
17.11.6.SWOT Analysis
17.11.7.Business Strategies
17.12.Robert McKeown Company, Inc.
17.12.1.Company Details
17.12.2.Company Overview
17.12.3.Product Offerings
17.12.4.Key Developments
17.12.5.Financial Analysis
17.12.6.SWOT Analysis
17.12.7.Business Strategies
17.13.Saint-Gobain
17.13.1.Company Details
17.13.2.Company Overview
17.13.3.Product Offerings
17.13.4.Key Developments
17.13.5.Financial Analysis
17.13.6.SWOT Analysis
17.13.7.Business Strategies
17.14.Semikron Danfoss
17.14.1.Company Details
17.14.2.Company Overview
17.14.3.Product Offerings
17.14.4.Key Developments
17.14.5.Financial Analysis
17.14.6.SWOT Analysis
17.14.7.Business Strategies
17.15.Shin-Etsu Chemical Co., Ltd
17.15.1.Company Details
17.15.2.Company Overview
17.15.3.Product Offerings
17.15.4.Key Developments
17.15.5.Financial Analysis
17.15.6.SWOT Analysis
17.15.7.Business Strategies
17.16.STOCKWELL ELASTOMERICS, INC.
17.16.1.Company Details
17.16.2.Company Overview
17.16.3.Product Offerings
17.16.4.Key Developments
17.16.5.Financial Analysis
17.16.6.SWOT Analysis
17.16.7.Business Strategies
17.17.SUR-SEAL
17.17.1.Company Details
17.17.2.Company Overview
17.17.3.Product Offerings
17.17.4.Key Developments
17.17.5.Financial Analysis
17.17.6.SWOT Analysis
17.17.7.Business Strategies
17.18.T-Global Technology
17.18.1.Company Details
17.18.2.Company Overview
17.18.3.Product Offerings
17.18.4.Key Developments
17.18.5.Financial Analysis
17.18.6.SWOT Analysis
17.18.7.Business Strategies
17.19.Other market participants
18.Key Findings

.

Note: This ToC is tentative and can be changed according to the research study conducted during the course of report completion.

.

**Exclusive for Multi-User and Enterprise User.

.

Global Thermal Interface Materials Market Segmentation

Global Thermal Interface Materials Market –Type Outlook

 Thermal Tapes
 Thermal Pads
 Thermal Putty
 Greases
 Gels
 Thermal Adhesives
 Dielectric Pads
 Gap Fillers
 Phase Change Materials
 Others

Global Thermal Interface Materials Market –Distribution Channel Outlook

 Direct
 Indirect

Global Thermal Interface Materials Market End User Industry Outlook

 Automotive
 Electronics
 Gaming and Entertainment
 Aerospace
 Industrial
 Healthcare
 IT and Telecommunication
 Defense
 Others

Global Thermal Interface Materials Market – Regional Outlook

 North America (U.S., Canada, Mexico, Rest of North America)
 Europe (France, The UK, Spain, Germany, Italy, Nordic Countries (Denmark, Finland, Iceland, Sweden, Norway), Benelux Union (Belgium, The Netherlands, Luxembourg), Rest of Europe)
 Asia Pacific (China, Japan, India, New Zealand, Australia, South Korea, Southeast Asia (Indonesia, Thailand, Malaysia, Singapore, Rest of Southeast Asia), Rest of Asia Pacific)
 Middle East & Africa (Saudi Arabia, UAE, Egypt, Kuwait, South Africa, Rest of Middle East & Africa)
 Latin America (Brazil, Argentina, Rest of Latin America)

**Note: The report covers cross-segmentation analysis by region further into countries

.

The Niche Research approach encompasses both primary and secondary research methods to provide comprehensive insights. While primary research is the cornerstone of our studies, we also incorporate secondary research sources such as company annual reports, premium industry databases, press releases, industry journals, and white papers.

Within our primary research, we actively engage with various industry stakeholders, conducting paid interviews and surveys. Our meticulous analysis extends to every market participant in major countries, allowing us to thoroughly examine their portfolios, calculate market shares, and segment revenues.

Our data collection primarily focuses on individual countries within our research scope, enabling us to estimate regional market sizes. Typically, we employ a bottom-up approach, meticulously tracking trends in different countries. We analyze growth drivers, constraints, technological innovations, and opportunities for each country, ultimately arriving at regional figures.Our process begins by examining the growth prospects of each country. Building upon these insights, we project growth and trends for the entire region. Finally, we utilize our proprietary model to refine estimations and forecasts.

Our data validation standards are integral to ensuring the reliability and accuracy of our research findings. Here’s a breakdown of our data validation processes and the stakeholders we engage with during our primary research:

  • Supply Side Analysis: We initiate a supply side analysis by directly contacting market participants, through telephonic interviews and questionnaires containing both open-ended and close-ended questions. We gather information on their portfolios, segment revenues, developments, and growth strategies.
  • Demand Side Analysis: To gain insights into adoption trends and consumer preferences, we reach out to target customers and users (non-vendors). This information forms a vital part of the qualitative analysis section of our reports, covering market dynamics, adoption trends, consumer behavior, spending patterns, and other related aspects.
  • Consultant Insights: We tap into the expertise of our partner consultants from around the world to obtain their unique viewpoints and perspectives. Their insights contribute to a well-rounded understanding of the markets under investigation.
  • In-House Validation: To ensure data accuracy and reliability, we conduct cross-validation of data points and information through our in-house team of consultants and utilize advanced data modeling tools for thorough verification.

The forecasts we provide are based on a comprehensive assessment of various factors, including:

  • Market Trends and Past Performance (Last Five Years): We accurately analyze market trends and performance data from preceding five years to identify historical patterns and understand the market’s evolution.
  • Historical Performance and Growth of Market Participants: We assess the historical performance and growth trajectories of key market participants. This analysis provides insights into the competitive landscape and individual company strategies.
  • Market Determinants Impact Analysis (Next Eight Years): We conduct a rigorous analysis of the factors that are projected to influence the market over the next eight years. This includes assessing both internal and external determinants that can shape market dynamics.
  • Drivers and Challenges for the Forecast Period:Identify the factors expected to drive market growth during the forecast period, as well as the challenges that the industry may face. This analysis aids in deriving an accurate growth rate projection.
  • New Acquisitions, Collaborations, or Partnerships: We keep a close watch on any new acquisitions, collaborations, or partnerships within the industry. These developments can have a significant impact on market dynamics and competitiveness.
  • Macro and Micro Factors Analysis:A thorough examination of both macro-level factors (e.g., economic trends, regulatory changes) and micro-level factors (e.g., technological advancements, consumer preferences) that may influence the market during the forecast period.
  • End-User Sentiment Analysis: To understand the market from the end-user perspective, we conduct sentiment analysis. This involves assessing the sentiment, preferences, and feedback of the end-users, which can provide valuable insights into market trends.
  • Perspective of Primary Participants: Insights gathered directly from primary research participants play a crucial role in shaping our forecasts. Their perspectives and experiences provide valuable qualitative data.
  • Year-on-Year Growth Trend: We utilize a year-on-year growth trend based on historical market growth and expected future trends. This helps in formulating our growth projections, aligning them with the market’s historical performance.

Research process adopted by TNR involves multiple stages, including data collection, validation, quality checks, and presentation. It’s crucial that the data and information we provide add value to your existing market understanding and expertise. We have also established partnerships with business consulting, research, and survey organizations across regions and globally to collaborate on regional analysis and data validation, ensuring the highest level of accuracy and reliability in our reports.


Procure Comprehensive Study of

Global Thermal Interface Materials Market

Online Only

  • Online Access
  • Read Only File
  • Validity 3 Months
  • Print, Copy, Paste & Download
  • PPT, Excel
  • Cost-Free Report in the Next Update
$3300
Buy Now

Single User

  • Access to One User on One System
  • Read Only File
  • Validity 6 Months
  • Limited Print,Copy, Paste
  • PPT, Excel
  • Cost-Free Report in the Next Update
$4200
Buy Now

Multi User

  • Access to Fiver Users
  • PDF File
  • Validity 1 Year
  • Upto FivePrints
  • Cost-Free Report in the Next Update
  • PPT, Excel
$6000
Buy Now

Enterprise User

  • Access to Unlimited Users
  • PDF, PPT, Excel
  • Unlimited Validity, Prints&Downloads
  • 1 Hour Cost-Free & Dedicated Analyst Support
  • 10% Cost-Free Customization
  • Cost-Free Report Update Twice in a Year
  • Recommendations for Business Strategies
  • Authorization to Quote TNR, The Niche Research
$7300
Buy Now

Library Access

  • Online Access to Content Publications
  • Access Player Profiles Online
  • Get Immediate Access to Newly Added Content
  • Acquire 12 PDF Downloads
  • Acquire 5 Excel Data Sets
  • Gain Access to 290+ PDFs of Company Profiles
  • Round-the-clock Email and Phone Assistance
  • Dashboard Usage and Trends
  • Renewal & Upgrade Assistance
  • Assessing Customization Options and Alerts for New Reports
$10788
Buy Now
*Taxes/Fees, if applicable will be added during checkout. All prices in USD

Why TNR The Niche Research?

  • Unwavering Commitment to Excellence

  • Veteran Team of Researchers

  • Accurate and Timely Insights

  • Ethical Practices and Customized Service

  • Uninterrupted Availability Around the Clock

Scroll to Top