Global UHMW PE Market, By Form, By Application, By End Use Industry, By Region & Segmental Insights Trends and Forecast, 2024 – 2034

  • Industry: Chemicals & Materials
  • Report ID: TNR-110-1256
  • Number of Pages: 420
  • Table/Charts : Yes
  • August, 2024
  • Base Year : 2024
  • No. of Companies : 10+
  • No. of Countries : 29
  • Views : 10061
  • Covid Impact Covered: Yes
  • War Impact Covered: Yes
  • Formats : PDF, Excel, PPT

The global ultra-high molecular weight polyethylene (UHMW PE) market is poised for robust growth, driven by its increasing adoption across various industries such as healthcare, automotive, and aerospace. Key growth drivers include the material’s superior properties, including high impact resistance, low friction, and excellent chemical resistance, which make it ideal for demanding applications. Emerging trends highlight the rising demand for lightweight, durable materials in advanced manufacturing processes.

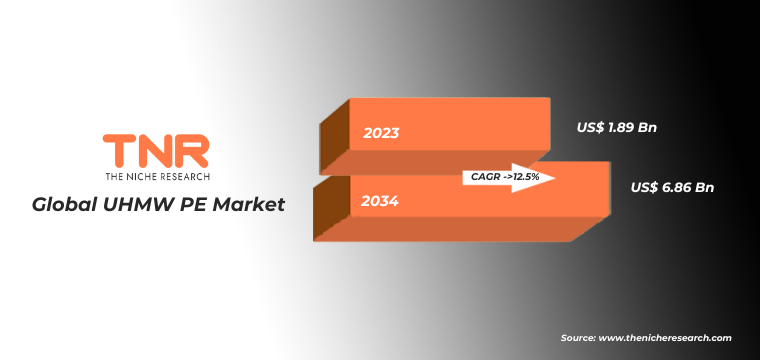
The push towards sustainability offers opportunities for developing eco-friendly UHMW PE variants. Expanding applications in medical devices, automotive components, and industrial machinery, coupled with technological advancements, are expected to further fuel market expansion. The market’s future is bright, with significant opportunities in both established and emerging markets globally. In Terms of Revenue, the Global UHMW PE Market was Worth US$ 1.89 Bn in 2023 and is Anticipated to Witness a CAGR of 12.5% During 2024 – 2034.

Opportunities in UHMW PE Market

Expansion in Medical Device Applications

The growing demand for advanced medical devices presents a significant opportunity for the UHMW PE market. With its high biocompatibility, wear resistance, and low friction properties, UHMW PE is increasingly used in orthopedic implants, joint replacements, and cardiovascular devices. As healthcare systems worldwide continue to prioritize minimally invasive procedures and long-lasting medical solutions, the need for durable, high-performance materials like UHMW PE will expand. Additionally, the aging global population and the rise in chronic health conditions further drive the demand for innovative medical devices, offering substantial growth potential for UHMW PE manufacturers in the healthcare sector.

Advancements in Sustainable Manufacturing

The shift towards sustainable manufacturing practices offers a promising opportunity for the UHMW PE market. As industries seek to reduce their environmental impact, the demand for eco-friendly materials is on the rise. UHMW PE, known for its durability and long lifespan, aligns with this trend, especially when produced using sustainable processes. The recent achievement of ISCC PLUS certification by companies like Asahi Kasei highlights the potential for UHMW PE to meet stringent sustainability standards. This certification not only enhances the material’s appeal but also opens doors to new markets where environmental compliance is a critical factor, driving growth in eco-conscious sectors.

UHMW PE Market Segmentation by Form, Application, End Use Industry and Region

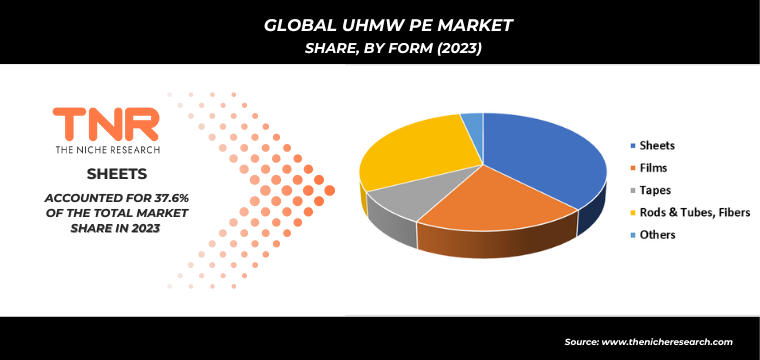
Sheets segment by form dominated the UHMW PE market, capturing a significant revenue share of 37.6% over the forecast period. This dominance is attributed to the widespread use of UHMW PE sheets in various industries, including automotive, healthcare, and industrial equipment, where their exceptional wear resistance, low friction, and durability are highly valued. These sheets are particularly favored for lining chutes, hoppers, and conveyor systems, where reducing friction and improving material flow are critical. As demand for robust and long-lasting materials continues to rise, the sheets segment is poised for continued growth.

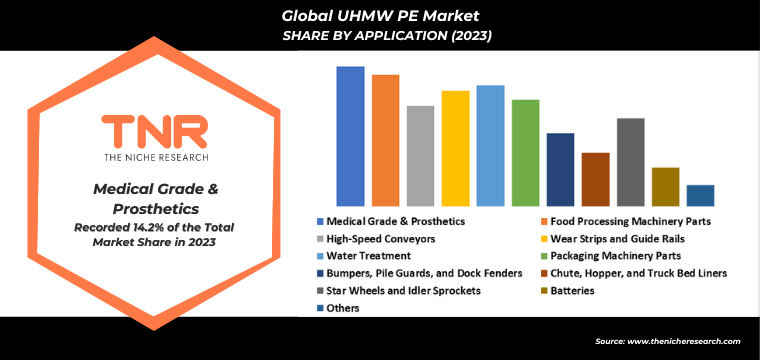
Medical grade & prosthetics segment by application is set to dominate the UHMW PE market, commanding a substantial revenue share of 14.2% over the forecast period. This growth is driven by the increasing demand for high-performance materials in the healthcare sector, particularly for orthopedic implants, joint replacements, and other prosthetic devices. UHMW PE’s exceptional biocompatibility, wear resistance, and low friction properties make it an ideal choice for these critical applications. As the global population ages and the prevalence of chronic conditions rises, the demand for durable and reliable medical-grade materials is set to propel this segment’s dominance in the market.

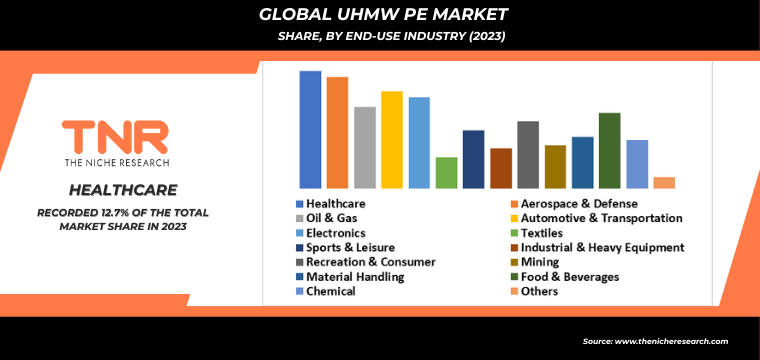
Aerospace & defense segment is anticipated to be the fastest-growing end use industry in the UHMW PE market, capturing a substantial revenue share of 12.1% over the forecast period. This rapid growth is driven by UHMW PE’s exceptional properties, such as high impact resistance, low weight, and durability, which are crucial for applications in aircraft and military equipment. UHMW PE is increasingly used in components like aircraft interior linings, protective gear, and high-performance parts due to its ability to withstand harsh conditions and reduce friction. As the aerospace and defense sectors continue to advance technologically and seek more efficient materials, UHMW PE’s role is set to expand, fueling its market growth.

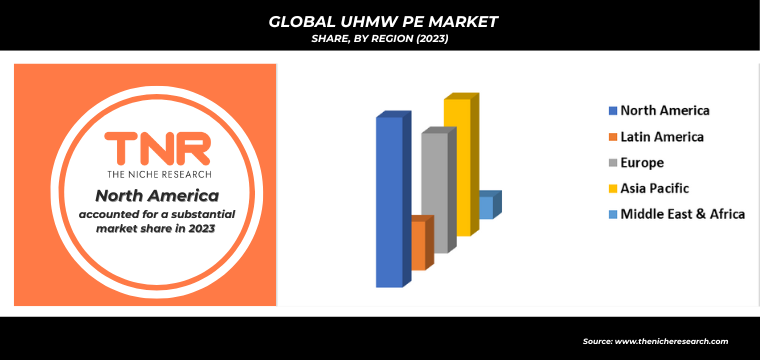
By 2034, Asia Pacific is anticipated to play a significant role in propelling the growth of the UHMW PE market, contributing approximately 27.5% to its overall expansion. This growth is fueled by rapid industrialization, infrastructure development, and a burgeoning automotive sector in countries like China, India, and Japan. The region’s strong manufacturing base and increasing investments in high-performance materials are key factors driving demand for UHMW PE. Additionally, the rising adoption of UHMW PE in medical devices and advanced engineering applications further supports its market growth. As Asia Pacific continues to develop economically and technologically, its role in propelling the UHMW PE market forward will become increasingly significant.

Key Developments

  • In January 2024, Asahi Kasei, along with its affiliated company, obtained the ISCC PLUS international sustainability certification for various products, including ultra-high molecular weight polyethylene. This certification enables the company to provide ISCC PLUS certified grades of materials such as thermoplastic elastomers, rubbers, and engineering plastics.
  • In February 2023, Honeywell International Inc. expanded its Spectra Medical Grade (MG) BIO fiber line by introducing ultra-fine fibers. These fibers are designed for minimally invasive orthopedic and cardiovascular devices, enhancing both the performance and longevity of these medical devices.

Major Players in UHMW PE Market

  • Asahi Kasei Corporation
  • Braskem
  • Celanese Corporation
  • China Petrochemical Corporation
  • Crown Plastics, Inc.
  • Dotmar Engineering Plastics
  • Garland Manufacturing Company
  • Honeywell International, Inc.
  • Koninklijke DSM N.V.
  • LianLe Chemical Corporation
  • LyondellBasell Industries Holdings B.V
  • Mitsubishi Chemical Advanced Materials Group
  • Mitsui Chemicals, Inc.
  • TSE Industries, Inc.
  • Other Industry Participants

Global UHMW PE Market 

Report Specifications Details
Market Revenue in 2023 US$ 1.89 Bn
Market Size Forecast by 2034 US$ 6.86 Bn
Growth Rate (CAGR) 12.5%
Historic Data 2016 – 2022
Base Year for Estimation 2023
Forecast Period 2024 – 2034
Report Inclusions Market Size & Estimates, Market Dynamics, Competitive Scenario, Trends, Growth Factors, Market Determinants, Key Investment Segmentation, Product/Service/Solutions Benchmarking
Segments Covered By Form, By Application, By End Use Industry, By Region
Regions Covered North America, Europe, Asia Pacific, Middle East & Africa, Latin America
Countries Covered U.S., Canada, Mexico, Rest of North America,  France, The UK, Spain, Germany, Italy, Nordic Countries (Denmark, Finland, Iceland, Sweden, Norway), Benelux Union (Belgium, The Netherlands, Luxembourg), Rest of Europe,  China, Japan, India, New Zealand, Australia, South Korea, Southeast Asia (Indonesia, Thailand, Malaysia, Singapore, Rest of Southeast Asia), Rest of Asia Pacific,  Saudi Arabia, UAE, Egypt, Kuwait, South Africa, Rest of Middle East & Africa,  Brazil, Argentina, Rest of Latin America
Key Players Asahi Kasei Corporation, Braskem, Celanese Corporation, China Petrochemical Corporation, Crown Plastics, Inc., Dotmar Engineering Plastics, Garland Manufacturing Company, Honeywell International, Inc., Koninklijke DSM N.V., LianLe Chemical Corporation, LyondellBasell Industries Holdings B.V, Mitsubishi Chemical Advanced Materials Group, Mitsui Chemicals, Inc., TSE Industries, Inc.
Customization Scope Customization allows for the inclusion/modification of content pertaining to geographical regions, countries, and specific market segments.
Pricing & Procurement Options Explore purchase options tailored to your specific research requirements
Contact Details Consult With Our Expert

Japan (Toll-Free):  +81 663-386-8111

South Korea (Toll-Free):  +82-808- 703-126

Saudi Arabia (Toll-Free):  +966 800-850-1643

United Kingdom: +44 753-710-5080

United States: +1 302-232-5106

E-mail:  askanexpert@thenicheresearch.com


Global UHMW PE Market

By Form

  • Sheets
  • Films
  • Tapes
  • Rods & Tubes, Fibers
  • Others

By Application

  • Medical Grade & Prosthetics
  • Food Processing Machinery Parts
  • High-Speed Conveyors
  • Wear Strips and Guide Rails
  • Water Treatment
  • Packaging Machinery Parts
  • Bumpers, Pile Guards, and Dock Fenders
  • Chute, Hopper, and Truck Bed Liners
  • Star Wheels and Idler Sprockets
  • Batteries
  • Others

By End Use Industry

  • Healthcare
  • Aerospace & Defense
  • Oil & Gas
  • Automotive & Transportation
  • Electronics
  • Textiles
  • Sports & Leisure
  • Industrial & Heavy Equipment
  • Recreation & Consumer
  • Mining
  • Material Handling
  • Food & Beverages
  • Chemical
  • Others

By Region

  • North America (U.S., Canada, Mexico, Rest of North America)
  • Europe (France, The UK, Spain, Germany, Italy, Nordic Countries (Denmark, Finland, Iceland, Sweden, Norway), Benelux Union (Belgium, The Netherlands, Luxembourg), Rest of Europe)
  • Asia Pacific (China, Japan, India, New Zealand, Australia, South Korea, Southeast Asia (Indonesia, Thailand, Malaysia, Singapore, Rest of Southeast Asia), Rest of Asia Pacific)
  • Middle East & Africa (Saudi Arabia, UAE, Egypt, Kuwait, South Africa, Rest of Middle East & Africa)
  • Latin America (Brazil, Argentina, Rest of Latin America)

Global UHMW PE Market Layout

Table of Contents

.

1.Market Scope
1.1.Market Segmentation
1.2.Years Considered
1.2.1.Historic Years: 2016 – 2022
1.2.2.Base Year: 2023
1.2.3.Forecast Years: 2024 – 2034
2.Key Target Audiences
3.Research Methodology
3.1.Primary Research
3.1.1.Research Questionnaire
3.1.2.Global Percentage Breakdown
3.1.3.Primary Interviews: Key Opinion Leaders (KOLs)
3.2.Secondary Research
3.2.1.Paid Databases
3.2.2.Secondary Sources
3.3.Market Size Estimates
3.3.1.Top-Down Approach
3.3.2.Bottom-Up Approach
3.4.Data Triangulation Methodology
3.5.Research Assumptions
4.Recommendations and Insights from TNR’s Perspective**
5.Holistic Overview of UHMW PE Market
6.Market Synopsis: UHMW PE Market
7.UHMW PE Market Analysis: Qualitative Perspective
7.1.Introduction
7.1.1.Product Definition
7.1.2.Industry Development
7.2.Market Dynamics
7.2.1.Drivers
7.2.2.Restraints
7.2.3.Opportunities
7.2.4.Challenges
7.3.Trends in UHMW PE Market
7.4.Market Determinants Radar Chart
7.5.Macro-Economic and Micro-Economic Indicators: UHMW PE Market
7.6.Industry Gross Margin Overview
7.7.Porter’s Five Force Analysis
7.8.Impact of Covid-19 on UHMW PE Market
7.9.PESTEL Analysis
7.10.Value Chain Analysis
7.11.Pricing Analysis, By Region (2023)
7.11.1.North America
7.11.2.Europe
7.11.3.Asia Pacific
7.11.4.Middle East and Africa
7.11.5.Latin America
8.Global UHMW PE Market Analysis and Forecasts, 2024 – 2034
8.1.Overview
8.1.1.Global UHMW PE Market Revenue (US$ Mn)
8.2.Global UHMW PE Market Revenue (US$ Mn) and Forecasts, By Form
8.2.1.Sheets
8.2.1.1.Definition
8.2.1.2.Market Estimation and Penetration, 2016 – 2023
8.2.1.3.Market Forecast, 2024 – 2034
8.2.1.4.Compound Annual Growth Rate (CAGR)
8.2.1.5.Regional Bifurcation
8.2.1.5.1.North America
8.2.1.5.1.1.Market Estimation, 2016 – 2023
8.2.1.5.1.2.Market Forecast, 2024 – 2034
8.2.1.5.2.Europe
8.2.1.5.2.1.Market Estimation, 2016 – 2023
8.2.1.5.2.2.Market Forecast, 2024 – 2034
8.2.1.5.3.Asia Pacific
8.2.1.5.3.1.Market Estimation, 2016 – 2023
8.2.1.5.3.2.Market Forecast, 2024 – 2034
8.2.1.5.4.Middle East and Africa
8.2.1.5.4.1.Market Estimation, 2016 – 2023
8.2.1.5.4.2.Market Forecast, 2024 – 2034
8.2.1.5.5.Latin America
8.2.1.5.5.1.Market Estimation, 2016 – 2023
8.2.1.5.5.2.Market Forecast, 2024 – 2034
8.2.2.Films
8.2.2.1.Definition
8.2.2.2.Market Estimation and Penetration, 2016 – 2023
8.2.2.3.Market Forecast, 2024 – 2034
8.2.2.4.Compound Annual Growth Rate (CAGR)
8.2.2.5.Regional Bifurcation
8.2.2.5.1.North America
8.2.2.5.1.1.Market Estimation, 2016 – 2023
8.2.2.5.1.2.Market Forecast, 2024 – 2034
8.2.2.5.2.Europe
8.2.2.5.2.1.Market Estimation, 2016 – 2023
8.2.2.5.2.2.Market Forecast, 2024 – 2034
8.2.2.5.3.Asia Pacific
8.2.2.5.3.1.Market Estimation, 2016 – 2023
8.2.2.5.3.2.Market Forecast, 2024 – 2034
8.2.2.5.4.Middle East and Africa
8.2.2.5.4.1.Market Estimation, 2016 – 2023
8.2.2.5.4.2.Market Forecast, 2024 – 2034
8.2.2.5.5.Latin America
8.2.2.5.5.1.Market Estimation, 2016 – 2023
8.2.2.5.5.2.Market Forecast, 2024 – 2034
8.2.3.Tapes
8.2.3.1.Definition
8.2.3.2.Market Estimation and Penetration, 2016 – 2023
8.2.3.3.Market Forecast, 2024 – 2034
8.2.3.4.Compound Annual Growth Rate (CAGR)
8.2.3.5.Regional Bifurcation
8.2.3.5.1.North America
8.2.3.5.1.1.Market Estimation, 2016 – 2023
8.2.3.5.1.2.Market Forecast, 2024 – 2034
8.2.3.5.2.Europe
8.2.3.5.2.1.Market Estimation, 2016 – 2023
8.2.3.5.2.2.Market Forecast, 2024 – 2034
8.2.3.5.3.Asia Pacific
8.2.3.5.3.1.Market Estimation, 2016 – 2023
8.2.3.5.3.2.Market Forecast, 2024 – 2034
8.2.3.5.4.Middle East and Africa
8.2.3.5.4.1.Market Estimation, 2016 – 2023
8.2.3.5.4.2.Market Forecast, 2024 – 2034
8.2.3.5.5.Latin America
8.2.3.5.5.1.Market Estimation, 2016 – 2023
8.2.3.5.5.2.Market Forecast, 2024 – 2034
8.2.4.Rods and Tubes, Fibers
8.2.4.1.Definition
8.2.4.2.Market Estimation and Penetration, 2016 – 2023
8.2.4.3.Market Forecast, 2024 – 2034
8.2.4.4.Compound Annual Growth Rate (CAGR)
8.2.4.5.Regional Bifurcation
8.2.4.5.1.North America
8.2.4.5.1.1.Market Estimation, 2016 – 2023
8.2.4.5.1.2.Market Forecast, 2024 – 2034
8.2.4.5.2.Europe
8.2.4.5.2.1.Market Estimation, 2016 – 2023
8.2.4.5.2.2.Market Forecast, 2024 – 2034
8.2.4.5.3.Asia Pacific
8.2.4.5.3.1.Market Estimation, 2016 – 2023
8.2.4.5.3.2.Market Forecast, 2024 – 2034
8.2.4.5.4.Middle East and Africa
8.2.4.5.4.1.Market Estimation, 2016 – 2023
8.2.4.5.4.2.Market Forecast, 2024 – 2034
8.2.4.5.5.Latin America
8.2.4.5.5.1.Market Estimation, 2016 – 2023
8.2.4.5.5.2.Market Forecast, 2024 – 2034
8.2.5.Others
8.2.5.1.Definition
8.2.5.2.Market Estimation and Penetration, 2016 – 2023
8.2.5.3.Market Forecast, 2024 – 2034
8.2.5.4.Compound Annual Growth Rate (CAGR)
8.2.5.5.Regional Bifurcation
8.2.5.5.1.North America
8.2.5.5.1.1.Market Estimation, 2016 – 2023
8.2.5.5.1.2.Market Forecast, 2024 – 2034
8.2.5.5.2.Europe
8.2.5.5.2.1.Market Estimation, 2016 – 2023
8.2.5.5.2.2.Market Forecast, 2024 – 2034
8.2.5.5.3.Asia Pacific
8.2.5.5.3.1.Market Estimation, 2016 – 2023
8.2.5.5.3.2.Market Forecast, 2024 – 2034
8.2.5.5.4.Middle East and Africa
8.2.5.5.4.1.Market Estimation, 2016 – 2023
8.2.5.5.4.2.Market Forecast, 2024 – 2034
8.2.5.5.5.Latin America
8.2.5.5.5.1.Market Estimation, 2016 – 2023
8.2.5.5.5.2.Market Forecast, 2024 – 2034
8.3.Key Segment for Channeling Investments
8.3.1.By Form
9.Global UHMW PE Market Analysis and Forecasts, 2024 – 2034
9.1.Overview
9.2.Global UHMW PE Market Revenue (US$ Mn) and Forecasts, By Application
9.2.1.Medical Grade and Prosthetics
9.2.1.1.Definition
9.2.1.2.Market Estimation and Penetration, 2016 – 2023
9.2.1.3.Market Forecast, 2024 – 2034
9.2.1.4.Compound Annual Growth Rate (CAGR)
9.2.1.5.Regional Bifurcation
9.2.1.5.1.North America
9.2.1.5.1.1.Market Estimation, 2016 – 2023
9.2.1.5.1.2.Market Forecast, 2024 – 2034
9.2.1.5.2.Europe
9.2.1.5.2.1.Market Estimation, 2016 – 2023
9.2.1.5.2.2.Market Forecast, 2024 – 2034
9.2.1.5.3.Asia Pacific
9.2.1.5.3.1.Market Estimation, 2016 – 2023
9.2.1.5.3.2.Market Forecast, 2024 – 2034
9.2.1.5.4.Middle East and Africa
9.2.1.5.4.1.Market Estimation, 2016 – 2023
9.2.1.5.4.2.Market Forecast, 2024 – 2034
9.2.1.5.5.Latin America
9.2.1.5.5.1.Market Estimation, 2016 – 2023
9.2.1.5.5.2.Market Forecast, 2024 – 2034
9.2.2.Food Processing Machinery Parts
9.2.2.1.Definition
9.2.2.2.Market Estimation and Penetration, 2016 – 2023
9.2.2.3.Market Forecast, 2024 – 2034
9.2.2.4.Compound Annual Growth Rate (CAGR)
9.2.2.5.Regional Bifurcation
9.2.2.5.1.North America
9.2.2.5.1.1.Market Estimation, 2016 – 2023
9.2.2.5.1.2.Market Forecast, 2024 – 2034
9.2.2.5.2.Europe
9.2.2.5.2.1.Market Estimation, 2016 – 2023
9.2.2.5.2.2.Market Forecast, 2024 – 2034
9.2.2.5.3.Asia Pacific
9.2.2.5.3.1.Market Estimation, 2016 – 2023
9.2.2.5.3.2.Market Forecast, 2024 – 2034
9.2.2.5.4.Middle East and Africa
9.2.2.5.4.1.Market Estimation, 2016 – 2023
9.2.2.5.4.2.Market Forecast, 2024 – 2034
9.2.2.5.5.Latin America
9.2.2.5.5.1.Market Estimation, 2016 – 2023
9.2.2.5.5.2.Market Forecast, 2024 – 2034
9.2.3.High-Speed Conveyors
9.2.3.1.Definition
9.2.3.2.Market Estimation and Penetration, 2016 – 2023
9.2.3.3.Market Forecast, 2024 – 2034
9.2.3.4.Compound Annual Growth Rate (CAGR)
9.2.3.5.Regional Bifurcation
9.2.3.5.1.North America
9.2.3.5.1.1.Market Estimation, 2016 – 2023
9.2.3.5.1.2.Market Forecast, 2024 – 2034
9.2.3.5.2.Europe
9.2.3.5.2.1.Market Estimation, 2016 – 2023
9.2.3.5.2.2.Market Forecast, 2024 – 2034
9.2.3.5.3.Asia Pacific
9.2.3.5.3.1.Market Estimation, 2016 – 2023
9.2.3.5.3.2.Market Forecast, 2024 – 2034
9.2.3.5.4.Middle East and Africa
9.2.3.5.4.1.Market Estimation, 2016 – 2023
9.2.3.5.4.2.Market Forecast, 2024 – 2034
9.2.3.5.5.Latin America
9.2.3.5.5.1.Market Estimation, 2016 – 2023
9.2.3.5.5.2.Market Forecast, 2024 – 2034
9.2.4.Wear Strips and Guide Rails
9.2.4.1.Definition
9.2.4.2.Market Estimation and Penetration, 2016 – 2023
9.2.4.3.Market Forecast, 2024 – 2034
9.2.4.4.Compound Annual Growth Rate (CAGR)
9.2.4.5.Regional Bifurcation
9.2.4.5.1.North America
9.2.4.5.1.1.Market Estimation, 2016 – 2023
9.2.4.5.1.2.Market Forecast, 2024 – 2034
9.2.4.5.2.Europe
9.2.4.5.2.1.Market Estimation, 2016 – 2023
9.2.4.5.2.2.Market Forecast, 2024 – 2034
9.2.4.5.3.Asia Pacific
9.2.4.5.3.1.Market Estimation, 2016 – 2023
9.2.4.5.3.2.Market Forecast, 2024 – 2034
9.2.4.5.4.Middle East and Africa
9.2.4.5.4.1.Market Estimation, 2016 – 2023
9.2.4.5.4.2.Market Forecast, 2024 – 2034
9.2.4.5.5.Latin America
9.2.4.5.5.1.Market Estimation, 2016 – 2023
9.2.4.5.5.2.Market Forecast, 2024 – 2034
9.2.5.Water Treatment
9.2.5.1.Definition
9.2.5.2.Market Estimation and Penetration, 2016 – 2023
9.2.5.3.Market Forecast, 2024 – 2034
9.2.5.4.Compound Annual Growth Rate (CAGR)
9.2.5.5.Regional Bifurcation
9.2.5.5.1.North America
9.2.5.5.1.1.Market Estimation, 2016 – 2023
9.2.5.5.1.2.Market Forecast, 2024 – 2034
9.2.5.5.2.Europe
9.2.5.5.2.1.Market Estimation, 2016 – 2023
9.2.5.5.2.2.Market Forecast, 2024 – 2034
9.2.5.5.3.Asia Pacific
9.2.5.5.3.1.Market Estimation, 2016 – 2023
9.2.5.5.3.2.Market Forecast, 2024 – 2034
9.2.5.5.4.Middle East and Africa
9.2.5.5.4.1.Market Estimation, 2016 – 2023
9.2.5.5.4.2.Market Forecast, 2024 – 2034
9.2.5.5.5.Latin America
9.2.5.5.5.1.Market Estimation, 2016 – 2023
9.2.5.5.5.2.Market Forecast, 2024 – 2034
9.2.6.Packaging Machinery Parts
9.2.6.1.Definition
9.2.6.2.Market Estimation and Penetration, 2016 – 2023
9.2.6.3.Market Forecast, 2024 – 2034
9.2.6.4.Compound Annual Growth Rate (CAGR)
9.2.6.5.Regional Bifurcation
9.2.6.5.1.North America
9.2.6.5.1.1.Market Estimation, 2016 – 2023
9.2.6.5.1.2.Market Forecast, 2024 – 2034
9.2.6.5.2.Europe
9.2.6.5.2.1.Market Estimation, 2016 – 2023
9.2.6.5.2.2.Market Forecast, 2024 – 2034
9.2.6.5.3.Asia Pacific
9.2.6.5.3.1.Market Estimation, 2016 – 2023
9.2.6.5.3.2.Market Forecast, 2024 – 2034
9.2.6.5.4.Middle East and Africa
9.2.6.5.4.1.Market Estimation, 2016 – 2023
9.2.6.5.4.2.Market Forecast, 2024 – 2034
9.2.6.5.5.Latin America
9.2.6.5.5.1.Market Estimation, 2016 – 2023
9.2.6.5.5.2.Market Forecast, 2024 – 2034
9.2.7.Bumpers, Pile Guards, and Dock Fenders
9.2.7.1.Definition
9.2.7.2.Market Estimation and Penetration, 2016 – 2023
9.2.7.3.Market Forecast, 2024 – 2034
9.2.7.4.Compound Annual Growth Rate (CAGR)
9.2.7.5.Regional Bifurcation
9.2.7.5.1.North America
9.2.7.5.1.1.Market Estimation, 2016 – 2023
9.2.7.5.1.2.Market Forecast, 2024 – 2034
9.2.7.5.2.Europe
9.2.7.5.2.1.Market Estimation, 2016 – 2023
9.2.7.5.2.2.Market Forecast, 2024 – 2034
9.2.7.5.3.Asia Pacific
9.2.7.5.3.1.Market Estimation, 2016 – 2023
9.2.7.5.3.2.Market Forecast, 2024 – 2034
9.2.7.5.4.Middle East and Africa
9.2.7.5.4.1.Market Estimation, 2016 – 2023
9.2.7.5.4.2.Market Forecast, 2024 – 2034
9.2.7.5.5.Latin America
9.2.7.5.5.1.Market Estimation, 2016 – 2023
9.2.7.5.5.2.Market Forecast, 2024 – 2034
9.2.8.Chute, Hopper, and Truck Bed Liners
9.2.8.1.Definition
9.2.8.2.Market Estimation and Penetration, 2016 – 2023
9.2.8.3.Market Forecast, 2024 – 2034
9.2.8.4.Compound Annual Growth Rate (CAGR)
9.2.8.5.Regional Bifurcation
9.2.8.5.1.North America
9.2.8.5.1.1.Market Estimation, 2016 – 2023
9.2.8.5.1.2.Market Forecast, 2024 – 2034
9.2.8.5.2.Europe
9.2.8.5.2.1.Market Estimation, 2016 – 2023
9.2.8.5.2.2.Market Forecast, 2024 – 2034
9.2.8.5.3.Asia Pacific
9.2.8.5.3.1.Market Estimation, 2016 – 2023
9.2.8.5.3.2.Market Forecast, 2024 – 2034
9.2.8.5.4.Middle East and Africa
9.2.8.5.4.1.Market Estimation, 2016 – 2023
9.2.8.5.4.2.Market Forecast, 2024 – 2034
9.2.8.5.5.Latin America
9.2.8.5.5.1.Market Estimation, 2016 – 2023
9.2.8.5.5.2.Market Forecast, 2024 – 2034
9.2.9.Star Wheels and Idler Sprockets
9.2.9.1.Definition
9.2.9.2.Market Estimation and Penetration, 2016 – 2023
9.2.9.3.Market Forecast, 2024 – 2034
9.2.9.4.Compound Annual Growth Rate (CAGR)
9.2.9.5.Regional Bifurcation
9.2.9.5.1.North America
9.2.9.5.1.1.Market Estimation, 2016 – 2023
9.2.9.5.1.2.Market Forecast, 2024 – 2034
9.2.9.5.2.Europe
9.2.9.5.2.1.Market Estimation, 2016 – 2023
9.2.9.5.2.2.Market Forecast, 2024 – 2034
9.2.9.5.3.Asia Pacific
9.2.9.5.3.1.Market Estimation, 2016 – 2023
9.2.9.5.3.2.Market Forecast, 2024 – 2034
9.2.9.5.4.Middle East and Africa
9.2.9.5.4.1.Market Estimation, 2016 – 2023
9.2.9.5.4.2.Market Forecast, 2024 – 2034
9.2.9.5.5.Latin America
9.2.9.5.5.1.Market Estimation, 2016 – 2023
9.2.9.5.5.2.Market Forecast, 2024 – 2034
9.2.10.Batteries
9.2.10.1.Definition
9.2.10.2.Market Estimation and Penetration, 2016 – 2023
9.2.10.3.Market Forecast, 2024 – 2034
9.2.10.4.Compound Annual Growth Rate (CAGR)
9.2.10.5.Regional Bifurcation
9.2.10.5.1.North America
9.2.10.5.1.1.Market Estimation, 2016 – 2023
9.2.10.5.1.2.Market Forecast, 2024 – 2034
9.2.10.5.2.Europe
9.2.10.5.2.1.Market Estimation, 2016 – 2023
9.2.10.5.2.2.Market Forecast, 2024 – 2034
9.2.10.5.3.Asia Pacific
9.2.10.5.3.1.Market Estimation, 2016 – 2023
9.2.10.5.3.2.Market Forecast, 2024 – 2034
9.2.10.5.4.Middle East and Africa
9.2.10.5.4.1.Market Estimation, 2016 – 2023
9.2.10.5.4.2.Market Forecast, 2024 – 2034
9.2.10.5.5.Latin America
9.2.10.5.5.1.Market Estimation, 2016 – 2023
9.2.10.5.5.2.Market Forecast, 2024 – 2034
9.2.11.Others
9.2.11.1.Definition
9.2.11.2.Market Estimation and Penetration, 2016 – 2023
9.2.11.3.Market Forecast, 2024 – 2034
9.2.11.4.Compound Annual Growth Rate (CAGR)
9.2.11.5.Regional Bifurcation
9.2.11.5.1.North America
9.2.11.5.1.1.Market Estimation, 2016 – 2023
9.2.11.5.1.2.Market Forecast, 2024 – 2034
9.2.11.5.2.Europe
9.2.11.5.2.1.Market Estimation, 2016 – 2023
9.2.11.5.2.2.Market Forecast, 2024 – 2034
9.2.11.5.3.Asia Pacific
9.2.11.5.3.1.Market Estimation, 2016 – 2023
9.2.11.5.3.2.Market Forecast, 2024 – 2034
9.2.11.5.4.Middle East and Africa
9.2.11.5.4.1.Market Estimation, 2016 – 2023
9.2.11.5.4.2.Market Forecast, 2024 – 2034
9.2.11.5.5.Latin America
9.2.11.5.5.1.Market Estimation, 2016 – 2023
9.2.11.5.5.2.Market Forecast, 2024 – 2034
9.3.Key Segment for Channeling Investments
9.3.1.By Application
10.Global UHMW PE Market Analysis and Forecasts, 2024 – 2034
10.1.Overview
10.2.Global UHMW PE Market Revenue (US$ Mn) and Forecasts, By End Use Industry
10.2.1.Healthcare
10.2.1.1.Definition
10.2.1.2.Market Estimation and Penetration, 2016 – 2023
10.2.1.3.Market Forecast, 2024 – 2034
10.2.1.4.Compound Annual Growth Rate (CAGR)
10.2.1.5.Regional Bifurcation
10.2.1.5.1.North America
10.2.1.5.1.1.Market Estimation, 2016 – 2023
10.2.1.5.1.2.Market Forecast, 2024 – 2034
10.2.1.5.2.Europe
10.2.1.5.2.1.Market Estimation, 2016 – 2023
10.2.1.5.2.2.Market Forecast, 2024 – 2034
10.2.1.5.3.Asia Pacific
10.2.1.5.3.1.Market Estimation, 2016 – 2023
10.2.1.5.3.2.Market Forecast, 2024 – 2034
10.2.1.5.4.Middle East and Africa
10.2.1.5.4.1.Market Estimation, 2016 – 2023
10.2.1.5.4.2.Market Forecast, 2024 – 2034
10.2.1.5.5.Latin America
10.2.1.5.5.1.Market Estimation, 2016 – 2023
10.2.1.5.5.2.Market Forecast, 2024 – 2034
10.2.2.Aerospace and Defense
10.2.2.1.Definition
10.2.2.2.Market Estimation and Penetration, 2016 – 2023
10.2.2.3.Market Forecast, 2024 – 2034
10.2.2.4.Compound Annual Growth Rate (CAGR)
10.2.2.5.Regional Bifurcation
10.2.2.5.1.North America
10.2.2.5.1.1.Market Estimation, 2016 – 2023
10.2.2.5.1.2.Market Forecast, 2024 – 2034
10.2.2.5.2.Europe
10.2.2.5.2.1.Market Estimation, 2016 – 2023
10.2.2.5.2.2.Market Forecast, 2024 – 2034
10.2.2.5.3.Asia Pacific
10.2.2.5.3.1.Market Estimation, 2016 – 2023
10.2.2.5.3.2.Market Forecast, 2024 – 2034
10.2.2.5.4.Middle East and Africa
10.2.2.5.4.1.Market Estimation, 2016 – 2023
10.2.2.5.4.2.Market Forecast, 2024 – 2034
10.2.2.5.5.Latin America
10.2.2.5.5.1.Market Estimation, 2016 – 2023
10.2.2.5.5.2.Market Forecast, 2024 – 2034
10.2.3.Oil and Gas
10.2.3.1.Definition
10.2.3.2.Market Estimation and Penetration, 2016 – 2023
10.2.3.3.Market Forecast, 2024 – 2034
10.2.3.4.Compound Annual Growth Rate (CAGR)
10.2.3.5.Regional Bifurcation
10.2.3.5.1.North America
10.2.3.5.1.1.Market Estimation, 2016 – 2023
10.2.3.5.1.2.Market Forecast, 2024 – 2034
10.2.3.5.2.Europe
10.2.3.5.2.1.Market Estimation, 2016 – 2023
10.2.3.5.2.2.Market Forecast, 2024 – 2034
10.2.3.5.3.Asia Pacific
10.2.3.5.3.1.Market Estimation, 2016 – 2023
10.2.3.5.3.2.Market Forecast, 2024 – 2034
10.2.3.5.4.Middle East and Africa
10.2.3.5.4.1.Market Estimation, 2016 – 2023
10.2.3.5.4.2.Market Forecast, 2024 – 2034
10.2.3.5.5.Latin America
10.2.3.5.5.1.Market Estimation, 2016 – 2023
10.2.3.5.5.2.Market Forecast, 2024 – 2034
10.2.4.Automotive and Transportation
10.2.4.1.Definition
10.2.4.2.Market Estimation and Penetration, 2016 – 2023
10.2.4.3.Market Forecast, 2024 – 2034
10.2.4.4.Compound Annual Growth Rate (CAGR)
10.2.4.5.Regional Bifurcation
10.2.4.5.1.North America
10.2.4.5.1.1.Market Estimation, 2016 – 2023
10.2.4.5.1.2.Market Forecast, 2024 – 2034
10.2.4.5.2.Europe
10.2.4.5.2.1.Market Estimation, 2016 – 2023
10.2.4.5.2.2.Market Forecast, 2024 – 2034
10.2.4.5.3.Asia Pacific
10.2.4.5.3.1.Market Estimation, 2016 – 2023
10.2.4.5.3.2.Market Forecast, 2024 – 2034
10.2.4.5.4.Middle East and Africa
10.2.4.5.4.1.Market Estimation, 2016 – 2023
10.2.4.5.4.2.Market Forecast, 2024 – 2034
10.2.4.5.5.Latin America
10.2.4.5.5.1.Market Estimation, 2016 – 2023
10.2.4.5.5.2.Market Forecast, 2024 – 2034
10.2.5.Electronics
10.2.5.1.Definition
10.2.5.2.Market Estimation and Penetration, 2016 – 2023
10.2.5.3.Market Forecast, 2024 – 2034
10.2.5.4.Compound Annual Growth Rate (CAGR)
10.2.5.5.Regional Bifurcation
10.2.5.5.1.North America
10.2.5.5.1.1.Market Estimation, 2016 – 2023
10.2.5.5.1.2.Market Forecast, 2024 – 2034
10.2.5.5.2.Europe
10.2.5.5.2.1.Market Estimation, 2016 – 2023
10.2.5.5.2.2.Market Forecast, 2024 – 2034
10.2.5.5.3.Asia Pacific
10.2.5.5.3.1.Market Estimation, 2016 – 2023
10.2.5.5.3.2.Market Forecast, 2024 – 2034
10.2.5.5.4.Middle East and Africa
10.2.5.5.4.1.Market Estimation, 2016 – 2023
10.2.5.5.4.2.Market Forecast, 2024 – 2034
10.2.5.5.5.Latin America
10.2.5.5.5.1.Market Estimation, 2016 – 2023
10.2.5.5.5.2.Market Forecast, 2024 – 2034
10.2.6.Textiles
10.2.6.1.Definition
10.2.6.2.Market Estimation and Penetration, 2016 – 2023
10.2.6.3.Market Forecast, 2024 – 2034
10.2.6.4.Compound Annual Growth Rate (CAGR)
10.2.6.5.Regional Bifurcation
10.2.6.5.1.North America
10.2.6.5.1.1.Market Estimation, 2016 – 2023
10.2.6.5.1.2.Market Forecast, 2024 – 2034
10.2.6.5.2.Europe
10.2.6.5.2.1.Market Estimation, 2016 – 2023
10.2.6.5.2.2.Market Forecast, 2024 – 2034
10.2.6.5.3.Asia Pacific
10.2.6.5.3.1.Market Estimation, 2016 – 2023
10.2.6.5.3.2.Market Forecast, 2024 – 2034
10.2.6.5.4.Middle East and Africa
10.2.6.5.4.1.Market Estimation, 2016 – 2023
10.2.6.5.4.2.Market Forecast, 2024 – 2034
10.2.6.5.5.Latin America
10.2.6.5.5.1.Market Estimation, 2016 – 2023
10.2.6.5.5.2.Market Forecast, 2024 – 2034
10.2.7.Sports and Leisure
10.2.7.1.Definition
10.2.7.2.Market Estimation and Penetration, 2016 – 2023
10.2.7.3.Market Forecast, 2024 – 2034
10.2.7.4.Compound Annual Growth Rate (CAGR)
10.2.7.5.Regional Bifurcation
10.2.7.5.1.North America
10.2.7.5.1.1.Market Estimation, 2016 – 2023
10.2.7.5.1.2.Market Forecast, 2024 – 2034
10.2.7.5.2.Europe
10.2.7.5.2.1.Market Estimation, 2016 – 2023
10.2.7.5.2.2.Market Forecast, 2024 – 2034
10.2.7.5.3.Asia Pacific
10.2.7.5.3.1.Market Estimation, 2016 – 2023
10.2.7.5.3.2.Market Forecast, 2024 – 2034
10.2.7.5.4.Middle East and Africa
10.2.7.5.4.1.Market Estimation, 2016 – 2023
10.2.7.5.4.2.Market Forecast, 2024 – 2034
10.2.7.5.5.Latin America
10.2.7.5.5.1.Market Estimation, 2016 – 2023
10.2.7.5.5.2.Market Forecast, 2024 – 2034
10.2.8.Industrial and Heavy Equipment
10.2.8.1.Definition
10.2.8.2.Market Estimation and Penetration, 2016 – 2023
10.2.8.3.Market Forecast, 2024 – 2034
10.2.8.4.Compound Annual Growth Rate (CAGR)
10.2.8.5.Regional Bifurcation
10.2.8.5.1.North America
10.2.8.5.1.1.Market Estimation, 2016 – 2023
10.2.8.5.1.2.Market Forecast, 2024 – 2034
10.2.8.5.2.Europe
10.2.8.5.2.1.Market Estimation, 2016 – 2023
10.2.8.5.2.2.Market Forecast, 2024 – 2034
10.2.8.5.3.Asia Pacific
10.2.8.5.3.1.Market Estimation, 2016 – 2023
10.2.8.5.3.2.Market Forecast, 2024 – 2034
10.2.8.5.4.Middle East and Africa
10.2.8.5.4.1.Market Estimation, 2016 – 2023
10.2.8.5.4.2.Market Forecast, 2024 – 2034
10.2.8.5.5.Latin America
10.2.8.5.5.1.Market Estimation, 2016 – 2023
10.2.8.5.5.2.Market Forecast, 2024 – 2034
10.2.9.Recreation and Consumer
10.2.9.1.Definition
10.2.9.2.Market Estimation and Penetration, 2016 – 2023
10.2.9.3.Market Forecast, 2024 – 2034
10.2.9.4.Compound Annual Growth Rate (CAGR)
10.2.9.5.Regional Bifurcation
10.2.9.5.1.North America
10.2.9.5.1.1.Market Estimation, 2016 – 2023
10.2.9.5.1.2.Market Forecast, 2024 – 2034
10.2.9.5.2.Europe
10.2.9.5.2.1.Market Estimation, 2016 – 2023
10.2.9.5.2.2.Market Forecast, 2024 – 2034
10.2.9.5.3.Asia Pacific
10.2.9.5.3.1.Market Estimation, 2016 – 2023
10.2.9.5.3.2.Market Forecast, 2024 – 2034
10.2.9.5.4.Middle East and Africa
10.2.9.5.4.1.Market Estimation, 2016 – 2023
10.2.9.5.4.2.Market Forecast, 2024 – 2034
10.2.9.5.5.Latin America
10.2.9.5.5.1.Market Estimation, 2016 – 2023
10.2.9.5.5.2.Market Forecast, 2024 – 2034
10.2.10.Mining
10.2.10.1.Definition
10.2.10.2.Market Estimation and Penetration, 2016 – 2023
10.2.10.3.Market Forecast, 2024 – 2034
10.2.10.4.Compound Annual Growth Rate (CAGR)
10.2.10.5.Regional Bifurcation
10.2.10.5.1.North America
10.2.10.5.1.1.Market Estimation, 2016 – 2023
10.2.10.5.1.2.Market Forecast, 2024 – 2034
10.2.10.5.2.Europe
10.2.10.5.2.1.Market Estimation, 2016 – 2023
10.2.10.5.2.2.Market Forecast, 2024 – 2034
10.2.10.5.3.Asia Pacific
10.2.10.5.3.1.Market Estimation, 2016 – 2023
10.2.10.5.3.2.Market Forecast, 2024 – 2034
10.2.10.5.4.Middle East and Africa
10.2.10.5.4.1.Market Estimation, 2016 – 2023
10.2.10.5.4.2.Market Forecast, 2024 – 2034
10.2.10.5.5.Latin America
10.2.10.5.5.1.Market Estimation, 2016 – 2023
10.2.10.5.5.2.Market Forecast, 2024 – 2034
10.2.11.Material Handling
10.2.11.1.Definition
10.2.11.2.Market Estimation and Penetration, 2016 – 2023
10.2.11.3.Market Forecast, 2024 – 2034
10.2.11.4.Compound Annual Growth Rate (CAGR)
10.2.11.5.Regional Bifurcation
10.2.11.5.1.North America
10.2.11.5.1.1.Market Estimation, 2016 – 2023
10.2.11.5.1.2.Market Forecast, 2024 – 2034
10.2.11.5.2.Europe
10.2.11.5.2.1.Market Estimation, 2016 – 2023
10.2.11.5.2.2.Market Forecast, 2024 – 2034
10.2.11.5.3.Asia Pacific
10.2.11.5.3.1.Market Estimation, 2016 – 2023
10.2.11.5.3.2.Market Forecast, 2024 – 2034
10.2.11.5.4.Middle East and Africa
10.2.11.5.4.1.Market Estimation, 2016 – 2023
10.2.11.5.4.2.Market Forecast, 2024 – 2034
10.2.11.5.5.Latin America
10.2.11.5.5.1.Market Estimation, 2016 – 2023
10.2.11.5.5.2.Market Forecast, 2024 – 2034
10.2.12.Food and Beverages
10.2.12.1.Definition
10.2.12.2.Market Estimation and Penetration, 2016 – 2023
10.2.12.3.Market Forecast, 2024 – 2034
10.2.12.4.Compound Annual Growth Rate (CAGR)
10.2.12.5.Regional Bifurcation
10.2.12.5.1.North America
10.2.12.5.1.1.Market Estimation, 2016 – 2023
10.2.12.5.1.2.Market Forecast, 2024 – 2034
10.2.12.5.2.Europe
10.2.12.5.2.1.Market Estimation, 2016 – 2023
10.2.12.5.2.2.Market Forecast, 2024 – 2034
10.2.12.5.3.Asia Pacific
10.2.12.5.3.1.Market Estimation, 2016 – 2023
10.2.12.5.3.2.Market Forecast, 2024 – 2034
10.2.12.5.4.Middle East and Africa
10.2.12.5.4.1.Market Estimation, 2016 – 2023
10.2.12.5.4.2.Market Forecast, 2024 – 2034
10.2.12.5.5.Latin America
10.2.12.5.5.1.Market Estimation, 2016 – 2023
10.2.12.5.5.2.Market Forecast, 2024 – 2034
10.2.13.Chemical
10.2.13.1.Definition
10.2.13.2.Market Estimation and Penetration, 2016 – 2023
10.2.13.3.Market Forecast, 2024 – 2034
10.2.13.4.Compound Annual Growth Rate (CAGR)
10.2.13.5.Regional Bifurcation
10.2.13.5.1.North America
10.2.13.5.1.1.Market Estimation, 2016 – 2023
10.2.13.5.1.2.Market Forecast, 2024 – 2034
10.2.13.5.2.Europe
10.2.13.5.2.1.Market Estimation, 2016 – 2023
10.2.13.5.2.2.Market Forecast, 2024 – 2034
10.2.13.5.3.Asia Pacific
10.2.13.5.3.1.Market Estimation, 2016 – 2023
10.2.13.5.3.2.Market Forecast, 2024 – 2034
10.2.13.5.4.Middle East and Africa
10.2.13.5.4.1.Market Estimation, 2016 – 2023
10.2.13.5.4.2.Market Forecast, 2024 – 2034
10.2.13.5.5.Latin America
10.2.13.5.5.1.Market Estimation, 2016 – 2023
10.2.13.5.5.2.Market Forecast, 2024 – 2034
10.2.14.Others
10.2.14.1.Definition
10.2.14.2.Market Estimation and Penetration, 2016 – 2023
10.2.14.3.Market Forecast, 2024 – 2034
10.2.14.4.Compound Annual Growth Rate (CAGR)
10.2.14.5.Regional Bifurcation
10.2.14.5.1.North America
10.2.14.5.1.1.Market Estimation, 2016 – 2023
10.2.14.5.1.2.Market Forecast, 2024 – 2034
10.2.14.5.2.Europe
10.2.14.5.2.1.Market Estimation, 2016 – 2023
10.2.14.5.2.2.Market Forecast, 2024 – 2034
10.2.14.5.3.Asia Pacific
10.2.14.5.3.1.Market Estimation, 2016 – 2023
10.2.14.5.3.2.Market Forecast, 2024 – 2034
10.2.14.5.4.Middle East and Africa
10.2.14.5.4.1.Market Estimation, 2016 – 2023
10.2.14.5.4.2.Market Forecast, 2024 – 2034
10.2.14.5.5.Latin America
10.2.14.5.5.1.Market Estimation, 2016 – 2023
10.2.14.5.5.2.Market Forecast, 2024 – 2034
10.3.Key Segment for Channeling Investments
10.3.1.By End Use Industry
11.North America UHMW PE Market Analysis and Forecasts, 2024 – 2034
11.1.Overview
11.1.1.North America UHMW PE Market Revenue (US$ Mn)
11.2.North America UHMW PE Market Revenue (US$ Mn) and Forecasts, By Form
11.2.1.Sheets
11.2.2.Films
11.2.3.Tapes
11.2.4.Rods and Tubes, Fibers
11.2.5.Others
11.3.North America UHMW PE Market Revenue (US$ Mn) and Forecasts, By Application
11.3.1.Medical Grade and Prosthetics
11.3.2.Food Processing Machinery Parts
11.3.3.High-Speed Conveyors
11.3.4.Wear Strips and Guide Rails
11.3.5.Water Treatment
11.3.6.Packaging Machinery Parts
11.3.7.Bumpers, Pile Guards, and Dock Fenders
11.3.8.Chute, Hopper, and Truck Bed Liners
11.3.9.Star Wheels and Idler Sprockets
11.3.10.Batteries
11.3.11.Others
11.4.North America UHMW PE Market Revenue (US$ Mn) and Forecasts, By End Use Industry
11.4.1.Healthcare
11.4.2.Aerospace and Defense
11.4.3.Oil and Gas
11.4.4.Automotive and Transportation
11.4.5.Electronics
11.4.6.Textiles
11.4.7.Sports and Leisure
11.4.8.Industrial and Heavy Equipment
11.4.9.Recreation and Consumer
11.4.10.Mining
11.4.11.Material Handling
11.4.12.Food and Beverages
11.4.13.Chemical
11.4.14.Others
11.5.North America UHMW PE Market Revenue (US$ Mn) and Forecasts, By Country
11.5.1.U.S
11.5.1.1.U.S UHMW PE Market Revenue (US$ Mn) and Forecasts, By Form
11.5.1.1.1.Sheets
11.5.1.1.2.Films
11.5.1.1.3.Tapes
11.5.1.1.4.Rods and Tubes, Fibers
11.5.1.1.5.Others
11.5.1.2.U.S UHMW PE Market Revenue (US$ Mn) and Forecasts, By Application
11.5.1.2.1.Medical Grade and Prosthetics
11.5.1.2.2.Food Processing Machinery Parts
11.5.1.2.3.High-Speed Conveyors
11.5.1.2.4.Wear Strips and Guide Rails
11.5.1.2.5.Water Treatment
11.5.1.2.6.Packaging Machinery Parts
11.5.1.2.7.Bumpers, Pile Guards, and Dock Fenders
11.5.1.2.8.Chute, Hopper, and Truck Bed Liners
11.5.1.2.9.Star Wheels and Idler Sprockets
11.5.1.2.10.Batteries
11.5.1.2.11.Others
11.5.1.3.U.S UHMW PE Market Revenue (US$ Mn) and Forecasts, By End Use Industry
11.5.1.3.1.Healthcare
11.5.1.3.2.Aerospace and Defense
11.5.1.3.3.Oil and Gas
11.5.1.3.4.Automotive and Transportation
11.5.1.3.5.Electronics
11.5.1.3.6.Textiles
11.5.1.3.7.Sports and Leisure
11.5.1.3.8.Industrial and Heavy Equipment
11.5.1.3.9.Recreation and Consumer
11.5.1.3.10.Mining
11.5.1.3.11.Material Handling
11.5.1.3.12.Food and Beverages
11.5.1.3.13.Chemical
11.5.1.3.14.Others
11.5.2.Canada
11.5.2.1.Canada UHMW PE Market Revenue (US$ Mn) and Forecasts, By Form
11.5.2.1.1.Sheets
11.5.2.1.2.Films
11.5.2.1.3.Tapes
11.5.2.1.4.Rods and Tubes, Fibers
11.5.2.1.5.Others
11.5.2.2.Canada UHMW PE Market Revenue (US$ Mn) and Forecasts, By Application
11.5.2.2.1.Medical Grade and Prosthetics
11.5.2.2.2.Food Processing Machinery Parts
11.5.2.2.3.High-Speed Conveyors
11.5.2.2.4.Wear Strips and Guide Rails
11.5.2.2.5.Water Treatment
11.5.2.2.6.Packaging Machinery Parts
11.5.2.2.7.Bumpers, Pile Guards, and Dock Fenders
11.5.2.2.8.Chute, Hopper, and Truck Bed Liners
11.5.2.2.9.Star Wheels and Idler Sprockets
11.5.2.2.10.Batteries
11.5.2.2.11.Others
11.5.2.3.Canada UHMW PE Market Revenue (US$ Mn) and Forecasts, By End Use Industry
11.5.2.3.1.Healthcare
11.5.2.3.2.Aerospace and Defense
11.5.2.3.3.Oil and Gas
11.5.2.3.4.Automotive and Transportation
11.5.2.3.5.Electronics
11.5.2.3.6.Textiles
11.5.2.3.7.Sports and Leisure
11.5.2.3.8.Industrial and Heavy Equipment
11.5.2.3.9.Recreation and Consumer
11.5.2.3.10.Mining
11.5.2.3.11.Material Handling
11.5.2.3.12.Food and Beverages
11.5.2.3.13.Chemical
11.5.2.3.14.Others
11.5.3.Mexico
11.5.3.1.Mexico UHMW PE Market Revenue (US$ Mn) and Forecasts, By Form
11.5.3.1.1.Sheets
11.5.3.1.2.Films
11.5.3.1.3.Tapes
11.5.3.1.4.Rods and Tubes, Fibers
11.5.3.1.5.Others
11.5.3.2.Mexico UHMW PE Market Revenue (US$ Mn) and Forecasts, By Application
11.5.3.2.1.Medical Grade and Prosthetics
11.5.3.2.2.Food Processing Machinery Parts
11.5.3.2.3.High-Speed Conveyors
11.5.3.2.4.Wear Strips and Guide Rails
11.5.3.2.5.Water Treatment
11.5.3.2.6.Packaging Machinery Parts
11.5.3.2.7.Bumpers, Pile Guards, and Dock Fenders
11.5.3.2.8.Chute, Hopper, and Truck Bed Liners
11.5.3.2.9.Star Wheels and Idler Sprockets
11.5.3.2.10.Batteries
11.5.3.2.11.Others
11.5.3.3.Mexico UHMW PE Market Revenue (US$ Mn) and Forecasts, By End Use Industry
11.5.3.3.1.Healthcare
11.5.3.3.2.Aerospace and Defense
11.5.3.3.3.Oil and Gas
11.5.3.3.4.Automotive and Transportation
11.5.3.3.5.Electronics
11.5.3.3.6.Textiles
11.5.3.3.7.Sports and Leisure
11.5.3.3.8.Industrial and Heavy Equipment
11.5.3.3.9.Recreation and Consumer
11.5.3.3.10.Mining
11.5.3.3.11.Material Handling
11.5.3.3.12.Food and Beverages
11.5.3.3.13.Chemical
11.5.3.3.14.Others
11.5.4.Rest of North America
11.5.4.1.Rest of North America UHMW PE Market Revenue (US$ Mn) and Forecasts, By Form
11.5.4.1.1.Sheets
11.5.4.1.2.Films
11.5.4.1.3.Tapes
11.5.4.1.4.Rods and Tubes, Fibers
11.5.4.1.5.Others
11.5.4.2.Rest of North America UHMW PE Market Revenue (US$ Mn) and Forecasts, By Application
11.5.4.2.1.Medical Grade and Prosthetics
11.5.4.2.2.Food Processing Machinery Parts
11.5.4.2.3.High-Speed Conveyors
11.5.4.2.4.Wear Strips and Guide Rails
11.5.4.2.5.Water Treatment
11.5.4.2.6.Packaging Machinery Parts
11.5.4.2.7.Bumpers, Pile Guards, and Dock Fenders
11.5.4.2.8.Chute, Hopper, and Truck Bed Liners
11.5.4.2.9.Star Wheels and Idler Sprockets
11.5.4.2.10.Batteries
11.5.4.2.11.Others
11.5.4.3.Rest of North America UHMW PE Market Revenue (US$ Mn) and Forecasts, By End Use Industry
11.5.4.3.1.Healthcare
11.5.4.3.2.Aerospace and Defense
11.5.4.3.3.Oil and Gas
11.5.4.3.4.Automotive and Transportation
11.5.4.3.5.Electronics
11.5.4.3.6.Textiles
11.5.4.3.7.Sports and Leisure
11.5.4.3.8.Industrial and Heavy Equipment
11.5.4.3.9.Recreation and Consumer
11.5.4.3.10.Mining
11.5.4.3.11.Material Handling
11.5.4.3.12.Food and Beverages
11.5.4.3.13.Chemical
11.5.4.3.14.Others
11.6.Key Segment for Channeling Investments
11.6.1.By Country
11.6.2.By Form
11.6.3.By Application
11.6.4.By End Use Industry
12.Europe UHMW PE Market Analysis and Forecasts, 2024 – 2034
12.1.Overview
12.1.1.Europe UHMW PE Market Revenue (US$ Mn)
12.2.Europe UHMW PE Market Revenue (US$ Mn) and Forecasts, By Form
12.2.1.Sheets
12.2.2.Films
12.2.3.Tapes
12.2.4.Rods and Tubes, Fibers
12.2.5.Others
12.3.Europe UHMW PE Market Revenue (US$ Mn) and Forecasts, By Application
12.3.1.Medical Grade and Prosthetics
12.3.2.Food Processing Machinery Parts
12.3.3.High-Speed Conveyors
12.3.4.Wear Strips and Guide Rails
12.3.5.Water Treatment
12.3.6.Packaging Machinery Parts
12.3.7.Bumpers, Pile Guards, and Dock Fenders
12.3.8.Chute, Hopper, and Truck Bed Liners
12.3.9.Star Wheels and Idler Sprockets
12.3.10.Batteries
12.3.11.Others
12.4.Europe UHMW PE Market Revenue (US$ Mn) and Forecasts, By End Use Industry
12.4.1.Healthcare
12.4.2.Aerospace and Defense
12.4.3.Oil and Gas
12.4.4.Automotive and Transportation
12.4.5.Electronics
12.4.6.Textiles
12.4.7.Sports and Leisure
12.4.8.Industrial and Heavy Equipment
12.4.9.Recreation and Consumer
12.4.10.Mining
12.4.11.Material Handling
12.4.12.Food and Beverages
12.4.13.Chemical
12.4.14.Others
12.5.Europe UHMW PE Market Revenue (US$ Mn) and Forecasts, By Country
12.5.1.France
12.5.1.1.France UHMW PE Market Revenue (US$ Mn) and Forecasts, By Form
12.5.1.1.1.Sheets
12.5.1.1.2.Films
12.5.1.1.3.Tapes
12.5.1.1.4.Rods and Tubes, Fibers
12.5.1.1.5.Others
12.5.1.2.France UHMW PE Market Revenue (US$ Mn) and Forecasts, By Application
12.5.1.2.1.Medical Grade and Prosthetics
12.5.1.2.2.Food Processing Machinery Parts
12.5.1.2.3.High-Speed Conveyors
12.5.1.2.4.Wear Strips and Guide Rails
12.5.1.2.5.Water Treatment
12.5.1.2.6.Packaging Machinery Parts
12.5.1.2.7.Bumpers, Pile Guards, and Dock Fenders
12.5.1.2.8.Chute, Hopper, and Truck Bed Liners
12.5.1.2.9.Star Wheels and Idler Sprockets
12.5.1.2.10.Batteries
12.5.1.2.11.Others
12.5.1.3.France UHMW PE Market Revenue (US$ Mn) and Forecasts, By End Use Industry
12.5.1.3.1.Healthcare
12.5.1.3.2.Aerospace and Defense
12.5.1.3.3.Oil and Gas
12.5.1.3.4.Automotive and Transportation
12.5.1.3.5.Electronics
12.5.1.3.6.Textiles
12.5.1.3.7.Sports and Leisure
12.5.1.3.8.Industrial and Heavy Equipment
12.5.1.3.9.Recreation and Consumer
12.5.1.3.10.Mining
12.5.1.3.11.Material Handling
12.5.1.3.12.Food and Beverages
12.5.1.3.13.Chemical
12.5.1.3.14.Others
12.5.2.The UK
12.5.2.1.The UK UHMW PE Market Revenue (US$ Mn) and Forecasts, By Form
12.5.2.1.1.Sheets
12.5.2.1.2.Films
12.5.2.1.3.Tapes
12.5.2.1.4.Rods and Tubes, Fibers
12.5.2.1.5.Others
12.5.2.2.The UK UHMW PE Market Revenue (US$ Mn) and Forecasts, By Application
12.5.2.2.1.Medical Grade and Prosthetics
12.5.2.2.2.Food Processing Machinery Parts
12.5.2.2.3.High-Speed Conveyors
12.5.2.2.4.Wear Strips and Guide Rails
12.5.2.2.5.Water Treatment
12.5.2.2.6.Packaging Machinery Parts
12.5.2.2.7.Bumpers, Pile Guards, and Dock Fenders
12.5.2.2.8.Chute, Hopper, and Truck Bed Liners
12.5.2.2.9.Star Wheels and Idler Sprockets
12.5.2.2.10.Batteries
12.5.2.2.11.Others
12.5.2.3.The UK UHMW PE Market Revenue (US$ Mn) and Forecasts, By End Use Industry
12.5.2.3.1.Healthcare
12.5.2.3.2.Aerospace and Defense
12.5.2.3.3.Oil and Gas
12.5.2.3.4.Automotive and Transportation
12.5.2.3.5.Electronics
12.5.2.3.6.Textiles
12.5.2.3.7.Sports and Leisure
12.5.2.3.8.Industrial and Heavy Equipment
12.5.2.3.9.Recreation and Consumer
12.5.2.3.10.Mining
12.5.2.3.11.Material Handling
12.5.2.3.12.Food and Beverages
12.5.2.3.13.Chemical
12.5.2.3.14.Others
12.5.3.Spain
12.5.3.1.Spain UHMW PE Market Revenue (US$ Mn) and Forecasts, By Form
12.5.3.1.1.Sheets
12.5.3.1.2.Films
12.5.3.1.3.Tapes
12.5.3.1.4.Rods and Tubes, Fibers
12.5.3.1.5.Others
12.5.3.2.Spain UHMW PE Market Revenue (US$ Mn) and Forecasts, By Application
12.5.3.2.1.Medical Grade and Prosthetics
12.5.3.2.2.Food Processing Machinery Parts
12.5.3.2.3.High-Speed Conveyors
12.5.3.2.4.Wear Strips and Guide Rails
12.5.3.2.5.Water Treatment
12.5.3.2.6.Packaging Machinery Parts
12.5.3.2.7.Bumpers, Pile Guards, and Dock Fenders
12.5.3.2.8.Chute, Hopper, and Truck Bed Liners
12.5.3.2.9.Star Wheels and Idler Sprockets
12.5.3.2.10.Batteries
12.5.3.2.11.Others
12.5.3.3.Spain UHMW PE Market Revenue (US$ Mn) and Forecasts, By End Use Industry
12.5.3.3.1.Healthcare
12.5.3.3.2.Aerospace and Defense
12.5.3.3.3.Oil and Gas
12.5.3.3.4.Automotive and Transportation
12.5.3.3.5.Electronics
12.5.3.3.6.Textiles
12.5.3.3.7.Sports and Leisure
12.5.3.3.8.Industrial and Heavy Equipment
12.5.3.3.9.Recreation and Consumer
12.5.3.3.10.Mining
12.5.3.3.11.Material Handling
12.5.3.3.12.Food and Beverages
12.5.3.3.13.Chemical
12.5.3.3.14.Others
12.5.4.Germany
12.5.4.1.Germany UHMW PE Market Revenue (US$ Mn) and Forecasts, By Form
12.5.4.1.1.Sheets
12.5.4.1.2.Films
12.5.4.1.3.Tapes
12.5.4.1.4.Rods and Tubes, Fibers
12.5.4.1.5.Others
12.5.4.2.Germany UHMW PE Market Revenue (US$ Mn) and Forecasts, By Application
12.5.4.2.1.Medical Grade and Prosthetics
12.5.4.2.2.Food Processing Machinery Parts
12.5.4.2.3.High-Speed Conveyors
12.5.4.2.4.Wear Strips and Guide Rails
12.5.4.2.5.Water Treatment
12.5.4.2.6.Packaging Machinery Parts
12.5.4.2.7.Bumpers, Pile Guards, and Dock Fenders
12.5.4.2.8.Chute, Hopper, and Truck Bed Liners
12.5.4.2.9.Star Wheels and Idler Sprockets
12.5.4.2.10.Batteries
12.5.4.2.11.Others
12.5.4.3.Germany UHMW PE Market Revenue (US$ Mn) and Forecasts, By End Use Industry
12.5.4.3.1.Healthcare
12.5.4.3.2.Aerospace and Defense
12.5.4.3.3.Oil and Gas
12.5.4.3.4.Automotive and Transportation
12.5.4.3.5.Electronics
12.5.4.3.6.Textiles
12.5.4.3.7.Sports and Leisure
12.5.4.3.8.Industrial and Heavy Equipment
12.5.4.3.9.Recreation and Consumer
12.5.4.3.10.Mining
12.5.4.3.11.Material Handling
12.5.4.3.12.Food and Beverages
12.5.4.3.13.Chemical
12.5.4.3.14.Others
12.5.5.Italy
12.5.5.1.Italy UHMW PE Market Revenue (US$ Mn) and Forecasts, By Form
12.5.5.1.1.Sheets
12.5.5.1.2.Films
12.5.5.1.3.Tapes
12.5.5.1.4.Rods and Tubes, Fibers
12.5.5.1.5.Others
12.5.5.2.Italy UHMW PE Market Revenue (US$ Mn) and Forecasts, By Application
12.5.5.2.1.Medical Grade and Prosthetics
12.5.5.2.2.Food Processing Machinery Parts
12.5.5.2.3.High-Speed Conveyors
12.5.5.2.4.Wear Strips and Guide Rails
12.5.5.2.5.Water Treatment
12.5.5.2.6.Packaging Machinery Parts
12.5.5.2.7.Bumpers, Pile Guards, and Dock Fenders
12.5.5.2.8.Chute, Hopper, and Truck Bed Liners
12.5.5.2.9.Star Wheels and Idler Sprockets
12.5.5.2.10.Batteries
12.5.5.2.11.Others
12.5.5.3.Italy UHMW PE Market Revenue (US$ Mn) and Forecasts, By End Use Industry
12.5.5.3.1.Healthcare
12.5.5.3.2.Aerospace and Defense
12.5.5.3.3.Oil and Gas
12.5.5.3.4.Automotive and Transportation
12.5.5.3.5.Electronics
12.5.5.3.6.Textiles
12.5.5.3.7.Sports and Leisure
12.5.5.3.8.Industrial and Heavy Equipment
12.5.5.3.9.Recreation and Consumer
12.5.5.3.10.Mining
12.5.5.3.11.Material Handling
12.5.5.3.12.Food and Beverages
12.5.5.3.13.Chemical
12.5.5.3.14.Others
12.5.6.Nordic Countries
12.5.6.1.Nordic Countries UHMW PE Market Revenue (US$ Mn) and Forecasts, By Form
12.5.6.1.1.Sheets
12.5.6.1.2.Films
12.5.6.1.3.Tapes
12.5.6.1.4.Rods and Tubes, Fibers
12.5.6.1.5.Others
12.5.6.2.Nordic Countries UHMW PE Market Revenue (US$ Mn) and Forecasts, By Application
12.5.6.2.1.Medical Grade and Prosthetics
12.5.6.2.2.Food Processing Machinery Parts
12.5.6.2.3.High-Speed Conveyors
12.5.6.2.4.Wear Strips and Guide Rails
12.5.6.2.5.Water Treatment
12.5.6.2.6.Packaging Machinery Parts
12.5.6.2.7.Bumpers, Pile Guards, and Dock Fenders
12.5.6.2.8.Chute, Hopper, and Truck Bed Liners
12.5.6.2.9.Star Wheels and Idler Sprockets
12.5.6.2.10.Batteries
12.5.6.2.11.Others
12.5.6.3.Nordic Countries UHMW PE Market Revenue (US$ Mn) and Forecasts, By End Use Industry
12.5.6.3.1.Healthcare
12.5.6.3.2.Aerospace and Defense
12.5.6.3.3.Oil and Gas
12.5.6.3.4.Automotive and Transportation
12.5.6.3.5.Electronics
12.5.6.3.6.Textiles
12.5.6.3.7.Sports and Leisure
12.5.6.3.8.Industrial and Heavy Equipment
12.5.6.3.9.Recreation and Consumer
12.5.6.3.10.Mining
12.5.6.3.11.Material Handling
12.5.6.3.12.Food and Beverages
12.5.6.3.13.Chemical
12.5.6.3.14.Others
12.5.6.4.Nordic Countries UHMW PE Market Revenue (US$ Mn) and Forecasts, By Country
12.5.6.4.1.Denmark
12.5.6.4.2.Finland
12.5.6.4.3.Iceland
12.5.6.4.4.Sweden
12.5.6.4.5.Norway
12.5.7.Benelux Union
12.5.7.1.Benelux Union UHMW PE Market Revenue (US$ Mn) and Forecasts, By Form
12.5.7.1.1.Sheets
12.5.7.1.2.Films
12.5.7.1.3.Tapes
12.5.7.1.4.Rods and Tubes, Fibers
12.5.7.1.5.Others
12.5.7.2.Benelux Union UHMW PE Market Revenue (US$ Mn) and Forecasts, By Application
12.5.7.2.1.Medical Grade and Prosthetics
12.5.7.2.2.Food Processing Machinery Parts
12.5.7.2.3.High-Speed Conveyors
12.5.7.2.4.Wear Strips and Guide Rails
12.5.7.2.5.Water Treatment
12.5.7.2.6.Packaging Machinery Parts
12.5.7.2.7.Bumpers, Pile Guards, and Dock Fenders
12.5.7.2.8.Chute, Hopper, and Truck Bed Liners
12.5.7.2.9.Star Wheels and Idler Sprockets
12.5.7.2.10.Batteries
12.5.7.2.11.Others
12.5.7.3.Benelux Union UHMW PE Market Revenue (US$ Mn) and Forecasts, By End Use Industry
12.5.7.3.1.Healthcare
12.5.7.3.2.Aerospace and Defense
12.5.7.3.3.Oil and Gas
12.5.7.3.4.Automotive and Transportation
12.5.7.3.5.Electronics
12.5.7.3.6.Textiles
12.5.7.3.7.Sports and Leisure
12.5.7.3.8.Industrial and Heavy Equipment
12.5.7.3.9.Recreation and Consumer
12.5.7.3.10.Mining
12.5.7.3.11.Material Handling
12.5.7.3.12.Food and Beverages
12.5.7.3.13.Chemical
12.5.7.3.14.Others
12.5.7.4.Benelux Union UHMW PE Market Revenue (US$ Mn) and Forecasts, By Country
12.5.7.4.1.Belgium
12.5.7.4.2.The Netherlands
12.5.7.4.3.Luxembourg
12.5.8.Rest of Europe
12.5.8.1.Rest of Europe UHMW PE Market Revenue (US$ Mn) and Forecasts, By Form
12.5.8.1.1.Sheets
12.5.8.1.2.Films
12.5.8.1.3.Tapes
12.5.8.1.4.Rods and Tubes, Fibers
12.5.8.1.5.Others
12.5.8.2.Rest of Europe UHMW PE Market Revenue (US$ Mn) and Forecasts, By Application
12.5.8.2.1.Medical Grade and Prosthetics
12.5.8.2.2.Food Processing Machinery Parts
12.5.8.2.3.High-Speed Conveyors
12.5.8.2.4.Wear Strips and Guide Rails
12.5.8.2.5.Water Treatment
12.5.8.2.6.Packaging Machinery Parts
12.5.8.2.7.Bumpers, Pile Guards, and Dock Fenders
12.5.8.2.8.Chute, Hopper, and Truck Bed Liners
12.5.8.2.9.Star Wheels and Idler Sprockets
12.5.8.2.10.Batteries
12.5.8.2.11.Others
12.5.8.3.Rest of Europe UHMW PE Market Revenue (US$ Mn) and Forecasts, By End Use Industry
12.5.8.3.1.Healthcare
12.5.8.3.2.Aerospace and Defense
12.5.8.3.3.Oil and Gas
12.5.8.3.4.Automotive and Transportation
12.5.8.3.5.Electronics
12.5.8.3.6.Textiles
12.5.8.3.7.Sports and Leisure
12.5.8.3.8.Industrial and Heavy Equipment
12.5.8.3.9.Recreation and Consumer
12.5.8.3.10.Mining
12.5.8.3.11.Material Handling
12.5.8.3.12.Food and Beverages
12.5.8.3.13.Chemical
12.5.8.3.14.Others
12.6.Key Segment for Channeling Investments
12.6.1.By Country
12.6.2.By Form
12.6.3.By Application
12.6.4.By End Use Industry
13.Asia Pacific UHMW PE Market Analysis and Forecasts, 2024 – 2034
13.1.Overview
13.1.1.Asia Pacific UHMW PE Market Revenue (US$ Mn)
13.2.Asia Pacific UHMW PE Market Revenue (US$ Mn) and Forecasts, By Form
13.2.1.Sheets
13.2.2.Films
13.2.3.Tapes
13.2.4.Rods and Tubes, Fibers
13.2.5.Others
13.3.Asia Pacific UHMW PE Market Revenue (US$ Mn) and Forecasts, By Application
13.3.1.Medical Grade and Prosthetics
13.3.2.Food Processing Machinery Parts
13.3.3.High-Speed Conveyors
13.3.4.Wear Strips and Guide Rails
13.3.5.Water Treatment
13.3.6.Packaging Machinery Parts
13.3.7.Bumpers, Pile Guards, and Dock Fenders
13.3.8.Chute, Hopper, and Truck Bed Liners
13.3.9.Star Wheels and Idler Sprockets
13.3.10.Batteries
13.3.11.Others
13.4.Asia Pacific UHMW PE Market Revenue (US$ Mn) and Forecasts, By End Use Industry
13.4.1.Healthcare
13.4.2.Aerospace and Defense
13.4.3.Oil and Gas
13.4.4.Automotive and Transportation
13.4.5.Electronics
13.4.6.Textiles
13.4.7.Sports and Leisure
13.4.8.Industrial and Heavy Equipment
13.4.9.Recreation and Consumer
13.4.10.Mining
13.4.11.Material Handling
13.4.12.Food and Beverages
13.4.13.Chemical
13.4.14.Others
13.5.Asia Pacific UHMW PE Market Revenue (US$ Mn) and Forecasts, By Country
13.5.1.China
13.5.1.1.China UHMW PE Market Revenue (US$ Mn) and Forecasts, By Form
13.5.1.1.1.Sheets
13.5.1.1.2.Films
13.5.1.1.3.Tapes
13.5.1.1.4.Rods and Tubes, Fibers
13.5.1.1.5.Others
13.5.1.2.China UHMW PE Market Revenue (US$ Mn) and Forecasts, By Application
13.5.1.2.1.Medical Grade and Prosthetics
13.5.1.2.2.Food Processing Machinery Parts
13.5.1.2.3.High-Speed Conveyors
13.5.1.2.4.Wear Strips and Guide Rails
13.5.1.2.5.Water Treatment
13.5.1.2.6.Packaging Machinery Parts
13.5.1.2.7.Bumpers, Pile Guards, and Dock Fenders
13.5.1.2.8.Chute, Hopper, and Truck Bed Liners
13.5.1.2.9.Star Wheels and Idler Sprockets
13.5.1.2.10.Batteries
13.5.1.2.11.Others
13.5.1.3.China UHMW PE Market Revenue (US$ Mn) and Forecasts, By End Use Industry
13.5.1.3.1.Healthcare
13.5.1.3.2.Aerospace and Defense
13.5.1.3.3.Oil and Gas
13.5.1.3.4.Automotive and Transportation
13.5.1.3.5.Electronics
13.5.1.3.6.Textiles
13.5.1.3.7.Sports and Leisure
13.5.1.3.8.Industrial and Heavy Equipment
13.5.1.3.9.Recreation and Consumer
13.5.1.3.10.Mining
13.5.1.3.11.Material Handling
13.5.1.3.12.Food and Beverages
13.5.1.3.13.Chemical
13.5.1.3.14.Others
13.5.2.Japan
13.5.2.1.Japan UHMW PE Market Revenue (US$ Mn) and Forecasts, By Form
13.5.2.1.1.Sheets
13.5.2.1.2.Films
13.5.2.1.3.Tapes
13.5.2.1.4.Rods and Tubes, Fibers
13.5.2.1.5.Others
13.5.2.2.Japan UHMW PE Market Revenue (US$ Mn) and Forecasts, By Application
13.5.2.2.1.Medical Grade and Prosthetics
13.5.2.2.2.Food Processing Machinery Parts
13.5.2.2.3.High-Speed Conveyors
13.5.2.2.4.Wear Strips and Guide Rails
13.5.2.2.5.Water Treatment
13.5.2.2.6.Packaging Machinery Parts
13.5.2.2.7.Bumpers, Pile Guards, and Dock Fenders
13.5.2.2.8.Chute, Hopper, and Truck Bed Liners
13.5.2.2.9.Star Wheels and Idler Sprockets
13.5.2.2.10.Batteries
13.5.2.2.11.Others
13.5.2.3.Japan UHMW PE Market Revenue (US$ Mn) and Forecasts, By End Use Industry
13.5.2.3.1.Healthcare
13.5.2.3.2.Aerospace and Defense
13.5.2.3.3.Oil and Gas
13.5.2.3.4.Automotive and Transportation
13.5.2.3.5.Electronics
13.5.2.3.6.Textiles
13.5.2.3.7.Sports and Leisure
13.5.2.3.8.Industrial and Heavy Equipment
13.5.2.3.9.Recreation and Consumer
13.5.2.3.10.Mining
13.5.2.3.11.Material Handling
13.5.2.3.12.Food and Beverages
13.5.2.3.13.Chemical
13.5.2.3.14.Others
13.5.3.India
13.5.3.1.India UHMW PE Market Revenue (US$ Mn) and Forecasts, By Form
13.5.3.1.1.Sheets
13.5.3.1.2.Films
13.5.3.1.3.Tapes
13.5.3.1.4.Rods and Tubes, Fibers
13.5.3.1.5.Others
13.5.3.2.India UHMW PE Market Revenue (US$ Mn) and Forecasts, By Application
13.5.3.2.1.Medical Grade and Prosthetics
13.5.3.2.2.Food Processing Machinery Parts
13.5.3.2.3.High-Speed Conveyors
13.5.3.2.4.Wear Strips and Guide Rails
13.5.3.2.5.Water Treatment
13.5.3.2.6.Packaging Machinery Parts
13.5.3.2.7.Bumpers, Pile Guards, and Dock Fenders
13.5.3.2.8.Chute, Hopper, and Truck Bed Liners
13.5.3.2.9.Star Wheels and Idler Sprockets
13.5.3.2.10.Batteries
13.5.3.2.11.Others
13.5.3.3.India UHMW PE Market Revenue (US$ Mn) and Forecasts, By End Use Industry
13.5.3.3.1.Healthcare
13.5.3.3.2.Aerospace and Defense
13.5.3.3.3.Oil and Gas
13.5.3.3.4.Automotive and Transportation
13.5.3.3.5.Electronics
13.5.3.3.6.Textiles
13.5.3.3.7.Sports and Leisure
13.5.3.3.8.Industrial and Heavy Equipment
13.5.3.3.9.Recreation and Consumer
13.5.3.3.10.Mining
13.5.3.3.11.Material Handling
13.5.3.3.12.Food and Beverages
13.5.3.3.13.Chemical
13.5.3.3.14.Others
13.5.4.New Zealand
13.5.4.1.New Zealand UHMW PE Market Revenue (US$ Mn) and Forecasts, By Form
13.5.4.1.1.Sheets
13.5.4.1.2.Films
13.5.4.1.3.Tapes
13.5.4.1.4.Rods and Tubes, Fibers
13.5.4.1.5.Others
13.5.4.2.New Zealand UHMW PE Market Revenue (US$ Mn) and Forecasts, By Application
13.5.4.2.1.Medical Grade and Prosthetics
13.5.4.2.2.Food Processing Machinery Parts
13.5.4.2.3.High-Speed Conveyors
13.5.4.2.4.Wear Strips and Guide Rails
13.5.4.2.5.Water Treatment
13.5.4.2.6.Packaging Machinery Parts
13.5.4.2.7.Bumpers, Pile Guards, and Dock Fenders
13.5.4.2.8.Chute, Hopper, and Truck Bed Liners
13.5.4.2.9.Star Wheels and Idler Sprockets
13.5.4.2.10.Batteries
13.5.4.2.11.Others
13.5.4.3.New Zealand UHMW PE Market Revenue (US$ Mn) and Forecasts, By End Use Industry
13.5.4.3.1.Healthcare
13.5.4.3.2.Aerospace and Defense
13.5.4.3.3.Oil and Gas
13.5.4.3.4.Automotive and Transportation
13.5.4.3.5.Electronics
13.5.4.3.6.Textiles
13.5.4.3.7.Sports and Leisure
13.5.4.3.8.Industrial and Heavy Equipment
13.5.4.3.9.Recreation and Consumer
13.5.4.3.10.Mining
13.5.4.3.11.Material Handling
13.5.4.3.12.Food and Beverages
13.5.4.3.13.Chemical
13.5.4.3.14.Others
13.5.5.Australia
13.5.5.1.Australia UHMW PE Market Revenue (US$ Mn) and Forecasts, By Form
13.5.5.1.1.Sheets
13.5.5.1.2.Films
13.5.5.1.3.Tapes
13.5.5.1.4.Rods and Tubes, Fibers
13.5.5.1.5.Others
13.5.5.2.Australia UHMW PE Market Revenue (US$ Mn) and Forecasts, By Application
13.5.5.2.1.Medical Grade and Prosthetics
13.5.5.2.2.Food Processing Machinery Parts
13.5.5.2.3.High-Speed Conveyors
13.5.5.2.4.Wear Strips and Guide Rails
13.5.5.2.5.Water Treatment
13.5.5.2.6.Packaging Machinery Parts
13.5.5.2.7.Bumpers, Pile Guards, and Dock Fenders
13.5.5.2.8.Chute, Hopper, and Truck Bed Liners
13.5.5.2.9.Star Wheels and Idler Sprockets
13.5.5.2.10.Batteries
13.5.5.2.11.Others
13.5.5.3.Australia UHMW PE Market Revenue (US$ Mn) and Forecasts, By End Use Industry
13.5.5.3.1.Healthcare
13.5.5.3.2.Aerospace and Defense
13.5.5.3.3.Oil and Gas
13.5.5.3.4.Automotive and Transportation
13.5.5.3.5.Electronics
13.5.5.3.6.Textiles
13.5.5.3.7.Sports and Leisure
13.5.5.3.8.Industrial and Heavy Equipment
13.5.5.3.9.Recreation and Consumer
13.5.5.3.10.Mining
13.5.5.3.11.Material Handling
13.5.5.3.12.Food and Beverages
13.5.5.3.13.Chemical
13.5.5.3.14.Others
13.5.6.South Korea
13.5.6.1.South Korea UHMW PE Market Revenue (US$ Mn) and Forecasts, By Form
13.5.6.1.1.Sheets
13.5.6.1.2.Films
13.5.6.1.3.Tapes
13.5.6.1.4.Rods and Tubes, Fibers
13.5.6.1.5.Others
13.5.6.2.South Korea UHMW PE Market Revenue (US$ Mn) and Forecasts, By Application
13.5.6.2.1.Medical Grade and Prosthetics
13.5.6.2.2.Food Processing Machinery Parts
13.5.6.2.3.High-Speed Conveyors
13.5.6.2.4.Wear Strips and Guide Rails
13.5.6.2.5.Water Treatment
13.5.6.2.6.Packaging Machinery Parts
13.5.6.2.7.Bumpers, Pile Guards, and Dock Fenders
13.5.6.2.8.Chute, Hopper, and Truck Bed Liners
13.5.6.2.9.Star Wheels and Idler Sprockets
13.5.6.2.10.Batteries
13.5.6.2.11.Others
13.5.6.3.South Korea UHMW PE Market Revenue (US$ Mn) and Forecasts, By End Use Industry
13.5.6.3.1.Healthcare
13.5.6.3.2.Aerospace and Defense
13.5.6.3.3.Oil and Gas
13.5.6.3.4.Automotive and Transportation
13.5.6.3.5.Electronics
13.5.6.3.6.Textiles
13.5.6.3.7.Sports and Leisure
13.5.6.3.8.Industrial and Heavy Equipment
13.5.6.3.9.Recreation and Consumer
13.5.6.3.10.Mining
13.5.6.3.11.Material Handling
13.5.6.3.12.Food and Beverages
13.5.6.3.13.Chemical
13.5.6.3.14.Others
13.5.7.Southeast Asia
13.5.7.1.Southeast Asia UHMW PE Market Revenue (US$ Mn) and Forecasts, By Form
13.5.7.1.1.Sheets
13.5.7.1.2.Films
13.5.7.1.3.Tapes
13.5.7.1.4.Rods and Tubes, Fibers
13.5.7.1.5.Others
13.5.7.2.Southeast Asia UHMW PE Market Revenue (US$ Mn) and Forecasts, By Application
13.5.7.2.1.Medical Grade and Prosthetics
13.5.7.2.2.Food Processing Machinery Parts
13.5.7.2.3.High-Speed Conveyors
13.5.7.2.4.Wear Strips and Guide Rails
13.5.7.2.5.Water Treatment
13.5.7.2.6.Packaging Machinery Parts
13.5.7.2.7.Bumpers, Pile Guards, and Dock Fenders
13.5.7.2.8.Chute, Hopper, and Truck Bed Liners
13.5.7.2.9.Star Wheels and Idler Sprockets
13.5.7.2.10.Batteries
13.5.7.2.11.Others
13.5.7.3.Southeast Asia UHMW PE Market Revenue (US$ Mn) and Forecasts, By End Use Industry
13.5.7.3.1.Healthcare
13.5.7.3.2.Aerospace and Defense
13.5.7.3.3.Oil and Gas
13.5.7.3.4.Automotive and Transportation
13.5.7.3.5.Electronics
13.5.7.3.6.Textiles
13.5.7.3.7.Sports and Leisure
13.5.7.3.8.Industrial and Heavy Equipment
13.5.7.3.9.Recreation and Consumer
13.5.7.3.10.Mining
13.5.7.3.11.Material Handling
13.5.7.3.12.Food and Beverages
13.5.7.3.13.Chemical
13.5.7.3.14.Others
13.5.7.4.Southeast Asia UHMW PE Market Revenue (US$ Mn) and Forecasts, By Country
13.5.7.4.1.Indonesia
13.5.7.4.2.Thailand
13.5.7.4.3.Malaysia
13.5.7.4.4.Singapore
13.5.7.4.5.Rest of Southeast Asia
13.5.8.Rest of Asia Pacific
13.5.8.1.Rest of Asia Pacific UHMW PE Market Revenue (US$ Mn) and Forecasts, By Form
13.5.8.1.1.Sheets
13.5.8.1.2.Films
13.5.8.1.3.Tapes
13.5.8.1.4.Rods and Tubes, Fibers
13.5.8.1.5.Others
13.5.8.2.Rest of Asia Pacific UHMW PE Market Revenue (US$ Mn) and Forecasts, By Application
13.5.8.2.1.Medical Grade and Prosthetics
13.5.8.2.2.Food Processing Machinery Parts
13.5.8.2.3.High-Speed Conveyors
13.5.8.2.4.Wear Strips and Guide Rails
13.5.8.2.5.Water Treatment
13.5.8.2.6.Packaging Machinery Parts
13.5.8.2.7.Bumpers, Pile Guards, and Dock Fenders
13.5.8.2.8.Chute, Hopper, and Truck Bed Liners
13.5.8.2.9.Star Wheels and Idler Sprockets
13.5.8.2.10.Batteries
13.5.8.2.11.Others
13.5.8.3.Rest of Asia Pacific UHMW PE Market Revenue (US$ Mn) and Forecasts, By End Use Industry
13.5.8.3.1.Healthcare
13.5.8.3.2.Aerospace and Defense
13.5.8.3.3.Oil and Gas
13.5.8.3.4.Automotive and Transportation
13.5.8.3.5.Electronics
13.5.8.3.6.Textiles
13.5.8.3.7.Sports and Leisure
13.5.8.3.8.Industrial and Heavy Equipment
13.5.8.3.9.Recreation and Consumer
13.5.8.3.10.Mining
13.5.8.3.11.Material Handling
13.5.8.3.12.Food and Beverages
13.5.8.3.13.Chemical
13.5.8.3.14.Others
13.6.Key Segment for Channeling Investments
13.6.1.By Country
13.6.2.By Form
13.6.3.By Application
13.6.4.By End Use Industry
14.Middle East and Africa UHMW PE Market Analysis and Forecasts, 2024 – 2034
14.1.Overview
14.1.1.Middle East and Africa UHMW PE Market Revenue (US$ Mn)
14.2.Middle East and Africa UHMW PE Market Revenue (US$ Mn) and Forecasts, By Form
14.2.1.Sheets
14.2.2.Films
14.2.3.Tapes
14.2.4.Rods and Tubes, Fibers
14.2.5.Others
14.3.Middle East and Africa UHMW PE Market Revenue (US$ Mn) and Forecasts, By Application
14.3.1.Medical Grade and Prosthetics
14.3.2.Food Processing Machinery Parts
14.3.3.High-Speed Conveyors
14.3.4.Wear Strips and Guide Rails
14.3.5.Water Treatment
14.3.6.Packaging Machinery Parts
14.3.7.Bumpers, Pile Guards, and Dock Fenders
14.3.8.Chute, Hopper, and Truck Bed Liners
14.3.9.Star Wheels and Idler Sprockets
14.3.10.Batteries
14.3.11.Others
14.4.Middle East and Africa UHMW PE Market Revenue (US$ Mn) and Forecasts, By End Use Industry
14.4.1.Healthcare
14.4.2.Aerospace and Defense
14.4.3.Oil and Gas
14.4.4.Automotive and Transportation
14.4.5.Electronics
14.4.6.Textiles
14.4.7.Sports and Leisure
14.4.8.Industrial and Heavy Equipment
14.4.9.Recreation and Consumer
14.4.10.Mining
14.4.11.Material Handling
14.4.12.Food and Beverages
14.4.13.Chemical
14.4.14.Others
14.5.Middle East and Africa UHMW PE Market Revenue (US$ Mn) and Forecasts, By Country
14.5.1.Saudi Arabia
14.5.1.1.Saudi Arabia UHMW PE Market Revenue (US$ Mn) and Forecasts, By Form
14.5.1.1.1.Sheets
14.5.1.1.2.Films
14.5.1.1.3.Tapes
14.5.1.1.4.Rods and Tubes, Fibers
14.5.1.1.5.Others
14.5.1.2.Saudi Arabia UHMW PE Market Revenue (US$ Mn) and Forecasts, By Application
14.5.1.2.1.Medical Grade and Prosthetics
14.5.1.2.2.Food Processing Machinery Parts
14.5.1.2.3.High-Speed Conveyors
14.5.1.2.4.Wear Strips and Guide Rails
14.5.1.2.5.Water Treatment
14.5.1.2.6.Packaging Machinery Parts
14.5.1.2.7.Bumpers, Pile Guards, and Dock Fenders
14.5.1.2.8.Chute, Hopper, and Truck Bed Liners
14.5.1.2.9.Star Wheels and Idler Sprockets
14.5.1.2.10.Batteries
14.5.1.2.11.Others
14.5.1.3.Saudi Arabia UHMW PE Market Revenue (US$ Mn) and Forecasts, By End Use Industry
14.5.1.3.1.Healthcare
14.5.1.3.2.Aerospace and Defense
14.5.1.3.3.Oil and Gas
14.5.1.3.4.Automotive and Transportation
14.5.1.3.5.Electronics
14.5.1.3.6.Textiles
14.5.1.3.7.Sports and Leisure
14.5.1.3.8.Industrial and Heavy Equipment
14.5.1.3.9.Recreation and Consumer
14.5.1.3.10.Mining
14.5.1.3.11.Material Handling
14.5.1.3.12.Food and Beverages
14.5.1.3.13.Chemical
14.5.1.3.14.Others
14.5.2.UAE
14.5.2.1.UAE UHMW PE Market Revenue (US$ Mn) and Forecasts, By Form
14.5.2.1.1.Sheets
14.5.2.1.2.Films
14.5.2.1.3.Tapes
14.5.2.1.4.Rods and Tubes, Fibers
14.5.2.1.5.Others
14.5.2.2.UAE UHMW PE Market Revenue (US$ Mn) and Forecasts, By Application
14.5.2.2.1.Medical Grade and Prosthetics
14.5.2.2.2.Food Processing Machinery Parts
14.5.2.2.3.High-Speed Conveyors
14.5.2.2.4.Wear Strips and Guide Rails
14.5.2.2.5.Water Treatment
14.5.2.2.6.Packaging Machinery Parts
14.5.2.2.7.Bumpers, Pile Guards, and Dock Fenders
14.5.2.2.8.Chute, Hopper, and Truck Bed Liners
14.5.2.2.9.Star Wheels and Idler Sprockets
14.5.2.2.10.Batteries
14.5.2.2.11.Others
14.5.2.3.UAE UHMW PE Market Revenue (US$ Mn) and Forecasts, By End Use Industry
14.5.2.3.1.Healthcare
14.5.2.3.2.Aerospace and Defense
14.5.2.3.3.Oil and Gas
14.5.2.3.4.Automotive and Transportation
14.5.2.3.5.Electronics
14.5.2.3.6.Textiles
14.5.2.3.7.Sports and Leisure
14.5.2.3.8.Industrial and Heavy Equipment
14.5.2.3.9.Recreation and Consumer
14.5.2.3.10.Mining
14.5.2.3.11.Material Handling
14.5.2.3.12.Food and Beverages
14.5.2.3.13.Chemical
14.5.2.3.14.Others
14.5.3.Egypt
14.5.3.1.Egypt UHMW PE Market Revenue (US$ Mn) and Forecasts, By Form
14.5.3.1.1.Sheets
14.5.3.1.2.Films
14.5.3.1.3.Tapes
14.5.3.1.4.Rods and Tubes, Fibers
14.5.3.1.5.Others
14.5.3.2.Egypt UHMW PE Market Revenue (US$ Mn) and Forecasts, By Application
14.5.3.2.1.Medical Grade and Prosthetics
14.5.3.2.2.Food Processing Machinery Parts
14.5.3.2.3.High-Speed Conveyors
14.5.3.2.4.Wear Strips and Guide Rails
14.5.3.2.5.Water Treatment
14.5.3.2.6.Packaging Machinery Parts
14.5.3.2.7.Bumpers, Pile Guards, and Dock Fenders
14.5.3.2.8.Chute, Hopper, and Truck Bed Liners
14.5.3.2.9.Star Wheels and Idler Sprockets
14.5.3.2.10.Batteries
14.5.3.2.11.Others
14.5.3.3.Egypt UHMW PE Market Revenue (US$ Mn) and Forecasts, By End Use Industry
14.5.3.3.1.Healthcare
14.5.3.3.2.Aerospace and Defense
14.5.3.3.3.Oil and Gas
14.5.3.3.4.Automotive and Transportation
14.5.3.3.5.Electronics
14.5.3.3.6.Textiles
14.5.3.3.7.Sports and Leisure
14.5.3.3.8.Industrial and Heavy Equipment
14.5.3.3.9.Recreation and Consumer
14.5.3.3.10.Mining
14.5.3.3.11.Material Handling
14.5.3.3.12.Food and Beverages
14.5.3.3.13.Chemical
14.5.3.3.14.Others
14.5.4.Kuwait
14.5.4.1.Kuwait UHMW PE Market Revenue (US$ Mn) and Forecasts, By Form
14.5.4.1.1.Sheets
14.5.4.1.2.Films
14.5.4.1.3.Tapes
14.5.4.1.4.Rods and Tubes, Fibers
14.5.4.1.5.Others
14.5.4.2.Kuwait UHMW PE Market Revenue (US$ Mn) and Forecasts, By Application
14.5.4.2.1.Medical Grade and Prosthetics
14.5.4.2.2.Food Processing Machinery Parts
14.5.4.2.3.High-Speed Conveyors
14.5.4.2.4.Wear Strips and Guide Rails
14.5.4.2.5.Water Treatment
14.5.4.2.6.Packaging Machinery Parts
14.5.4.2.7.Bumpers, Pile Guards, and Dock Fenders
14.5.4.2.8.Chute, Hopper, and Truck Bed Liners
14.5.4.2.9.Star Wheels and Idler Sprockets
14.5.4.2.10.Batteries
14.5.4.2.11.Others
14.5.4.3.Kuwait UHMW PE Market Revenue (US$ Mn) and Forecasts, By End Use Industry
14.5.4.3.1.Healthcare
14.5.4.3.2.Aerospace and Defense
14.5.4.3.3.Oil and Gas
14.5.4.3.4.Automotive and Transportation
14.5.4.3.5.Electronics
14.5.4.3.6.Textiles
14.5.4.3.7.Sports and Leisure
14.5.4.3.8.Industrial and Heavy Equipment
14.5.4.3.9.Recreation and Consumer
14.5.4.3.10.Mining
14.5.4.3.11.Material Handling
14.5.4.3.12.Food and Beverages
14.5.4.3.13.Chemical
14.5.4.3.14.Others
14.5.5.South Africa
14.5.5.1.South Africa UHMW PE Market Revenue (US$ Mn) and Forecasts, By Form
14.5.5.1.1.Sheets
14.5.5.1.2.Films
14.5.5.1.3.Tapes
14.5.5.1.4.Rods and Tubes, Fibers
14.5.5.1.5.Others
14.5.5.2.South Africa UHMW PE Market Revenue (US$ Mn) and Forecasts, By Application
14.5.5.2.1.Medical Grade and Prosthetics
14.5.5.2.2.Food Processing Machinery Parts
14.5.5.2.3.High-Speed Conveyors
14.5.5.2.4.Wear Strips and Guide Rails
14.5.5.2.5.Water Treatment
14.5.5.2.6.Packaging Machinery Parts
14.5.5.2.7.Bumpers, Pile Guards, and Dock Fenders
14.5.5.2.8.Chute, Hopper, and Truck Bed Liners
14.5.5.2.9.Star Wheels and Idler Sprockets
14.5.5.2.10.Batteries
14.5.5.2.11.Others
14.5.5.3.South Africa UHMW PE Market Revenue (US$ Mn) and Forecasts, By End Use Industry
14.5.5.3.1.Healthcare
14.5.5.3.2.Aerospace and Defense
14.5.5.3.3.Oil and Gas
14.5.5.3.4.Automotive and Transportation
14.5.5.3.5.Electronics
14.5.5.3.6.Textiles
14.5.5.3.7.Sports and Leisure
14.5.5.3.8.Industrial and Heavy Equipment
14.5.5.3.9.Recreation and Consumer
14.5.5.3.10.Mining
14.5.5.3.11.Material Handling
14.5.5.3.12.Food and Beverages
14.5.5.3.13.Chemical
14.5.5.3.14.Others
14.5.6.Rest of Middle East & Africa
14.5.6.1.Rest of Middle East & Africa UHMW PE Market Revenue (US$ Mn) and Forecasts, By Form
14.5.6.1.1.Sheets
14.5.6.1.2.Films
14.5.6.1.3.Tapes
14.5.6.1.4.Rods and Tubes, Fibers
14.5.6.1.5.Others
14.5.6.2.Rest of Middle East & Africa UHMW PE Market Revenue (US$ Mn) and Forecasts, By Application
14.5.6.2.1.Medical Grade and Prosthetics
14.5.6.2.2.Food Processing Machinery Parts
14.5.6.2.3.High-Speed Conveyors
14.5.6.2.4.Wear Strips and Guide Rails
14.5.6.2.5.Water Treatment
14.5.6.2.6.Packaging Machinery Parts
14.5.6.2.7.Bumpers, Pile Guards, and Dock Fenders
14.5.6.2.8.Chute, Hopper, and Truck Bed Liners
14.5.6.2.9.Star Wheels and Idler Sprockets
14.5.6.2.10.Batteries
14.5.6.2.11.Others
14.5.6.3.Rest of Middle East & Africa UHMW PE Market Revenue (US$ Mn) and Forecasts, By End Use Industry
14.5.6.3.1.Healthcare
14.5.6.3.2.Aerospace and Defense
14.5.6.3.3.Oil and Gas
14.5.6.3.4.Automotive and Transportation
14.5.6.3.5.Electronics
14.5.6.3.6.Textiles
14.5.6.3.7.Sports and Leisure
14.5.6.3.8.Industrial and Heavy Equipment
14.5.6.3.9.Recreation and Consumer
14.5.6.3.10.Mining
14.5.6.3.11.Material Handling
14.5.6.3.12.Food and Beverages
14.5.6.3.13.Chemical
14.5.6.3.14.Others
14.6.Key Segment for Channeling Investments
14.6.1.By Country
14.6.2.By Form
14.6.3.By Application
14.6.4.By End Use Industry
15.Latin America UHMW PE Market Analysis and Forecasts, 2024 – 2034
15.1.Overview
15.1.1.Latin America UHMW PE Market Revenue (US$ Mn)
15.2.Latin America UHMW PE Market Revenue (US$ Mn) and Forecasts, By Form
15.2.1.Sheets
15.2.2.Films
15.2.3.Tapes
15.2.4.Rods and Tubes, Fibers
15.2.5.Others
15.3.Latin America UHMW PE Market Revenue (US$ Mn) and Forecasts, By Application
15.3.1.Medical Grade and Prosthetics
15.3.2.Food Processing Machinery Parts
15.3.3.High-Speed Conveyors
15.3.4.Wear Strips and Guide Rails
15.3.5.Water Treatment
15.3.6.Packaging Machinery Parts
15.3.7.Bumpers, Pile Guards, and Dock Fenders
15.3.8.Chute, Hopper, and Truck Bed Liners
15.3.9.Star Wheels and Idler Sprockets
15.3.10.Batteries
15.3.11.Others
15.4.Latin America UHMW PE Market Revenue (US$ Mn) and Forecasts, By End Use Industry
15.4.1.Healthcare
15.4.2.Aerospace and Defense
15.4.3.Oil and Gas
15.4.4.Automotive and Transportation
15.4.5.Electronics
15.4.6.Textiles
15.4.7.Sports and Leisure
15.4.8.Industrial and Heavy Equipment
15.4.9.Recreation and Consumer
15.4.10.Mining
15.4.11.Material Handling
15.4.12.Food and Beverages
15.4.13.Chemical
15.4.14.Others
15.5.Latin America UHMW PE Market Revenue (US$ Mn) and Forecasts, By Country
15.5.1.Brazil
15.5.1.1.Brazil UHMW PE Market Revenue (US$ Mn) and Forecasts, By Form
15.5.1.1.1.Sheets
15.5.1.1.2.Films
15.5.1.1.3.Tapes
15.5.1.1.4.Rods and Tubes, Fibers
15.5.1.1.5.Others
15.5.1.2.Brazil UHMW PE Market Revenue (US$ Mn) and Forecasts, By Application
15.5.1.2.1.Medical Grade and Prosthetics
15.5.1.2.2.Food Processing Machinery Parts
15.5.1.2.3.High-Speed Conveyors
15.5.1.2.4.Wear Strips and Guide Rails
15.5.1.2.5.Water Treatment
15.5.1.2.6.Packaging Machinery Parts
15.5.1.2.7.Bumpers, Pile Guards, and Dock Fenders
15.5.1.2.8.Chute, Hopper, and Truck Bed Liners
15.5.1.2.9.Star Wheels and Idler Sprockets
15.5.1.2.10.Batteries
15.5.1.2.11.Others
15.5.1.3.Brazil UHMW PE Market Revenue (US$ Mn) and Forecasts, By End Use Industry
15.5.1.3.1.Healthcare
15.5.1.3.2.Aerospace and Defense
15.5.1.3.3.Oil and Gas
15.5.1.3.4.Automotive and Transportation
15.5.1.3.5.Electronics
15.5.1.3.6.Textiles
15.5.1.3.7.Sports and Leisure
15.5.1.3.8.Industrial and Heavy Equipment
15.5.1.3.9.Recreation and Consumer
15.5.1.3.10.Mining
15.5.1.3.11.Material Handling
15.5.1.3.12.Food and Beverages
15.5.1.3.13.Chemical
15.5.1.3.14.Others
15.5.2.Argentina
15.5.2.1.Argentina UHMW PE Market Revenue (US$ Mn) and Forecasts, By Form
15.5.2.1.1.Sheets
15.5.2.1.2.Films
15.5.2.1.3.Tapes
15.5.2.1.4.Rods and Tubes, Fibers
15.5.2.1.5.Others
15.5.2.2.Argentina UHMW PE Market Revenue (US$ Mn) and Forecasts, By Application
15.5.2.2.1.Medical Grade and Prosthetics
15.5.2.2.2.Food Processing Machinery Parts
15.5.2.2.3.High-Speed Conveyors
15.5.2.2.4.Wear Strips and Guide Rails
15.5.2.2.5.Water Treatment
15.5.2.2.6.Packaging Machinery Parts
15.5.2.2.7.Bumpers, Pile Guards, and Dock Fenders
15.5.2.2.8.Chute, Hopper, and Truck Bed Liners
15.5.2.2.9.Star Wheels and Idler Sprockets
15.5.2.2.10.Batteries
15.5.2.2.11.Others
15.5.2.3.Argentina UHMW PE Market Revenue (US$ Mn) and Forecasts, By End Use Industry
15.5.2.3.1.Healthcare
15.5.2.3.2.Aerospace and Defense
15.5.2.3.3.Oil and Gas
15.5.2.3.4.Automotive and Transportation
15.5.2.3.5.Electronics
15.5.2.3.6.Textiles
15.5.2.3.7.Sports and Leisure
15.5.2.3.8.Industrial and Heavy Equipment
15.5.2.3.9.Recreation and Consumer
15.5.2.3.10.Mining
15.5.2.3.11.Material Handling
15.5.2.3.12.Food and Beverages
15.5.2.3.13.Chemical
15.5.2.3.14.Others
15.5.3.Rest of Latin America
15.5.3.1.Rest of Latin America UHMW PE Market Revenue (US$ Mn) and Forecasts, By Form
15.5.3.1.1.Sheets
15.5.3.1.2.Films
15.5.3.1.3.Tapes
15.5.3.1.4.Rods and Tubes, Fibers
15.5.3.1.5.Others
15.5.3.2.Rest of Latin America UHMW PE Market Revenue (US$ Mn) and Forecasts, By Application
15.5.3.2.1.Medical Grade and Prosthetics
15.5.3.2.2.Food Processing Machinery Parts
15.5.3.2.3.High-Speed Conveyors
15.5.3.2.4.Wear Strips and Guide Rails
15.5.3.2.5.Water Treatment
15.5.3.2.6.Packaging Machinery Parts
15.5.3.2.7.Bumpers, Pile Guards, and Dock Fenders
15.5.3.2.8.Chute, Hopper, and Truck Bed Liners
15.5.3.2.9.Star Wheels and Idler Sprockets
15.5.3.2.10.Batteries
15.5.3.2.11.Others
15.5.3.3.Rest of Latin America UHMW PE Market Revenue (US$ Mn) and Forecasts, By End Use Industry
15.5.3.3.1.Healthcare
15.5.3.3.2.Aerospace and Defense
15.5.3.3.3.Oil and Gas
15.5.3.3.4.Automotive and Transportation
15.5.3.3.5.Electronics
15.5.3.3.6.Textiles
15.5.3.3.7.Sports and Leisure
15.5.3.3.8.Industrial and Heavy Equipment
15.5.3.3.9.Recreation and Consumer
15.5.3.3.10.Mining
15.5.3.3.11.Material Handling
15.5.3.3.12.Food and Beverages
15.5.3.3.13.Chemical
15.5.3.3.14.Others
15.6.Key Segment for Channeling Investments
15.6.1.By Country
15.6.2.By Form
15.6.3.By Application
15.6.4.By End Use Industry
16.Competitive Benchmarking
16.1.Brand Benchmarking
16.2.Market Share Analysis, 2023
16.3.Global Presence and Growth Strategies
16.3.1.Mergers and Acquisitions
16.3.2.Product Launches
16.3.3.Investments Trends
16.3.4.R&D Initiatives
17.Player Profiles
17.1.Asahi Kasei Corporation
17.1.1.Company Details
17.1.2.Company Overview
17.1.3.Product Offerings
17.1.4.Key Developments
17.1.5.Financial Analysis
17.1.6.SWOT Analysis
17.1.7.Business Strategies
17.2.Braskem
17.2.1.Company Details
17.2.2.Company Overview
17.2.3.Product Offerings
17.2.4.Key Developments
17.2.5.Financial Analysis
17.2.6.SWOT Analysis
17.2.7.Business Strategies
17.3.Celanese Corporation
17.3.1.Company Details
17.3.2.Company Overview
17.3.3.Product Offerings
17.3.4.Key Developments
17.3.5.Financial Analysis
17.3.6.SWOT Analysis
17.3.7.Business Strategies
17.4.China Petrochemical Corporation
17.4.1.Company Details
17.4.2.Company Overview
17.4.3.Product Offerings
17.4.4.Key Developments
17.4.5.Financial Analysis
17.4.6.SWOT Analysis
17.4.7.Business Strategies
17.5.Crown Plastics, Inc.
17.5.1.Company Details
17.5.2.Company Overview
17.5.3.Product Offerings
17.5.4.Key Developments
17.5.5.Financial Analysis
17.5.6.SWOT Analysis
17.5.7.Business Strategies
17.6.Dotmar Engineering Plastics
17.6.1.Company Details
17.6.2.Company Overview
17.6.3.Product Offerings
17.6.4.Key Developments
17.6.5.Financial Analysis
17.6.6.SWOT Analysis
17.6.7.Business Strategies
17.7.Garland Manufacturing Company
17.7.1.Company Details
17.7.2.Company Overview
17.7.3.Product Offerings
17.7.4.Key Developments
17.7.5.Financial Analysis
17.7.6.SWOT Analysis
17.7.7.Business Strategies
17.8.Honeywell International, Inc.
17.8.1.Company Details
17.8.2.Company Overview
17.8.3.Product Offerings
17.8.4.Key Developments
17.8.5.Financial Analysis
17.8.6.SWOT Analysis
17.8.7.Business Strategies
17.9.Koninklijke DSM N.V.
17.9.1.Company Details
17.9.2.Company Overview
17.9.3.Product Offerings
17.9.4.Key Developments
17.9.5.Financial Analysis
17.9.6.SWOT Analysis
17.9.7.Business Strategies
17.10.LianLe Chemical Corporation
17.10.1.Company Details
17.10.2.Company Overview
17.10.3.Product Offerings
17.10.4.Key Developments
17.10.5.Financial Analysis
17.10.6.SWOT Analysis
17.10.7.Business Strategies
17.11.LyondellBasell Industries Holdings B.V
17.11.1.Company Details
17.11.2.Company Overview
17.11.3.Product Offerings
17.11.4.Key Developments
17.11.5.Financial Analysis
17.11.6.SWOT Analysis
17.11.7.Business Strategies
17.12.Mitsubishi Chemical Advanced Materials Group
17.12.1.Company Details
17.12.2.Company Overview
17.12.3.Product Offerings
17.12.4.Key Developments
17.12.5.Financial Analysis
17.12.6.SWOT Analysis
17.12.7.Business Strategies
17.13.Mitsui Chemicals, Inc.
17.13.1.Company Details
17.13.2.Company Overview
17.13.3.Product Offerings
17.13.4.Key Developments
17.13.5.Financial Analysis
17.13.6.SWOT Analysis
17.13.7.Business Strategies
17.14.TSE Industries, Inc.
17.14.1.Company Details
17.14.2.Company Overview
17.14.3.Product Offerings
17.14.4.Key Developments
17.14.5.Financial Analysis
17.14.6.SWOT Analysis
17.14.7.Business Strategies
17.15.Other Industry Participants
18.Key Findings

.

Note: This ToC is tentative and can be changed according to the research study conducted during the course of report completion.

.

**Exclusive for Multi-User and Enterprise User.

Global UHMW PE Market

By Form

  • Sheets
  • Films
  • Tapes
  • Rods & Tubes, Fibers
  • Others

By Application

  • Medical Grade & Prosthetics
  • Food Processing Machinery Parts
  • High-Speed Conveyors
  • Wear Strips and Guide Rails
  • Water Treatment
  • Packaging Machinery Parts
  • Bumpers, Pile Guards, and Dock Fenders
  • Chute, Hopper, and Truck Bed Liners
  • Star Wheels and Idler Sprockets
  • Batteries
  • Others

By End Use Industry

  • Healthcare
  • Aerospace & Defense
  • Oil & Gas
  • Automotive & Transportation
  • Electronics
  • Textiles
  • Sports & Leisure
  • Industrial & Heavy Equipment
  • Recreation & Consumer
  • Mining
  • Material Handling
  • Food & Beverages
  • Chemical
  • Others

By Region

  • North America (U.S., Canada, Mexico, Rest of North America)
  • Europe (France, The UK, Spain, Germany, Italy, Nordic Countries (Denmark, Finland, Iceland, Sweden, Norway), Benelux Union (Belgium, The Netherlands, Luxembourg), Rest of Europe)
  • Asia Pacific (China, Japan, India, New Zealand, Australia, South Korea, Southeast Asia (Indonesia, Thailand, Malaysia, Singapore, Rest of Southeast Asia), Rest of Asia Pacific)
  • Middle East & Africa (Saudi Arabia, UAE, Egypt, Kuwait, South Africa, Rest of Middle East & Africa)
  • Latin America (Brazil, Argentina, Rest of Latin America)

The Niche Research approach encompasses both primary and secondary research methods to provide comprehensive insights. While primary research is the cornerstone of our studies, we also incorporate secondary research sources such as company annual reports, premium industry databases, press releases, industry journals, and white papers.

Within our primary research, we actively engage with various industry stakeholders, conducting paid interviews and surveys. Our meticulous analysis extends to every market participant in major countries, allowing us to thoroughly examine their portfolios, calculate market shares, and segment revenues.

Our data collection primarily focuses on individual countries within our research scope, enabling us to estimate regional market sizes. Typically, we employ a bottom-up approach, meticulously tracking trends in different countries. We analyze growth drivers, constraints, technological innovations, and opportunities for each country, ultimately arriving at regional figures.Our process begins by examining the growth prospects of each country. Building upon these insights, we project growth and trends for the entire region. Finally, we utilize our proprietary model to refine estimations and forecasts.

Our data validation standards are integral to ensuring the reliability and accuracy of our research findings. Here’s a breakdown of our data validation processes and the stakeholders we engage with during our primary research:

  • Supply Side Analysis: We initiate a supply side analysis by directly contacting market participants, through telephonic interviews and questionnaires containing both open-ended and close-ended questions. We gather information on their portfolios, segment revenues, developments, and growth strategies.
  • Demand Side Analysis: To gain insights into adoption trends and consumer preferences, we reach out to target customers and users (non-vendors). This information forms a vital part of the qualitative analysis section of our reports, covering market dynamics, adoption trends, consumer behavior, spending patterns, and other related aspects.
  • Consultant Insights: We tap into the expertise of our partner consultants from around the world to obtain their unique viewpoints and perspectives. Their insights contribute to a well-rounded understanding of the markets under investigation.
  • In-House Validation: To ensure data accuracy and reliability, we conduct cross-validation of data points and information through our in-house team of consultants and utilize advanced data modeling tools for thorough verification.

The forecasts we provide are based on a comprehensive assessment of various factors, including:

  • Market Trends and Past Performance (Last Five Years): We accurately analyze market trends and performance data from preceding five years to identify historical patterns and understand the market’s evolution.
  • Historical Performance and Growth of Market Participants: We assess the historical performance and growth trajectories of key market participants. This analysis provides insights into the competitive landscape and individual company strategies.
  • Market Determinants Impact Analysis (Next Eight Years): We conduct a rigorous analysis of the factors that are projected to influence the market over the next eight years. This includes assessing both internal and external determinants that can shape market dynamics.
  • Drivers and Challenges for the Forecast Period:Identify the factors expected to drive market growth during the forecast period, as well as the challenges that the industry may face. This analysis aids in deriving an accurate growth rate projection.
  • New Acquisitions, Collaborations, or Partnerships: We keep a close watch on any new acquisitions, collaborations, or partnerships within the industry. These developments can have a significant impact on market dynamics and competitiveness.
  • Macro and Micro Factors Analysis:A thorough examination of both macro-level factors (e.g., economic trends, regulatory changes) and micro-level factors (e.g., technological advancements, consumer preferences) that may influence the market during the forecast period.
  • End-User Sentiment Analysis: To understand the market from the end-user perspective, we conduct sentiment analysis. This involves assessing the sentiment, preferences, and feedback of the end-users, which can provide valuable insights into market trends.
  • Perspective of Primary Participants: Insights gathered directly from primary research participants play a crucial role in shaping our forecasts. Their perspectives and experiences provide valuable qualitative data.
  • Year-on-Year Growth Trend: We utilize a year-on-year growth trend based on historical market growth and expected future trends. This helps in formulating our growth projections, aligning them with the market’s historical performance.

Research process adopted by TNR involves multiple stages, including data collection, validation, quality checks, and presentation. It’s crucial that the data and information we provide add value to your existing market understanding and expertise. We have also established partnerships with business consulting, research, and survey organizations across regions and globally to collaborate on regional analysis and data validation, ensuring the highest level of accuracy and reliability in our reports.


Procure Comprehensive Study of

Global UHMW PE Market

Online Only

  • Online Access
  • Read Only File
  • Validity 3 Months
  • Print, Copy, Paste & Download
  • PPT, Excel
  • Cost-Free Report in the Next Update
$3300
Buy Now

Single User

  • Access to One User on One System
  • Read Only File
  • Validity 6 Months
  • Limited Print,Copy, Paste
  • PPT, Excel
  • Cost-Free Report in the Next Update
$4200
Buy Now

Multi User

  • Access to Fiver Users
  • PDF File
  • Validity 1 Year
  • Upto FivePrints
  • Cost-Free Report in the Next Update
  • PPT, Excel
$6000
Buy Now

Enterprise User

  • Access to Unlimited Users
  • PDF, PPT, Excel
  • Unlimited Validity, Prints&Downloads
  • 1 Hour Cost-Free & Dedicated Analyst Support
  • 10% Cost-Free Customization
  • Cost-Free Report Update Twice in a Year
  • Recommendations for Business Strategies
  • Authorization to Quote TNR, The Niche Research
$7300
Buy Now

Library Access

  • Online Access to Content Publications
  • Access Player Profiles Online
  • Get Immediate Access to Newly Added Content
  • Acquire 12 PDF Downloads
  • Acquire 5 Excel Data Sets
  • Gain Access to 290+ PDFs of Company Profiles
  • Round-the-clock Email and Phone Assistance
  • Dashboard Usage and Trends
  • Renewal & Upgrade Assistance
  • Assessing Customization Options and Alerts for New Reports
$10788
Buy Now
*Taxes/Fees, if applicable will be added during checkout. All prices in USD

Why TNR The Niche Research?

  • Unwavering Commitment to Excellence

  • Veteran Team of Researchers

  • Accurate and Timely Insights

  • Ethical Practices and Customized Service

  • Uninterrupted Availability Around the Clock

Scroll to Top