Global Ultra-Thin Glass Market Insights, Growth, Share, Size: By Thickness, By Manufacturing Process, By Application, By Region & Segmental Forecast, 2023-2031, Comparative Analysis and Trends
- Industry: Chemicals & Materials
- Report ID: TNR-110-980
- Number of Pages: 420
- Table/Charts : Yes
- December, 2023
- Base Year : 2024
- No. of Companies : 12+
- No. of Countries : 29
- Views : 10184
- Covid Impact Covered: Yes
- War Impact Covered: Yes
- Formats : PDF, Excel, PPT
Global Ultra-Thin Glass Market Valued USD 12.2 Bn in 2022, with an Estimated CAGR of 10.8% (2023- 2031)
Ultra-thin glass refers to glass sheets or substrates that are exceptionally thin compared to standard glass materials. While the exact thickness that qualifies as “ultra-thin” can vary depending on context and industry, these sheets are typically much thinner than traditional glass. The use of ultra-thin glass has become increasingly important in industries like electronics, renewable energy, and automotive, where lightweight, durable, and flexible materials are in demand to meet the evolving needs of modern technology and design.
Global Ultra-Thin Glass Market Revenue & Forecast, (US$ Million), 2015 – 2031

Developments in the Global Ultra-Thin Glass Market
Several businesses have been involved in the research and manufacture of ultra-thin glass, Corning, the well-known glass and materials science company, and Schott AG, which is also well-known to consumers due to smartphones, have both been involved in the study and fabrication of ultra-thin glass. Schott says that after processing, its latest ultra-thin glass (UTG) can bend radii as tiny as 1 mm. This glass, which is thinner than a human hair, is said to be able to withstand 300,000 bends before shattering.
Furthermore in 2022, Samsung stated that their ultra-thin glass is now one-third the thickness of human hair. Samsung’s Galaxy Z Fold and Galaxy Z Flip smartphone series utilize UTG technology. These devices employ foldable displays that rely on UTG’s flexibility and robustness to withstand repeated folding and unfolding without compromising screen quality. Thus with the advancements the global ultra-thin glass market will upsurge during the forecast period.
 The preferred thickness for ultra-thin glass can vary significantly depending on the specific application and industry requirements. Typically, ultra-thin glass in the range of 0.1 to 0.3 millimeters (100 to 300 micrometers) is preferred as thinner glass allows for lighter and more flexible devices. Advancements in glass manufacturing technology continue to enable the production of thinner and more durable ultra-thin glass, expanding its range of applications across various industries. Therefore, the choice of thickness is often tailored to the unique needs of each application and is subject to ongoing developments in materials science and technology.
Automotive segment is anticipated to be the fastest growing segment in the global ultra-thin glass market during the forecast period 2023-2031. Due the rise in demand for electric vehicles and its light weight designing, ultra-thin glass is gaining huge demand in the last few years. In addition some advanced vehicles feature HUDs that project information onto the windshield wherein ultra-thin glass enhances the optical quality of these displays, ensuring information is easily visible to the driver. Thus as the automotive design and manufacturing continue to evolve, ultra-thin glass is expected to play an increasingly important role in shaping the vehicles of the future.
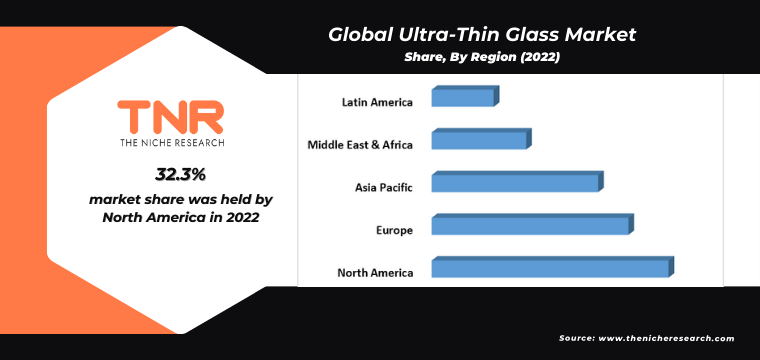
North America dominated that ultra-thin glass market in 2022, the growth of the ultra-thin glass market in North America is influenced by its role in various industries, including consumer electronics, automotive, renewable energy, aerospace, and more. As these industries continue to evolve and prioritize lightweight materials, advanced technologies, and sustainability, the demand for ultra-thin glass is expected to continue its upward trajectory in the region. Additionally, the presence of well-established glass manufacturers and technology companies in North America is contributing to the competition and innovation in the ultra-thin glass market, further driving growth.
Competitive Landscape of Global Ultra-Thin Glass Market
The global ultra-thin glass market is competitive, with intense competition among leading competitors striving for market dominance. These companies compete on characteristics such as technology innovation, industry experience, scalability, cost-effectiveness, and the capacity to supply customised solutions. Emerging trends, changing customer requirements, strategic alliances, and acquisitions all have an impact on the competitive environment, making it a dynamic and developing market.
List of major players in global ultra-thin glass market are:
- AGC Inc.
- Central Glass Co., Ltd.
- Corning Incorporated
- JNS Glass & Coatings
- Nippon Electric Glass Co.,Ltd.
- Präzisions Glas & Optik GmbH
- RIDER GLASS COMPANY LIMITED
- SCHOTT Poland Sp.z o.o.
- Other market participants
Global Ultra-Thin Glass Market Report Coverage
| Report Specifications | Details |
| Market Revenue in 2022 | US$ 12.2 Billion |
| Market Size Forecast by 2031 | US$ 32.8 Billion |
| Growth Rate (CAGR) | 10.8% |
| Historic Data | 2015 – 2021 |
| Base Year for Estimation | 2022 |
| Forecast Period | 2023 – 2031 |
| Report Inclusions | Market Size & Estimates, Market Dynamics, Competitive Scenario, Trends, Growth Factors, Market Determinants, Key Investment Segmentation, Product/Service/Solutions Benchmarking |
| Segments Covered | By Thickness, By Manufacturing Process, By Application |
| Regions Covered | North America, Europe, Asia Pacific, Middle East & Africa, Latin America |
| Countries Covered | U.S., Canada, Mexico, Rest of North America, France, The UK, Spain, Germany, Italy, Nordic Countries (Denmark, Finland, Iceland, Sweden, Norway), Benelux Union (Belgium, The Netherlands, Luxembourg), Rest of Europe, China, Japan, India, New Zealand, Australia, South Korea, Southeast Asia (Indonesia, Thailand, Malaysia, Singapore, Rest of Southeast Asia), Rest of Asia Pacific, Saudi Arabia, UAE, Egypt, Kuwait, South Africa, Rest of Middle East & Africa, Brazil, Argentina, Rest of Latin America |
| Key Players | AGC Inc., Central Glass Co., Ltd., Corning Incorporated, JNS Glass & Coatings, Nippon Electric Glass Co.,Ltd., Präzisions Glas & Optik GmbH, RIDER GLASS COMPANY LIMITED, SCHOTT Poland Sp.z o.o., Other Industry Participants |
| Customization Scope | Customization allows for the inclusion/modification of content pertaining to geographical regions, countries, and specific market segments. |
| Pricing & Procurement Options | Explore purchase options tailored to your specific research requirements |
| Contact Details | Consult With Our Expert
United States: +1 302-232-5106 United Kingdom: +447537105080 South Korea: +82-808- 703-126 Japan: +81 Saudi Arabia: + E-mail: askanexpert@thenicheresearh.com
|
Global Ultra-Thin Glass Market
By Thickness
- Less than 0.3mm
- 0.3mm – 1mm
- 1mm – 2mm
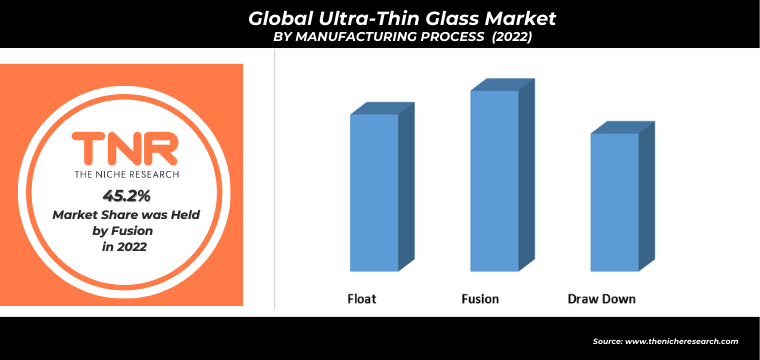
By Manufacturing Process
- Float
- Fusion
- Draw Down
By Application
- Consumer Electronics
- MedicalUltra-Thin Glass Market
- Automotive
- Aviation
- Solar Energy
- Others
By Region
- North America (U.S., Canada, Mexico, Rest of North America)
- Europe (France, The UK, Spain, Germany, Italy, Nordic Countries (Denmark, Finland, Iceland, Sweden, Norway), Benelux Union (Belgium, The Netherlands, Luxembourg), Rest of Europe)
- Asia Pacific (China, Japan, India, New Zealand, Australia, South Korea, Southeast Asia (Indonesia, Thailand, Malaysia, Singapore, Rest of Southeast Asia), Rest of Asia Pacific)
- Middle East & Africa (Saudi Arabia, UAE, Egypt, Kuwait, South Africa, Rest of Middle East & Africa)
- Latin America (Brazil, Argentina, Rest of Latin America)
Report Coverage and Deliverables
Table of Contents
Note: This ToC is tentative and can be changed according to the research study conducted during the course of report completion.
**Exclusive for Multi-User and Enterprise User.
Global Ultra-Thin Glass Market Segmentation
By Thickness
By Manufacturing Process
By Application
By Region
**Note: The report covers cross-segmentation analysis by region further into countries
The Niche Research approach encompasses both primary and secondary research methods to provide comprehensive insights. While primary research is the cornerstone of our studies, we also incorporate secondary research sources such as company annual reports, premium industry databases, press releases, industry journals, and white papers.
Within our primary research, we actively engage with various industry stakeholders, conducting paid interviews and surveys. Our meticulous analysis extends to every market participant in major countries, allowing us to thoroughly examine their portfolios, calculate market shares, and segment revenues.
Our data collection primarily focuses on individual countries within our research scope, enabling us to estimate regional market sizes. Typically, we employ a bottom-up approach, meticulously tracking trends in different countries. We analyze growth drivers, constraints, technological innovations, and opportunities for each country, ultimately arriving at regional figures.Our process begins by examining the growth prospects of each country. Building upon these insights, we project growth and trends for the entire region. Finally, we utilize our proprietary model to refine estimations and forecasts.
Our data validation standards are integral to ensuring the reliability and accuracy of our research findings. Here’s a breakdown of our data validation processes and the stakeholders we engage with during our primary research:
- Supply Side Analysis: We initiate a supply side analysis by directly contacting market participants, through telephonic interviews and questionnaires containing both open-ended and close-ended questions. We gather information on their portfolios, segment revenues, developments, and growth strategies.
- Demand Side Analysis: To gain insights into adoption trends and consumer preferences, we reach out to target customers and users (non-vendors). This information forms a vital part of the qualitative analysis section of our reports, covering market dynamics, adoption trends, consumer behavior, spending patterns, and other related aspects.
- Consultant Insights: We tap into the expertise of our partner consultants from around the world to obtain their unique viewpoints and perspectives. Their insights contribute to a well-rounded understanding of the markets under investigation.
- In-House Validation: To ensure data accuracy and reliability, we conduct cross-validation of data points and information through our in-house team of consultants and utilize advanced data modeling tools for thorough verification.
The forecasts we provide are based on a comprehensive assessment of various factors, including:
- Market Trends and Past Performance (Last Five Years): We accurately analyze market trends and performance data from preceding five years to identify historical patterns and understand the market’s evolution.
- Historical Performance and Growth of Market Participants: We assess the historical performance and growth trajectories of key market participants. This analysis provides insights into the competitive landscape and individual company strategies.
- Market Determinants Impact Analysis (Next Eight Years): We conduct a rigorous analysis of the factors that are projected to influence the market over the next eight years. This includes assessing both internal and external determinants that can shape market dynamics.
- Drivers and Challenges for the Forecast Period:Identify the factors expected to drive market growth during the forecast period, as well as the challenges that the industry may face. This analysis aids in deriving an accurate growth rate projection.
- New Acquisitions, Collaborations, or Partnerships: We keep a close watch on any new acquisitions, collaborations, or partnerships within the industry. These developments can have a significant impact on market dynamics and competitiveness.
- Macro and Micro Factors Analysis:A thorough examination of both macro-level factors (e.g., economic trends, regulatory changes) and micro-level factors (e.g., technological advancements, consumer preferences) that may influence the market during the forecast period.
- End-User Sentiment Analysis: To understand the market from the end-user perspective, we conduct sentiment analysis. This involves assessing the sentiment, preferences, and feedback of the end-users, which can provide valuable insights into market trends.
- Perspective of Primary Participants: Insights gathered directly from primary research participants play a crucial role in shaping our forecasts. Their perspectives and experiences provide valuable qualitative data.
- Year-on-Year Growth Trend: We utilize a year-on-year growth trend based on historical market growth and expected future trends. This helps in formulating our growth projections, aligning them with the market’s historical performance.
Research process adopted by TNR involves multiple stages, including data collection, validation, quality checks, and presentation. It’s crucial that the data and information we provide add value to your existing market understanding and expertise. We have also established partnerships with business consulting, research, and survey organizations across regions and globally to collaborate on regional analysis and data validation, ensuring the highest level of accuracy and reliability in our reports.