Global Virtual Fitting Rooms Market Insights, Growth, Share, Size: By Offerings, By Application, By End Users, By Region & Segmental Forecast, 2023-2031, Comparative Analysis and Trends

  • Industry: Technology
  • Report ID: TNR-110-1004
  • Number of Pages: 420
  • Table/Charts : Yes
  • November, 2023
  • Base Year : 2024
  • No. of Companies : 14+
  • No. of Countries : 29
  • Views : 10103
  • Covid Impact Covered: Yes
  • War Impact Covered: Yes
  • Formats : PDF, Excel, PPT

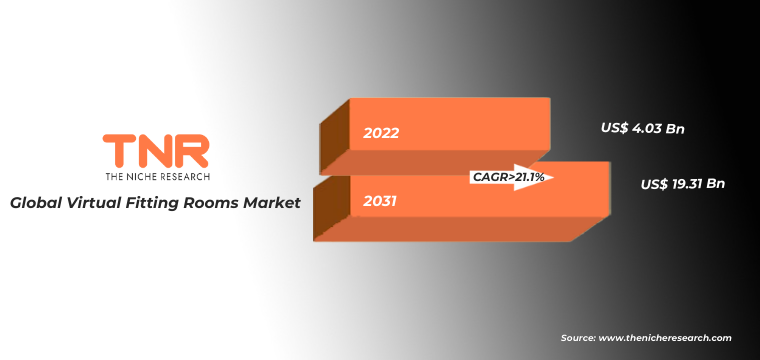
Global Virtual Fitting Rooms Market was Valued USD 4.03 Bn in 2022, with estimated CAGR of 21.1% (2023-2031).

A virtual fitting room is a digital counterpart of an in-store dressing room in which buyers may digitally try on a product to see how it will appear on their bodies and assess elements such as colour, pattern, and style before purchase. There are several virtual try-on alternatives available today. These are frequently based on a mix of artificial intelligence, computer vision, and augmented reality.

Innovative scaling solutions have emerged as a result of the rapid technology improvements during the last decade. In addition to addressing consumer size concerns, these solutions are assisting brands in meeting inclusiveness and sustainability goals while generating increased business performance.

Global Virtual Fitting Rooms Market Revenue & Forecast, (US$ Million), 2015 – 2031

Factors Supporting the Growth of the Global Virtual Fitting Rooms Market

The ever-increasing amount of returns is one of the most serious issues confronting fashion merchants. According to Shopify, 30% of all eCommerce returns are due to the goods being too small in size, while another 22% are due to customers buying an item in an incorrect size. By offering an online trial room for clothing, retail establishments may help to solve the problem of bad fit. Virtual fitting technology may help organizations gain data about their customers and the items they buy, but it can also help brands drive conversions.

Virtual fitting rooms, such as 3DLOOK’s YourFit, provide merchants with a wealth of anonymised data by using body scanning technology to retrieve each customer’s unique body measurements. Retailers may use this information to fine-tune their dragging rules, increase distribution, customize marketing efforts, and create future items according on the requirements and tastes of their most loyal consumers.

Furthermore Covid-19 pandemic has positively impacted the global virtual fitting rooms market. In response to increasing concerns over Covid-19 variations, merchants have implemented numerous safety precautions in most brick-and-mortar stores and are considering tech-driven dressing to quickly replace the fitting room experience, which was formerly the key selling feature of in-person businesses.

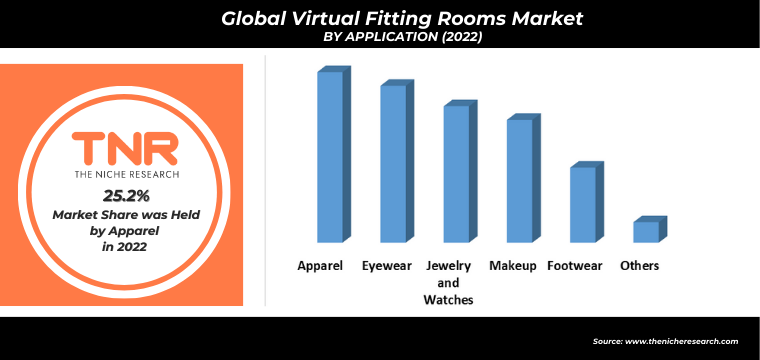
Virtual fitting rooms have received a lot of interest in the apparel industry because of their potential to change the way people shop for clothes online. According to the survey, the three largest potential for fashion firms are digital, sustainability, and customer involvement, which represent the demands of millennial consumers. Retailers are looking forward to achieve all of these demands by implementing 3D virtual fitting room software. According to my company’s internal research, merchants have witnessed an increase in average order value of more than 23% when using AI-powered style. Fashion businesses can leverage vast amount of client data with virtual changing rooms, allowing them to better understand their customers.

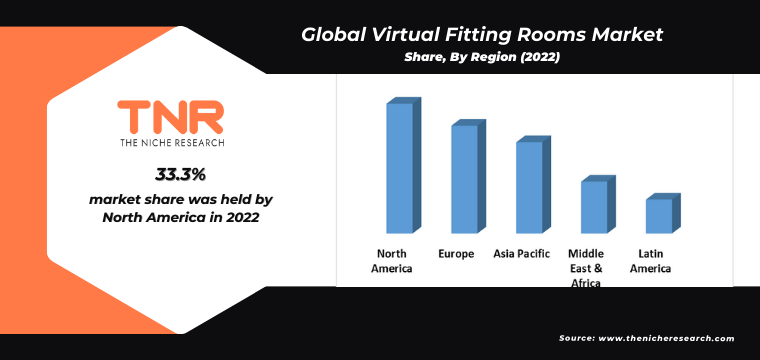
North America had the highest share in the virtual fitting rooms market in 2022. As online shopping has become more common, consumers’ expectations have evolved. They seek experiences that replicate or even improve upon the traditional in-store shopping experience. Several U.S.-based retailers and tech companies have been early adopters of virtual fitting room technology. As online shopping has become more common, consumers’ expectations have evolved. They seek experiences that replicate or even improve upon the traditional in-store shopping experience. Virtual fitting rooms aim to bridge this gap by allowing customers to virtually try on clothing, leading to higher customer satisfaction and fewer returns due to improper fit.

Competitive Landscape

The report offers extensive research on the key players in this global virtual fitting rooms market and details on the competitiveness of these players. Key business strategies such as mergers and acquisitions (M&A), affiliations, collaborations, and contracts adopted by these major market participants are also recognized and analyzed in the report. For each company, the report studies their global presence, competitors, service offerings and specification amongst others.

Key competitors in the global virtual fitting rooms market are

  • 3DLOOK INC.
  • AstraFit
  • FXGear Inc
  • Mad Street Den Inc. (Vue.ai)
  • Magic Mirror
  • Perfitly
  • RoboSize LTD.
  • SenseMi DMCC – VIUBOX
  • Sizebay
  • Style.me
  • TEXEL
  • triMirror
  • True Fit Corporation
  • VIRTUAL ON LTD
  • Zugara, Inc
  • Other Industry Participants

Global Virtual Fitting Rooms Market Report Coverage

Report Specifications Details
Market Revenue in 2022 US$ 4.03 Billion
Market Size Forecast by 2031 US$ 19.31 Billion
Growth Rate (CAGR) 21.1%
Historic Data 2015 – 2021
Base Year for Estimation 2022
Forecast Period 2023 – 2031
Report Inclusions Market Size & Estimates, Market Dynamics, Competitive Scenario, Trends, Growth Factors, Market Determinants, Key Investment Segmentation, Product/Service/Solutions Benchmarking
Segments Covered By Offerings, By Application, By End Users
Regions Covered North America, Europe, Asia Pacific, Middle East & Africa, Latin America
Countries Covered U.S., Canada, Mexico, Rest of North America,  France, The UK, Spain, Germany, Italy, Nordic Countries (Denmark, Finland, Iceland, Sweden, Norway), Benelux Union (Belgium, The Netherlands, Luxembourg), Rest of Europe,  China, Japan, India, New Zealand, Australia, South Korea, Southeast Asia (Indonesia, Thailand, Malaysia, Singapore, Rest of Southeast Asia), Rest of Asia Pacific,  Saudi Arabia, UAE, Egypt, Kuwait, South Africa, Rest of Middle East & Africa,  Brazil, Argentina, Rest of Latin America
Key Players 3DLOOK INC., AstraFit, FXGear Inc, Mad Street Den Inc. (Vue.ai), Magic Mirror, Perfitly, RoboSize LTD., SenseMi DMCC – VIUBOX, Sizebay, Style.me, TEXEL, triMirror, True Fit Corporation, VIRTUAL ON LTD, Zugara, Inc, Other Industry Participants
Customization Scope Customization allows for the inclusion/modification of content pertaining to geographical regions, countries, and specific market segments.
Pricing & Procurement Options Explore purchase options tailored to your specific research requirements
Contact Details Consult With Our Expert

Japan (Toll-Free): – +81 663-386-8111

South Korea (Toll-Free): – +82-808- 703-126

Saudi Arabia (Toll-Free): – +966 800 850 1643

United States: +1 302-232-5106

United Kingdom: +447537105080

E-mail:  askanexpert@thenicheresearch.com


Global Virtual Fitting Rooms Market

By Offerings

  • Hardware
    • Prefabricated
    • Customized
  • Software
    • Integrated
    • Standalone
  • Services

By Application

  • Apparel
  • Eyewear
  • Jewelry and Watches
  • Makeup
  • Footwear
  • Others

By End Users

  • Brick and Mortar Stores
  • Virtual Stores

By Region

  • North America (U.S., Canada, Mexico, Rest of North America)
  • Europe (France, The UK, Spain, Germany, Italy, Nordic Countries (Denmark, Finland, Iceland, Sweden, Norway), Benelux Union (Belgium, The Netherlands, Luxembourg), Rest of Europe)
  • Asia Pacific (China, Japan, India, New Zealand, Australia, South Korea, Southeast Asia (Indonesia, Thailand, Malaysia, Singapore, Rest of Southeast Asia), Rest of Asia Pacific)
  • Middle East & Africa (Saudi Arabia, UAE, Egypt, Kuwait, South Africa, Rest of Middle East & Africa)
  • Latin America (Brazil, Argentina, Rest of Latin America)

Report Coverage and Deliverables: 

Common


Table of Contents

.

1.Market Scope
1.1.Market Segmentation
1.2.Years Considered
1.2.1.Historic Years: 2015 – 2021
1.2.2.Base Year: 2022
1.2.3.Forecast Years: 2023 – 2031
2.Key Target Audiences
3.Research Methodology
3.1.Primary Research
3.1.1.Research Questionnaire
3.1.2.Global Percentage Breakdown
3.1.3.Primary Interviews: Key Opinion Leaders (KOLs)
3.2.Secondary Research
3.2.1.Paid Databases
3.2.2.Secondary Sources
3.3.Market Size Estimates
3.3.1.Top-Down Approach
3.3.2.Bottom-Up Approach
3.4.Data Triangulation Methodology
3.5.Research Assumptions
4.Recommendations and Insights from TNR’s Perspective**
5.Holistic Overview of Virtual Fitting Rooms Market
6.Market Synopsis: Virtual Fitting Rooms Market
7.Virtual Fitting Rooms Market Analysis: Qualitative Perspective
7.1.Introduction
7.1.1.Product Definition
7.1.2.Industry Development
7.2.Market Dynamics
7.2.1.Drivers
7.2.2.Restraints
7.2.3.Opportunities
7.3.Trends in Virtual Fitting Rooms Market
7.4.Market Determinants Radar Chart
7.5.Macro-Economic and Micro-Economic Indicators: Virtual Fitting Rooms Market
7.6.Porter’s Five Force Analysis
7.7.Impact of Covid-19 on Virtual Fitting Rooms Market
8.Global Virtual Fitting Rooms Market Analysis and Forecasts, 2023 – 2031
8.1.Overview
8.1.1.Global Virtual Fitting Rooms Market Revenue (US$ Mn)
8.2.Global Virtual Fitting Rooms Market Revenue (US$ Mn) and Forecasts, By Offerings
8.2.1.Hardware (Definition, Market Estimation and Penetration, 2015 – 2022, Market Estimation (2015 – 2022), Market Forecast (2023 – 2031), Compound Annual Growth Rate (CAGR), Regional Bifurcation (North America, Europe, Asia Pacific, Middle East and Africa, Latin America) and Information on Prefabricated , Customized )
8.2.1.1.Prefabricated
8.2.1.2.Customized
8.2.2.Software (Definition, Market Estimation and Penetration, 2015 – 2022, Market Estimation (2015 – 2022), Market Forecast (2023 – 2031), Compound Annual Growth Rate (CAGR), Regional Bifurcation (North America, Europe, Asia Pacific, Middle East and Africa, Latin America) and Information on Integrated , Standalone )
8.2.2.1.Integrated
8.2.2.2.Standalone
8.2.3.Services
8.2.3.1.Definition
8.2.3.2.Market Estimation and Penetration, 2015 – 2022
8.2.3.3.Market Forecast, 2023 – 2031
8.2.3.4.Compound Annual Growth Rate (CAGR)
8.2.3.5.Regional Bifurcation
8.2.3.5.1.North America
8.2.3.5.1.1.Market Estimation, 2015 – 2022
8.2.3.5.1.2.Market Forecast, 2023 – 2031
8.2.3.5.2.Europe
8.2.3.5.2.1.Market Estimation, 2015 – 2022
8.2.3.5.2.2.Market Forecast, 2023 – 2031
8.2.3.5.3.Asia Pacific
8.2.3.5.3.1.Market Estimation, 2015 – 2022
8.2.3.5.3.2.Market Forecast, 2023 – 2031
8.2.3.5.4.Middle East and Africa
8.2.3.5.4.1.Market Estimation, 2015 – 2022
8.2.3.5.4.2.Market Forecast, 2023 – 2031
8.2.3.5.5.Latin America
8.2.3.5.5.1.Market Estimation, 2015 – 2022
8.2.3.5.5.2.Market Forecast, 2023 – 2031
8.3.Key Segment for Channeling Investments
8.3.1.By Offerings
9.Global Virtual Fitting Rooms Market Analysis and Forecasts, 2023 – 2031
9.1.Overview
9.2.Global Virtual Fitting Rooms Market Revenue (US$ Mn) and Forecasts, By Application
9.2.1.Apparel
9.2.1.1.Definition
9.2.1.2.Market Estimation and Penetration, 2015 – 2022
9.2.1.3.Market Forecast, 2023 – 2031
9.2.1.4.Compound Annual Growth Rate (CAGR)
9.2.1.5.Regional Bifurcation
9.2.1.5.1.North America
9.2.1.5.1.1.Market Estimation, 2015 – 2022
9.2.1.5.1.2.Market Forecast, 2023 – 2031
9.2.1.5.2.Europe
9.2.1.5.2.1.Market Estimation, 2015 – 2022
9.2.1.5.2.2.Market Forecast, 2023 – 2031
9.2.1.5.3.Asia Pacific
9.2.1.5.3.1.Market Estimation, 2015 – 2022
9.2.1.5.3.2.Market Forecast, 2023 – 2031
9.2.1.5.4.Middle East and Africa
9.2.1.5.4.1.Market Estimation, 2015 – 2022
9.2.1.5.4.2.Market Forecast, 2023 – 2031
9.2.1.5.5.Latin America
9.2.1.5.5.1.Market Estimation, 2015 – 2022
9.2.1.5.5.2.Market Forecast, 2023 – 2031
9.2.2.Jewelry and Watches
9.2.2.1.Definition
9.2.2.2.Market Estimation and Penetration, 2015 – 2022
9.2.2.3.Market Forecast, 2023 – 2031
9.2.2.4.Compound Annual Growth Rate (CAGR)
9.2.2.5.Regional Bifurcation
9.2.2.5.1.North America
9.2.2.5.1.1.Market Estimation, 2015 – 2022
9.2.2.5.1.2.Market Forecast, 2023 – 2031
9.2.2.5.2.Europe
9.2.2.5.2.1.Market Estimation, 2015 – 2022
9.2.2.5.2.2.Market Forecast, 2023 – 2031
9.2.2.5.3.Asia Pacific
9.2.2.5.3.1.Market Estimation, 2015 – 2022
9.2.2.5.3.2.Market Forecast, 2023 – 2031
9.2.2.5.4.Middle East and Africa
9.2.2.5.4.1.Market Estimation, 2015 – 2022
9.2.2.5.4.2.Market Forecast, 2023 – 2031
9.2.2.5.5.Latin America
9.2.2.5.5.1.Market Estimation, 2015 – 2022
9.2.2.5.5.2.Market Forecast, 2023 – 2031
9.2.3.Jewelry and Watches
9.2.3.1.Definition
9.2.3.2.Market Estimation and Penetration, 2015 – 2022
9.2.3.3.Market Forecast, 2023 – 2031
9.2.3.4.Compound Annual Growth Rate (CAGR)
9.2.3.5.Regional Bifurcation
9.2.3.5.1.North America
9.2.3.5.1.1.Market Estimation, 2015 – 2022
9.2.3.5.1.2.Market Forecast, 2023 – 2031
9.2.3.5.2.Europe
9.2.3.5.2.1.Market Estimation, 2015 – 2022
9.2.3.5.2.2.Market Forecast, 2023 – 2031
9.2.3.5.3.Asia Pacific
9.2.3.5.3.1.Market Estimation, 2015 – 2022
9.2.3.5.3.2.Market Forecast, 2023 – 2031
9.2.3.5.4.Middle East and Africa
9.2.3.5.4.1.Market Estimation, 2015 – 2022
9.2.3.5.4.2.Market Forecast, 2023 – 2031
9.2.3.5.5.Latin America
9.2.3.5.5.1.Market Estimation, 2015 – 2022
9.2.3.5.5.2.Market Forecast, 2023 – 2031
9.2.4.Makeup
9.2.4.1.Definition
9.2.4.2.Market Estimation and Penetration, 2015 – 2022
9.2.4.3.Market Forecast, 2023 – 2031
9.2.4.4.Compound Annual Growth Rate (CAGR)
9.2.4.5.Regional Bifurcation
9.2.4.5.1.North America
9.2.4.5.1.1.Market Estimation, 2015 – 2022
9.2.4.5.1.2.Market Forecast, 2023 – 2031
9.2.4.5.2.Europe
9.2.4.5.2.1.Market Estimation, 2015 – 2022
9.2.4.5.2.2.Market Forecast, 2023 – 2031
9.2.4.5.3.Asia Pacific
9.2.4.5.3.1.Market Estimation, 2015 – 2022
9.2.4.5.3.2.Market Forecast, 2023 – 2031
9.2.4.5.4.Middle East and Africa
9.2.4.5.4.1.Market Estimation, 2015 – 2022
9.2.4.5.4.2.Market Forecast, 2023 – 2031
9.2.4.5.5.Latin America
9.2.4.5.5.1.Market Estimation, 2015 – 2022
9.2.4.5.5.2.Market Forecast, 2023 – 2031
9.2.5.Footwear
9.2.5.1.Definition
9.2.5.2.Market Estimation and Penetration, 2015 – 2022
9.2.5.3.Market Forecast, 2023 – 2031
9.2.5.4.Compound Annual Growth Rate (CAGR)
9.2.5.5.Regional Bifurcation
9.2.5.5.1.North America
9.2.5.5.1.1.Market Estimation, 2015 – 2022
9.2.5.5.1.2.Market Forecast, 2023 – 2031
9.2.5.5.2.Europe
9.2.5.5.2.1.Market Estimation, 2015 – 2022
9.2.5.5.2.2.Market Forecast, 2023 – 2031
9.2.5.5.3.Asia Pacific
9.2.5.5.3.1.Market Estimation, 2015 – 2022
9.2.5.5.3.2.Market Forecast, 2023 – 2031
9.2.5.5.4.Middle East and Africa
9.2.5.5.4.1.Market Estimation, 2015 – 2022
9.2.5.5.4.2.Market Forecast, 2023 – 2031
9.2.5.5.5.Latin America
9.2.5.5.5.1.Market Estimation, 2015 – 2022
9.2.5.5.5.2.Market Forecast, 2023 – 2031
9.2.6.Others
9.2.6.1.Definition
9.2.6.2.Market Estimation and Penetration, 2015 – 2022
9.2.6.3.Market Forecast, 2023 – 2031
9.2.6.4.Compound Annual Growth Rate (CAGR)
9.2.6.5.Regional Bifurcation
9.2.6.5.1.North America
9.2.6.5.1.1.Market Estimation, 2015 – 2022
9.2.6.5.1.2.Market Forecast, 2023 – 2031
9.2.6.5.2.Europe
9.2.6.5.2.1.Market Estimation, 2015 – 2022
9.2.6.5.2.2.Market Forecast, 2023 – 2031
9.2.6.5.3.Asia Pacific
9.2.6.5.3.1.Market Estimation, 2015 – 2022
9.2.6.5.3.2.Market Forecast, 2023 – 2031
9.2.6.5.4.Middle East and Africa
9.2.6.5.4.1.Market Estimation, 2015 – 2022
9.2.6.5.4.2.Market Forecast, 2023 – 2031
9.2.6.5.5.Latin America
9.2.6.5.5.1.Market Estimation, 2015 – 2022
9.2.6.5.5.2.Market Forecast, 2023 – 2031
9.3.Key Segment for Channeling Investments
9.3.1.By Application
10.Global Virtual Fitting Rooms Market Analysis and Forecasts, 2023 – 2031
10.1.Overview
10.2.Global Virtual Fitting Rooms Market Revenue (US$ Mn) and Forecasts, By End Users
10.2.1.Brick and Mortar Stores
10.2.1.1.Definition
10.2.1.2.Market Estimation and Penetration, 2015 – 2022
10.2.1.3.Market Forecast, 2023 – 2031
10.2.1.4.Compound Annual Growth Rate (CAGR)
10.2.1.5.Regional Bifurcation
10.2.1.5.1.North America
10.2.1.5.1.1.Market Estimation, 2015 – 2022
10.2.1.5.1.2.Market Forecast, 2023 – 2031
10.2.1.5.2.Europe
10.2.1.5.2.1.Market Estimation, 2015 – 2022
10.2.1.5.2.2.Market Forecast, 2023 – 2031
10.2.1.5.3.Asia Pacific
10.2.1.5.3.1.Market Estimation, 2015 – 2022
10.2.1.5.3.2.Market Forecast, 2023 – 2031
10.2.1.5.4.Middle East and Africa
10.2.1.5.4.1.Market Estimation, 2015 – 2022
10.2.1.5.4.2.Market Forecast, 2023 – 2031
10.2.1.5.5.Latin America
10.2.1.5.5.1.Market Estimation, 2015 – 2022
10.2.1.5.5.2.Market Forecast, 2023 – 2031
10.2.2.Virtual Stores
10.2.2.1.Definition
10.2.2.2.Market Estimation and Penetration, 2015 – 2022
10.2.2.3.Market Forecast, 2023 – 2031
10.2.2.4.Compound Annual Growth Rate (CAGR)
10.2.2.5.Regional Bifurcation
10.2.2.5.1.North America
10.2.2.5.1.1.Market Estimation, 2015 – 2022
10.2.2.5.1.2.Market Forecast, 2023 – 2031
10.2.2.5.2.Europe
10.2.2.5.2.1.Market Estimation, 2015 – 2022
10.2.2.5.2.2.Market Forecast, 2023 – 2031
10.2.2.5.3.Asia Pacific
10.2.2.5.3.1.Market Estimation, 2015 – 2022
10.2.2.5.3.2.Market Forecast, 2023 – 2031
10.2.2.5.4.Middle East and Africa
10.2.2.5.4.1.Market Estimation, 2015 – 2022
10.2.2.5.4.2.Market Forecast, 2023 – 2031
10.2.2.5.5.Latin America
10.2.2.5.5.1.Market Estimation, 2015 – 2022
10.2.2.5.5.2.Market Forecast, 2023 – 2031
10.3.Key Segment for Channeling Investments
10.3.1.By End Users
11.North America Virtual Fitting Rooms Market Analysis and Forecasts, 2023 – 2031
11.1.Overview
11.1.1.North America Virtual Fitting Rooms Market Revenue (US$ Mn)
11.2.North America Virtual Fitting Rooms Market Revenue (US$ Mn) and Forecasts, By Offerings
11.2.1.Hardware
11.2.1.1.Prefabricated
11.2.1.2.Customized
11.2.2.Software
11.2.2.1.Integrated
11.2.2.2.Standalone
11.2.3.Services
11.3.North America Virtual Fitting Rooms Market Revenue (US$ Mn) and Forecasts, By Application
11.3.1.Apparel
11.3.2.Jewelry and Watches
11.3.3.Jewelry and Watches
11.3.4.Makeup
11.3.5.Footwear
11.3.6.Others
11.4.North America Virtual Fitting Rooms Market Revenue (US$ Mn) and Forecasts, By End Users
11.4.1.Brick and Mortar Stores
11.4.2.Virtual Stores
11.5.North America Virtual Fitting Rooms Market Revenue (US$ Mn) and Forecasts, By Country
11.5.1.U.S
11.5.1.1.U.S Virtual Fitting Rooms Market Revenue (US$ Mn) and Forecasts, By Offerings
11.5.1.1.1.Hardware
11.5.1.1.1.1.Prefabricated
11.5.1.1.1.2.Customized
11.5.1.1.2.Software
11.5.1.1.2.1.Integrated
11.5.1.1.2.2.Standalone
11.5.1.1.3.Services
11.5.1.2.U.S Virtual Fitting Rooms Market Revenue (US$ Mn) and Forecasts, By Application
11.5.1.2.1.Apparel
11.5.1.2.2.Jewelry and Watches
11.5.1.2.3.Jewelry and Watches
11.5.1.2.4.Makeup
11.5.1.2.5.Footwear
11.5.1.2.6.Others
11.5.1.3.U.S Virtual Fitting Rooms Market Revenue (US$ Mn) and Forecasts, By End Users
11.5.1.3.1.Brick and Mortar Stores
11.5.1.3.2.Virtual Stores
11.5.2.Canada
11.5.2.1.Canada Virtual Fitting Rooms Market Revenue (US$ Mn) and Forecasts, By Offerings
11.5.2.1.1.Hardware
11.5.2.1.1.1.Prefabricated
11.5.2.1.1.2.Customized
11.5.2.1.2.Software
11.5.2.1.2.1.Integrated
11.5.2.1.2.2.Standalone
11.5.2.1.3.Services
11.5.2.2.Canada Virtual Fitting Rooms Market Revenue (US$ Mn) and Forecasts, By Application
11.5.2.2.1.Apparel
11.5.2.2.2.Jewelry and Watches
11.5.2.2.3.Jewelry and Watches
11.5.2.2.4.Makeup
11.5.2.2.5.Footwear
11.5.2.2.6.Others
11.5.2.3.Canada Virtual Fitting Rooms Market Revenue (US$ Mn) and Forecasts, By End Users
11.5.2.3.1.Brick and Mortar Stores
11.5.2.3.2.Virtual Stores
11.5.3.Mexico
11.5.3.1.Mexico Virtual Fitting Rooms Market Revenue (US$ Mn) and Forecasts, By Offerings
11.5.3.1.1.Hardware
11.5.3.1.1.1.Prefabricated
11.5.3.1.1.2.Customized
11.5.3.1.2.Software
11.5.3.1.2.1.Integrated
11.5.3.1.2.2.Standalone
11.5.3.1.3.Services
11.5.3.2.Mexico Virtual Fitting Rooms Market Revenue (US$ Mn) and Forecasts, By Application
11.5.3.2.1.Apparel
11.5.3.2.2.Jewelry and Watches
11.5.3.2.3.Jewelry and Watches
11.5.3.2.4.Makeup
11.5.3.2.5.Footwear
11.5.3.2.6.Others
11.5.3.3.Mexico Virtual Fitting Rooms Market Revenue (US$ Mn) and Forecasts, By End Users
11.5.3.3.1.Brick and Mortar Stores
11.5.3.3.2.Virtual Stores
11.5.4.Rest of North America
11.5.4.1.Rest of North America Virtual Fitting Rooms Market Revenue (US$ Mn) and Forecasts, By Offerings
11.5.4.1.1.Hardware
11.5.4.1.1.1.Prefabricated
11.5.4.1.1.2.Customized
11.5.4.1.2.Software
11.5.4.1.2.1.Integrated
11.5.4.1.2.2.Standalone
11.5.4.1.3.Services
11.5.4.2.Rest of North America Virtual Fitting Rooms Market Revenue (US$ Mn) and Forecasts, By Application
11.5.4.2.1.Apparel
11.5.4.2.2.Jewelry and Watches
11.5.4.2.3.Jewelry and Watches
11.5.4.2.4.Makeup
11.5.4.2.5.Footwear
11.5.4.2.6.Others
11.5.4.3.Rest of North America Virtual Fitting Rooms Market Revenue (US$ Mn) and Forecasts, By End Users
11.5.4.3.1.Brick and Mortar Stores
11.5.4.3.2.Virtual Stores
11.6.Key Segment for Channeling Investments
11.6.1.By Country
11.6.2.By Offerings
11.6.3.By Application
11.6.4.By End Users
12.Europe Virtual Fitting Rooms Market Analysis and Forecasts, 2023 – 2031
12.1.Overview
12.1.1.Europe Virtual Fitting Rooms Market Revenue (US$ Mn)
12.2.Europe Virtual Fitting Rooms Market Revenue (US$ Mn) and Forecasts, By Offerings
12.2.1.Hardware
12.2.1.1.Prefabricated
12.2.1.2.Customized
12.2.2.Software
12.2.2.1.Integrated
12.2.2.2.Standalone
12.2.3.Services
12.3.Europe Virtual Fitting Rooms Market Revenue (US$ Mn) and Forecasts, By Application
12.3.1.Apparel
12.3.2.Jewelry and Watches
12.3.3.Jewelry and Watches
12.3.4.Makeup
12.3.5.Footwear
12.3.6.Others
12.4.Europe Virtual Fitting Rooms Market Revenue (US$ Mn) and Forecasts, By End Users
12.4.1.Brick and Mortar Stores
12.4.2.Virtual Stores
12.5.Europe Virtual Fitting Rooms Market Revenue (US$ Mn) and Forecasts, By Country
12.5.1.France
12.5.1.1.France Virtual Fitting Rooms Market Revenue (US$ Mn) and Forecasts, By Offerings
12.5.1.1.1.Hardware
12.5.1.1.1.1.Prefabricated
12.5.1.1.1.2.Customized
12.5.1.1.2.Software
12.5.1.1.2.1.Integrated
12.5.1.1.2.2.Standalone
12.5.1.1.3.Services
12.5.1.2.France Virtual Fitting Rooms Market Revenue (US$ Mn) and Forecasts, By Application
12.5.1.2.1.Apparel
12.5.1.2.2.Jewelry and Watches
12.5.1.2.3.Jewelry and Watches
12.5.1.2.4.Makeup
12.5.1.2.5.Footwear
12.5.1.2.6.Others
12.5.1.3.France Virtual Fitting Rooms Market Revenue (US$ Mn) and Forecasts, By End Users
12.5.1.3.1.Brick and Mortar Stores
12.5.1.3.2.Virtual Stores
12.5.2.The UK
12.5.2.1.The UK Virtual Fitting Rooms Market Revenue (US$ Mn) and Forecasts, By Offerings
12.5.2.1.1.Hardware
12.5.2.1.1.1.Prefabricated
12.5.2.1.1.2.Customized
12.5.2.1.2.Software
12.5.2.1.2.1.Integrated
12.5.2.1.2.2.Standalone
12.5.2.1.3.Services
12.5.2.2.The UK Virtual Fitting Rooms Market Revenue (US$ Mn) and Forecasts, By Application
12.5.2.2.1.Apparel
12.5.2.2.2.Jewelry and Watches
12.5.2.2.3.Jewelry and Watches
12.5.2.2.4.Makeup
12.5.2.2.5.Footwear
12.5.2.2.6.Others
12.5.2.3.The UK Virtual Fitting Rooms Market Revenue (US$ Mn) and Forecasts, By End Users
12.5.2.3.1.Brick and Mortar Stores
12.5.2.3.2.Virtual Stores
12.5.3.Spain
12.5.3.1.Spain Virtual Fitting Rooms Market Revenue (US$ Mn) and Forecasts, By Offerings
12.5.3.1.1.Hardware
12.5.3.1.1.1.Prefabricated
12.5.3.1.1.2.Customized
12.5.3.1.2.Software
12.5.3.1.2.1.Integrated
12.5.3.1.2.2.Standalone
12.5.3.1.3.Services
12.5.3.2.Spain Virtual Fitting Rooms Market Revenue (US$ Mn) and Forecasts, By Application
12.5.3.2.1.Apparel
12.5.3.2.2.Jewelry and Watches
12.5.3.2.3.Jewelry and Watches
12.5.3.2.4.Makeup
12.5.3.2.5.Footwear
12.5.3.2.6.Others
12.5.3.3.Spain Virtual Fitting Rooms Market Revenue (US$ Mn) and Forecasts, By End Users
12.5.3.3.1.Brick and Mortar Stores
12.5.3.3.2.Virtual Stores
12.5.4.Germany
12.5.4.1.Germany Virtual Fitting Rooms Market Revenue (US$ Mn) and Forecasts, By Offerings
12.5.4.1.1.Hardware
12.5.4.1.1.1.Prefabricated
12.5.4.1.1.2.Customized
12.5.4.1.2.Software
12.5.4.1.2.1.Integrated
12.5.4.1.2.2.Standalone
12.5.4.1.3.Services
12.5.4.2.Germany Virtual Fitting Rooms Market Revenue (US$ Mn) and Forecasts, By Application
12.5.4.2.1.Apparel
12.5.4.2.2.Jewelry and Watches
12.5.4.2.3.Jewelry and Watches
12.5.4.2.4.Makeup
12.5.4.2.5.Footwear
12.5.4.2.6.Others
12.5.4.3.Germany Virtual Fitting Rooms Market Revenue (US$ Mn) and Forecasts, By End Users
12.5.4.3.1.Brick and Mortar Stores
12.5.4.3.2.Virtual Stores
12.5.5.Italy
12.5.5.1.Italy Virtual Fitting Rooms Market Revenue (US$ Mn) and Forecasts, By Offerings
12.5.5.1.1.Hardware
12.5.5.1.1.1.Prefabricated
12.5.5.1.1.2.Customized
12.5.5.1.2.Software
12.5.5.1.2.1.Integrated
12.5.5.1.2.2.Standalone
12.5.5.1.3.Services
12.5.5.2.Italy Virtual Fitting Rooms Market Revenue (US$ Mn) and Forecasts, By Application
12.5.5.2.1.Apparel
12.5.5.2.2.Jewelry and Watches
12.5.5.2.3.Jewelry and Watches
12.5.5.2.4.Makeup
12.5.5.2.5.Footwear
12.5.5.2.6.Others
12.5.5.3.Italy Virtual Fitting Rooms Market Revenue (US$ Mn) and Forecasts, By End Users
12.5.5.3.1.Brick and Mortar Stores
12.5.5.3.2.Virtual Stores
12.5.6.Nordic Countries
12.5.6.1.Nordic Countries Virtual Fitting Rooms Market Revenue (US$ Mn) and Forecasts, By Offerings
12.5.6.1.1.Hardware
12.5.6.1.1.1.Prefabricated
12.5.6.1.1.2.Customized
12.5.6.1.2.Software
12.5.6.1.2.1.Integrated
12.5.6.1.2.2.Standalone
12.5.6.1.3.Services
12.5.6.2.Nordic Countries Virtual Fitting Rooms Market Revenue (US$ Mn) and Forecasts, By Application
12.5.6.2.1.Apparel
12.5.6.2.2.Jewelry and Watches
12.5.6.2.3.Jewelry and Watches
12.5.6.2.4.Makeup
12.5.6.2.5.Footwear
12.5.6.2.6.Others
12.5.6.3.Nordic Countries Virtual Fitting Rooms Market Revenue (US$ Mn) and Forecasts, By End Users
12.5.6.3.1.Brick and Mortar Stores
12.5.6.3.2.Virtual Stores
12.5.6.4.Nordic Countries Virtual Fitting Rooms Market Revenue (US$ Mn) and Forecasts, By Country
12.5.6.4.1.Denmark
12.5.6.4.2.Finland
12.5.6.4.3.Iceland
12.5.6.4.4.Sweden
12.5.6.4.5.Norway
12.5.7.Benelux Union
12.5.7.1.Benelux Union Virtual Fitting Rooms Market Revenue (US$ Mn) and Forecasts, By Offerings
12.5.7.1.1.Hardware
12.5.7.1.1.1.Prefabricated
12.5.7.1.1.2.Customized
12.5.7.1.2.Software
12.5.7.1.2.1.Integrated
12.5.7.1.2.2.Standalone
12.5.7.1.3.Services
12.5.7.2.Benelux Union Virtual Fitting Rooms Market Revenue (US$ Mn) and Forecasts, By Application
12.5.7.2.1.Apparel
12.5.7.2.2.Jewelry and Watches
12.5.7.2.3.Jewelry and Watches
12.5.7.2.4.Makeup
12.5.7.2.5.Footwear
12.5.7.2.6.Others
12.5.7.3.Benelux Union Virtual Fitting Rooms Market Revenue (US$ Mn) and Forecasts, By End Users
12.5.7.3.1.Brick and Mortar Stores
12.5.7.3.2.Virtual Stores
12.5.7.4.Benelux Union Virtual Fitting Rooms Market Revenue (US$ Mn) and Forecasts, By Country
12.5.7.4.1.Belgium
12.5.7.4.2.The Netherlands
12.5.7.4.3.Luxembourg
12.5.8.Rest of Europe
12.5.8.1.Rest of Europe Virtual Fitting Rooms Market Revenue (US$ Mn) and Forecasts, By Offerings
12.5.8.1.1.Hardware
12.5.8.1.1.1.Prefabricated
12.5.8.1.1.2.Customized
12.5.8.1.2.Software
12.5.8.1.2.1.Integrated
12.5.8.1.2.2.Standalone
12.5.8.1.3.Services
12.5.8.2.Rest of Europe Virtual Fitting Rooms Market Revenue (US$ Mn) and Forecasts, By Application
12.5.8.2.1.Apparel
12.5.8.2.2.Jewelry and Watches
12.5.8.2.3.Jewelry and Watches
12.5.8.2.4.Makeup
12.5.8.2.5.Footwear
12.5.8.2.6.Others
12.5.8.3.Rest of Europe Virtual Fitting Rooms Market Revenue (US$ Mn) and Forecasts, By End Users
12.5.8.3.1.Brick and Mortar Stores
12.5.8.3.2.Virtual Stores
12.6.Key Segment for Channeling Investments
12.6.1.By Country
12.6.2.By Offerings
12.6.3.By Application
12.6.4.By End Users
13.Asia Pacific Virtual Fitting Rooms Market Analysis and Forecasts, 2023 – 2031
13.1.Overview
13.1.1.Asia Pacific Virtual Fitting Rooms Market Revenue (US$ Mn)
13.2.Asia Pacific Virtual Fitting Rooms Market Revenue (US$ Mn) and Forecasts, By Offerings
13.2.1.Hardware
13.2.1.1.Prefabricated
13.2.1.2.Customized
13.2.2.Software
13.2.2.1.Integrated
13.2.2.2.Standalone
13.2.3.Services
13.3.Asia Pacific Virtual Fitting Rooms Market Revenue (US$ Mn) and Forecasts, By Application
13.3.1.Apparel
13.3.2.Jewelry and Watches
13.3.3.Jewelry and Watches
13.3.4.Makeup
13.3.5.Footwear
13.3.6.Others
13.4.Asia Pacific Virtual Fitting Rooms Market Revenue (US$ Mn) and Forecasts, By End Users
13.4.1.Brick and Mortar Stores
13.4.2.Virtual Stores
13.5.Asia Pacific Virtual Fitting Rooms Market Revenue (US$ Mn) and Forecasts, By Country
13.5.1.China
13.5.1.1.China Virtual Fitting Rooms Market Revenue (US$ Mn) and Forecasts, By Offerings
13.5.1.1.1.Hardware
13.5.1.1.1.1.Prefabricated
13.5.1.1.1.2.Customized
13.5.1.1.2.Software
13.5.1.1.2.1.Integrated
13.5.1.1.2.2.Standalone
13.5.1.1.3.Services
13.5.1.2.China Virtual Fitting Rooms Market Revenue (US$ Mn) and Forecasts, By Application
13.5.1.2.1.Apparel
13.5.1.2.2.Jewelry and Watches
13.5.1.2.3.Jewelry and Watches
13.5.1.2.4.Makeup
13.5.1.2.5.Footwear
13.5.1.2.6.Others
13.5.1.3.China Virtual Fitting Rooms Market Revenue (US$ Mn) and Forecasts, By End Users
13.5.1.3.1.Brick and Mortar Stores
13.5.1.3.2.Virtual Stores
13.5.2.Japan
13.5.2.1.Japan Virtual Fitting Rooms Market Revenue (US$ Mn) and Forecasts, By Offerings
13.5.2.1.1.Hardware
13.5.2.1.1.1.Prefabricated
13.5.2.1.1.2.Customized
13.5.2.1.2.Software
13.5.2.1.2.1.Integrated
13.5.2.1.2.2.Standalone
13.5.2.1.3.Services
13.5.2.2.Japan Virtual Fitting Rooms Market Revenue (US$ Mn) and Forecasts, By Application
13.5.2.2.1.Apparel
13.5.2.2.2.Jewelry and Watches
13.5.2.2.3.Jewelry and Watches
13.5.2.2.4.Makeup
13.5.2.2.5.Footwear
13.5.2.2.6.Others
13.5.2.3.Japan Virtual Fitting Rooms Market Revenue (US$ Mn) and Forecasts, By End Users
13.5.2.3.1.Brick and Mortar Stores
13.5.2.3.2.Virtual Stores
13.5.3.India
13.5.3.1.India Virtual Fitting Rooms Market Revenue (US$ Mn) and Forecasts, By Offerings
13.5.3.1.1.Hardware
13.5.3.1.1.1.Prefabricated
13.5.3.1.1.2.Customized
13.5.3.1.2.Software
13.5.3.1.2.1.Integrated
13.5.3.1.2.2.Standalone
13.5.3.1.3.Services
13.5.3.2.India Virtual Fitting Rooms Market Revenue (US$ Mn) and Forecasts, By Application
13.5.3.2.1.Apparel
13.5.3.2.2.Jewelry and Watches
13.5.3.2.3.Jewelry and Watches
13.5.3.2.4.Makeup
13.5.3.2.5.Footwear
13.5.3.2.6.Others
13.5.3.3.India Virtual Fitting Rooms Market Revenue (US$ Mn) and Forecasts, By End Users
13.5.3.3.1.Brick and Mortar Stores
13.5.3.3.2.Virtual Stores
13.5.4.New Zealand
13.5.4.1.New Zealand Virtual Fitting Rooms Market Revenue (US$ Mn) and Forecasts, By Offerings
13.5.4.1.1.Hardware
13.5.4.1.1.1.Prefabricated
13.5.4.1.1.2.Customized
13.5.4.1.2.Software
13.5.4.1.2.1.Integrated
13.5.4.1.2.2.Standalone
13.5.4.1.3.Services
13.5.4.2.New Zealand Virtual Fitting Rooms Market Revenue (US$ Mn) and Forecasts, By Application
13.5.4.2.1.Apparel
13.5.4.2.2.Jewelry and Watches
13.5.4.2.3.Jewelry and Watches
13.5.4.2.4.Makeup
13.5.4.2.5.Footwear
13.5.4.2.6.Others
13.5.4.3.New Zealand Virtual Fitting Rooms Market Revenue (US$ Mn) and Forecasts, By End Users
13.5.4.3.1.Brick and Mortar Stores
13.5.4.3.2.Virtual Stores
13.5.5.Australia
13.5.5.1.Australia Virtual Fitting Rooms Market Revenue (US$ Mn) and Forecasts, By Offerings
13.5.5.1.1.Hardware
13.5.5.1.1.1.Prefabricated
13.5.5.1.1.2.Customized
13.5.5.1.2.Software
13.5.5.1.2.1.Integrated
13.5.5.1.2.2.Standalone
13.5.5.1.3.Services
13.5.5.2.Australia Virtual Fitting Rooms Market Revenue (US$ Mn) and Forecasts, By Application
13.5.5.2.1.Apparel
13.5.5.2.2.Jewelry and Watches
13.5.5.2.3.Jewelry and Watches
13.5.5.2.4.Makeup
13.5.5.2.5.Footwear
13.5.5.2.6.Others
13.5.5.3.Australia Virtual Fitting Rooms Market Revenue (US$ Mn) and Forecasts, By End Users
13.5.5.3.1.Brick and Mortar Stores
13.5.5.3.2.Virtual Stores
13.5.6.South Korea
13.5.6.1.South Korea Virtual Fitting Rooms Market Revenue (US$ Mn) and Forecasts, By Offerings
13.5.6.1.1.Hardware
13.5.6.1.1.1.Prefabricated
13.5.6.1.1.2.Customized
13.5.6.1.2.Software
13.5.6.1.2.1.Integrated
13.5.6.1.2.2.Standalone
13.5.6.1.3.Services
13.5.6.2.South Korea Virtual Fitting Rooms Market Revenue (US$ Mn) and Forecasts, By Application
13.5.6.2.1.Apparel
13.5.6.2.2.Jewelry and Watches
13.5.6.2.3.Jewelry and Watches
13.5.6.2.4.Makeup
13.5.6.2.5.Footwear
13.5.6.2.6.Others
13.5.6.3.South Korea Virtual Fitting Rooms Market Revenue (US$ Mn) and Forecasts, By End Users
13.5.6.3.1.Brick and Mortar Stores
13.5.6.3.2.Virtual Stores
13.5.7.Southeast Asia
13.5.7.1.Southeast Asia Virtual Fitting Rooms Market Revenue (US$ Mn) and Forecasts, By Offerings
13.5.7.1.1.Hardware
13.5.7.1.1.1.Prefabricated
13.5.7.1.1.2.Customized
13.5.7.1.2.Software
13.5.7.1.2.1.Integrated
13.5.7.1.2.2.Standalone
13.5.7.1.3.Services
13.5.7.2.Southeast Asia Virtual Fitting Rooms Market Revenue (US$ Mn) and Forecasts, By Application
13.5.7.2.1.Apparel
13.5.7.2.2.Jewelry and Watches
13.5.7.2.3.Jewelry and Watches
13.5.7.2.4.Makeup
13.5.7.2.5.Footwear
13.5.7.2.6.Others
13.5.7.3.Southeast Asia Virtual Fitting Rooms Market Revenue (US$ Mn) and Forecasts, By End Users
13.5.7.3.1.Brick and Mortar Stores
13.5.7.3.2.Virtual Stores
13.5.7.4.Southeast Asia Virtual Fitting Rooms Market Revenue (US$ Mn) and Forecasts, By Country
13.5.7.4.1.Indonesia
13.5.7.4.2.Thailand
13.5.7.4.3.Malaysia
13.5.7.4.4.Singapore
13.5.7.4.5.Rest of Southeast Asia
13.5.8.Rest of Asia Pacific
13.5.8.1.Rest of Asia Pacific Virtual Fitting Rooms Market Revenue (US$ Mn) and Forecasts, By Offerings
13.5.8.1.1.Hardware
13.5.8.1.1.1.Prefabricated
13.5.8.1.1.2.Customized
13.5.8.1.2.Software
13.5.8.1.2.1.Integrated
13.5.8.1.2.2.Standalone
13.5.8.1.3.Services
13.5.8.2.Rest of Asia Pacific Virtual Fitting Rooms Market Revenue (US$ Mn) and Forecasts, By Application
13.5.8.2.1.Apparel
13.5.8.2.2.Jewelry and Watches
13.5.8.2.3.Jewelry and Watches
13.5.8.2.4.Makeup
13.5.8.2.5.Footwear
13.5.8.2.6.Others
13.5.8.3.Rest of Asia Pacific Virtual Fitting Rooms Market Revenue (US$ Mn) and Forecasts, By End Users
13.5.8.3.1.Brick and Mortar Stores
13.5.8.3.2.Virtual Stores
13.6.Key Segment for Channeling Investments
13.6.1.By Country
13.6.2.By Offerings
13.6.3.By Application
13.6.4.By End Users
14.Middle East and Africa Virtual Fitting Rooms Market Analysis and Forecasts, 2023 – 2031
14.1.Overview
14.1.1.Middle East and Africa Virtual Fitting Rooms Market Revenue (US$ Mn)
14.2.Middle East and Africa Virtual Fitting Rooms Market Revenue (US$ Mn) and Forecasts, By Offerings
14.2.1.Hardware
14.2.1.1.Prefabricated
14.2.1.2.Customized
14.2.2.Software
14.2.2.1.Integrated
14.2.2.2.Standalone
14.2.3.Services
14.3.Middle East and Africa Virtual Fitting Rooms Market Revenue (US$ Mn) and Forecasts, By Application
14.3.1.Apparel
14.3.2.Jewelry and Watches
14.3.3.Jewelry and Watches
14.3.4.Makeup
14.3.5.Footwear
14.3.6.Others
14.4.Middle East and Africa Virtual Fitting Rooms Market Revenue (US$ Mn) and Forecasts, By End Users
14.4.1.Brick and Mortar Stores
14.4.2.Virtual Stores
14.5.Middle East and Africa Virtual Fitting Rooms Market Revenue (US$ Mn) and Forecasts, By Country
14.5.1.Saudi Arabia
14.5.1.1.Saudi Arabia Virtual Fitting Rooms Market Revenue (US$ Mn) and Forecasts, By Offerings
14.5.1.1.1.Hardware
14.5.1.1.1.1.Prefabricated
14.5.1.1.1.2.Customized
14.5.1.1.2.Software
14.5.1.1.2.1.Integrated
14.5.1.1.2.2.Standalone
14.5.1.1.3.Services
14.5.1.2.Saudi Arabia Virtual Fitting Rooms Market Revenue (US$ Mn) and Forecasts, By Application
14.5.1.2.1.Apparel
14.5.1.2.2.Jewelry and Watches
14.5.1.2.3.Jewelry and Watches
14.5.1.2.4.Makeup
14.5.1.2.5.Footwear
14.5.1.2.6.Others
14.5.1.3.Saudi Arabia Virtual Fitting Rooms Market Revenue (US$ Mn) and Forecasts, By End Users
14.5.1.3.1.Brick and Mortar Stores
14.5.1.3.2.Virtual Stores
14.5.2.UAE
14.5.2.1.UAE Virtual Fitting Rooms Market Revenue (US$ Mn) and Forecasts, By Offerings
14.5.2.1.1.Hardware
14.5.2.1.1.1.Prefabricated
14.5.2.1.1.2.Customized
14.5.2.1.2.Software
14.5.2.1.2.1.Integrated
14.5.2.1.2.2.Standalone
14.5.2.1.3.Services
14.5.2.2.UAE Virtual Fitting Rooms Market Revenue (US$ Mn) and Forecasts, By Application
14.5.2.2.1.Apparel
14.5.2.2.2.Jewelry and Watches
14.5.2.2.3.Jewelry and Watches
14.5.2.2.4.Makeup
14.5.2.2.5.Footwear
14.5.2.2.6.Others
14.5.2.3.UAE Virtual Fitting Rooms Market Revenue (US$ Mn) and Forecasts, By End Users
14.5.2.3.1.Brick and Mortar Stores
14.5.2.3.2.Virtual Stores
14.5.3.Egypt
14.5.3.1.Egypt Virtual Fitting Rooms Market Revenue (US$ Mn) and Forecasts, By Offerings
14.5.3.1.1.Hardware
14.5.3.1.1.1.Prefabricated
14.5.3.1.1.2.Customized
14.5.3.1.2.Software
14.5.3.1.2.1.Integrated
14.5.3.1.2.2.Standalone
14.5.3.1.3.Services
14.5.3.2.Egypt Virtual Fitting Rooms Market Revenue (US$ Mn) and Forecasts, By Application
14.5.3.2.1.Apparel
14.5.3.2.2.Jewelry and Watches
14.5.3.2.3.Jewelry and Watches
14.5.3.2.4.Makeup
14.5.3.2.5.Footwear
14.5.3.2.6.Others
14.5.3.3.Egypt Virtual Fitting Rooms Market Revenue (US$ Mn) and Forecasts, By End Users
14.5.3.3.1.Brick and Mortar Stores
14.5.3.3.2.Virtual Stores
14.5.4.Kuwait
14.5.4.1.Kuwait Virtual Fitting Rooms Market Revenue (US$ Mn) and Forecasts, By Offerings
14.5.4.1.1.Hardware
14.5.4.1.1.1.Prefabricated
14.5.4.1.1.2.Customized
14.5.4.1.2.Software
14.5.4.1.2.1.Integrated
14.5.4.1.2.2.Standalone
14.5.4.1.3.Services
14.5.4.2.Kuwait Virtual Fitting Rooms Market Revenue (US$ Mn) and Forecasts, By Application
14.5.4.2.1.Apparel
14.5.4.2.2.Jewelry and Watches
14.5.4.2.3.Jewelry and Watches
14.5.4.2.4.Makeup
14.5.4.2.5.Footwear
14.5.4.2.6.Others
14.5.4.3.Kuwait Virtual Fitting Rooms Market Revenue (US$ Mn) and Forecasts, By End Users
14.5.4.3.1.Brick and Mortar Stores
14.5.4.3.2.Virtual Stores
14.5.5.South Africa
14.5.5.1.South Africa Virtual Fitting Rooms Market Revenue (US$ Mn) and Forecasts, By Offerings
14.5.5.1.1.Hardware
14.5.5.1.1.1.Prefabricated
14.5.5.1.1.2.Customized
14.5.5.1.2.Software
14.5.5.1.2.1.Integrated
14.5.5.1.2.2.Standalone
14.5.5.1.3.Services
14.5.5.2.South Africa Virtual Fitting Rooms Market Revenue (US$ Mn) and Forecasts, By Application
14.5.5.2.1.Apparel
14.5.5.2.2.Jewelry and Watches
14.5.5.2.3.Jewelry and Watches
14.5.5.2.4.Makeup
14.5.5.2.5.Footwear
14.5.5.2.6.Others
14.5.5.3.South Africa Virtual Fitting Rooms Market Revenue (US$ Mn) and Forecasts, By End Users
14.5.5.3.1.Brick and Mortar Stores
14.5.5.3.2.Virtual Stores
14.5.6.Rest of Middle East & Africa
14.5.6.1.Rest of Middle East & Africa Virtual Fitting Rooms Market Revenue (US$ Mn) and Forecasts, By Offerings
14.5.6.1.1.Hardware
14.5.6.1.1.1.Prefabricated
14.5.6.1.1.2.Customized
14.5.6.1.2.Software
14.5.6.1.2.1.Integrated
14.5.6.1.2.2.Standalone
14.5.6.1.3.Services
14.5.6.2.Rest of Middle East & Africa Virtual Fitting Rooms Market Revenue (US$ Mn) and Forecasts, By Application
14.5.6.2.1.Apparel
14.5.6.2.2.Jewelry and Watches
14.5.6.2.3.Jewelry and Watches
14.5.6.2.4.Makeup
14.5.6.2.5.Footwear
14.5.6.2.6.Others
14.5.6.3.Rest of Middle East & Africa Virtual Fitting Rooms Market Revenue (US$ Mn) and Forecasts, By End Users
14.5.6.3.1.Brick and Mortar Stores
14.5.6.3.2.Virtual Stores
14.6.Key Segment for Channeling Investments
14.6.1.By Country
14.6.2.By Offerings
14.6.3.By Application
14.6.4.By End Users
15.Latin America Virtual Fitting Rooms Market Analysis and Forecasts, 2023 – 2031
15.1.Overview
15.1.1.Latin America Virtual Fitting Rooms Market Revenue (US$ Mn)
15.2.Latin America Virtual Fitting Rooms Market Revenue (US$ Mn) and Forecasts, By Offerings
15.2.1.Hardware
15.2.1.1.Prefabricated
15.2.1.2.Customized
15.2.2.Software
15.2.2.1.Integrated
15.2.2.2.Standalone
15.2.3.Services
15.3.Latin America Virtual Fitting Rooms Market Revenue (US$ Mn) and Forecasts, By Application
15.3.1.Apparel
15.3.2.Jewelry and Watches
15.3.3.Jewelry and Watches
15.3.4.Makeup
15.3.5.Footwear
15.3.6.Others
15.4.Latin America Virtual Fitting Rooms Market Revenue (US$ Mn) and Forecasts, By End Users
15.4.1.Brick and Mortar Stores
15.4.2.Virtual Stores
15.5.Latin America Virtual Fitting Rooms Market Revenue (US$ Mn) and Forecasts, By Country
15.5.1.Brazil
15.5.1.1.Brazil Virtual Fitting Rooms Market Revenue (US$ Mn) and Forecasts, By Offerings
15.5.1.1.1.Hardware
15.5.1.1.1.1.Prefabricated
15.5.1.1.1.2.Customized
15.5.1.1.2.Software
15.5.1.1.2.1.Integrated
15.5.1.1.2.2.Standalone
15.5.1.1.3.Services
15.5.1.2.Brazil Virtual Fitting Rooms Market Revenue (US$ Mn) and Forecasts, By Application
15.5.1.2.1.Apparel
15.5.1.2.2.Jewelry and Watches
15.5.1.2.3.Jewelry and Watches
15.5.1.2.4.Makeup
15.5.1.2.5.Footwear
15.5.1.2.6.Others
15.5.1.3.Brazil Virtual Fitting Rooms Market Revenue (US$ Mn) and Forecasts, By End Users
15.5.1.3.1.Brick and Mortar Stores
15.5.1.3.2.Virtual Stores
15.5.2.Argentina
15.5.2.1.Argentina Virtual Fitting Rooms Market Revenue (US$ Mn) and Forecasts, By Offerings
15.5.2.1.1.Hardware
15.5.2.1.1.1.Prefabricated
15.5.2.1.1.2.Customized
15.5.2.1.2.Software
15.5.2.1.2.1.Integrated
15.5.2.1.2.2.Standalone
15.5.2.1.3.Services
15.5.2.2.Argentina Virtual Fitting Rooms Market Revenue (US$ Mn) and Forecasts, By Application
15.5.2.2.1.Apparel
15.5.2.2.2.Jewelry and Watches
15.5.2.2.3.Jewelry and Watches
15.5.2.2.4.Makeup
15.5.2.2.5.Footwear
15.5.2.2.6.Others
15.5.2.3.Argentina Virtual Fitting Rooms Market Revenue (US$ Mn) and Forecasts, By End Users
15.5.2.3.1.Brick and Mortar Stores
15.5.2.3.2.Virtual Stores
15.5.3.Rest of Latin America
15.5.3.1.Rest of Latin America Virtual Fitting Rooms Market Revenue (US$ Mn) and Forecasts, By Offerings
15.5.3.1.1.Hardware
15.5.3.1.1.1.Prefabricated
15.5.3.1.1.2.Customized
15.5.3.1.2.Software
15.5.3.1.2.1.Integrated
15.5.3.1.2.2.Standalone
15.5.3.1.3.Services
15.5.3.2.Rest of Latin America Virtual Fitting Rooms Market Revenue (US$ Mn) and Forecasts, By Application
15.5.3.2.1.Apparel
15.5.3.2.2.Jewelry and Watches
15.5.3.2.3.Jewelry and Watches
15.5.3.2.4.Makeup
15.5.3.2.5.Footwear
15.5.3.2.6.Others
15.5.3.3.Rest of Latin America Virtual Fitting Rooms Market Revenue (US$ Mn) and Forecasts, By End Users
15.5.3.3.1.Brick and Mortar Stores
15.5.3.3.2.Virtual Stores
15.6.Key Segment for Channeling Investments
15.6.1.By Country
15.6.2.By Offerings
15.6.3.By Application
15.6.4.By End Users
16.Competitive Benchmarking
16.1.Market Share Analysis, 2022
16.2.Global Presence and Growth Strategies
16.2.1.Mergers and Acquisitions
16.2.2.Product Launches
16.2.3.Investments Trends
16.2.4.R&D Initiatives
17.Player Profiles
17.1.3DLOOK INC.
17.1.1.Company Details
17.1.2.Company Overview
17.1.3.Product Offerings
17.1.4.Key Developments
17.1.5.Financial Analysis
17.1.6.SWOT Analysis
17.1.7.Business Strategies
17.2.AstraFit
17.2.1.Company Details
17.2.2.Company Overview
17.2.3.Product Offerings
17.2.4.Key Developments
17.2.5.Financial Analysis
17.2.6.SWOT Analysis
17.2.7.Business Strategies
17.3.FXGear Inc
17.3.1.Company Details
17.3.2.Company Overview
17.3.3.Product Offerings
17.3.4.Key Developments
17.3.5.Financial Analysis
17.3.6.SWOT Analysis
17.3.7.Business Strategies
17.4.Mad Street Den Inc.
17.4.1.Company Details
17.4.2.Company Overview
17.4.3.Product Offerings
17.4.4.Key Developments
17.4.5.Financial Analysis
17.4.6.SWOT Analysis
17.4.7.Business Strategies
17.5.Magic Mirror
17.5.1.Company Details
17.5.2.Company Overview
17.5.3.Product Offerings
17.5.4.Key Developments
17.5.5.Financial Analysis
17.5.6.SWOT Analysis
17.5.7.Business Strategies
17.6.RoboSize LTD.
17.6.1.Company Details
17.6.2.Company Overview
17.6.3.Product Offerings
17.6.4.Key Developments
17.6.5.Financial Analysis
17.6.6.SWOT Analysis
17.6.7.Business Strategies
17.7.SenseMi DMCC – VIUBOX
17.7.1.Company Details
17.7.2.Company Overview
17.7.3.Product Offerings
17.7.4.Key Developments
17.7.5.Financial Analysis
17.7.6.SWOT Analysis
17.7.7.Business Strategies
17.8.Sizebay
17.8.1.Company Details
17.8.2.Company Overview
17.8.3.Product Offerings
17.8.4.Key Developments
17.8.5.Financial Analysis
17.8.6.SWOT Analysis
17.8.7.Business Strategies
17.9.Style.me
17.9.1.Company Details
17.9.2.Company Overview
17.9.3.Product Offerings
17.9.4.Key Developments
17.9.5.Financial Analysis
17.9.6.SWOT Analysis
17.9.7.Business Strategies
17.10.TEXEL
17.10.1.Company Details
17.10.2.Company Overview
17.10.3.Product Offerings
17.10.4.Key Developments
17.10.5.Financial Analysis
17.10.6.SWOT Analysis
17.10.7.Business Strategies
17.11.triMirror
17.11.1.Company Details
17.11.2.Company Overview
17.11.3.Product Offerings
17.11.4.Key Developments
17.11.5.Financial Analysis
17.11.6.SWOT Analysis
17.11.7.Business Strategies
17.12.True Fit Corporation
17.12.1.Company Details
17.12.2.Company Overview
17.12.3.Product Offerings
17.12.4.Key Developments
17.12.5.Financial Analysis
17.12.6.SWOT Analysis
17.12.7.Business Strategies
17.13.VIRTUAL ON LTD
17.13.1.Company Details
17.13.2.Company Overview
17.13.3.Product Offerings
17.13.4.Key Developments
17.13.5.Financial Analysis
17.13.6.SWOT Analysis
17.13.7.Business Strategies
17.14.Zugara, Inc
17.14.1.Company Details
17.14.2.Company Overview
17.14.3.Product Offerings
17.14.4.Key Developments
17.14.5.Financial Analysis
17.14.6.SWOT Analysis
17.14.7.Business Strategies
17.15.Other market participants
18.Key Findings

.

Note: This ToC is tentative and can be changed according to the research study conducted during the course of report completion.

.

**Exclusive for Multi-User and Enterprise User.

.

Global Virtual Fitting Rooms Market Segmentation

Offerings

 Hardware
 Prefabricated
 Customized
 Software
 Integrated
 Standalone
 Services

By Application

 Apparel
 Eyewear
 Jewelry and Watches
 Makeup
 Footwear
 Others

By End Users

 Brick and Mortar Stores
 Virtual Stores

By Region

 North America (U.S., Canada, Mexico, Rest of North America)
 Europe (France, The UK, Spain, Germany, Italy, Nordic Countries (Denmark, Finland, Iceland, Sweden, Norway), Benelux Union (Belgium, The Netherlands, Luxembourg), Rest of Europe)
 Asia Pacific (China, Japan, India, New Zealand, Australia, South Korea, Southeast Asia (Indonesia, Thailand, Malaysia, Singapore, Rest of Southeast Asia), Rest of Asia Pacific)
 Middle East & Africa (Saudi Arabia, UAE, Egypt, Kuwait, South Africa, Rest of Middle East & Africa)
 Latin America (Brazil, Argentina, Rest of Latin America)

**Note: The report covers cross-segmentation analysis by region further into countries

.

The Niche Research approach encompasses both primary and secondary research methods to provide comprehensive insights. While primary research is the cornerstone of our studies, we also incorporate secondary research sources such as company annual reports, premium industry databases, press releases, industry journals, and white papers.

Within our primary research, we actively engage with various industry stakeholders, conducting paid interviews and surveys. Our meticulous analysis extends to every market participant in major countries, allowing us to thoroughly examine their portfolios, calculate market shares, and segment revenues.

Our data collection primarily focuses on individual countries within our research scope, enabling us to estimate regional market sizes. Typically, we employ a bottom-up approach, meticulously tracking trends in different countries. We analyze growth drivers, constraints, technological innovations, and opportunities for each country, ultimately arriving at regional figures.Our process begins by examining the growth prospects of each country. Building upon these insights, we project growth and trends for the entire region. Finally, we utilize our proprietary model to refine estimations and forecasts.

Our data validation standards are integral to ensuring the reliability and accuracy of our research findings. Here’s a breakdown of our data validation processes and the stakeholders we engage with during our primary research:

  • Supply Side Analysis: We initiate a supply side analysis by directly contacting market participants, through telephonic interviews and questionnaires containing both open-ended and close-ended questions. We gather information on their portfolios, segment revenues, developments, and growth strategies.
  • Demand Side Analysis: To gain insights into adoption trends and consumer preferences, we reach out to target customers and users (non-vendors). This information forms a vital part of the qualitative analysis section of our reports, covering market dynamics, adoption trends, consumer behavior, spending patterns, and other related aspects.
  • Consultant Insights: We tap into the expertise of our partner consultants from around the world to obtain their unique viewpoints and perspectives. Their insights contribute to a well-rounded understanding of the markets under investigation.
  • In-House Validation: To ensure data accuracy and reliability, we conduct cross-validation of data points and information through our in-house team of consultants and utilize advanced data modeling tools for thorough verification.

The forecasts we provide are based on a comprehensive assessment of various factors, including:

  • Market Trends and Past Performance (Last Five Years): We accurately analyze market trends and performance data from preceding five years to identify historical patterns and understand the market’s evolution.
  • Historical Performance and Growth of Market Participants: We assess the historical performance and growth trajectories of key market participants. This analysis provides insights into the competitive landscape and individual company strategies.
  • Market Determinants Impact Analysis (Next Eight Years): We conduct a rigorous analysis of the factors that are projected to influence the market over the next eight years. This includes assessing both internal and external determinants that can shape market dynamics.
  • Drivers and Challenges for the Forecast Period:Identify the factors expected to drive market growth during the forecast period, as well as the challenges that the industry may face. This analysis aids in deriving an accurate growth rate projection.
  • New Acquisitions, Collaborations, or Partnerships: We keep a close watch on any new acquisitions, collaborations, or partnerships within the industry. These developments can have a significant impact on market dynamics and competitiveness.
  • Macro and Micro Factors Analysis:A thorough examination of both macro-level factors (e.g., economic trends, regulatory changes) and micro-level factors (e.g., technological advancements, consumer preferences) that may influence the market during the forecast period.
  • End-User Sentiment Analysis: To understand the market from the end-user perspective, we conduct sentiment analysis. This involves assessing the sentiment, preferences, and feedback of the end-users, which can provide valuable insights into market trends.
  • Perspective of Primary Participants: Insights gathered directly from primary research participants play a crucial role in shaping our forecasts. Their perspectives and experiences provide valuable qualitative data.
  • Year-on-Year Growth Trend: We utilize a year-on-year growth trend based on historical market growth and expected future trends. This helps in formulating our growth projections, aligning them with the market’s historical performance.

Research process adopted by TNR involves multiple stages, including data collection, validation, quality checks, and presentation. It’s crucial that the data and information we provide add value to your existing market understanding and expertise. We have also established partnerships with business consulting, research, and survey organizations across regions and globally to collaborate on regional analysis and data validation, ensuring the highest level of accuracy and reliability in our reports.


Procure Comprehensive Study of

Global Virtual Fitting Rooms Market

Online Only

  • Online Access
  • Read Only File
  • Validity 3 Months
  • Print, Copy, Paste & Download
  • PPT, Excel
  • Cost-Free Report in the Next Update
$3300
Buy Now

Single User

  • Access to One User on One System
  • Read Only File
  • Validity 6 Months
  • Limited Print,Copy, Paste
  • PPT, Excel
  • Cost-Free Report in the Next Update
$4200
Buy Now

Multi User

  • Access to Fiver Users
  • PDF File
  • Validity 1 Year
  • Upto FivePrints
  • Cost-Free Report in the Next Update
  • PPT, Excel
$6000
Buy Now

Enterprise User

  • Access to Unlimited Users
  • PDF, PPT, Excel
  • Unlimited Validity, Prints&Downloads
  • 1 Hour Cost-Free & Dedicated Analyst Support
  • 10% Cost-Free Customization
  • Cost-Free Report Update Twice in a Year
  • Recommendations for Business Strategies
  • Authorization to Quote TNR, The Niche Research
$7300
Buy Now

Library Access

  • Online Access to Content Publications
  • Access Player Profiles Online
  • Get Immediate Access to Newly Added Content
  • Acquire 12 PDF Downloads
  • Acquire 5 Excel Data Sets
  • Gain Access to 290+ PDFs of Company Profiles
  • Round-the-clock Email and Phone Assistance
  • Dashboard Usage and Trends
  • Renewal & Upgrade Assistance
  • Assessing Customization Options and Alerts for New Reports
$10788
Buy Now
*Taxes/Fees, if applicable will be added during checkout. All prices in USD

Why TNR The Niche Research?

  • Unwavering Commitment to Excellence

  • Veteran Team of Researchers

  • Accurate and Timely Insights

  • Ethical Practices and Customized Service

  • Uninterrupted Availability Around the Clock

Scroll to Top