Global Wave Energy Converter Market, By Type, By Location, By Application, By Region & Segmental Insights Trends and Forecast, 2024 – 2034

  • Industry: Energy & Power
  • Report ID: TNR-110-1314
  • Number of Pages: 420
  • Table/Charts : Yes
  • September, 2024
  • Base Year : 2024
  • No. of Companies : 10+
  • No. of Countries : 29
  • Views : 10025
  • Covid Impact Covered: Yes
  • War Impact Covered: Yes
  • Formats : PDF, Excel, PPT

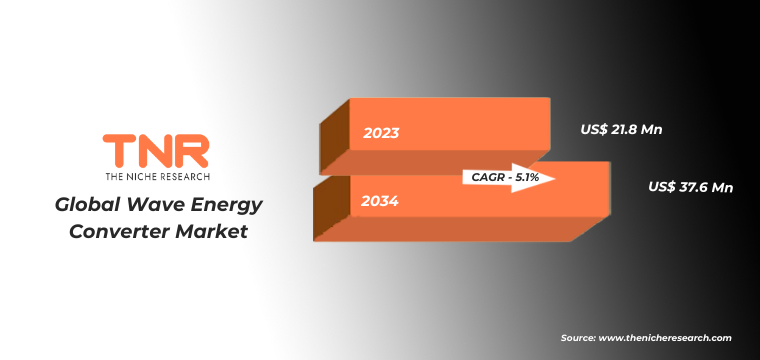
A wave energy converter (WEC) captures the kinetic energy from ocean waves and converts it into electricity. The global wave energy converter market is expanding as renewable energy demand increases. WECs are used in various sectors, such as electricity generation, water desalination, and coastal protection. For example, in 2018, the Mutriku Wave Power Plant in Spain generated over 1.3 GWh of electricity, powering hundreds of homes. In 2021, the U.S. Navy deployed WECs in Hawaii to power offshore naval bases, demonstrating their utility in military applications.

WECs also support sustainable desalination, as seen in a 2019 project by Eco Wave Power in Gibraltar, reducing freshwater scarcity. Their ability to mitigate wave impacts has been applied for coastal protection in locations like Port Kembla, Australia, in 2020. “In Terms of Revenue, the Global Wave Energy Converter Market was Worth US$ 21.8 Mn in 2023, Anticipated to Witness CAGR of 5.1% During 2024 – 2034.

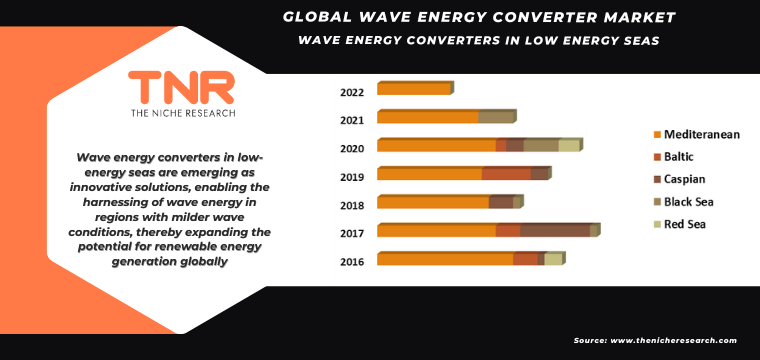
Wave Energy Converters in Low Energy Seas

Wave energy converters in low-energy seas like the Mediterranean, Baltic, Caspian, Black Sea, and Red Sea are designed for efficiency in less powerful wave environments. For instance, in 2021, Eco Wave Power deployed WECs along the Mediterranean coast in Gibraltar, producing renewable electricity. Similarly, the Baltic Sea saw WEC trials in Sweden in 2020, proving the technology’s potential for energy generation in low-energy regions.

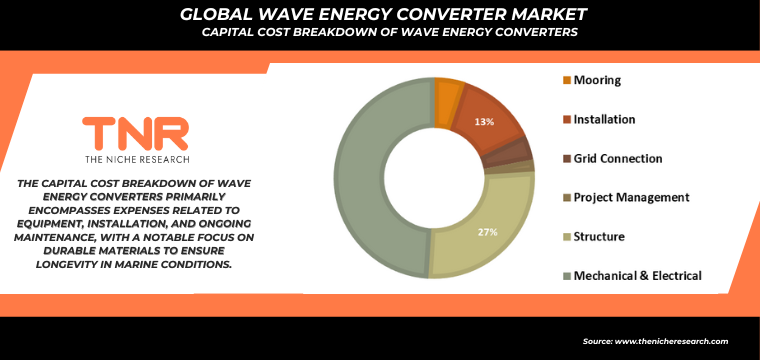
Capital Cost Breakdown of Wave Energy Converters

The capital cost of wave energy converters (WECs) involves several key components. Mooring costs vary based on location and depth, for example, in 2021, the WaveRoller project in Portugal incurred significant mooring expenses due to deep-sea conditions. Installation is another major cost, often exceeding initial estimates, such as the 2022 PEMFC project, which faced logistical challenges. Grid connection can account for up to 20% of total costs, as seen in the 2020 MeyGen project. Project management, including planning and oversight, adds complexity, while structure and mechanical & electrical costs encompass the design and assembly of the WECs, crucial for efficient energy output.

Growth Drivers in the Global Wave Energy Converter Market

  • Increasing Focus on Renewable Energy Sources:

One of the key growth drivers for the global wave energy converter (WEC) market is the rising demand for renewable energy as a means to combat climate change and reduce reliance on fossil fuels. Governments across the globe are implementing policies and incentives to promote the adoption of clean energy technologies. For instance, the European Union’s Green Deal, initiated in 2020, encourages investment in renewable energy projects, including wave energy, to achieve a climate-neutral economy by 2050. The vast, untapped potential of wave energy offers an additional, reliable source of clean electricity, driving investments in WEC technology as part of global efforts to diversify energy portfolios.

  • Advancements in Technology and Cost Reduction:

Technological advancements are significantly boosting the growth of the wave energy converter market by making WEC systems more efficient and cost-effective. Innovations such as smart grids, advanced materials, and artificial intelligence (AI) integration are enhancing the performance of WECs and reducing operational costs. In 2021, the CorPower Ocean in Sweden developed a high-efficiency WEC system with 80% energy conversion efficiency, attracting global interest. These innovations reduce energy production costs, making wave energy more competitive with traditional power sources. As costs decrease, the scalability of WECs improves, driving their adoption across various industries.

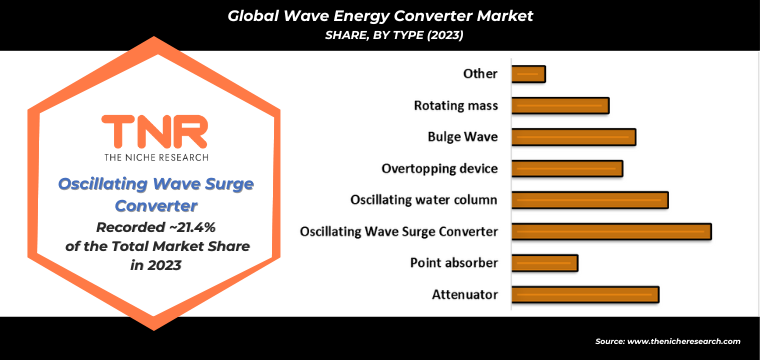
Global Wave Energy Converter Market Segmental Analysis-

Oscillating wave surge converter dominated the global market with revenue share of 21.4% in 2023. These devices harness the horizontal movement of waves to generate energy, making them highly efficient in nearshore environments. A notable example is the Wello Penguin project in Orkney, Scotland, which became operational in 2020, demonstrating OWSC’s viability in generating consistent power. Similarly, the BioWave system deployed off Australia’s coast in 2021 highlighted OWSC’s potential in varying marine conditions. OWSC’s ability to adapt to diverse wave conditions and its relatively lower maintenance costs make it a popular choice in the wave energy sector.

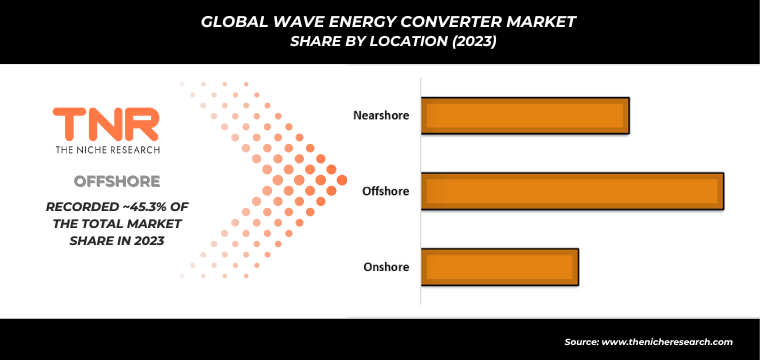
By location, nearshore are supposed to grow fastest in the global wave energy converter market capturing a revenue share of 31.1% in 2023. Nearshore sites, located close to coastlines, offer advantages like easier installation and maintenance. For instance, the Mutriku Wave Power Plant in Spain, operational since 2011, successfully harnesses wave energy near the shore, generating stable power. Similarly, the WaveRoller project in Portugal, launched in 2021, demonstrated the economic efficiency of nearshore converters. These projects highlight the growing interest in nearshore wave energy, where reduced depth and proximity to grid infrastructure make development more feasible and cost-effective.

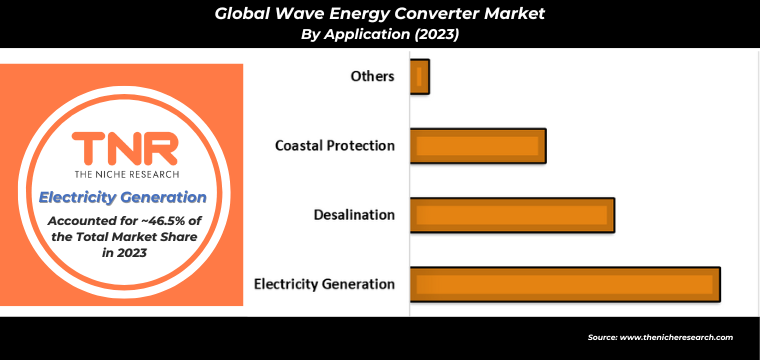
Wave energy converters are widely used in electricity generation as renewable power sources, contributing to the segment’s dominance with a 46.5% revenue share in 2023. These converters harness ocean wave motion to produce clean energy. The MeyGen project in Scotland, initiated in 2020, exemplifies how wave energy converters can sustainably generate electricity for local grids. Similarly, Portugal’s WaveRoller project, operational since 2021, highlights their effectiveness in providing reliable power. These projects showcase the growing demand for wave energy in electricity generation, driving its prominence in the renewable energy landscape due to sustainability and scalability.

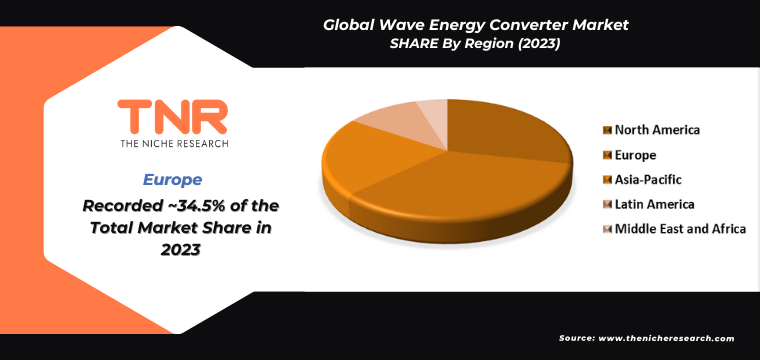
In 2023, Europe strengthened its position in the global wave energy converter market, accounting for a revenue share of 34.5%. This growth is driven by extensive government support and pioneering projects across the continent. For example, the European Marine Energy Centre (EMEC) in Orkney, Scotland, operational since 2003, continues to play a key role in testing wave energy devices. In 2021, Portugal’s WaveRoller project further demonstrated Europe’s innovation in wave energy, generating significant power. These projects, along with the EU’s ambitious renewable energy targets, have positioned Europe as a frontrunner in the development and commercialization of wave energy converters.

Competitive Landscape

Some of the players operating in the wave energy converter market are

  • Carnegie Clean Energy
  • CorPower Ocean
  • Eco Wave Power
  • NEMOS GmbH
  • Ocean Power Technologies
  • Oscilla Power, Inc.
  • Sea Wave Energy Limited
  • The LEANCON Wave Energy Device
  • Wave Dragon
  • Wave Star
  • Wello Oy
  • Other Industry Participants

Global Wave Energy Converter Market Scope:

Report Specifications Details
Market Revenue in 2023 US$ 21.8 Mn
Market Size Forecast by 2034 US$ 37.6 Mn
Growth Rate (CAGR) 5.1%
Historic Data 2016 – 2022
Base Year for Estimation 2023
Forecast Period 2024 – 2034
Report Inclusions Market Size & Estimates, Market Dynamics, Competitive Scenario, Trends, Growth Factors, Market Determinants, Key Investment Segmentation, Product/Service/Solutions Benchmarking
Segments Covered By Type, By Location, By Application, By Region
Regions Covered North America, Europe, Asia Pacific, Middle East & Africa, Latin America
Countries Covered U.S., Canada, Mexico, Rest of North America,  France, The UK, Spain, Germany, Italy, Nordic Countries (Denmark, Finland, Iceland, Sweden, Norway), Benelux Union (Belgium, The Netherlands, Luxembourg), Rest of Europe,  China, Japan, India, New Zealand, Australia, South Korea, Southeast Asia (Indonesia, Thailand, Malaysia, Singapore, Rest of Southeast Asia), Rest of Asia Pacific,  Saudi Arabia, UAE, Egypt, Kuwait, South Africa, Rest of Middle East & Africa,  Brazil, Argentina, Rest of Latin America
Key Players Carnegie Clean Energy, CorPower Ocean, Eco Wave Power, NEMOS GmbH, Ocean Power Technologies, Oscilla Power, Inc., Sea Wave Energy Limited, The LEANCON Wave Energy Device, Wave Dragon, Wave Star, Wello Oy
Customization Scope Customization allows for the inclusion/modification of content pertaining to geographical regions, countries, and specific market segments.
Pricing & Procurement Options Explore purchase options tailored to your specific research requirements
Contact Details Consult With Our Expert

Japan (Toll-Free):  +81 663-386-8111

South Korea (Toll-Free):  +82-808- 703-126

Saudi Arabia (Toll-Free):  +966 800-850-1643

United Kingdom: +44 753-710-5080

United States: +1 302-232-5106

E-mail:  askanexpert@thenicheresearch.com


Global Wave Energy Converter Market

By Type

  • Attenuator
  • Point absorber
  • Oscillating Wave Surge Converter
  • Oscillating water column
  • Overtopping device
  • Bulge Wave
  • Rotating mass
  • Other

By Location

  • Onshore
  • Offshore
  • Nearshore

By Application

  • Electricity Generation
  • Desalination
  • Coastal Protection
  • Others

By Region

  • North America (U.S., Canada, Mexico, Rest of North America)
  • Europe (France, The UK, Spain, Germany, Italy, Nordic Countries (Denmark, Finland, Iceland, Sweden, Norway), Benelux Union (Belgium, The Netherlands, Luxembourg), Rest of Europe)
  • Asia Pacific (China, Japan, India, New Zealand, Australia, South Korea, Southeast Asia (Indonesia, Thailand, Malaysia, Singapore, Rest of Southeast Asia), Rest of Asia Pacific)
  • Middle East & Africa (Saudi Arabia, UAE, Egypt, Kuwait, South Africa, Rest of Middle East & Africa)
  • Latin America (Brazil, Argentina, Rest of Latin America)

Report Layout:

Table of Contents

.

1.Market Scope
1.1.Market Segmentation
1.2.Years Considered
1.2.1.Historic Years: 2016 – 2022
1.2.2.Base Year: 2023
1.2.3.Forecast Years: 2024 – 2034
2.Key Target Audiences
3.Research Methodology
3.1.Primary Research
3.1.1.Research Questionnaire
3.1.2.Global Percentage Breakdown
3.1.3.Primary Interviews: Key Opinion Leaders (KOLs)
3.2.Secondary Research
3.2.1.Paid Databases
3.2.2.Secondary Sources
3.3.Market Size Estimates
3.3.1.Top-Down Approach
3.3.2.Bottom-Up Approach
3.4.Data Triangulation Methodology
3.5.Research Assumptions
4.Recommendations and Insights from TNR’s Perspective**
5.Holistic Overview of Wave Energy Converter Market
6.Market Synopsis: Wave Energy Converter Market
7.Wave Energy Converter Market Analysis: Qualitative Perspective
7.1.Introduction
7.1.1.Product Definition
7.1.2.Industry Development
7.2.Market Dynamics
7.2.1.Drivers
7.2.2.Restraints
7.2.3.Opportunities
7.2.4.Challenges
7.3.Trends in Wave Energy Converter Market
7.4.Market Determinants Radar Chart
7.5.Macro-Economic and Micro-Economic Indicators: Wave Energy Converter Market
7.6.Industry Gross Margin Overview
7.7.Porter’s Five Force Analysis
7.8.Impact of Covid-19 on Wave Energy Converter Market
7.9.PESTEL Analysis
7.10.Value Chain Analysis
7.11.Pricing Analysis, By Region (2023)
7.11.1.North America
7.11.2.Europe
7.11.3.Asia Pacific
7.11.4.Middle East and Africa
7.11.4.1.Saudi Arabia
7.11.4.2.UAE
7.11.4.3.Egypt
7.11.4.4.Kuwait
7.11.4.5.South Africa
7.11.4.6.Rest of Middle East & Africa
7.11.5.Latin America
7.11.5.1.Brazil
7.11.5.2.Argentina
7.11.5.3.Rest of Latin America
8.Global Wave Energy Converter Market Analysis and Forecasts, 2024 – 2034
8.1.Overview
8.1.1.Global Wave Energy Converter Market Revenue (US$ Mn)
8.2.Global Wave Energy Converter Market Revenue (US$ Mn) and Forecasts, By Type
8.2.1.Attenuator
8.2.1.1.Definition
8.2.1.2.Market Estimation and Penetration, 2016 – 2023
8.2.1.3.Market Forecast, 2024 – 2034
8.2.1.4.Compound Annual Growth Rate (CAGR)
8.2.1.5.Regional Bifurcation
8.2.1.5.1.North America
8.2.1.5.1.1.Market Estimation, 2016 – 2023
8.2.1.5.1.2.Market Forecast, 2024 – 2034
8.2.1.5.2.Europe
8.2.1.5.2.1.Market Estimation, 2016 – 2023
8.2.1.5.2.2.Market Forecast, 2024 – 2034
8.2.1.5.3.Asia Pacific
8.2.1.5.3.1.Market Estimation, 2016 – 2023
8.2.1.5.3.2.Market Forecast, 2024 – 2034
8.2.1.5.4.Middle East and Africa
8.2.1.5.4.1.Market Estimation, 2016 – 2023
8.2.1.5.4.2.Market Forecast, 2024 – 2034
8.2.1.5.5.Latin America
8.2.1.5.5.1.Market Estimation, 2016 – 2023
8.2.1.5.5.2.Market Forecast, 2024 – 2034
8.2.2.Point Absorber
8.2.2.1.Definition
8.2.2.2.Market Estimation and Penetration, 2016 – 2023
8.2.2.3.Market Forecast, 2024 – 2034
8.2.2.4.Compound Annual Growth Rate (CAGR)
8.2.2.5.Regional Bifurcation
8.2.2.5.1.North America
8.2.2.5.1.1.Market Estimation, 2016 – 2023
8.2.2.5.1.2.Market Forecast, 2024 – 2034
8.2.2.5.2.Europe
8.2.2.5.2.1.Market Estimation, 2016 – 2023
8.2.2.5.2.2.Market Forecast, 2024 – 2034
8.2.2.5.3.Asia Pacific
8.2.2.5.3.1.Market Estimation, 2016 – 2023
8.2.2.5.3.2.Market Forecast, 2024 – 2034
8.2.2.5.4.Middle East and Africa
8.2.2.5.4.1.Market Estimation, 2016 – 2023
8.2.2.5.4.2.Market Forecast, 2024 – 2034
8.2.2.5.5.Latin America
8.2.2.5.5.1.Market Estimation, 2016 – 2023
8.2.2.5.5.2.Market Forecast, 2024 – 2034
8.2.3.Oscillating Wave Surge Converter
8.2.3.1.Definition
8.2.3.2.Market Estimation and Penetration, 2016 – 2023
8.2.3.3.Market Forecast, 2024 – 2034
8.2.3.4.Compound Annual Growth Rate (CAGR)
8.2.3.5.Regional Bifurcation
8.2.3.5.1.North America
8.2.3.5.1.1.Market Estimation, 2016 – 2023
8.2.3.5.1.2.Market Forecast, 2024 – 2034
8.2.3.5.2.Europe
8.2.3.5.2.1.Market Estimation, 2016 – 2023
8.2.3.5.2.2.Market Forecast, 2024 – 2034
8.2.3.5.3.Asia Pacific
8.2.3.5.3.1.Market Estimation, 2016 – 2023
8.2.3.5.3.2.Market Forecast, 2024 – 2034
8.2.3.5.4.Middle East and Africa
8.2.3.5.4.1.Market Estimation, 2016 – 2023
8.2.3.5.4.2.Market Forecast, 2024 – 2034
8.2.3.5.5.Latin America
8.2.3.5.5.1.Market Estimation, 2016 – 2023
8.2.3.5.5.2.Market Forecast, 2024 – 2034
8.2.4.Oscillating Water Column
8.2.4.1.Definition
8.2.4.2.Market Estimation and Penetration, 2016 – 2023
8.2.4.3.Market Forecast, 2024 – 2034
8.2.4.4.Compound Annual Growth Rate (CAGR)
8.2.4.5.Regional Bifurcation
8.2.4.5.1.North America
8.2.4.5.1.1.Market Estimation, 2016 – 2023
8.2.4.5.1.2.Market Forecast, 2024 – 2034
8.2.4.5.2.Europe
8.2.4.5.2.1.Market Estimation, 2016 – 2023
8.2.4.5.2.2.Market Forecast, 2024 – 2034
8.2.4.5.3.Asia Pacific
8.2.4.5.3.1.Market Estimation, 2016 – 2023
8.2.4.5.3.2.Market Forecast, 2024 – 2034
8.2.4.5.4.Middle East and Africa
8.2.4.5.4.1.Market Estimation, 2016 – 2023
8.2.4.5.4.2.Market Forecast, 2024 – 2034
8.2.4.5.5.Latin America
8.2.4.5.5.1.Market Estimation, 2016 – 2023
8.2.4.5.5.2.Market Forecast, 2024 – 2034
8.2.5.Overtopping Device
8.2.5.1.Definition
8.2.5.2.Market Estimation and Penetration, 2016 – 2023
8.2.5.3.Market Forecast, 2024 – 2034
8.2.5.4.Compound Annual Growth Rate (CAGR)
8.2.5.5.Regional Bifurcation
8.2.5.5.1.North America
8.2.5.5.1.1.Market Estimation, 2016 – 2023
8.2.5.5.1.2.Market Forecast, 2024 – 2034
8.2.5.5.2.Europe
8.2.5.5.2.1.Market Estimation, 2016 – 2023
8.2.5.5.2.2.Market Forecast, 2024 – 2034
8.2.5.5.3.Asia Pacific
8.2.5.5.3.1.Market Estimation, 2016 – 2023
8.2.5.5.3.2.Market Forecast, 2024 – 2034
8.2.5.5.4.Middle East and Africa
8.2.5.5.4.1.Market Estimation, 2016 – 2023
8.2.5.5.4.2.Market Forecast, 2024 – 2034
8.2.5.5.5.Latin America
8.2.5.5.5.1.Market Estimation, 2016 – 2023
8.2.5.5.5.2.Market Forecast, 2024 – 2034
8.2.6.Bulge Wave
8.2.6.1.Definition
8.2.6.2.Market Estimation and Penetration, 2016 – 2023
8.2.6.3.Market Forecast, 2024 – 2034
8.2.6.4.Compound Annual Growth Rate (CAGR)
8.2.6.5.Regional Bifurcation
8.2.6.5.1.North America
8.2.6.5.1.1.Market Estimation, 2016 – 2023
8.2.6.5.1.2.Market Forecast, 2024 – 2034
8.2.6.5.2.Europe
8.2.6.5.2.1.Market Estimation, 2016 – 2023
8.2.6.5.2.2.Market Forecast, 2024 – 2034
8.2.6.5.3.Asia Pacific
8.2.6.5.3.1.Market Estimation, 2016 – 2023
8.2.6.5.3.2.Market Forecast, 2024 – 2034
8.2.6.5.4.Middle East and Africa
8.2.6.5.4.1.Market Estimation, 2016 – 2023
8.2.6.5.4.2.Market Forecast, 2024 – 2034
8.2.6.5.5.Latin America
8.2.6.5.5.1.Market Estimation, 2016 – 2023
8.2.6.5.5.2.Market Forecast, 2024 – 2034
8.2.7.Rotating Mass
8.2.7.1.Definition
8.2.7.2.Market Estimation and Penetration, 2016 – 2023
8.2.7.3.Market Forecast, 2024 – 2034
8.2.7.4.Compound Annual Growth Rate (CAGR)
8.2.7.5.Regional Bifurcation
8.2.7.5.1.North America
8.2.7.5.1.1.Market Estimation, 2016 – 2023
8.2.7.5.1.2.Market Forecast, 2024 – 2034
8.2.7.5.2.Europe
8.2.7.5.2.1.Market Estimation, 2016 – 2023
8.2.7.5.2.2.Market Forecast, 2024 – 2034
8.2.7.5.3.Asia Pacific
8.2.7.5.3.1.Market Estimation, 2016 – 2023
8.2.7.5.3.2.Market Forecast, 2024 – 2034
8.2.7.5.4.Middle East and Africa
8.2.7.5.4.1.Market Estimation, 2016 – 2023
8.2.7.5.4.2.Market Forecast, 2024 – 2034
8.2.7.5.5.Latin America
8.2.7.5.5.1.Market Estimation, 2016 – 2023
8.2.7.5.5.2.Market Forecast, 2024 – 2034
8.2.8.Other
8.2.8.1.Definition
8.2.8.2.Market Estimation and Penetration, 2016 – 2023
8.2.8.3.Market Forecast, 2024 – 2034
8.2.8.4.Compound Annual Growth Rate (CAGR)
8.2.8.5.Regional Bifurcation
8.2.8.5.1.North America
8.2.8.5.1.1.Market Estimation, 2016 – 2023
8.2.8.5.1.2.Market Forecast, 2024 – 2034
8.2.8.5.2.Europe
8.2.8.5.2.1.Market Estimation, 2016 – 2023
8.2.8.5.2.2.Market Forecast, 2024 – 2034
8.2.8.5.3.Asia Pacific
8.2.8.5.3.1.Market Estimation, 2016 – 2023
8.2.8.5.3.2.Market Forecast, 2024 – 2034
8.2.8.5.4.Middle East and Africa
8.2.8.5.4.1.Market Estimation, 2016 – 2023
8.2.8.5.4.2.Market Forecast, 2024 – 2034
8.2.8.5.5.Latin America
8.2.8.5.5.1.Market Estimation, 2016 – 2023
8.2.8.5.5.2.Market Forecast, 2024 – 2034
8.3.Key Segment for Channeling Investments
8.3.1.By Type
9.Global Wave Energy Converter Market Analysis and Forecasts, 2024 – 2034
9.1.Overview
9.2.Global Wave Energy Converter Market Revenue (US$ Mn) and Forecasts, By Location
9.2.1.Onshore
9.2.1.1.Definition
9.2.1.2.Market Estimation and Penetration, 2016 – 2023
9.2.1.3.Market Forecast, 2024 – 2034
9.2.1.4.Compound Annual Growth Rate (CAGR)
9.2.1.5.Regional Bifurcation
9.2.1.5.1.North America
9.2.1.5.1.1.Market Estimation, 2016 – 2023
9.2.1.5.1.2.Market Forecast, 2024 – 2034
9.2.1.5.2.Europe
9.2.1.5.2.1.Market Estimation, 2016 – 2023
9.2.1.5.2.2.Market Forecast, 2024 – 2034
9.2.1.5.3.Asia Pacific
9.2.1.5.3.1.Market Estimation, 2016 – 2023
9.2.1.5.3.2.Market Forecast, 2024 – 2034
9.2.1.5.4.Middle East and Africa
9.2.1.5.4.1.Market Estimation, 2016 – 2023
9.2.1.5.4.2.Market Forecast, 2024 – 2034
9.2.1.5.5.Latin America
9.2.1.5.5.1.Market Estimation, 2016 – 2023
9.2.1.5.5.2.Market Forecast, 2024 – 2034
9.2.2.Offshore
9.2.2.1.Definition
9.2.2.2.Market Estimation and Penetration, 2016 – 2023
9.2.2.3.Market Forecast, 2024 – 2034
9.2.2.4.Compound Annual Growth Rate (CAGR)
9.2.2.5.Regional Bifurcation
9.2.2.5.1.North America
9.2.2.5.1.1.Market Estimation, 2016 – 2023
9.2.2.5.1.2.Market Forecast, 2024 – 2034
9.2.2.5.2.Europe
9.2.2.5.2.1.Market Estimation, 2016 – 2023
9.2.2.5.2.2.Market Forecast, 2024 – 2034
9.2.2.5.3.Asia Pacific
9.2.2.5.3.1.Market Estimation, 2016 – 2023
9.2.2.5.3.2.Market Forecast, 2024 – 2034
9.2.2.5.4.Middle East and Africa
9.2.2.5.4.1.Market Estimation, 2016 – 2023
9.2.2.5.4.2.Market Forecast, 2024 – 2034
9.2.2.5.5.Latin America
9.2.2.5.5.1.Market Estimation, 2016 – 2023
9.2.2.5.5.2.Market Forecast, 2024 – 2034
9.2.3.Nearshore
9.2.3.1.Definition
9.2.3.2.Market Estimation and Penetration, 2016 – 2023
9.2.3.3.Market Forecast, 2024 – 2034
9.2.3.4.Compound Annual Growth Rate (CAGR)
9.2.3.5.Regional Bifurcation
9.2.3.5.1.North America
9.2.3.5.1.1.Market Estimation, 2016 – 2023
9.2.3.5.1.2.Market Forecast, 2024 – 2034
9.2.3.5.2.Europe
9.2.3.5.2.1.Market Estimation, 2016 – 2023
9.2.3.5.2.2.Market Forecast, 2024 – 2034
9.2.3.5.3.Asia Pacific
9.2.3.5.3.1.Market Estimation, 2016 – 2023
9.2.3.5.3.2.Market Forecast, 2024 – 2034
9.2.3.5.4.Middle East and Africa
9.2.3.5.4.1.Market Estimation, 2016 – 2023
9.2.3.5.4.2.Market Forecast, 2024 – 2034
9.2.3.5.5.Latin America
9.2.3.5.5.1.Market Estimation, 2016 – 2023
9.2.3.5.5.2.Market Forecast, 2024 – 2034
9.3.Key Segment for Channeling Investments
9.3.1.By Location
10.Global Wave Energy Converter Market Analysis and Forecasts, 2024 – 2034
10.1.Overview
10.2.Global Wave Energy Converter Market Revenue (US$ Mn) and Forecasts, By Application
10.2.1.Electricity Generation
10.2.1.1.Definition
10.2.1.2.Market Estimation and Penetration, 2016 – 2023
10.2.1.3.Market Forecast, 2024 – 2034
10.2.1.4.Compound Annual Growth Rate (CAGR)
10.2.1.5.Regional Bifurcation
10.2.1.5.1.North America
10.2.1.5.1.1.Market Estimation, 2016 – 2023
10.2.1.5.1.2.Market Forecast, 2024 – 2034
10.2.1.5.2.Europe
10.2.1.5.2.1.Market Estimation, 2016 – 2023
10.2.1.5.2.2.Market Forecast, 2024 – 2034
10.2.1.5.3.Asia Pacific
10.2.1.5.3.1.Market Estimation, 2016 – 2023
10.2.1.5.3.2.Market Forecast, 2024 – 2034
10.2.1.5.4.Middle East and Africa
10.2.1.5.4.1.Market Estimation, 2016 – 2023
10.2.1.5.4.2.Market Forecast, 2024 – 2034
10.2.1.5.5.Latin America
10.2.1.5.5.1.Market Estimation, 2016 – 2023
10.2.1.5.5.2.Market Forecast, 2024 – 2034
10.2.2.Desalination
10.2.2.1.Definition
10.2.2.2.Market Estimation and Penetration, 2016 – 2023
10.2.2.3.Market Forecast, 2024 – 2034
10.2.2.4.Compound Annual Growth Rate (CAGR)
10.2.2.5.Regional Bifurcation
10.2.2.5.1.North America
10.2.2.5.1.1.Market Estimation, 2016 – 2023
10.2.2.5.1.2.Market Forecast, 2024 – 2034
10.2.2.5.2.Europe
10.2.2.5.2.1.Market Estimation, 2016 – 2023
10.2.2.5.2.2.Market Forecast, 2024 – 2034
10.2.2.5.3.Asia Pacific
10.2.2.5.3.1.Market Estimation, 2016 – 2023
10.2.2.5.3.2.Market Forecast, 2024 – 2034
10.2.2.5.4.Middle East and Africa
10.2.2.5.4.1.Market Estimation, 2016 – 2023
10.2.2.5.4.2.Market Forecast, 2024 – 2034
10.2.2.5.5.Latin America
10.2.2.5.5.1.Market Estimation, 2016 – 2023
10.2.2.5.5.2.Market Forecast, 2024 – 2034
10.2.3.Coastal Protection
10.2.3.1.Definition
10.2.3.2.Market Estimation and Penetration, 2016 – 2023
10.2.3.3.Market Forecast, 2024 – 2034
10.2.3.4.Compound Annual Growth Rate (CAGR)
10.2.3.5.Regional Bifurcation
10.2.3.5.1.North America
10.2.3.5.1.1.Market Estimation, 2016 – 2023
10.2.3.5.1.2.Market Forecast, 2024 – 2034
10.2.3.5.2.Europe
10.2.3.5.2.1.Market Estimation, 2016 – 2023
10.2.3.5.2.2.Market Forecast, 2024 – 2034
10.2.3.5.3.Asia Pacific
10.2.3.5.3.1.Market Estimation, 2016 – 2023
10.2.3.5.3.2.Market Forecast, 2024 – 2034
10.2.3.5.4.Middle East and Africa
10.2.3.5.4.1.Market Estimation, 2016 – 2023
10.2.3.5.4.2.Market Forecast, 2024 – 2034
10.2.3.5.5.Latin America
10.2.3.5.5.1.Market Estimation, 2016 – 2023
10.2.3.5.5.2.Market Forecast, 2024 – 2034
10.2.4.Other
10.2.4.1.Definition
10.2.4.2.Market Estimation and Penetration, 2016 – 2023
10.2.4.3.Market Forecast, 2024 – 2034
10.2.4.4.Compound Annual Growth Rate (CAGR)
10.2.4.5.Regional Bifurcation
10.2.4.5.1.North America
10.2.4.5.1.1.Market Estimation, 2016 – 2023
10.2.4.5.1.2.Market Forecast, 2024 – 2034
10.2.4.5.2.Europe
10.2.4.5.2.1.Market Estimation, 2016 – 2023
10.2.4.5.2.2.Market Forecast, 2024 – 2034
10.2.4.5.3.Asia Pacific
10.2.4.5.3.1.Market Estimation, 2016 – 2023
10.2.4.5.3.2.Market Forecast, 2024 – 2034
10.2.4.5.4.Middle East and Africa
10.2.4.5.4.1.Market Estimation, 2016 – 2023
10.2.4.5.4.2.Market Forecast, 2024 – 2034
10.2.4.5.5.Latin America
10.2.4.5.5.1.Market Estimation, 2016 – 2023
10.2.4.5.5.2.Market Forecast, 2024 – 2034
10.3.Key Segment for Channeling Investments
10.3.1.By Application
11.North America Wave Energy Converter Market Analysis and Forecasts, 2024 – 2034
11.1.Overview
11.1.1.North America Wave Energy Converter Market Revenue (US$ Mn)
11.2.North America Wave Energy Converter Market Revenue (US$ Mn) and Forecasts, By Type
11.2.1.Attenuator
11.2.2.Point Absorber
11.2.3.Oscillating Wave Surge Converter
11.2.4.Oscillating Water Column
11.2.5.Overtopping Device
11.2.6.Bulge Wave
11.2.7.Rotating Mass
11.2.8.Other
11.3.North America Wave Energy Converter Market Revenue (US$ Mn) and Forecasts, By Location
11.3.1.Onshore
11.3.2.Offshore
11.3.3.Nearshore
11.4.North America Wave Energy Converter Market Revenue (US$ Mn) and Forecasts, By Application
11.4.1.Electricity Generation
11.4.2.Desalination
11.4.3.Coastal Protection
11.4.4.Other
11.5.North America Wave Energy Converter Market Revenue (US$ Mn) and Forecasts, By Country
11.5.1.U.S
11.5.1.1.U.S Wave Energy Converter Market Revenue (US$ Mn) and Forecasts, By Type
11.5.1.1.1.Attenuator
11.5.1.1.2.Point Absorber
11.5.1.1.3.Oscillating Wave Surge Converter
11.5.1.1.4.Oscillating Water Column
11.5.1.1.5.Overtopping Device
11.5.1.1.6.Bulge Wave
11.5.1.1.7.Rotating Mass
11.5.1.1.8.Other
11.5.1.2.U.S Wave Energy Converter Market Revenue (US$ Mn) and Forecasts, By Location
11.5.1.2.1.Onshore
11.5.1.2.2.Offshore
11.5.1.2.3.Nearshore
11.5.1.3.U.S Wave Energy Converter Market Revenue (US$ Mn) and Forecasts, By Application
11.5.1.3.1.Electricity Generation
11.5.1.3.2.Desalination
11.5.1.3.3.Coastal Protection
11.5.1.3.4.Other
11.5.2.Canada
11.5.2.1.Canada Wave Energy Converter Market Revenue (US$ Mn) and Forecasts, By Type
11.5.2.1.1.Attenuator
11.5.2.1.2.Point Absorber
11.5.2.1.3.Oscillating Wave Surge Converter
11.5.2.1.4.Oscillating Water Column
11.5.2.1.5.Overtopping Device
11.5.2.1.6.Bulge Wave
11.5.2.1.7.Rotating Mass
11.5.2.1.8.Other
11.5.2.2.Canada Wave Energy Converter Market Revenue (US$ Mn) and Forecasts, By Location
11.5.2.2.1.Onshore
11.5.2.2.2.Offshore
11.5.2.2.3.Nearshore
11.5.2.3.Canada Wave Energy Converter Market Revenue (US$ Mn) and Forecasts, By Application
11.5.2.3.1.Electricity Generation
11.5.2.3.2.Desalination
11.5.2.3.3.Coastal Protection
11.5.2.3.4.Other
11.5.3.Mexico
11.5.3.1.Mexico Wave Energy Converter Market Revenue (US$ Mn) and Forecasts, By Type
11.5.3.1.1.Attenuator
11.5.3.1.2.Point Absorber
11.5.3.1.3.Oscillating Wave Surge Converter
11.5.3.1.4.Oscillating Water Column
11.5.3.1.5.Overtopping Device
11.5.3.1.6.Bulge Wave
11.5.3.1.7.Rotating Mass
11.5.3.1.8.Other
11.5.3.2.Mexico Wave Energy Converter Market Revenue (US$ Mn) and Forecasts, By Location
11.5.3.2.1.Onshore
11.5.3.2.2.Offshore
11.5.3.2.3.Nearshore
11.5.3.3.Mexico Wave Energy Converter Market Revenue (US$ Mn) and Forecasts, By Application
11.5.3.3.1.Electricity Generation
11.5.3.3.2.Desalination
11.5.3.3.3.Coastal Protection
11.5.3.3.4.Other
11.5.4.Rest of North America
11.5.4.1.Rest of North America Wave Energy Converter Market Revenue (US$ Mn) and Forecasts, By Type
11.5.4.1.1.Attenuator
11.5.4.1.2.Point Absorber
11.5.4.1.3.Oscillating Wave Surge Converter
11.5.4.1.4.Oscillating Water Column
11.5.4.1.5.Overtopping Device
11.5.4.1.6.Bulge Wave
11.5.4.1.7.Rotating Mass
11.5.4.1.8.Other
11.5.4.2.Rest of North America Wave Energy Converter Market Revenue (US$ Mn) and Forecasts, By Location
11.5.4.2.1.Onshore
11.5.4.2.2.Offshore
11.5.4.2.3.Nearshore
11.5.4.3.Rest of North America Wave Energy Converter Market Revenue (US$ Mn) and Forecasts, By Application
11.5.4.3.1.Electricity Generation
11.5.4.3.2.Desalination
11.5.4.3.3.Coastal Protection
11.5.4.3.4.Other
11.6.Key Segment for Channeling Investments
11.6.1.By Country
11.6.2.By Type
11.6.3.By Location
11.6.4.By Application
12.Europe Wave Energy Converter Market Analysis and Forecasts, 2024 – 2034
12.1.Overview
12.1.1.Europe Wave Energy Converter Market Revenue (US$ Mn)
12.2.Europe Wave Energy Converter Market Revenue (US$ Mn) and Forecasts, By Type
12.2.1.Attenuator
12.2.2.Point Absorber
12.2.3.Oscillating Wave Surge Converter
12.2.4.Oscillating Water Column
12.2.5.Overtopping Device
12.2.6.Bulge Wave
12.2.7.Rotating Mass
12.2.8.Other
12.3.Europe Wave Energy Converter Market Revenue (US$ Mn) and Forecasts, By Location
12.3.1.Onshore
12.3.2.Offshore
12.3.3.Nearshore
12.4.Europe Wave Energy Converter Market Revenue (US$ Mn) and Forecasts, By Application
12.4.1.Electricity Generation
12.4.2.Desalination
12.4.3.Coastal Protection
12.4.4.Other
12.5.Europe Wave Energy Converter Market Revenue (US$ Mn) and Forecasts, By Country
12.5.1.France
12.5.1.1.France Wave Energy Converter Market Revenue (US$ Mn) and Forecasts, By Type
12.5.1.1.1.Attenuator
12.5.1.1.2.Point Absorber
12.5.1.1.3.Oscillating Wave Surge Converter
12.5.1.1.4.Oscillating Water Column
12.5.1.1.5.Overtopping Device
12.5.1.1.6.Bulge Wave
12.5.1.1.7.Rotating Mass
12.5.1.1.8.Other
12.5.1.2.France Wave Energy Converter Market Revenue (US$ Mn) and Forecasts, By Location
12.5.1.2.1.Onshore
12.5.1.2.2.Offshore
12.5.1.2.3.Nearshore
12.5.1.3.France Wave Energy Converter Market Revenue (US$ Mn) and Forecasts, By Application
12.5.1.3.1.Electricity Generation
12.5.1.3.2.Desalination
12.5.1.3.3.Coastal Protection
12.5.1.3.4.Other
12.5.2.The UK
12.5.2.1.The UK Wave Energy Converter Market Revenue (US$ Mn) and Forecasts, By Type
12.5.2.1.1.Attenuator
12.5.2.1.2.Point Absorber
12.5.2.1.3.Oscillating Wave Surge Converter
12.5.2.1.4.Oscillating Water Column
12.5.2.1.5.Overtopping Device
12.5.2.1.6.Bulge Wave
12.5.2.1.7.Rotating Mass
12.5.2.1.8.Other
12.5.2.2.The UK Wave Energy Converter Market Revenue (US$ Mn) and Forecasts, By Location
12.5.2.2.1.Onshore
12.5.2.2.2.Offshore
12.5.2.2.3.Nearshore
12.5.2.3.The UK Wave Energy Converter Market Revenue (US$ Mn) and Forecasts, By Application
12.5.2.3.1.Electricity Generation
12.5.2.3.2.Desalination
12.5.2.3.3.Coastal Protection
12.5.2.3.4.Other
12.5.3.Spain
12.5.3.1.Spain Wave Energy Converter Market Revenue (US$ Mn) and Forecasts, By Type
12.5.3.1.1.Attenuator
12.5.3.1.2.Point Absorber
12.5.3.1.3.Oscillating Wave Surge Converter
12.5.3.1.4.Oscillating Water Column
12.5.3.1.5.Overtopping Device
12.5.3.1.6.Bulge Wave
12.5.3.1.7.Rotating Mass
12.5.3.1.8.Other
12.5.3.2.Spain Wave Energy Converter Market Revenue (US$ Mn) and Forecasts, By Location
12.5.3.2.1.Onshore
12.5.3.2.2.Offshore
12.5.3.2.3.Nearshore
12.5.3.3.Spain Wave Energy Converter Market Revenue (US$ Mn) and Forecasts, By Application
12.5.3.3.1.Electricity Generation
12.5.3.3.2.Desalination
12.5.3.3.3.Coastal Protection
12.5.3.3.4.Other
12.5.4.Germany
12.5.4.1.Germany Wave Energy Converter Market Revenue (US$ Mn) and Forecasts, By Type
12.5.4.1.1.Attenuator
12.5.4.1.2.Point Absorber
12.5.4.1.3.Oscillating Wave Surge Converter
12.5.4.1.4.Oscillating Water Column
12.5.4.1.5.Overtopping Device
12.5.4.1.6.Bulge Wave
12.5.4.1.7.Rotating Mass
12.5.4.1.8.Other
12.5.4.2.Germany Wave Energy Converter Market Revenue (US$ Mn) and Forecasts, By Location
12.5.4.2.1.Onshore
12.5.4.2.2.Offshore
12.5.4.2.3.Nearshore
12.5.4.3.Germany Wave Energy Converter Market Revenue (US$ Mn) and Forecasts, By Application
12.5.4.3.1.Electricity Generation
12.5.4.3.2.Desalination
12.5.4.3.3.Coastal Protection
12.5.4.3.4.Other
12.5.5.Italy
12.5.5.1.Italy Wave Energy Converter Market Revenue (US$ Mn) and Forecasts, By Type
12.5.5.1.1.Attenuator
12.5.5.1.2.Point Absorber
12.5.5.1.3.Oscillating Wave Surge Converter
12.5.5.1.4.Oscillating Water Column
12.5.5.1.5.Overtopping Device
12.5.5.1.6.Bulge Wave
12.5.5.1.7.Rotating Mass
12.5.5.1.8.Other
12.5.5.2.Italy Wave Energy Converter Market Revenue (US$ Mn) and Forecasts, By Location
12.5.5.2.1.Onshore
12.5.5.2.2.Offshore
12.5.5.2.3.Nearshore
12.5.5.3.Italy Wave Energy Converter Market Revenue (US$ Mn) and Forecasts, By Application
12.5.5.3.1.Electricity Generation
12.5.5.3.2.Desalination
12.5.5.3.3.Coastal Protection
12.5.5.3.4.Other
12.5.6.Nordic Countries
12.5.6.1.Nordic Countries Wave Energy Converter Market Revenue (US$ Mn) and Forecasts, By Type
12.5.6.1.1.Attenuator
12.5.6.1.2.Point Absorber
12.5.6.1.3.Oscillating Wave Surge Converter
12.5.6.1.4.Oscillating Water Column
12.5.6.1.5.Overtopping Device
12.5.6.1.6.Bulge Wave
12.5.6.1.7.Rotating Mass
12.5.6.1.8.Other
12.5.6.2.Nordic Countries Wave Energy Converter Market Revenue (US$ Mn) and Forecasts, By Location
12.5.6.2.1.Onshore
12.5.6.2.2.Offshore
12.5.6.2.3.Nearshore
12.5.6.3.Nordic Countries Wave Energy Converter Market Revenue (US$ Mn) and Forecasts, By Application
12.5.6.3.1.Electricity Generation
12.5.6.3.2.Desalination
12.5.6.3.3.Coastal Protection
12.5.6.3.4.Other
12.5.6.4.Nordic Countries Wave Energy Converter Market Revenue (US$ Mn) and Forecasts, By Country
12.5.6.4.1.Denmark
12.5.6.4.2.Finland
12.5.6.4.3.Iceland
12.5.6.4.4.Sweden
12.5.6.4.5.Norway
12.5.7.Benelux Union
12.5.7.1.Benelux Union Wave Energy Converter Market Revenue (US$ Mn) and Forecasts, By Type
12.5.7.1.1.Attenuator
12.5.7.1.2.Point Absorber
12.5.7.1.3.Oscillating Wave Surge Converter
12.5.7.1.4.Oscillating Water Column
12.5.7.1.5.Overtopping Device
12.5.7.1.6.Bulge Wave
12.5.7.1.7.Rotating Mass
12.5.7.1.8.Other
12.5.7.2.Benelux Union Wave Energy Converter Market Revenue (US$ Mn) and Forecasts, By Location
12.5.7.2.1.Onshore
12.5.7.2.2.Offshore
12.5.7.2.3.Nearshore
12.5.7.3.Benelux Union Wave Energy Converter Market Revenue (US$ Mn) and Forecasts, By Application
12.5.7.3.1.Electricity Generation
12.5.7.3.2.Desalination
12.5.7.3.3.Coastal Protection
12.5.7.3.4.Other
12.5.7.4.Benelux Union Wave Energy Converter Market Revenue (US$ Mn) and Forecasts, By Country
12.5.7.4.1.Belgium
12.5.7.4.2.The Netherlands
12.5.7.4.3.Luxembourg
12.5.8.Rest of Europe
12.5.8.1.Rest of Europe Wave Energy Converter Market Revenue (US$ Mn) and Forecasts, By Type
12.5.8.1.1.Attenuator
12.5.8.1.2.Point Absorber
12.5.8.1.3.Oscillating Wave Surge Converter
12.5.8.1.4.Oscillating Water Column
12.5.8.1.5.Overtopping Device
12.5.8.1.6.Bulge Wave
12.5.8.1.7.Rotating Mass
12.5.8.1.8.Other
12.5.8.2.Rest of Europe Wave Energy Converter Market Revenue (US$ Mn) and Forecasts, By Location
12.5.8.2.1.Onshore
12.5.8.2.2.Offshore
12.5.8.2.3.Nearshore
12.5.8.3.Rest of Europe Wave Energy Converter Market Revenue (US$ Mn) and Forecasts, By Application
12.5.8.3.1.Electricity Generation
12.5.8.3.2.Desalination
12.5.8.3.3.Coastal Protection
12.5.8.3.4.Other
12.6.Key Segment for Channeling Investments
12.6.1.By Country
12.6.2.By Type
12.6.3.By Location
12.6.4.By Application
13.Asia Pacific Wave Energy Converter Market Analysis and Forecasts, 2024 – 2034
13.1.Overview
13.1.1.Asia Pacific Wave Energy Converter Market Revenue (US$ Mn)
13.2.Asia Pacific Wave Energy Converter Market Revenue (US$ Mn) and Forecasts, By Type
13.2.1.Attenuator
13.2.2.Point Absorber
13.2.3.Oscillating Wave Surge Converter
13.2.4.Oscillating Water Column
13.2.5.Overtopping Device
13.2.6.Bulge Wave
13.2.7.Rotating Mass
13.2.8.Other
13.3.Asia Pacific Wave Energy Converter Market Revenue (US$ Mn) and Forecasts, By Location
13.3.1.Onshore
13.3.2.Offshore
13.3.3.Nearshore
13.4.Asia Pacific Wave Energy Converter Market Revenue (US$ Mn) and Forecasts, By Application
13.4.1.Electricity Generation
13.4.2.Desalination
13.4.3.Coastal Protection
13.4.4.Other
13.5.Asia Pacific Wave Energy Converter Market Revenue (US$ Mn) and Forecasts, By Country
13.5.1.China
13.5.1.1.China Wave Energy Converter Market Revenue (US$ Mn) and Forecasts, By Type
13.5.1.1.1.Attenuator
13.5.1.1.2.Point Absorber
13.5.1.1.3.Oscillating Wave Surge Converter
13.5.1.1.4.Oscillating Water Column
13.5.1.1.5.Overtopping Device
13.5.1.1.6.Bulge Wave
13.5.1.1.7.Rotating Mass
13.5.1.1.8.Other
13.5.1.2.China Wave Energy Converter Market Revenue (US$ Mn) and Forecasts, By Location
13.5.1.2.1.Onshore
13.5.1.2.2.Offshore
13.5.1.2.3.Nearshore
13.5.1.3.China Wave Energy Converter Market Revenue (US$ Mn) and Forecasts, By Application
13.5.1.3.1.Electricity Generation
13.5.1.3.2.Desalination
13.5.1.3.3.Coastal Protection
13.5.1.3.4.Other
13.5.2.Japan
13.5.2.1.Japan Wave Energy Converter Market Revenue (US$ Mn) and Forecasts, By Type
13.5.2.1.1.Attenuator
13.5.2.1.2.Point Absorber
13.5.2.1.3.Oscillating Wave Surge Converter
13.5.2.1.4.Oscillating Water Column
13.5.2.1.5.Overtopping Device
13.5.2.1.6.Bulge Wave
13.5.2.1.7.Rotating Mass
13.5.2.1.8.Other
13.5.2.2.Japan Wave Energy Converter Market Revenue (US$ Mn) and Forecasts, By Location
13.5.2.2.1.Onshore
13.5.2.2.2.Offshore
13.5.2.2.3.Nearshore
13.5.2.3.Japan Wave Energy Converter Market Revenue (US$ Mn) and Forecasts, By Application
13.5.2.3.1.Electricity Generation
13.5.2.3.2.Desalination
13.5.2.3.3.Coastal Protection
13.5.2.3.4.Other
13.5.3.India
13.5.3.1.India Wave Energy Converter Market Revenue (US$ Mn) and Forecasts, By Type
13.5.3.1.1.Attenuator
13.5.3.1.2.Point Absorber
13.5.3.1.3.Oscillating Wave Surge Converter
13.5.3.1.4.Oscillating Water Column
13.5.3.1.5.Overtopping Device
13.5.3.1.6.Bulge Wave
13.5.3.1.7.Rotating Mass
13.5.3.1.8.Other
13.5.3.2.India Wave Energy Converter Market Revenue (US$ Mn) and Forecasts, By Location
13.5.3.2.1.Onshore
13.5.3.2.2.Offshore
13.5.3.2.3.Nearshore
13.5.3.3.India Wave Energy Converter Market Revenue (US$ Mn) and Forecasts, By Application
13.5.3.3.1.Electricity Generation
13.5.3.3.2.Desalination
13.5.3.3.3.Coastal Protection
13.5.3.3.4.Other
13.5.4.New Zealand
13.5.4.1.New Zealand Wave Energy Converter Market Revenue (US$ Mn) and Forecasts, By Type
13.5.4.1.1.Attenuator
13.5.4.1.2.Point Absorber
13.5.4.1.3.Oscillating Wave Surge Converter
13.5.4.1.4.Oscillating Water Column
13.5.4.1.5.Overtopping Device
13.5.4.1.6.Bulge Wave
13.5.4.1.7.Rotating Mass
13.5.4.1.8.Other
13.5.4.2.New Zealand Wave Energy Converter Market Revenue (US$ Mn) and Forecasts, By Location
13.5.4.2.1.Onshore
13.5.4.2.2.Offshore
13.5.4.2.3.Nearshore
13.5.4.3.New Zealand Wave Energy Converter Market Revenue (US$ Mn) and Forecasts, By Application
13.5.4.3.1.Electricity Generation
13.5.4.3.2.Desalination
13.5.4.3.3.Coastal Protection
13.5.4.3.4.Other
13.5.5.Australia
13.5.5.1.Australia Wave Energy Converter Market Revenue (US$ Mn) and Forecasts, By Type
13.5.5.1.1.Attenuator
13.5.5.1.2.Point Absorber
13.5.5.1.3.Oscillating Wave Surge Converter
13.5.5.1.4.Oscillating Water Column
13.5.5.1.5.Overtopping Device
13.5.5.1.6.Bulge Wave
13.5.5.1.7.Rotating Mass
13.5.5.1.8.Other
13.5.5.2.Australia Wave Energy Converter Market Revenue (US$ Mn) and Forecasts, By Location
13.5.5.2.1.Onshore
13.5.5.2.2.Offshore
13.5.5.2.3.Nearshore
13.5.5.3.Australia Wave Energy Converter Market Revenue (US$ Mn) and Forecasts, By Application
13.5.5.3.1.Electricity Generation
13.5.5.3.2.Desalination
13.5.5.3.3.Coastal Protection
13.5.5.3.4.Other
13.5.6.South Korea
13.5.6.1.South Korea Wave Energy Converter Market Revenue (US$ Mn) and Forecasts, By Type
13.5.6.1.1.Attenuator
13.5.6.1.2.Point Absorber
13.5.6.1.3.Oscillating Wave Surge Converter
13.5.6.1.4.Oscillating Water Column
13.5.6.1.5.Overtopping Device
13.5.6.1.6.Bulge Wave
13.5.6.1.7.Rotating Mass
13.5.6.1.8.Other
13.5.6.2.South Korea Wave Energy Converter Market Revenue (US$ Mn) and Forecasts, By Location
13.5.6.2.1.Onshore
13.5.6.2.2.Offshore
13.5.6.2.3.Nearshore
13.5.6.3.South Korea Wave Energy Converter Market Revenue (US$ Mn) and Forecasts, By Application
13.5.6.3.1.Electricity Generation
13.5.6.3.2.Desalination
13.5.6.3.3.Coastal Protection
13.5.6.3.4.Other
13.5.7.Southeast Asia
13.5.7.1.Southeast Asia Wave Energy Converter Market Revenue (US$ Mn) and Forecasts, By Type
13.5.7.1.1.Attenuator
13.5.7.1.2.Point Absorber
13.5.7.1.3.Oscillating Wave Surge Converter
13.5.7.1.4.Oscillating Water Column
13.5.7.1.5.Overtopping Device
13.5.7.1.6.Bulge Wave
13.5.7.1.7.Rotating Mass
13.5.7.1.8.Other
13.5.7.2.Southeast Asia Wave Energy Converter Market Revenue (US$ Mn) and Forecasts, By Location
13.5.7.2.1.Onshore
13.5.7.2.2.Offshore
13.5.7.2.3.Nearshore
13.5.7.3.Southeast Asia Wave Energy Converter Market Revenue (US$ Mn) and Forecasts, By Application
13.5.7.3.1.Electricity Generation
13.5.7.3.2.Desalination
13.5.7.3.3.Coastal Protection
13.5.7.3.4.Other
13.5.7.4.Southeast Asia Wave Energy Converter Market Revenue (US$ Mn) and Forecasts, By Country
13.5.7.4.1.Indonesia
13.5.7.4.2.Thailand
13.5.7.4.3.Malaysia
13.5.7.4.4.Singapore
13.5.7.4.5.Rest of Southeast Asia
13.5.8.Rest of Asia Pacific
13.5.8.1.Rest of Asia Pacific Wave Energy Converter Market Revenue (US$ Mn) and Forecasts, By Type
13.5.8.1.1.Attenuator
13.5.8.1.2.Point Absorber
13.5.8.1.3.Oscillating Wave Surge Converter
13.5.8.1.4.Oscillating Water Column
13.5.8.1.5.Overtopping Device
13.5.8.1.6.Bulge Wave
13.5.8.1.7.Rotating Mass
13.5.8.1.8.Other
13.5.8.2.Rest of Asia Pacific Wave Energy Converter Market Revenue (US$ Mn) and Forecasts, By Location
13.5.8.2.1.Onshore
13.5.8.2.2.Offshore
13.5.8.2.3.Nearshore
13.5.8.3.Rest of Asia Pacific Wave Energy Converter Market Revenue (US$ Mn) and Forecasts, By Application
13.5.8.3.1.Electricity Generation
13.5.8.3.2.Desalination
13.5.8.3.3.Coastal Protection
13.5.8.3.4.Other
13.6.Key Segment for Channeling Investments
13.6.1.By Country
13.6.2.By Type
13.6.3.By Location
13.6.4.By Application
14.Middle East and Africa Wave Energy Converter Market Analysis and Forecasts, 2024 – 2034
14.1.Overview
14.1.1.Middle East and Africa Wave Energy Converter Market Revenue (US$ Mn)
14.2.Middle East and Africa Wave Energy Converter Market Revenue (US$ Mn) and Forecasts, By Type
14.2.1.Attenuator
14.2.2.Point Absorber
14.2.3.Oscillating Wave Surge Converter
14.2.4.Oscillating Water Column
14.2.5.Overtopping Device
14.2.6.Bulge Wave
14.2.7.Rotating Mass
14.2.8.Other
14.3.Middle East and Africa Wave Energy Converter Market Revenue (US$ Mn) and Forecasts, By Location
14.3.1.Onshore
14.3.2.Offshore
14.3.3.Nearshore
14.4.Middle East and Africa Wave Energy Converter Market Revenue (US$ Mn) and Forecasts, By Application
14.4.1.Electricity Generation
14.4.2.Desalination
14.4.3.Coastal Protection
14.4.4.Other
14.5.Middle East and Africa Wave Energy Converter Market Revenue (US$ Mn) and Forecasts, By Country
14.5.1.Saudi Arabia
14.5.1.1.Saudi Arabia Wave Energy Converter Market Revenue (US$ Mn) and Forecasts, By Type
14.5.1.1.1.Attenuator
14.5.1.1.2.Point Absorber
14.5.1.1.3.Oscillating Wave Surge Converter
14.5.1.1.4.Oscillating Water Column
14.5.1.1.5.Overtopping Device
14.5.1.1.6.Bulge Wave
14.5.1.1.7.Rotating Mass
14.5.1.1.8.Other
14.5.1.2.Saudi Arabia Wave Energy Converter Market Revenue (US$ Mn) and Forecasts, By Location
14.5.1.2.1.Onshore
14.5.1.2.2.Offshore
14.5.1.2.3.Nearshore
14.5.1.3.Saudi Arabia Wave Energy Converter Market Revenue (US$ Mn) and Forecasts, By Application
14.5.1.3.1.Electricity Generation
14.5.1.3.2.Desalination
14.5.1.3.3.Coastal Protection
14.5.1.3.4.Other
14.5.2.UAE
14.5.2.1.UAE Wave Energy Converter Market Revenue (US$ Mn) and Forecasts, By Type
14.5.2.1.1.Attenuator
14.5.2.1.2.Point Absorber
14.5.2.1.3.Oscillating Wave Surge Converter
14.5.2.1.4.Oscillating Water Column
14.5.2.1.5.Overtopping Device
14.5.2.1.6.Bulge Wave
14.5.2.1.7.Rotating Mass
14.5.2.1.8.Other
14.5.2.2.UAE Wave Energy Converter Market Revenue (US$ Mn) and Forecasts, By Location
14.5.2.2.1.Onshore
14.5.2.2.2.Offshore
14.5.2.2.3.Nearshore
14.5.2.3.UAE Wave Energy Converter Market Revenue (US$ Mn) and Forecasts, By Application
14.5.2.3.1.Electricity Generation
14.5.2.3.2.Desalination
14.5.2.3.3.Coastal Protection
14.5.2.3.4.Other
14.5.3.Egypt
14.5.3.1.Egypt Wave Energy Converter Market Revenue (US$ Mn) and Forecasts, By Type
14.5.3.1.1.Attenuator
14.5.3.1.2.Point Absorber
14.5.3.1.3.Oscillating Wave Surge Converter
14.5.3.1.4.Oscillating Water Column
14.5.3.1.5.Overtopping Device
14.5.3.1.6.Bulge Wave
14.5.3.1.7.Rotating Mass
14.5.3.1.8.Other
14.5.3.2.Egypt Wave Energy Converter Market Revenue (US$ Mn) and Forecasts, By Location
14.5.3.2.1.Onshore
14.5.3.2.2.Offshore
14.5.3.2.3.Nearshore
14.5.3.3.Egypt Wave Energy Converter Market Revenue (US$ Mn) and Forecasts, By Application
14.5.3.3.1.Electricity Generation
14.5.3.3.2.Desalination
14.5.3.3.3.Coastal Protection
14.5.3.3.4.Other
14.5.4.Kuwait
14.5.4.1.Kuwait Wave Energy Converter Market Revenue (US$ Mn) and Forecasts, By Type
14.5.4.1.1.Attenuator
14.5.4.1.2.Point Absorber
14.5.4.1.3.Oscillating Wave Surge Converter
14.5.4.1.4.Oscillating Water Column
14.5.4.1.5.Overtopping Device
14.5.4.1.6.Bulge Wave
14.5.4.1.7.Rotating Mass
14.5.4.1.8.Other
14.5.4.2.Kuwait Wave Energy Converter Market Revenue (US$ Mn) and Forecasts, By Location
14.5.4.2.1.Onshore
14.5.4.2.2.Offshore
14.5.4.2.3.Nearshore
14.5.4.3.Kuwait Wave Energy Converter Market Revenue (US$ Mn) and Forecasts, By Application
14.5.4.3.1.Electricity Generation
14.5.4.3.2.Desalination
14.5.4.3.3.Coastal Protection
14.5.4.3.4.Other
14.5.5.South Africa
14.5.5.1.South Africa Wave Energy Converter Market Revenue (US$ Mn) and Forecasts, By Type
14.5.5.1.1.Attenuator
14.5.5.1.2.Point Absorber
14.5.5.1.3.Oscillating Wave Surge Converter
14.5.5.1.4.Oscillating Water Column
14.5.5.1.5.Overtopping Device
14.5.5.1.6.Bulge Wave
14.5.5.1.7.Rotating Mass
14.5.5.1.8.Other
14.5.5.2.South Africa Wave Energy Converter Market Revenue (US$ Mn) and Forecasts, By Location
14.5.5.2.1.Onshore
14.5.5.2.2.Offshore
14.5.5.2.3.Nearshore
14.5.5.3.South Africa Wave Energy Converter Market Revenue (US$ Mn) and Forecasts, By Application
14.5.5.3.1.Electricity Generation
14.5.5.3.2.Desalination
14.5.5.3.3.Coastal Protection
14.5.5.3.4.Other
14.5.6.Rest of Middle East & Africa
14.5.6.1.Rest of Middle East & Africa Wave Energy Converter Market Revenue (US$ Mn) and Forecasts, By Type
14.5.6.1.1.Attenuator
14.5.6.1.2.Point Absorber
14.5.6.1.3.Oscillating Wave Surge Converter
14.5.6.1.4.Oscillating Water Column
14.5.6.1.5.Overtopping Device
14.5.6.1.6.Bulge Wave
14.5.6.1.7.Rotating Mass
14.5.6.1.8.Other
14.5.6.2.Rest of Middle East & Africa Wave Energy Converter Market Revenue (US$ Mn) and Forecasts, By Location
14.5.6.2.1.Onshore
14.5.6.2.2.Offshore
14.5.6.2.3.Nearshore
14.5.6.3.Rest of Middle East & Africa Wave Energy Converter Market Revenue (US$ Mn) and Forecasts, By Application
14.5.6.3.1.Electricity Generation
14.5.6.3.2.Desalination
14.5.6.3.3.Coastal Protection
14.5.6.3.4.Other
14.6.Key Segment for Channeling Investments
14.6.1.By Country
14.6.2.By Type
14.6.3.By Location
14.6.4.By Application
15.Latin America Wave Energy Converter Market Analysis and Forecasts, 2024 – 2034
15.1.Overview
15.1.1.Latin America Wave Energy Converter Market Revenue (US$ Mn)
15.2.Latin America Wave Energy Converter Market Revenue (US$ Mn) and Forecasts, By Type
15.2.1.Attenuator
15.2.2.Point Absorber
15.2.3.Oscillating Wave Surge Converter
15.2.4.Oscillating Water Column
15.2.5.Overtopping Device
15.2.6.Bulge Wave
15.2.7.Rotating Mass
15.2.8.Other
15.3.Latin America Wave Energy Converter Market Revenue (US$ Mn) and Forecasts, By Location
15.3.1.Onshore
15.3.2.Offshore
15.3.3.Nearshore
15.4.Latin America Wave Energy Converter Market Revenue (US$ Mn) and Forecasts, By Application
15.4.1.Electricity Generation
15.4.2.Desalination
15.4.3.Coastal Protection
15.4.4.Other
15.5.Latin America Wave Energy Converter Market Revenue (US$ Mn) and Forecasts, By Country
15.5.1.Brazil
15.5.1.1.Brazil Wave Energy Converter Market Revenue (US$ Mn) and Forecasts, By Type
15.5.1.1.1.Attenuator
15.5.1.1.2.Point Absorber
15.5.1.1.3.Oscillating Wave Surge Converter
15.5.1.1.4.Oscillating Water Column
15.5.1.1.5.Overtopping Device
15.5.1.1.6.Bulge Wave
15.5.1.1.7.Rotating Mass
15.5.1.1.8.Other
15.5.1.2.Brazil Wave Energy Converter Market Revenue (US$ Mn) and Forecasts, By Location
15.5.1.2.1.Onshore
15.5.1.2.2.Offshore
15.5.1.2.3.Nearshore
15.5.1.3.Brazil Wave Energy Converter Market Revenue (US$ Mn) and Forecasts, By Application
15.5.1.3.1.Electricity Generation
15.5.1.3.2.Desalination
15.5.1.3.3.Coastal Protection
15.5.1.3.4.Other
15.5.2.Argentina
15.5.2.1.Argentina Wave Energy Converter Market Revenue (US$ Mn) and Forecasts, By Type
15.5.2.1.1.Attenuator
15.5.2.1.2.Point Absorber
15.5.2.1.3.Oscillating Wave Surge Converter
15.5.2.1.4.Oscillating Water Column
15.5.2.1.5.Overtopping Device
15.5.2.1.6.Bulge Wave
15.5.2.1.7.Rotating Mass
15.5.2.1.8.Other
15.5.2.2.Argentina Wave Energy Converter Market Revenue (US$ Mn) and Forecasts, By Location
15.5.2.2.1.Onshore
15.5.2.2.2.Offshore
15.5.2.2.3.Nearshore
15.5.2.3.Argentina Wave Energy Converter Market Revenue (US$ Mn) and Forecasts, By Application
15.5.2.3.1.Electricity Generation
15.5.2.3.2.Desalination
15.5.2.3.3.Coastal Protection
15.5.2.3.4.Other
15.5.3.Rest of Latin America
15.5.3.1.Rest of Latin America Wave Energy Converter Market Revenue (US$ Mn) and Forecasts, By Type
15.5.3.1.1.Attenuator
15.5.3.1.2.Point Absorber
15.5.3.1.3.Oscillating Wave Surge Converter
15.5.3.1.4.Oscillating Water Column
15.5.3.1.5.Overtopping Device
15.5.3.1.6.Bulge Wave
15.5.3.1.7.Rotating Mass
15.5.3.1.8.Other
15.5.3.2.Rest of Latin America Wave Energy Converter Market Revenue (US$ Mn) and Forecasts, By Location
15.5.3.2.1.Onshore
15.5.3.2.2.Offshore
15.5.3.2.3.Nearshore
15.5.3.3.Rest of Latin America Wave Energy Converter Market Revenue (US$ Mn) and Forecasts, By Application
15.5.3.3.1.Electricity Generation
15.5.3.3.2.Desalination
15.5.3.3.3.Coastal Protection
15.5.3.3.4.Other
15.6.Key Segment for Channeling Investments
15.6.1.By Country
15.6.2.By Type
15.6.3.By Location
15.6.4.By Application
16.Competitive Benchmarking
16.1.Brand Benchmarking
16.2.Market Share Analysis, 2023
16.3.Global Presence and Growth Strategies
16.3.1.Mergers and Acquisitions
16.3.2.Product Launches
16.3.3.Investments Trends
16.3.4.R&D Initiatives
17.Player Profiles
17.1.Carnegie Clean Energy
17.1.1.Company Details
17.1.2.Company Overview
17.1.3.Product Offerings
17.1.4.Key Developments
17.1.5.Financial Analysis
17.1.6.SWOT Analysis
17.1.7.Business Strategies
17.2.CorPower Ocean
17.2.1.Company Details
17.2.2.Company Overview
17.2.3.Product Offerings
17.2.4.Key Developments
17.2.5.Financial Analysis
17.2.6.SWOT Analysis
17.2.7.Business Strategies
17.3.Eco Wave Power
17.3.1.Company Details
17.3.2.Company Overview
17.3.3.Product Offerings
17.3.4.Key Developments
17.3.5.Financial Analysis
17.3.6.SWOT Analysis
17.3.7.Business Strategies
17.4.NEMOS GmbH
17.4.1.Company Details
17.4.2.Company Overview
17.4.3.Product Offerings
17.4.4.Key Developments
17.4.5.Financial Analysis
17.4.6.SWOT Analysis
17.4.7.Business Strategies
17.5.Ocean Power Technologies
17.5.1.Company Details
17.5.2.Company Overview
17.5.3.Product Offerings
17.5.4.Key Developments
17.5.5.Financial Analysis
17.5.6.SWOT Analysis
17.5.7.Business Strategies
17.6.Oscilla Power, Inc.
17.6.1.Company Details
17.6.2.Company Overview
17.6.3.Product Offerings
17.6.4.Key Developments
17.6.5.Financial Analysis
17.6.6.SWOT Analysis
17.6.7.Business Strategies
17.7.Sea Wave Energy Limited
17.7.1.Company Details
17.7.2.Company Overview
17.7.3.Product Offerings
17.7.4.Key Developments
17.7.5.Financial Analysis
17.7.6.SWOT Analysis
17.7.7.Business Strategies
17.8.The LEANCON Wave Energy Device
17.8.1.Company Details
17.8.2.Company Overview
17.8.3.Product Offerings
17.8.4.Key Developments
17.8.5.Financial Analysis
17.8.6.SWOT Analysis
17.8.7.Business Strategies
17.9.Wave Dragon
17.9.1.Company Details
17.9.2.Company Overview
17.9.3.Product Offerings
17.9.4.Key Developments
17.9.5.Financial Analysis
17.9.6.SWOT Analysis
17.9.7.Business Strategies
17.10.Wave Star
17.10.1.Company Details
17.10.2.Company Overview
17.10.3.Product Offerings
17.10.4.Key Developments
17.10.5.Financial Analysis
17.10.6.SWOT Analysis
17.10.7.Business Strategies
17.11.Wello Oy
17.11.1.Company Details
17.11.2.Company Overview
17.11.3.Product Offerings
17.11.4.Key Developments
17.11.5.Financial Analysis
17.11.6.SWOT Analysis
17.11.7.Business Strategies
17.12.Other Industry Participants
18.Key Findings

.

Note: This ToC is tentative and can be changed according to the research study conducted during the course of report completion.

.

**Exclusive for Multi-User and Enterprise User.

Global Wave Energy Converter Market

By Type

  • Attenuator
  • Point absorber
  • Oscillating Wave Surge Converter
  • Oscillating water column
  • Overtopping device
  • Bulge Wave
  • Rotating mass
  • Other

By Location

  • Onshore
  • Offshore
  • Nearshore

By Application

  • Electricity Generation
  • Desalination
  • Coastal Protection
  • Others

By Region

  • North America (U.S., Canada, Mexico, Rest of North America)
  • Europe (France, The UK, Spain, Germany, Italy, Nordic Countries (Denmark, Finland, Iceland, Sweden, Norway), Benelux Union (Belgium, The Netherlands, Luxembourg), Rest of Europe)
  • Asia Pacific (China, Japan, India, New Zealand, Australia, South Korea, Southeast Asia (Indonesia, Thailand, Malaysia, Singapore, Rest of Southeast Asia), Rest of Asia Pacific)
  • Middle East & Africa (Saudi Arabia, UAE, Egypt, Kuwait, South Africa, Rest of Middle East & Africa)
  • Latin America (Brazil, Argentina, Rest of Latin America)


The Niche Research approach encompasses both primary and secondary research methods to provide comprehensive insights. While primary research is the cornerstone of our studies, we also incorporate secondary research sources such as company annual reports, premium industry databases, press releases, industry journals, and white papers.

Within our primary research, we actively engage with various industry stakeholders, conducting paid interviews and surveys. Our meticulous analysis extends to every market participant in major countries, allowing us to thoroughly examine their portfolios, calculate market shares, and segment revenues.

Our data collection primarily focuses on individual countries within our research scope, enabling us to estimate regional market sizes. Typically, we employ a bottom-up approach, meticulously tracking trends in different countries. We analyze growth drivers, constraints, technological innovations, and opportunities for each country, ultimately arriving at regional figures.Our process begins by examining the growth prospects of each country. Building upon these insights, we project growth and trends for the entire region. Finally, we utilize our proprietary model to refine estimations and forecasts.

Our data validation standards are integral to ensuring the reliability and accuracy of our research findings. Here’s a breakdown of our data validation processes and the stakeholders we engage with during our primary research:

  • Supply Side Analysis: We initiate a supply side analysis by directly contacting market participants, through telephonic interviews and questionnaires containing both open-ended and close-ended questions. We gather information on their portfolios, segment revenues, developments, and growth strategies.
  • Demand Side Analysis: To gain insights into adoption trends and consumer preferences, we reach out to target customers and users (non-vendors). This information forms a vital part of the qualitative analysis section of our reports, covering market dynamics, adoption trends, consumer behavior, spending patterns, and other related aspects.
  • Consultant Insights: We tap into the expertise of our partner consultants from around the world to obtain their unique viewpoints and perspectives. Their insights contribute to a well-rounded understanding of the markets under investigation.
  • In-House Validation: To ensure data accuracy and reliability, we conduct cross-validation of data points and information through our in-house team of consultants and utilize advanced data modeling tools for thorough verification.

The forecasts we provide are based on a comprehensive assessment of various factors, including:

  • Market Trends and Past Performance (Last Five Years): We accurately analyze market trends and performance data from preceding five years to identify historical patterns and understand the market’s evolution.
  • Historical Performance and Growth of Market Participants: We assess the historical performance and growth trajectories of key market participants. This analysis provides insights into the competitive landscape and individual company strategies.
  • Market Determinants Impact Analysis (Next Eight Years): We conduct a rigorous analysis of the factors that are projected to influence the market over the next eight years. This includes assessing both internal and external determinants that can shape market dynamics.
  • Drivers and Challenges for the Forecast Period:Identify the factors expected to drive market growth during the forecast period, as well as the challenges that the industry may face. This analysis aids in deriving an accurate growth rate projection.
  • New Acquisitions, Collaborations, or Partnerships: We keep a close watch on any new acquisitions, collaborations, or partnerships within the industry. These developments can have a significant impact on market dynamics and competitiveness.
  • Macro and Micro Factors Analysis:A thorough examination of both macro-level factors (e.g., economic trends, regulatory changes) and micro-level factors (e.g., technological advancements, consumer preferences) that may influence the market during the forecast period.
  • End-User Sentiment Analysis: To understand the market from the end-user perspective, we conduct sentiment analysis. This involves assessing the sentiment, preferences, and feedback of the end-users, which can provide valuable insights into market trends.
  • Perspective of Primary Participants: Insights gathered directly from primary research participants play a crucial role in shaping our forecasts. Their perspectives and experiences provide valuable qualitative data.
  • Year-on-Year Growth Trend: We utilize a year-on-year growth trend based on historical market growth and expected future trends. This helps in formulating our growth projections, aligning them with the market’s historical performance.

Research process adopted by TNR involves multiple stages, including data collection, validation, quality checks, and presentation. It’s crucial that the data and information we provide add value to your existing market understanding and expertise. We have also established partnerships with business consulting, research, and survey organizations across regions and globally to collaborate on regional analysis and data validation, ensuring the highest level of accuracy and reliability in our reports.


Procure Comprehensive Study of

Global Wave Energy Converter Market

Online Only

  • Online Access
  • Read Only File
  • Validity 3 Months
  • Print, Copy, Paste & Download
  • PPT, Excel
  • Cost-Free Report in the Next Update
$3300
Buy Now

Single User

  • Access to One User on One System
  • Read Only File
  • Validity 6 Months
  • Limited Print,Copy, Paste
  • PPT, Excel
  • Cost-Free Report in the Next Update
$4200
Buy Now

Multi User

  • Access to Fiver Users
  • PDF File
  • Validity 1 Year
  • Upto FivePrints
  • Cost-Free Report in the Next Update
  • PPT, Excel
$6000
Buy Now

Enterprise User

  • Access to Unlimited Users
  • PDF, PPT, Excel
  • Unlimited Validity, Prints&Downloads
  • 1 Hour Cost-Free & Dedicated Analyst Support
  • 10% Cost-Free Customization
  • Cost-Free Report Update Twice in a Year
  • Recommendations for Business Strategies
  • Authorization to Quote TNR, The Niche Research
$7300
Buy Now

Library Access

  • Online Access to Content Publications
  • Access Player Profiles Online
  • Get Immediate Access to Newly Added Content
  • Acquire 12 PDF Downloads
  • Acquire 5 Excel Data Sets
  • Gain Access to 290+ PDFs of Company Profiles
  • Round-the-clock Email and Phone Assistance
  • Dashboard Usage and Trends
  • Renewal & Upgrade Assistance
  • Assessing Customization Options and Alerts for New Reports
$10788
Buy Now
*Taxes/Fees, if applicable will be added during checkout. All prices in USD

Why TNR The Niche Research?

  • Unwavering Commitment to Excellence

  • Veteran Team of Researchers

  • Accurate and Timely Insights

  • Ethical Practices and Customized Service

  • Uninterrupted Availability Around the Clock

Scroll to Top