Global Wearable Computing Market Insights, Growth, Share, Size: By Product Type, By End Use, By Region & Segmental Forecast, 2023-2031, Comparative Analysis and Trends

  • Industry: Technology
  • Report ID: TNR-110-1005
  • Number of Pages: 420
  • Table/Charts : Yes
  • November, 2023
  • Base Year : 2024
  • No. of Companies : 15+
  • No. of Countries : 29
  • Views : 10105
  • Covid Impact Covered: Yes
  • War Impact Covered: Yes
  • Formats : PDF, Excel, PPT

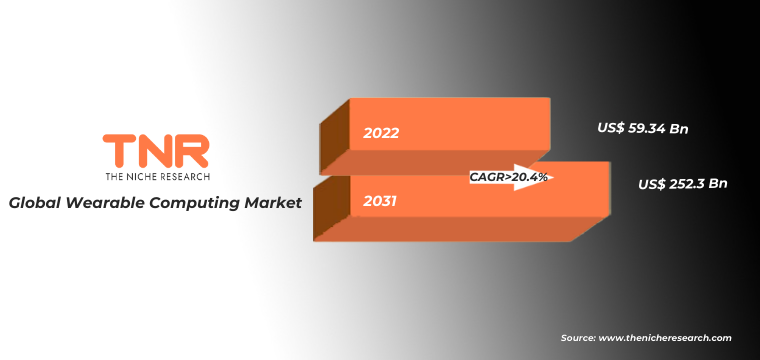
Global Wearable Computing Market Accounted for USD 59.34 Bn in 2022, Projected to Gain CAGR of 20.49% from 2023- 2031

Wearable computing is the use of a tiny, body-borne computer or sensory equipment that is worn on, over, beneath, or integrated into clothing.  Constant contact between the user and the computer, in which the computer “learns” what the user is experiencing at the time, and superimposes new information on that experience, is a goal of contemporary wearable computing design.

Global Wearable Computing Market Revenue & Forecast, (US$ Million), 2015 – 2031

Factors Driving the Global Wearable Computing Market

The rise of wearable computing market is driven by a combination of technological innovation, changing lifestyles, and the desire for seamless integration of technology into daily lives. Technological advancements have led to the development of smaller, more powerful components such as sensors, processors, and batteries. This miniaturization enables the integration of complex functionalities into compact wearable devices.

These more powerful wearable computing gadgets often allow the wearer to capture and view photographs or videos, read text messages and emails, reply to voice commands, surf the web, and do other things. While wearable computing devices are still in the realm of science fiction, rumoured gadgets like as Google Glass and the Apple iWatch may soon bring powerful wearable computing devices into the mainstream.

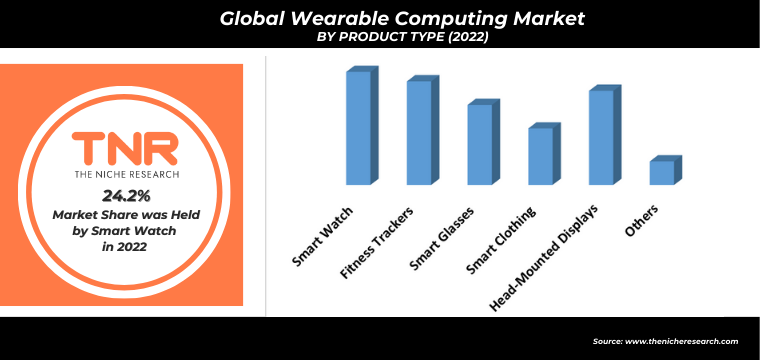
Smartwatches segment had highest share in the global wearable computing market. Smartwatches, fitness trackers, and VR/AR headsets have grown increasingly common in everyday lives in recent years. Wearables are expected to rise in popularity, so firms are naturally looking for new and imaginative ways to incorporate them into daily lives.

Wearable technology has grown into a significant trend in the fashion business in recent years. Electronics and computer technology are being integrated into clothes, accessories, and even implantable devices as part of wearable technology. Wearable technology has been used to develop a wide range of items, including smartwatches and smart jewellery, fitness trackers, and even garments that can measure health and well-being. For instance, Ford’s prototype’smart jacket’ for bikers.

The jacket contains sensors that wirelessly connect to the cyclist’s smartphone’s navigation software and sleeves that light up as the rider turns (making them more visible to traffic and pedestrians). Wearable computing in fashion have created new avenues for designers to customise items and have the potential to build a more sustainable future for the wearable computing market.

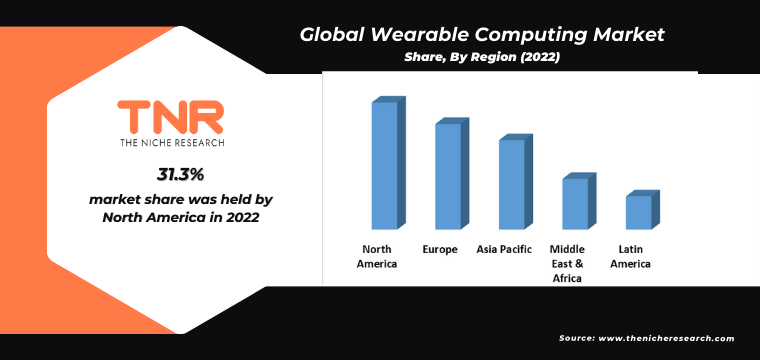
North America has been the leading regions in wearable computing market. The focus on health and wellness has been growing in North America, driving demand for wearable devices that can monitor physical activity, heart rate, sleep patterns, and other health metrics. Moreover the integration of wearable devices into healthcare and medical applications aligns with North America’s emphasis on improving healthcare outcomes through digital solutions. Many leading global technology companies are headquartered in North America. These companies, including Apple, Google, Fitbit (now owned by Google), and others, have played a pivotal role in shaping the wearable computing market. The region is likely to continue influencing the wearable computing market globally through technological advancements, user-centric design, and diverse applications.

Competitive Landscape

The report examines the market participants in the global wearable computing market in depth. In order to grow their market share and retain dominating positions in various areas, these companies are using various strategies such as new product releases, partnerships, expansion, joint ventures, agreements, and others. These players compete based on factors such as technological innovation, industry expertise, scalability, cost-effectiveness, and the ability to deliver tailored solutions.

Some of the players operating in the global wearable computing market are:

  • Apple Inc.
  • Catapult
  • Fitbit Inc.
  • Fujitsu Limited.
  • Garmin Ltd
  • GoPro Inc.
  • Huawei Technologies Co., Ltd
  • LG Electronics Inc.
  • Motorola
  • Samsung Electronics Co., Ltd
  • Seiko Epson Corporation.
  • Sensoria
  • Siemens
  • Vuzix Corporation.
  • Xiaomi Corporation
  • Zebra Technologies Corp
  • Other Industry Participants

Global Wearable Computing Market Report Coverage

Report Specifications Details
Market Revenue in 2022 US$ 59.34 Billion
Market Size Forecast by 2031 US$ 252.34 Billion
Growth Rate (CAGR) 20.49%
Historic Data 2015 – 2021
Base Year for Estimation 2022
Forecast Period 2023 – 2031
Report Inclusions Market Size & Estimates, Market Dynamics, Competitive Scenario, Trends, Growth Factors, Market Determinants, Key Investment Segmentation, Product/Service/Solutions Benchmarking
Segments Covered By Product Type, By End Use
Regions Covered North America, Europe, Asia Pacific, Middle East & Africa, Latin America
Countries Covered U.S., Canada, Mexico, Rest of North America,  France, The UK, Spain, Germany, Italy, Nordic Countries (Denmark, Finland, Iceland, Sweden, Norway), Benelux Union (Belgium, The Netherlands, Luxembourg), Rest of Europe,  China, Japan, India, New Zealand, Australia, South Korea, Southeast Asia (Indonesia, Thailand, Malaysia, Singapore, Rest of Southeast Asia), Rest of Asia Pacific,  Saudi Arabia, UAE, Egypt, Kuwait, South Africa, Rest of Middle East & Africa,  Brazil, Argentina, Rest of Latin America
Key Players Apple Inc. , Catapult, Fitbit Inc., Fujitsu Limited., Garmin Ltd, GoPro Inc., Huawei Technologies Co., Ltd, LG Electronics Inc., Motorola, Samsung Electronics Co., Ltd, Seiko Epson Corporation., Sensoria, Siemens, Vuzix Corporation., Xiaomi Corporation, Zebra Technologies Corp, Other Industry Participants
Customization Scope Customization allows for the inclusion/modification of content pertaining to geographical regions, countries, and specific market segments.
Pricing & Procurement Options Explore purchase options tailored to your specific research requirements
Contact Details Consult With Our Expert

Japan (Toll-Free): – +81 663-386-8111

South Korea (Toll-Free): – +82-808- 703-126

Saudi Arabia (Toll-Free): – +966 800 850 1643

United States: +1 302-232-5106

United Kingdom: +447537105080

E-mail:  askanexpert@thenicheresearch.com


Global Wearable Computing Market

By Product Type

  • Smart Watch
  • Fitness Trackers
  • Smart Glasses
  • Smart Clothing
  • Head-Mounted Displays
  • Others

By End Use

  • Healthcare
  • Entertainment and Gaming
  • Fashion
  • Automotive
  • Sports and Fitness
  • Military and Defense
  • IT and Telecommunication
  • Others

By Region

  • North America (U.S., Canada, Mexico, Rest of North America)
  • Europe (France, The UK, Spain, Germany, Italy, Nordic Countries (Denmark, Finland, Iceland, Sweden, Norway), Benelux Union (Belgium, The Netherlands, Luxembourg), Rest of Europe)
  • Asia Pacific (China, Japan, India, New Zealand, Australia, South Korea, Southeast Asia (Indonesia, Thailand, Malaysia, Singapore, Rest of Southeast Asia), Rest of Asia Pacific)
  • Middle East & Africa (Saudi Arabia, UAE, Egypt, Kuwait, South Africa, Rest of Middle East & Africa)
  • Latin America (Brazil, Argentina, Rest of Latin America)

Report Coverage and Deliverables: 

Common

Table of Contents

.

1.Market Scope
1.1.Market Segmentation
1.2.Years Considered
1.2.1.Historic Years: 2015 – 2021
1.2.2.Base Year: 2022
1.2.3.Forecast Years: 2023 – 2031
2.Key Target Audiences
3.Research Methodology
3.1.Primary Research
3.1.1.Research Questionnaire
3.1.2.Global Percentage Breakdown
3.1.3.Primary Interviews: Key Opinion Leaders (KOLs)
3.2.Secondary Research
3.2.1.Paid Databases
3.2.2.Secondary Sources
3.3.Market Size Estimates
3.3.1.Top-Down Approach
3.3.2.Bottom-Up Approach
3.4.Data Triangulation Methodology
3.5.Research Assumptions
4.Recommendations and Insights from TNR’s Perspective**
5.Holistic Overview of Wearable Computing Market
6.Market Synopsis: Wearable Computing Market
7.Wearable Computing Market Analysis: Qualitative Perspective
7.1.Introduction
7.1.1.Product Definition
7.1.2.Industry Development
7.2.Market Dynamics
7.2.1.Drivers
7.2.2.Restraints
7.2.3.Opportunities
7.3.Trends in Wearable Computing Market
7.4.Market Determinants Radar Chart
7.5.Macro-Economic and Micro-Economic Indicators: Wearable Computing Market
7.6.Porter’s Five Force Analysis
8.Global Wearable Computing Market Analysis and Forecasts, 2023 – 2031
8.1.Overview
8.1.1.Global Wearable Computing Market Revenue (US$ Mn)
8.2.Global Wearable Computing Market Revenue (US$ Mn) and Forecasts, By Product Type
8.2.1.Smart Watch
8.2.1.1.Definition
8.2.1.2.Market Estimation and Penetration, 2015 – 2022
8.2.1.3.Market Forecast, 2023 – 2031
8.2.1.4.Compound Annual Growth Rate (CAGR)
8.2.1.5.Regional Bifurcation
8.2.1.5.1.North America
8.2.1.5.1.1.Market Estimation, 2015 – 2022
8.2.1.5.1.2.Market Forecast, 2023 – 2031
8.2.1.5.2.Europe
8.2.1.5.2.1.Market Estimation, 2015 – 2022
8.2.1.5.2.2.Market Forecast, 2023 – 2031
8.2.1.5.3.Asia Pacific
8.2.1.5.3.1.Market Estimation, 2015 – 2022
8.2.1.5.3.2.Market Forecast, 2023 – 2031
8.2.1.5.4.Middle East and Africa
8.2.1.5.4.1.Market Estimation, 2015 – 2022
8.2.1.5.4.2.Market Forecast, 2023 – 2031
8.2.1.5.5.Latin America
8.2.1.5.5.1.Market Estimation, 2015 – 2022
8.2.1.5.5.2.Market Forecast, 2023 – 2031
8.2.2.Fitness Trackers
8.2.2.1.Definition
8.2.2.2.Market Estimation and Penetration, 2015 – 2022
8.2.2.3.Market Forecast, 2023 – 2031
8.2.2.4.Compound Annual Growth Rate (CAGR)
8.2.2.5.Regional Bifurcation
8.2.2.5.1.North America
8.2.2.5.1.1.Market Estimation, 2015 – 2022
8.2.2.5.1.2.Market Forecast, 2023 – 2031
8.2.2.5.2.Europe
8.2.2.5.2.1.Market Estimation, 2015 – 2022
8.2.2.5.2.2.Market Forecast, 2023 – 2031
8.2.2.5.3.Asia Pacific
8.2.2.5.3.1.Market Estimation, 2015 – 2022
8.2.2.5.3.2.Market Forecast, 2023 – 2031
8.2.2.5.4.Middle East and Africa
8.2.2.5.4.1.Market Estimation, 2015 – 2022
8.2.2.5.4.2.Market Forecast, 2023 – 2031
8.2.2.5.5.Latin America
8.2.2.5.5.1.Market Estimation, 2015 – 2022
8.2.2.5.5.2.Market Forecast, 2023 – 2031
8.2.3.Smart Glasses
8.2.3.1.Definition
8.2.3.2.Market Estimation and Penetration, 2015 – 2022
8.2.3.3.Market Forecast, 2023 – 2031
8.2.3.4.Compound Annual Growth Rate (CAGR)
8.2.3.5.Regional Bifurcation
8.2.3.5.1.North America
8.2.3.5.1.1.Market Estimation, 2015 – 2022
8.2.3.5.1.2.Market Forecast, 2023 – 2031
8.2.3.5.2.Europe
8.2.3.5.2.1.Market Estimation, 2015 – 2022
8.2.3.5.2.2.Market Forecast, 2023 – 2031
8.2.3.5.3.Asia Pacific
8.2.3.5.3.1.Market Estimation, 2015 – 2022
8.2.3.5.3.2.Market Forecast, 2023 – 2031
8.2.3.5.4.Middle East and Africa
8.2.3.5.4.1.Market Estimation, 2015 – 2022
8.2.3.5.4.2.Market Forecast, 2023 – 2031
8.2.3.5.5.Latin America
8.2.3.5.5.1.Market Estimation, 2015 – 2022
8.2.3.5.5.2.Market Forecast, 2023 – 2031
8.2.4.Smart Clothing
8.2.4.1.Definition
8.2.4.2.Market Estimation and Penetration, 2015 – 2022
8.2.4.3.Market Forecast, 2023 – 2031
8.2.4.4.Compound Annual Growth Rate (CAGR)
8.2.4.5.Regional Bifurcation
8.2.4.5.1.North America
8.2.4.5.1.1.Market Estimation, 2015 – 2022
8.2.4.5.1.2.Market Forecast, 2023 – 2031
8.2.4.5.2.Europe
8.2.4.5.2.1.Market Estimation, 2015 – 2022
8.2.4.5.2.2.Market Forecast, 2023 – 2031
8.2.4.5.3.Asia Pacific
8.2.4.5.3.1.Market Estimation, 2015 – 2022
8.2.4.5.3.2.Market Forecast, 2023 – 2031
8.2.4.5.4.Middle East and Africa
8.2.4.5.4.1.Market Estimation, 2015 – 2022
8.2.4.5.4.2.Market Forecast, 2023 – 2031
8.2.4.5.5.Latin America
8.2.4.5.5.1.Market Estimation, 2015 – 2022
8.2.4.5.5.2.Market Forecast, 2023 – 2031
8.2.5.Head-Mounted Displays
8.2.5.1.Definition
8.2.5.2.Market Estimation and Penetration, 2015 – 2022
8.2.5.3.Market Forecast, 2023 – 2031
8.2.5.4.Compound Annual Growth Rate (CAGR)
8.2.5.5.Regional Bifurcation
8.2.5.5.1.North America
8.2.5.5.1.1.Market Estimation, 2015 – 2022
8.2.5.5.1.2.Market Forecast, 2023 – 2031
8.2.5.5.2.Europe
8.2.5.5.2.1.Market Estimation, 2015 – 2022
8.2.5.5.2.2.Market Forecast, 2023 – 2031
8.2.5.5.3.Asia Pacific
8.2.5.5.3.1.Market Estimation, 2015 – 2022
8.2.5.5.3.2.Market Forecast, 2023 – 2031
8.2.5.5.4.Middle East and Africa
8.2.5.5.4.1.Market Estimation, 2015 – 2022
8.2.5.5.4.2.Market Forecast, 2023 – 2031
8.2.5.5.5.Latin America
8.2.5.5.5.1.Market Estimation, 2015 – 2022
8.2.5.5.5.2.Market Forecast, 2023 – 2031
8.2.6.Others
8.2.6.1.Definition
8.2.6.2.Market Estimation and Penetration, 2015 – 2022
8.2.6.3.Market Forecast, 2023 – 2031
8.2.6.4.Compound Annual Growth Rate (CAGR)
8.2.6.5.Regional Bifurcation
8.2.6.5.1.North America
8.2.6.5.1.1.Market Estimation, 2015 – 2022
8.2.6.5.1.2.Market Forecast, 2023 – 2031
8.2.6.5.2.Europe
8.2.6.5.2.1.Market Estimation, 2015 – 2022
8.2.6.5.2.2.Market Forecast, 2023 – 2031
8.2.6.5.3.Asia Pacific
8.2.6.5.3.1.Market Estimation, 2015 – 2022
8.2.6.5.3.2.Market Forecast, 2023 – 2031
8.2.6.5.4.Middle East and Africa
8.2.6.5.4.1.Market Estimation, 2015 – 2022
8.2.6.5.4.2.Market Forecast, 2023 – 2031
8.2.6.5.5.Latin America
8.2.6.5.5.1.Market Estimation, 2015 – 2022
8.2.6.5.5.2.Market Forecast, 2023 – 2031
8.3.Key Segment for Channeling Investments
8.3.1.By Product Type
9.Global Wearable Computing Market Analysis and Forecasts, 2023 – 2031
9.1.Overview
9.2.Global Wearable Computing Market Revenue (US$ Mn) and Forecasts, By End Use
9.2.1.Healthcare
9.2.1.1.Definition
9.2.1.2.Market Estimation and Penetration, 2015 – 2022
9.2.1.3.Market Forecast, 2023 – 2031
9.2.1.4.Compound Annual Growth Rate (CAGR)
9.2.1.5.Regional Bifurcation
9.2.1.5.1.North America
9.2.1.5.1.1.Market Estimation, 2015 – 2022
9.2.1.5.1.2.Market Forecast, 2023 – 2031
9.2.1.5.2.Europe
9.2.1.5.2.1.Market Estimation, 2015 – 2022
9.2.1.5.2.2.Market Forecast, 2023 – 2031
9.2.1.5.3.Asia Pacific
9.2.1.5.3.1.Market Estimation, 2015 – 2022
9.2.1.5.3.2.Market Forecast, 2023 – 2031
9.2.1.5.4.Middle East and Africa
9.2.1.5.4.1.Market Estimation, 2015 – 2022
9.2.1.5.4.2.Market Forecast, 2023 – 2031
9.2.1.5.5.Latin America
9.2.1.5.5.1.Market Estimation, 2015 – 2022
9.2.1.5.5.2.Market Forecast, 2023 – 2031
9.2.2.Entertainment and Gaming
9.2.2.1.Definition
9.2.2.2.Market Estimation and Penetration, 2015 – 2022
9.2.2.3.Market Forecast, 2023 – 2031
9.2.2.4.Compound Annual Growth Rate (CAGR)
9.2.2.5.Regional Bifurcation
9.2.2.5.1.North America
9.2.2.5.1.1.Market Estimation, 2015 – 2022
9.2.2.5.1.2.Market Forecast, 2023 – 2031
9.2.2.5.2.Europe
9.2.2.5.2.1.Market Estimation, 2015 – 2022
9.2.2.5.2.2.Market Forecast, 2023 – 2031
9.2.2.5.3.Asia Pacific
9.2.2.5.3.1.Market Estimation, 2015 – 2022
9.2.2.5.3.2.Market Forecast, 2023 – 2031
9.2.2.5.4.Middle East and Africa
9.2.2.5.4.1.Market Estimation, 2015 – 2022
9.2.2.5.4.2.Market Forecast, 2023 – 2031
9.2.2.5.5.Latin America
9.2.2.5.5.1.Market Estimation, 2015 – 2022
9.2.2.5.5.2.Market Forecast, 2023 – 2031
9.2.3.Fashion
9.2.3.1.Definition
9.2.3.2.Market Estimation and Penetration, 2015 – 2022
9.2.3.3.Market Forecast, 2023 – 2031
9.2.3.4.Compound Annual Growth Rate (CAGR)
9.2.3.5.Regional Bifurcation
9.2.3.5.1.North America
9.2.3.5.1.1.Market Estimation, 2015 – 2022
9.2.3.5.1.2.Market Forecast, 2023 – 2031
9.2.3.5.2.Europe
9.2.3.5.2.1.Market Estimation, 2015 – 2022
9.2.3.5.2.2.Market Forecast, 2023 – 2031
9.2.3.5.3.Asia Pacific
9.2.3.5.3.1.Market Estimation, 2015 – 2022
9.2.3.5.3.2.Market Forecast, 2023 – 2031
9.2.3.5.4.Middle East and Africa
9.2.3.5.4.1.Market Estimation, 2015 – 2022
9.2.3.5.4.2.Market Forecast, 2023 – 2031
9.2.3.5.5.Latin America
9.2.3.5.5.1.Market Estimation, 2015 – 2022
9.2.3.5.5.2.Market Forecast, 2023 – 2031
9.2.4.Automotive
9.2.4.1.Definition
9.2.4.2.Market Estimation and Penetration, 2015 – 2022
9.2.4.3.Market Forecast, 2023 – 2031
9.2.4.4.Compound Annual Growth Rate (CAGR)
9.2.4.5.Regional Bifurcation
9.2.4.5.1.North America
9.2.4.5.1.1.Market Estimation, 2015 – 2022
9.2.4.5.1.2.Market Forecast, 2023 – 2031
9.2.4.5.2.Europe
9.2.4.5.2.1.Market Estimation, 2015 – 2022
9.2.4.5.2.2.Market Forecast, 2023 – 2031
9.2.4.5.3.Asia Pacific
9.2.4.5.3.1.Market Estimation, 2015 – 2022
9.2.4.5.3.2.Market Forecast, 2023 – 2031
9.2.4.5.4.Middle East and Africa
9.2.4.5.4.1.Market Estimation, 2015 – 2022
9.2.4.5.4.2.Market Forecast, 2023 – 2031
9.2.4.5.5.Latin America
9.2.4.5.5.1.Market Estimation, 2015 – 2022
9.2.4.5.5.2.Market Forecast, 2023 – 2031
9.2.5.Military and Defense
9.2.5.1.Definition
9.2.5.2.Market Estimation and Penetration, 2015 – 2022
9.2.5.3.Market Forecast, 2023 – 2031
9.2.5.4.Compound Annual Growth Rate (CAGR)
9.2.5.5.Regional Bifurcation
9.2.5.5.1.North America
9.2.5.5.1.1.Market Estimation, 2015 – 2022
9.2.5.5.1.2.Market Forecast, 2023 – 2031
9.2.5.5.2.Europe
9.2.5.5.2.1.Market Estimation, 2015 – 2022
9.2.5.5.2.2.Market Forecast, 2023 – 2031
9.2.5.5.3.Asia Pacific
9.2.5.5.3.1.Market Estimation, 2015 – 2022
9.2.5.5.3.2.Market Forecast, 2023 – 2031
9.2.5.5.4.Middle East and Africa
9.2.5.5.4.1.Market Estimation, 2015 – 2022
9.2.5.5.4.2.Market Forecast, 2023 – 2031
9.2.5.5.5.Latin America
9.2.5.5.5.1.Market Estimation, 2015 – 2022
9.2.5.5.5.2.Market Forecast, 2023 – 2031
9.2.6.IT and Telecommunication
9.2.6.1.Definition
9.2.6.2.Market Estimation and Penetration, 2015 – 2022
9.2.6.3.Market Forecast, 2023 – 2031
9.2.6.4.Compound Annual Growth Rate (CAGR)
9.2.6.5.Regional Bifurcation
9.2.6.5.1.North America
9.2.6.5.1.1.Market Estimation, 2015 – 2022
9.2.6.5.1.2.Market Forecast, 2023 – 2031
9.2.6.5.2.Europe
9.2.6.5.2.1.Market Estimation, 2015 – 2022
9.2.6.5.2.2.Market Forecast, 2023 – 2031
9.2.6.5.3.Asia Pacific
9.2.6.5.3.1.Market Estimation, 2015 – 2022
9.2.6.5.3.2.Market Forecast, 2023 – 2031
9.2.6.5.4.Middle East and Africa
9.2.6.5.4.1.Market Estimation, 2015 – 2022
9.2.6.5.4.2.Market Forecast, 2023 – 2031
9.2.6.5.5.Latin America
9.2.6.5.5.1.Market Estimation, 2015 – 2022
9.2.6.5.5.2.Market Forecast, 2023 – 2031
9.2.7.Others
9.2.7.1.Definition
9.2.7.2.Market Estimation and Penetration, 2015 – 2022
9.2.7.3.Market Forecast, 2023 – 2031
9.2.7.4.Compound Annual Growth Rate (CAGR)
9.2.7.5.Regional Bifurcation
9.2.7.5.1.North America
9.2.7.5.1.1.Market Estimation, 2015 – 2022
9.2.7.5.1.2.Market Forecast, 2023 – 2031
9.2.7.5.2.Europe
9.2.7.5.2.1.Market Estimation, 2015 – 2022
9.2.7.5.2.2.Market Forecast, 2023 – 2031
9.2.7.5.3.Asia Pacific
9.2.7.5.3.1.Market Estimation, 2015 – 2022
9.2.7.5.3.2.Market Forecast, 2023 – 2031
9.2.7.5.4.Middle East and Africa
9.2.7.5.4.1.Market Estimation, 2015 – 2022
9.2.7.5.4.2.Market Forecast, 2023 – 2031
9.2.7.5.5.Latin America
9.2.7.5.5.1.Market Estimation, 2015 – 2022
9.2.7.5.5.2.Market Forecast, 2023 – 2031
9.3.Key Segment for Channeling Investments
9.3.1.By End Use
10.North America Wearable Computing Market Analysis and Forecasts, 2023 – 2031
10.1.Overview
10.1.1.North America Wearable Computing Market Revenue (US$ Mn)
10.2.North America Wearable Computing Market Revenue (US$ Mn) and Forecasts, By Product Type
10.2.1.Smart Watch
10.2.2.Fitness Trackers
10.2.3.Smart Glasses
10.2.4.Smart Clothing
10.2.5.Head-Mounted Displays
10.2.6.Others
10.3.North America Wearable Computing Market Revenue (US$ Mn) and Forecasts, By End Use
10.3.1.Healthcare
10.3.2.Entertainment and Gaming
10.3.3.Fashion
10.3.4.Automotive
10.3.5.Military and Defense
10.3.6.IT and Telecommunication
10.3.7.Others
10.4.North America Wearable Computing Market Revenue (US$ Mn) and Forecasts, By Country
10.4.1.U.S
10.4.1.1.U.S Wearable Computing Market Revenue (US$ Mn) and Forecasts, By Product Type
10.4.1.1.1.Smart Watch
10.4.1.1.2.Fitness Trackers
10.4.1.1.3.Smart Glasses
10.4.1.1.4.Smart Clothing
10.4.1.1.5.Head-Mounted Displays
10.4.1.1.6.Others
10.4.1.2.U.S Wearable Computing Market Revenue (US$ Mn) and Forecasts, By End Use
10.4.1.2.1.Healthcare
10.4.1.2.2.Entertainment and Gaming
10.4.1.2.3.Fashion
10.4.1.2.4.Automotive
10.4.1.2.5.Military and Defense
10.4.1.2.6.IT and Telecommunication
10.4.1.2.7.Others
10.4.2.Canada
10.4.2.1.Canada Wearable Computing Market Revenue (US$ Mn) and Forecasts, By Product Type
10.4.2.1.1.Smart Watch
10.4.2.1.2.Fitness Trackers
10.4.2.1.3.Smart Glasses
10.4.2.1.4.Smart Clothing
10.4.2.1.5.Head-Mounted Displays
10.4.2.1.6.Others
10.4.2.2.Canada Wearable Computing Market Revenue (US$ Mn) and Forecasts, By End Use
10.4.2.2.1.Healthcare
10.4.2.2.2.Entertainment and Gaming
10.4.2.2.3.Fashion
10.4.2.2.4.Automotive
10.4.2.2.5.Military and Defense
10.4.2.2.6.IT and Telecommunication
10.4.2.2.7.Others
10.4.3.Mexico
10.4.3.1.Mexico Wearable Computing Market Revenue (US$ Mn) and Forecasts, By Product Type
10.4.3.1.1.Smart Watch
10.4.3.1.2.Fitness Trackers
10.4.3.1.3.Smart Glasses
10.4.3.1.4.Smart Clothing
10.4.3.1.5.Head-Mounted Displays
10.4.3.1.6.Others
10.4.3.2.Mexico Wearable Computing Market Revenue (US$ Mn) and Forecasts, By End Use
10.4.3.2.1.Healthcare
10.4.3.2.2.Entertainment and Gaming
10.4.3.2.3.Fashion
10.4.3.2.4.Automotive
10.4.3.2.5.Military and Defense
10.4.3.2.6.IT and Telecommunication
10.4.3.2.7.Others
10.4.4.Rest of North America
10.4.4.1.Rest of North America Wearable Computing Market Revenue (US$ Mn) and Forecasts, By Product Type
10.4.4.1.1.Smart Watch
10.4.4.1.2.Fitness Trackers
10.4.4.1.3.Smart Glasses
10.4.4.1.4.Smart Clothing
10.4.4.1.5.Head-Mounted Displays
10.4.4.1.6.Others
10.4.4.2.Rest of North America Wearable Computing Market Revenue (US$ Mn) and Forecasts, By End Use
10.4.4.2.1.Healthcare
10.4.4.2.2.Entertainment and Gaming
10.4.4.2.3.Fashion
10.4.4.2.4.Automotive
10.4.4.2.5.Military and Defense
10.4.4.2.6.IT and Telecommunication
10.4.4.2.7.Others
10.5.Key Segment for Channeling Investments
10.5.1.By Country
10.5.2.By Product Type
10.5.3.By End Use
11.Europe Wearable Computing Market Analysis and Forecasts, 2023 – 2031
11.1.Overview
11.1.1.Europe Wearable Computing Market Revenue (US$ Mn)
11.2.Europe Wearable Computing Market Revenue (US$ Mn) and Forecasts, By Product Type
11.2.1.Smart Watch
11.2.2.Fitness Trackers
11.2.3.Smart Glasses
11.2.4.Smart Clothing
11.2.5.Head-Mounted Displays
11.2.6.Others
11.3.Europe Wearable Computing Market Revenue (US$ Mn) and Forecasts, By End Use
11.3.1.Healthcare
11.3.2.Entertainment and Gaming
11.3.3.Fashion
11.3.4.Automotive
11.3.5.Military and Defense
11.3.6.IT and Telecommunication
11.3.7.Others
11.4.Europe Wearable Computing Market Revenue (US$ Mn) and Forecasts, By Country
11.4.1.France
11.4.1.1.France Wearable Computing Market Revenue (US$ Mn) and Forecasts, By Product Type
11.4.1.1.1.Smart Watch
11.4.1.1.2.Fitness Trackers
11.4.1.1.3.Smart Glasses
11.4.1.1.4.Smart Clothing
11.4.1.1.5.Head-Mounted Displays
11.4.1.1.6.Others
11.4.1.2.France Wearable Computing Market Revenue (US$ Mn) and Forecasts, By End Use
11.4.1.2.1.Healthcare
11.4.1.2.2.Entertainment and Gaming
11.4.1.2.3.Fashion
11.4.1.2.4.Automotive
11.4.1.2.5.Military and Defense
11.4.1.2.6.IT and Telecommunication
11.4.1.2.7.Others
11.4.2.The UK
11.4.2.1.The UK Wearable Computing Market Revenue (US$ Mn) and Forecasts, By Product Type
11.4.2.1.1.Smart Watch
11.4.2.1.2.Fitness Trackers
11.4.2.1.3.Smart Glasses
11.4.2.1.4.Smart Clothing
11.4.2.1.5.Head-Mounted Displays
11.4.2.1.6.Others
11.4.2.2.The UK Wearable Computing Market Revenue (US$ Mn) and Forecasts, By End Use
11.4.2.2.1.Healthcare
11.4.2.2.2.Entertainment and Gaming
11.4.2.2.3.Fashion
11.4.2.2.4.Automotive
11.4.2.2.5.Military and Defense
11.4.2.2.6.IT and Telecommunication
11.4.2.2.7.Others
11.4.3.Spain
11.4.3.1.Spain Wearable Computing Market Revenue (US$ Mn) and Forecasts, By Product Type
11.4.3.1.1.Smart Watch
11.4.3.1.2.Fitness Trackers
11.4.3.1.3.Smart Glasses
11.4.3.1.4.Smart Clothing
11.4.3.1.5.Head-Mounted Displays
11.4.3.1.6.Others
11.4.3.2.Spain Wearable Computing Market Revenue (US$ Mn) and Forecasts, By End Use
11.4.3.2.1.Healthcare
11.4.3.2.2.Entertainment and Gaming
11.4.3.2.3.Fashion
11.4.3.2.4.Automotive
11.4.3.2.5.Military and Defense
11.4.3.2.6.IT and Telecommunication
11.4.3.2.7.Others
11.4.4.Germany
11.4.4.1.Germany Wearable Computing Market Revenue (US$ Mn) and Forecasts, By Product Type
11.4.4.1.1.Smart Watch
11.4.4.1.2.Fitness Trackers
11.4.4.1.3.Smart Glasses
11.4.4.1.4.Smart Clothing
11.4.4.1.5.Head-Mounted Displays
11.4.4.1.6.Others
11.4.4.2.Germany Wearable Computing Market Revenue (US$ Mn) and Forecasts, By End Use
11.4.4.2.1.Healthcare
11.4.4.2.2.Entertainment and Gaming
11.4.4.2.3.Fashion
11.4.4.2.4.Automotive
11.4.4.2.5.Military and Defense
11.4.4.2.6.IT and Telecommunication
11.4.4.2.7.Others
11.4.5.Italy
11.4.5.1.Italy Wearable Computing Market Revenue (US$ Mn) and Forecasts, By Product Type
11.4.5.1.1.Smart Watch
11.4.5.1.2.Fitness Trackers
11.4.5.1.3.Smart Glasses
11.4.5.1.4.Smart Clothing
11.4.5.1.5.Head-Mounted Displays
11.4.5.1.6.Others
11.4.5.2.Italy Wearable Computing Market Revenue (US$ Mn) and Forecasts, By End Use
11.4.5.2.1.Healthcare
11.4.5.2.2.Entertainment and Gaming
11.4.5.2.3.Fashion
11.4.5.2.4.Automotive
11.4.5.2.5.Military and Defense
11.4.5.2.6.IT and Telecommunication
11.4.5.2.7.Others
11.4.6.Nordic Countries
11.4.6.1.Nordic Countries Wearable Computing Market Revenue (US$ Mn) and Forecasts, By Product Type
11.4.6.1.1.Smart Watch
11.4.6.1.2.Fitness Trackers
11.4.6.1.3.Smart Glasses
11.4.6.1.4.Smart Clothing
11.4.6.1.5.Head-Mounted Displays
11.4.6.1.6.Others
11.4.6.2.Nordic Countries Wearable Computing Market Revenue (US$ Mn) and Forecasts, By End Use
11.4.6.2.1.Healthcare
11.4.6.2.2.Entertainment and Gaming
11.4.6.2.3.Fashion
11.4.6.2.4.Automotive
11.4.6.2.5.Military and Defense
11.4.6.2.6.IT and Telecommunication
11.4.6.2.7.Others
11.4.6.3.Nordic Countries Wearable Computing Market Revenue (US$ Mn) and Forecasts, By Country
11.4.6.3.1.Denmark
11.4.6.3.2.Finland
11.4.6.3.3.Iceland
11.4.6.3.4.Sweden
11.4.6.3.5.Norway
11.4.7.Benelux Union
11.4.7.1.Benelux Union Wearable Computing Market Revenue (US$ Mn) and Forecasts, By Product Type
11.4.7.1.1.Smart Watch
11.4.7.1.2.Fitness Trackers
11.4.7.1.3.Smart Glasses
11.4.7.1.4.Smart Clothing
11.4.7.1.5.Head-Mounted Displays
11.4.7.1.6.Others
11.4.7.2.Benelux Union Wearable Computing Market Revenue (US$ Mn) and Forecasts, By End Use
11.4.7.2.1.Healthcare
11.4.7.2.2.Entertainment and Gaming
11.4.7.2.3.Fashion
11.4.7.2.4.Automotive
11.4.7.2.5.Military and Defense
11.4.7.2.6.IT and Telecommunication
11.4.7.2.7.Others
11.4.7.3.Benelux Union Wearable Computing Market Revenue (US$ Mn) and Forecasts, By Country
11.4.7.3.1.Belgium
11.4.7.3.2.The Netherlands
11.4.7.3.3.Luxembourg
11.4.8.Rest of Europe
11.4.8.1.Rest of Europe Wearable Computing Market Revenue (US$ Mn) and Forecasts, By Product Type
11.4.8.1.1.Smart Watch
11.4.8.1.2.Fitness Trackers
11.4.8.1.3.Smart Glasses
11.4.8.1.4.Smart Clothing
11.4.8.1.5.Head-Mounted Displays
11.4.8.1.6.Others
11.4.8.2.Rest of Europe Wearable Computing Market Revenue (US$ Mn) and Forecasts, By End Use
11.4.8.2.1.Healthcare
11.4.8.2.2.Entertainment and Gaming
11.4.8.2.3.Fashion
11.4.8.2.4.Automotive
11.4.8.2.5.Military and Defense
11.4.8.2.6.IT and Telecommunication
11.4.8.2.7.Others
11.5.Key Segment for Channeling Investments
11.5.1.By Country
11.5.2.By Product Type
11.5.3.By End Use
12.Asia Pacific Wearable Computing Market Analysis and Forecasts, 2023 – 2031
12.1.Overview
12.1.1.Asia Pacific Wearable Computing Market Revenue (US$ Mn)
12.2.Asia Pacific Wearable Computing Market Revenue (US$ Mn) and Forecasts, By Product Type
12.2.1.Smart Watch
12.2.2.Fitness Trackers
12.2.3.Smart Glasses
12.2.4.Smart Clothing
12.2.5.Head-Mounted Displays
12.2.6.Others
12.3.Asia Pacific Wearable Computing Market Revenue (US$ Mn) and Forecasts, By End Use
12.3.1.Healthcare
12.3.2.Entertainment and Gaming
12.3.3.Fashion
12.3.4.Automotive
12.3.5.Military and Defense
12.3.6.IT and Telecommunication
12.3.7.Others
12.4.Asia Pacific Wearable Computing Market Revenue (US$ Mn) and Forecasts, By Country
12.4.1.China
12.4.1.1.China Wearable Computing Market Revenue (US$ Mn) and Forecasts, By Product Type
12.4.1.1.1.Smart Watch
12.4.1.1.2.Fitness Trackers
12.4.1.1.3.Smart Glasses
12.4.1.1.4.Smart Clothing
12.4.1.1.5.Head-Mounted Displays
12.4.1.1.6.Others
12.4.1.2.China Wearable Computing Market Revenue (US$ Mn) and Forecasts, By End Use
12.4.1.2.1.Healthcare
12.4.1.2.2.Entertainment and Gaming
12.4.1.2.3.Fashion
12.4.1.2.4.Automotive
12.4.1.2.5.Military and Defense
12.4.1.2.6.IT and Telecommunication
12.4.1.2.7.Others
12.4.2.Japan
12.4.2.1.Japan Wearable Computing Market Revenue (US$ Mn) and Forecasts, By Product Type
12.4.2.1.1.Smart Watch
12.4.2.1.2.Fitness Trackers
12.4.2.1.3.Smart Glasses
12.4.2.1.4.Smart Clothing
12.4.2.1.5.Head-Mounted Displays
12.4.2.1.6.Others
12.4.2.2.Japan Wearable Computing Market Revenue (US$ Mn) and Forecasts, By End Use
12.4.2.2.1.Healthcare
12.4.2.2.2.Entertainment and Gaming
12.4.2.2.3.Fashion
12.4.2.2.4.Automotive
12.4.2.2.5.Military and Defense
12.4.2.2.6.IT and Telecommunication
12.4.2.2.7.Others
12.4.3.India
12.4.3.1.India Wearable Computing Market Revenue (US$ Mn) and Forecasts, By Product Type
12.4.3.1.1.Smart Watch
12.4.3.1.2.Fitness Trackers
12.4.3.1.3.Smart Glasses
12.4.3.1.4.Smart Clothing
12.4.3.1.5.Head-Mounted Displays
12.4.3.1.6.Others
12.4.3.2.India Wearable Computing Market Revenue (US$ Mn) and Forecasts, By End Use
12.4.3.2.1.Healthcare
12.4.3.2.2.Entertainment and Gaming
12.4.3.2.3.Fashion
12.4.3.2.4.Automotive
12.4.3.2.5.Military and Defense
12.4.3.2.6.IT and Telecommunication
12.4.3.2.7.Others
12.4.4.New Zealand
12.4.4.1.New Zealand Wearable Computing Market Revenue (US$ Mn) and Forecasts, By Product Type
12.4.4.1.1.Smart Watch
12.4.4.1.2.Fitness Trackers
12.4.4.1.3.Smart Glasses
12.4.4.1.4.Smart Clothing
12.4.4.1.5.Head-Mounted Displays
12.4.4.1.6.Others
12.4.4.2.New Zealand Wearable Computing Market Revenue (US$ Mn) and Forecasts, By End Use
12.4.4.2.1.Healthcare
12.4.4.2.2.Entertainment and Gaming
12.4.4.2.3.Fashion
12.4.4.2.4.Automotive
12.4.4.2.5.Military and Defense
12.4.4.2.6.IT and Telecommunication
12.4.4.2.7.Others
12.4.5.Australia
12.4.5.1.Australia Wearable Computing Market Revenue (US$ Mn) and Forecasts, By Product Type
12.4.5.1.1.Smart Watch
12.4.5.1.2.Fitness Trackers
12.4.5.1.3.Smart Glasses
12.4.5.1.4.Smart Clothing
12.4.5.1.5.Head-Mounted Displays
12.4.5.1.6.Others
12.4.5.2.Australia Wearable Computing Market Revenue (US$ Mn) and Forecasts, By End Use
12.4.5.2.1.Healthcare
12.4.5.2.2.Entertainment and Gaming
12.4.5.2.3.Fashion
12.4.5.2.4.Automotive
12.4.5.2.5.Military and Defense
12.4.5.2.6.IT and Telecommunication
12.4.5.2.7.Others
12.4.6.South Korea
12.4.6.1.South Korea Wearable Computing Market Revenue (US$ Mn) and Forecasts, By Product Type
12.4.6.1.1.Smart Watch
12.4.6.1.2.Fitness Trackers
12.4.6.1.3.Smart Glasses
12.4.6.1.4.Smart Clothing
12.4.6.1.5.Head-Mounted Displays
12.4.6.1.6.Others
12.4.6.2.South Korea Wearable Computing Market Revenue (US$ Mn) and Forecasts, By End Use
12.4.6.2.1.Healthcare
12.4.6.2.2.Entertainment and Gaming
12.4.6.2.3.Fashion
12.4.6.2.4.Automotive
12.4.6.2.5.Military and Defense
12.4.6.2.6.IT and Telecommunication
12.4.6.2.7.Others
12.4.7.Southeast Asia
12.4.7.1.Southeast Asia Wearable Computing Market Revenue (US$ Mn) and Forecasts, By Product Type
12.4.7.1.1.Smart Watch
12.4.7.1.2.Fitness Trackers
12.4.7.1.3.Smart Glasses
12.4.7.1.4.Smart Clothing
12.4.7.1.5.Head-Mounted Displays
12.4.7.1.6.Others
12.4.7.2.Southeast Asia Wearable Computing Market Revenue (US$ Mn) and Forecasts, By End Use
12.4.7.2.1.Healthcare
12.4.7.2.2.Entertainment and Gaming
12.4.7.2.3.Fashion
12.4.7.2.4.Automotive
12.4.7.2.5.Military and Defense
12.4.7.2.6.IT and Telecommunication
12.4.7.2.7.Others
12.4.7.3.Southeast Asia Wearable Computing Market Revenue (US$ Mn) and Forecasts, By Country
12.4.7.3.1.Indonesia
12.4.7.3.2.Thailand
12.4.7.3.3.Malaysia
12.4.7.3.4.Singapore
12.4.7.3.5.Rest of Southeast Asia
12.4.8.Rest of Asia Pacific
12.4.8.1.Rest of Asia Pacific Wearable Computing Market Revenue (US$ Mn) and Forecasts, By Product Type
12.4.8.1.1.Smart Watch
12.4.8.1.2.Fitness Trackers
12.4.8.1.3.Smart Glasses
12.4.8.1.4.Smart Clothing
12.4.8.1.5.Head-Mounted Displays
12.4.8.1.6.Others
12.4.8.2.Rest of Asia Pacific Wearable Computing Market Revenue (US$ Mn) and Forecasts, By End Use
12.4.8.2.1.Healthcare
12.4.8.2.2.Entertainment and Gaming
12.4.8.2.3.Fashion
12.4.8.2.4.Automotive
12.4.8.2.5.Military and Defense
12.4.8.2.6.IT and Telecommunication
12.4.8.2.7.Others
12.5.Key Segment for Channeling Investments
12.5.1.By Country
12.5.2.By Product Type
12.5.3.By End Use
13.Middle East and Africa Wearable Computing Market Analysis and Forecasts, 2023 – 2031
13.1.Overview
13.1.1.Middle East and Africa Wearable Computing Market Revenue (US$ Mn)
13.2.Middle East and Africa Wearable Computing Market Revenue (US$ Mn) and Forecasts, By Product Type
13.2.1.Smart Watch
13.2.2.Fitness Trackers
13.2.3.Smart Glasses
13.2.4.Smart Clothing
13.2.5.Head-Mounted Displays
13.2.6.Others
13.3.Middle East and Africa Wearable Computing Market Revenue (US$ Mn) and Forecasts, By End Use
13.3.1.Healthcare
13.3.2.Entertainment and Gaming
13.3.3.Fashion
13.3.4.Automotive
13.3.5.Military and Defense
13.3.6.IT and Telecommunication
13.3.7.Others
13.4.Middle East and Africa Wearable Computing Market Revenue (US$ Mn) and Forecasts, By Country
13.4.1.Saudi Arabia
13.4.1.1.Saudi Arabia Wearable Computing Market Revenue (US$ Mn) and Forecasts, By Product Type
13.4.1.1.1.Smart Watch
13.4.1.1.2.Fitness Trackers
13.4.1.1.3.Smart Glasses
13.4.1.1.4.Smart Clothing
13.4.1.1.5.Head-Mounted Displays
13.4.1.1.6.Others
13.4.1.2.Saudi Arabia Wearable Computing Market Revenue (US$ Mn) and Forecasts, By End Use
13.4.1.2.1.Healthcare
13.4.1.2.2.Entertainment and Gaming
13.4.1.2.3.Fashion
13.4.1.2.4.Automotive
13.4.1.2.5.Military and Defense
13.4.1.2.6.IT and Telecommunication
13.4.1.2.7.Others
13.4.2.UAE
13.4.2.1.UAE Wearable Computing Market Revenue (US$ Mn) and Forecasts, By Product Type
13.4.2.1.1.Smart Watch
13.4.2.1.2.Fitness Trackers
13.4.2.1.3.Smart Glasses
13.4.2.1.4.Smart Clothing
13.4.2.1.5.Head-Mounted Displays
13.4.2.1.6.Others
13.4.2.2.UAE Wearable Computing Market Revenue (US$ Mn) and Forecasts, By End Use
13.4.2.2.1.Healthcare
13.4.2.2.2.Entertainment and Gaming
13.4.2.2.3.Fashion
13.4.2.2.4.Automotive
13.4.2.2.5.Military and Defense
13.4.2.2.6.IT and Telecommunication
13.4.2.2.7.Others
13.4.3.Egypt
13.4.3.1.Egypt Wearable Computing Market Revenue (US$ Mn) and Forecasts, By Product Type
13.4.3.1.1.Smart Watch
13.4.3.1.2.Fitness Trackers
13.4.3.1.3.Smart Glasses
13.4.3.1.4.Smart Clothing
13.4.3.1.5.Head-Mounted Displays
13.4.3.1.6.Others
13.4.3.2.Egypt Wearable Computing Market Revenue (US$ Mn) and Forecasts, By End Use
13.4.3.2.1.Healthcare
13.4.3.2.2.Entertainment and Gaming
13.4.3.2.3.Fashion
13.4.3.2.4.Automotive
13.4.3.2.5.Military and Defense
13.4.3.2.6.IT and Telecommunication
13.4.3.2.7.Others
13.4.4.Kuwait
13.4.4.1.Kuwait Wearable Computing Market Revenue (US$ Mn) and Forecasts, By Product Type
13.4.4.1.1.Smart Watch
13.4.4.1.2.Fitness Trackers
13.4.4.1.3.Smart Glasses
13.4.4.1.4.Smart Clothing
13.4.4.1.5.Head-Mounted Displays
13.4.4.1.6.Others
13.4.4.2.Kuwait Wearable Computing Market Revenue (US$ Mn) and Forecasts, By End Use
13.4.4.2.1.Healthcare
13.4.4.2.2.Entertainment and Gaming
13.4.4.2.3.Fashion
13.4.4.2.4.Automotive
13.4.4.2.5.Military and Defense
13.4.4.2.6.IT and Telecommunication
13.4.4.2.7.Others
13.4.5.South Africa
13.4.5.1.South Africa Wearable Computing Market Revenue (US$ Mn) and Forecasts, By Product Type
13.4.5.1.1.Smart Watch
13.4.5.1.2.Fitness Trackers
13.4.5.1.3.Smart Glasses
13.4.5.1.4.Smart Clothing
13.4.5.1.5.Head-Mounted Displays
13.4.5.1.6.Others
13.4.5.2.South Africa Wearable Computing Market Revenue (US$ Mn) and Forecasts, By End Use
13.4.5.2.1.Healthcare
13.4.5.2.2.Entertainment and Gaming
13.4.5.2.3.Fashion
13.4.5.2.4.Automotive
13.4.5.2.5.Military and Defense
13.4.5.2.6.IT and Telecommunication
13.4.5.2.7.Others
13.4.6.Rest of Middle East & Africa
13.4.6.1.Rest of Middle East & Africa Wearable Computing Market Revenue (US$ Mn) and Forecasts, By Product Type
13.4.6.1.1.Smart Watch
13.4.6.1.2.Fitness Trackers
13.4.6.1.3.Smart Glasses
13.4.6.1.4.Smart Clothing
13.4.6.1.5.Head-Mounted Displays
13.4.6.1.6.Others
13.4.6.2.Rest of Middle East & Africa Wearable Computing Market Revenue (US$ Mn) and Forecasts, By End Use
13.4.6.2.1.Healthcare
13.4.6.2.2.Entertainment and Gaming
13.4.6.2.3.Fashion
13.4.6.2.4.Automotive
13.4.6.2.5.Military and Defense
13.4.6.2.6.IT and Telecommunication
13.4.6.2.7.Others
13.5.Key Segment for Channeling Investments
13.5.1.By Country
13.5.2.By Product Type
13.5.3.By End Use
14.Latin America Wearable Computing Market Analysis and Forecasts, 2023 – 2031
14.1.Overview
14.1.1.Latin America Wearable Computing Market Revenue (US$ Mn)
14.2.Latin America Wearable Computing Market Revenue (US$ Mn) and Forecasts, By Product Type
14.2.1.Smart Watch
14.2.2.Fitness Trackers
14.2.3.Smart Glasses
14.2.4.Smart Clothing
14.2.5.Head-Mounted Displays
14.2.6.Others
14.3.Latin America Wearable Computing Market Revenue (US$ Mn) and Forecasts, By End Use
14.3.1.Healthcare
14.3.2.Entertainment and Gaming
14.3.3.Fashion
14.3.4.Automotive
14.3.5.Military and Defense
14.3.6.IT and Telecommunication
14.3.7.Others
14.4.Latin America Wearable Computing Market Revenue (US$ Mn) and Forecasts, By Country
14.4.1.Brazil
14.4.1.1.Brazil Wearable Computing Market Revenue (US$ Mn) and Forecasts, By Product Type
14.4.1.1.1.Smart Watch
14.4.1.1.2.Fitness Trackers
14.4.1.1.3.Smart Glasses
14.4.1.1.4.Smart Clothing
14.4.1.1.5.Head-Mounted Displays
14.4.1.1.6.Others
14.4.1.2.Brazil Wearable Computing Market Revenue (US$ Mn) and Forecasts, By End Use
14.4.1.2.1.Healthcare
14.4.1.2.2.Entertainment and Gaming
14.4.1.2.3.Fashion
14.4.1.2.4.Automotive
14.4.1.2.5.Military and Defense
14.4.1.2.6.IT and Telecommunication
14.4.1.2.7.Others
14.4.2.Argentina
14.4.2.1.Argentina Wearable Computing Market Revenue (US$ Mn) and Forecasts, By Product Type
14.4.2.1.1.Smart Watch
14.4.2.1.2.Fitness Trackers
14.4.2.1.3.Smart Glasses
14.4.2.1.4.Smart Clothing
14.4.2.1.5.Head-Mounted Displays
14.4.2.1.6.Others
14.4.2.2.Argentina Wearable Computing Market Revenue (US$ Mn) and Forecasts, By End Use
14.4.2.2.1.Healthcare
14.4.2.2.2.Entertainment and Gaming
14.4.2.2.3.Fashion
14.4.2.2.4.Automotive
14.4.2.2.5.Military and Defense
14.4.2.2.6.IT and Telecommunication
14.4.2.2.7.Others
14.4.3.Rest of Latin America
14.4.3.1.Rest of Latin America Wearable Computing Market Revenue (US$ Mn) and Forecasts, By Product Type
14.4.3.1.1.Smart Watch
14.4.3.1.2.Fitness Trackers
14.4.3.1.3.Smart Glasses
14.4.3.1.4.Smart Clothing
14.4.3.1.5.Head-Mounted Displays
14.4.3.1.6.Others
14.4.3.2.Rest of Latin America Wearable Computing Market Revenue (US$ Mn) and Forecasts, By End Use
14.4.3.2.1.Healthcare
14.4.3.2.2.Entertainment and Gaming
14.4.3.2.3.Fashion
14.4.3.2.4.Automotive
14.4.3.2.5.Military and Defense
14.4.3.2.6.IT and Telecommunication
14.4.3.2.7.Others
14.5.Key Segment for Channeling Investments
14.5.1.By Country
14.5.2.By Product Type
14.5.3.By End Use
15.Competitive Benchmarking
15.1.Market Share Analysis, 2022
15.2.Global Presence and Growth Strategies
15.2.1.Mergers and Acquisitions
15.2.2.Product Launches
15.2.3.Investments Trends
15.2.4.R&D Initiatives
16.Player Profiles
16.1.Apple Inc.
16.1.1.Company Details
16.1.2.Company Overview
16.1.3.Product Offerings
16.1.4.Key Developments
16.1.5.Financial Analysis
16.1.6.SWOT Analysis
16.1.7.Business Strategies
16.2.Catapult
16.2.1.Company Details
16.2.2.Company Overview
16.2.3.Product Offerings
16.2.4.Key Developments
16.2.5.Financial Analysis
16.2.6.SWOT Analysis
16.2.7.Business Strategies
16.3.Fitbit Inc.
16.3.1.Company Details
16.3.2.Company Overview
16.3.3.Product Offerings
16.3.4.Key Developments
16.3.5.Financial Analysis
16.3.6.SWOT Analysis
16.3.7.Business Strategies
16.4.Fujitsu Limited.
16.4.1.Company Details
16.4.2.Company Overview
16.4.3.Product Offerings
16.4.4.Key Developments
16.4.5.Financial Analysis
16.4.6.SWOT Analysis
16.4.7.Business Strategies
16.5.Garmin Ltd
16.5.1.Company Details
16.5.2.Company Overview
16.5.3.Product Offerings
16.5.4.Key Developments
16.5.5.Financial Analysis
16.5.6.SWOT Analysis
16.5.7.Business Strategies
16.6.GoPro Inc.
16.6.1.Company Details
16.6.2.Company Overview
16.6.3.Product Offerings
16.6.4.Key Developments
16.6.5.Financial Analysis
16.6.6.SWOT Analysis
16.6.7.Business Strategies
16.7.Huawei Technologies Co., Ltd
16.7.1.Company Details
16.7.2.Company Overview
16.7.3.Product Offerings
16.7.4.Key Developments
16.7.5.Financial Analysis
16.7.6.SWOT Analysis
16.7.7.Business Strategies
16.8.LG Electronics Inc.
16.8.1.Company Details
16.8.2.Company Overview
16.8.3.Product Offerings
16.8.4.Key Developments
16.8.5.Financial Analysis
16.8.6.SWOT Analysis
16.8.7.Business Strategies
16.9.Motorola
16.9.1.Company Details
16.9.2.Company Overview
16.9.3.Product Offerings
16.9.4.Key Developments
16.9.5.Financial Analysis
16.9.6.SWOT Analysis
16.9.7.Business Strategies
16.10.Samsung Electronics Co., Ltd
16.10.1.Company Details
16.10.2.Company Overview
16.10.3.Product Offerings
16.10.4.Key Developments
16.10.5.Financial Analysis
16.10.6.SWOT Analysis
16.10.7.Business Strategies
16.11.Seiko Epson Corporation.
16.11.1.Company Details
16.11.2.Company Overview
16.11.3.Product Offerings
16.11.4.Key Developments
16.11.5.Financial Analysis
16.11.6.SWOT Analysis
16.11.7.Business Strategies
16.12.Sensoria
16.12.1.Company Details
16.12.2.Company Overview
16.12.3.Product Offerings
16.12.4.Key Developments
16.12.5.Financial Analysis
16.12.6.SWOT Analysis
16.12.7.Business Strategies
16.13.Siemens
16.13.1.Company Details
16.13.2.Company Overview
16.13.3.Product Offerings
16.13.4.Key Developments
16.13.5.Financial Analysis
16.13.6.SWOT Analysis
16.13.7.Business Strategies
16.14.Vuzix Corporation.
16.14.1.Company Details
16.14.2.Company Overview
16.14.3.Product Offerings
16.14.4.Key Developments
16.14.5.Financial Analysis
16.14.6.SWOT Analysis
16.14.7.Business Strategies
16.15.Xiaomi Corporation
16.15.1.Company Details
16.15.2.Company Overview
16.15.3.Product Offerings
16.15.4.Key Developments
16.15.5.Financial Analysis
16.15.6.SWOT Analysis
16.15.7.Business Strategies
16.16.Zebra Technologies Corp
16.16.1.Company Details
16.16.2.Company Overview
16.16.3.Product Offerings
16.16.4.Key Developments
16.16.5.Financial Analysis
16.16.6.SWOT Analysis
16.16.7.Business Strategies
16.17.Other market participants
17.Key Findings

.

Note: This ToC is tentative and can be changed according to the research study conducted during the course of report completion.

.

**Exclusive for Multi-User and Enterprise User.

.

Global Wearable Computing Market Segmentation

By Product Type

 Smart Watch
 Fitness Trackers
 Smart Glasses
 Smart Clothing
 Head-Mounted Displays
 Others

By End Use

 Healthcare
 Entertainment and Gaming
 Fashion
 Automotive
 Sports and Fitness
 Military and Defense
 IT and Telecommunication
 Others

By Region

 North America (U.S., Canada, Mexico, Rest of North America)
 Europe (France, The UK, Spain, Germany, Italy, Nordic Countries (Denmark, Finland, Iceland, Sweden, Norway), Benelux Union (Belgium, The Netherlands, Luxembourg), Rest of Europe)
 Asia Pacific (China, Japan, India, New Zealand, Australia, South Korea, Southeast Asia (Indonesia, Thailand, Malaysia, Singapore, Rest of Southeast Asia), Rest of Asia Pacific)
 Middle East & Africa (Saudi Arabia, UAE, Egypt, Kuwait, South Africa, Rest of Middle East & Africa)
 Latin America (Brazil, Argentina, Rest of Latin America)

**Note: The report covers cross-segmentation analysis by region further into countries

.

.

The Niche Research approach encompasses both primary and secondary research methods to provide comprehensive insights. While primary research is the cornerstone of our studies, we also incorporate secondary research sources such as company annual reports, premium industry databases, press releases, industry journals, and white papers.

Within our primary research, we actively engage with various industry stakeholders, conducting paid interviews and surveys. Our meticulous analysis extends to every market participant in major countries, allowing us to thoroughly examine their portfolios, calculate market shares, and segment revenues.

Our data collection primarily focuses on individual countries within our research scope, enabling us to estimate regional market sizes. Typically, we employ a bottom-up approach, meticulously tracking trends in different countries. We analyze growth drivers, constraints, technological innovations, and opportunities for each country, ultimately arriving at regional figures.Our process begins by examining the growth prospects of each country. Building upon these insights, we project growth and trends for the entire region. Finally, we utilize our proprietary model to refine estimations and forecasts.

Our data validation standards are integral to ensuring the reliability and accuracy of our research findings. Here’s a breakdown of our data validation processes and the stakeholders we engage with during our primary research:

  • Supply Side Analysis: We initiate a supply side analysis by directly contacting market participants, through telephonic interviews and questionnaires containing both open-ended and close-ended questions. We gather information on their portfolios, segment revenues, developments, and growth strategies.
  • Demand Side Analysis: To gain insights into adoption trends and consumer preferences, we reach out to target customers and users (non-vendors). This information forms a vital part of the qualitative analysis section of our reports, covering market dynamics, adoption trends, consumer behavior, spending patterns, and other related aspects.
  • Consultant Insights: We tap into the expertise of our partner consultants from around the world to obtain their unique viewpoints and perspectives. Their insights contribute to a well-rounded understanding of the markets under investigation.
  • In-House Validation: To ensure data accuracy and reliability, we conduct cross-validation of data points and information through our in-house team of consultants and utilize advanced data modeling tools for thorough verification.

The forecasts we provide are based on a comprehensive assessment of various factors, including:

  • Market Trends and Past Performance (Last Five Years): We accurately analyze market trends and performance data from preceding five years to identify historical patterns and understand the market’s evolution.
  • Historical Performance and Growth of Market Participants: We assess the historical performance and growth trajectories of key market participants. This analysis provides insights into the competitive landscape and individual company strategies.
  • Market Determinants Impact Analysis (Next Eight Years): We conduct a rigorous analysis of the factors that are projected to influence the market over the next eight years. This includes assessing both internal and external determinants that can shape market dynamics.
  • Drivers and Challenges for the Forecast Period:Identify the factors expected to drive market growth during the forecast period, as well as the challenges that the industry may face. This analysis aids in deriving an accurate growth rate projection.
  • New Acquisitions, Collaborations, or Partnerships: We keep a close watch on any new acquisitions, collaborations, or partnerships within the industry. These developments can have a significant impact on market dynamics and competitiveness.
  • Macro and Micro Factors Analysis:A thorough examination of both macro-level factors (e.g., economic trends, regulatory changes) and micro-level factors (e.g., technological advancements, consumer preferences) that may influence the market during the forecast period.
  • End-User Sentiment Analysis: To understand the market from the end-user perspective, we conduct sentiment analysis. This involves assessing the sentiment, preferences, and feedback of the end-users, which can provide valuable insights into market trends.
  • Perspective of Primary Participants: Insights gathered directly from primary research participants play a crucial role in shaping our forecasts. Their perspectives and experiences provide valuable qualitative data.
  • Year-on-Year Growth Trend: We utilize a year-on-year growth trend based on historical market growth and expected future trends. This helps in formulating our growth projections, aligning them with the market’s historical performance.

Research process adopted by TNR involves multiple stages, including data collection, validation, quality checks, and presentation. It’s crucial that the data and information we provide add value to your existing market understanding and expertise. We have also established partnerships with business consulting, research, and survey organizations across regions and globally to collaborate on regional analysis and data validation, ensuring the highest level of accuracy and reliability in our reports.


Procure Comprehensive Study of

Global Wearable Computing Market

Online Only

  • Online Access
  • Read Only File
  • Validity 3 Months
  • Print, Copy, Paste & Download
  • PPT, Excel
  • Cost-Free Report in the Next Update
$3300
Buy Now

Single User

  • Access to One User on One System
  • Read Only File
  • Validity 6 Months
  • Limited Print,Copy, Paste
  • PPT, Excel
  • Cost-Free Report in the Next Update
$4200
Buy Now

Multi User

  • Access to Fiver Users
  • PDF File
  • Validity 1 Year
  • Upto FivePrints
  • Cost-Free Report in the Next Update
  • PPT, Excel
$6000
Buy Now

Enterprise User

  • Access to Unlimited Users
  • PDF, PPT, Excel
  • Unlimited Validity, Prints&Downloads
  • 1 Hour Cost-Free & Dedicated Analyst Support
  • 10% Cost-Free Customization
  • Cost-Free Report Update Twice in a Year
  • Recommendations for Business Strategies
  • Authorization to Quote TNR, The Niche Research
$7300
Buy Now

Library Access

  • Online Access to Content Publications
  • Access Player Profiles Online
  • Get Immediate Access to Newly Added Content
  • Acquire 12 PDF Downloads
  • Acquire 5 Excel Data Sets
  • Gain Access to 290+ PDFs of Company Profiles
  • Round-the-clock Email and Phone Assistance
  • Dashboard Usage and Trends
  • Renewal & Upgrade Assistance
  • Assessing Customization Options and Alerts for New Reports
$10788
Buy Now
*Taxes/Fees, if applicable will be added during checkout. All prices in USD

Why TNR The Niche Research?

  • Unwavering Commitment to Excellence

  • Veteran Team of Researchers

  • Accurate and Timely Insights

  • Ethical Practices and Customized Service

  • Uninterrupted Availability Around the Clock

Scroll to Top