Global Wired Interface Market By Component Type, By Application, By End User, By Region: Global & Segmental Insights, Comparative Analysis, Trends and Forecast, 2023 – 2031

  • Industry: Semiconductors & Electronics
  • Report ID: TNR-110-906
  • Number of Pages: 420
  • Table/Charts : Yes
  • November, 2023
  • Base Year : 2024
  • No. of Companies : 9+
  • No. of Countries : 29
  • Views : 10253
  • Covid Impact Covered: Yes
  • War Impact Covered: Yes
  • Formats : PDF, Excel, PPT

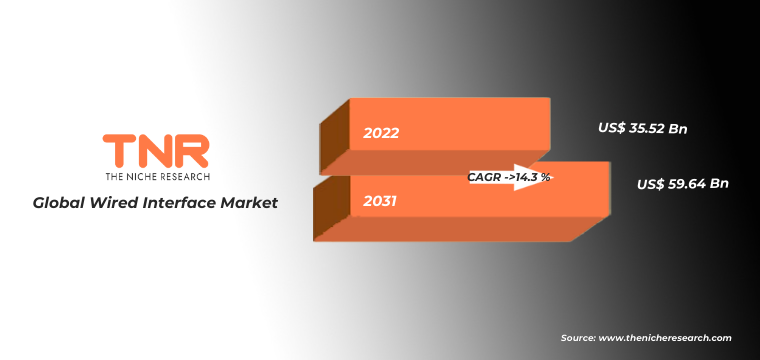
In Terms of Revenue, Global Wired Interface Market was Valued at US$ 32.52 Billion in 2022, Growing at an Estimated CAGR of 14.3% from 2023-2031.

A wired interface refers to a physical connection between electronic devices using cables or conductive pathways to facilitate data exchange and communication. It establishes a reliable and consistent connection, offering stable data transmission with minimal interference. Wired interfaces encompass various types, such as USB (Universal Serial Bus), Ethernet, HDMI (High-Definition Multimedia Interface), and more. These interfaces enable devices like computers, smartphones, and peripherals to transfer data, audio, video, and power signals. Wired interfaces are favored for their consistent performance and security, as data is less susceptible to wireless interference. They play a pivotal role in establishing connections between devices, ensuring efficient and dependable communication across a range of applications and industries.

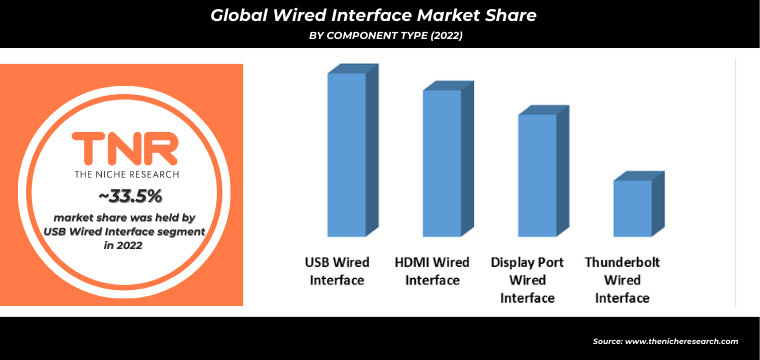
In the global wired interface market, the USB wired interface stands as the dominating component. Industry reports from technology databases highlight the ubiquitous use of USB interfaces across devices, including laptops, smartphones, and peripherals. Surveys among consumers underscore the prevalence of USB connections for charging and data transfer, with over 90% of respondents using USB cables regularly. The USB Implementers Forum reports that over 10 billion USB devices are shipped annually. The versatility and familiarity of USB interfaces have solidified their dominance as the primary wired connectivity choice across a wide range of devices.

Global Wired Interface Market Revenue & Volume Forecast, (US$ Million & Million Units), 2015 – 2031

COVID-19 Impact Analysis on Global Wired Interface Market

The wired interface market experienced distinct shifts pre- and post-COVID-19. Before the pandemic, the market was steadily growing, driven by advancements in technology and increasing connectivity demands. The rise of smart devices, IoT applications, and data-intensive industries contributed to a growing need for reliable wired connections. However, the pandemic accelerated certain trends. During COVID-19, remote work and virtual communication surged, highlighting the essential role of robust wired interfaces for stable connectivity.

The demand for high-speed data transmission and low-latency connections intensified, particularly in sectors like telemedicine, e-learning, and remote collaboration. This shift reflected the criticality of wired interfaces in maintaining seamless communication amid unprecedented challenges. As the world transitions beyond the pandemic, the wired interface market is expected to continue evolving, catering to the evolving connectivity requirements shaped by the lessons of the crisis.

Report Coverage and Deliverables

A pivotal driver of the wired interface market is the escalating demand for high-speed data transfer. Reports from technology adoption databases emphasize the surge in data-intensive applications like video streaming and cloud computing. Cisco’s Annual Internet Report shows global IP traffic reached 396 exabytes per month in 2022. This heightened data consumption propels the need for interfaces like Thunderbolt and HDMI to accommodate seamless and rapid data transfer, driving the market’s growth in response to evolving digital demands.

A significant restraint on the wired interface market is the compatibility challenges stemming from interface diversity. The existence of multiple standards like USB, HDMI, and DisplayPort complicates device connectivity. This compatibility hurdle slows adoption, as users navigate through a myriad of interface options, hindering seamless connections and market expansion.

Consumer electronics stands as the dominating application in the global wired interface market. Industry reports from technology databases emphasize the integral role of wired interfaces like USB and HDMI in devices such as smartphones, laptops, and televisions. Consumer Electronics Association reports that consumers spent over $406 billion on consumer electronics in the US alone. The seamless integration of wired interfaces into everyday devices solidifies their dominance as essential connectivity solutions for modern consumers.

North America dominated the global wired interface market in 2022. The Consumer Technology Association states that the US consumer technology industry was valued at $422 billion in 2020. The strong presence of tech giants and cutting-edge innovation in North America solidifies its dominance in wired interface integration across diverse sectors.

Competitive Landscape

The report provides both, qualitative and quantitative research of global wired interface market, as well as provides comprehensive insights and development methods adopted by the key contenders. The report also offers extensive research on the key players in this market and details on the competitiveness of these players. Key business strategies such as mergers and acquisitions (M&A), affiliations, collaborations, and contracts adopted by these major market participants are also recognized and analyzed in the report. For each company, the report studies their global presence, competitors, service offerings and specification amongst others.

Few of the players operating in the global wired interface market are mentioned below:

  • Amphenol Corporation
  • Analog Devices, Inc.
  • Infineon Technologies AG
  • Microchip Technology Inc.
  • Molex
  • ROHM Co., Ltd.
  • Semiconductor Components Industries, LLC
  • STMicroelectronics
  • TE Connectivity
  • Texas Instruments Incorporated
  • Other Industry Participants

Global Wired Interface Market Report Summary

Report Specifications Details
Market Revenue in 2022 US$ 35.52 Billion
Market Size Forecast by 2031 US$ 59.64 Billion
Growth Rate (CAGR) 14.3 %
Historic Data 2015 – 2021
Base Year for Estimation 2022
Forecast Period 2023 – 2031
Report Inclusions Market Size & Estimates, Market Dynamics, Competitive Scenario, Trends, Growth Factors, Market Determinants, Key Investment Segmentation, Product/Service/Solutions Benchmarking
Segments Covered By Component Type, By Application, By End User
Regions Covered North America, Europe, Asia Pacific, Middle East & Africa, Latin America
Countries Covered U.S., Canada, Mexico, Rest of North America,  France, The UK, Spain, Germany, Italy, Nordic Countries (Denmark, Finland, Iceland, Sweden, Norway), Benelux Union (Belgium, The Netherlands, Luxembourg), Rest of Europe,  China, Japan, India, New Zealand, Australia, South Korea, Southeast Asia (Indonesia, Thailand, Malaysia, Singapore, Rest of Southeast Asia), Rest of Asia Pacific,  Saudi Arabia, UAE, Egypt, Kuwait, South Africa, Rest of Middle East & Africa,  Brazil, Argentina, Rest of Latin America
Key Players Amphenol Corporation, Analog Devices, Inc., Infineon Technologies AG, Microchip Technology Inc., Molex, ROHM Co., Ltd., Semiconductor Components Industries, LLC, STMicroelectronics, TE Connectivity, Texas Instruments Incorporated, Other Industry Participants
Customization Scope Customization allows for the inclusion/modification of content pertaining to geographical regions, countries, and specific market segments.
Pricing & Procurement Options Explore purchase options tailored to your specific research requirements
Contact Details Consult With Our Expert

Japan (Toll-Free): – +81 663-386-8111

South Korea (Toll-Free): – +82-808- 703-126

Saudi Arabia (Toll-Free): – +966 800 850 1643

United States: +1 302-232-5106

United Kingdom: +447537105080

E-mail:  askanexpert@thenicheresearch.com


Global Wired Interface Market

By Component Type

  • USB Wired Interface
  • HDMI Wired Interface
  • Display Port Wired Interface
  • Thunderbolt Wired Interface

By Application

  • Smartphone
  • Tablet
  • PC and Laptop
  • Television
  • Virtual Reality
  • Drones
  • Gaming Console
  • External Hard Disk
  • Camera
  • Projector
  • Wearable
  • Home Theatre and Multimedia Device
  • Power Bank
  • Display Monitor
  • USB Flash Drive
  • Set-Top Box
  • Others

By End Users

  • Consumer Electronics
  • Automotive
  • Healthcare
  • Retail
  • Government & Public Sector
  • IT and Telecom
  • Others

By Region

  • North America (U.S., Canada, Mexico, Rest of North America)
  • Europe (France, The UK, Spain, Germany, Italy, Nordic Countries (Denmark, Finland, Iceland, Sweden, Norway), Benelux Union (Belgium, The Netherlands, Luxembourg), Rest of Europe
  • Asia Pacific (China, Japan, India, New Zealand, Australia, South Korea, Southeast Asia (Indonesia, Thailand, Malaysia, Singapore, Rest of Southeast Asia), Rest of Asia Pacific)
  • Middle East & Africa (Saudi Arabia, UAE, Egypt, Kuwait, South Africa, Rest of Middle East & Africa)
  • Latin America (Brazil, Argentina, Rest of Latin America)

Table of Contents

.

1.Market Scope
1.1.Market Segmentation
1.2.Years Considered
1.2.1.Historic Years: 2015 – 2021
1.2.2.Base Year: 2022
1.2.3.Forecast Years: 2023 – 2031
2.Key Target Audiences
3.Research Methodology
3.1.Primary Research
3.1.1.Research Questionnaire
3.1.2.Global Percentage Breakdown
3.1.3.Primary Interviews: Key Opinion Leaders (KOLs)
3.2.Secondary Research
3.2.1.Paid Databases
3.2.2.Secondary Sources
3.3.Market Size Estimates
3.3.1.Top-Down Approach
3.3.2.Bottom-Up Approach
3.4.Data Triangulation Methodology
3.5.Research Assumptions
4.Recommendations and Insights from TNR’s Perspective**
5.Holistic Overview of Wired Interface Market
6.Market Synopsis: Wired Interface Market
7.Wired Interface Market Analysis: Qualitative Perspective
7.1.Introduction
7.1.1.Product Definition
7.1.2.Industry Development
7.2.Market Dynamics
7.2.1.Drivers
7.2.2.Restraints
7.2.3.Opportunities
7.2.4.Challenges
7.3.Trends in Wired Interface Market
7.4.Market Determinants Radar Chart
7.5.Macro-Economic and Micro-Economic Indicators: Wired Interface Market
7.6.Porter’s Five Force Analysis
7.7.Impact of Covid-19 on Wired Interface Market
7.8.PESTEL Analysis
8.Global Wired Interface Market Analysis and Forecasts, 2023 – 2031
8.1.Overview
8.1.1.Global Wired Interface Market Revenue (US$ Mn)
8.2.Global Wired Interface Market Revenue (US$ Mn) and Forecasts, By Component Type
8.2.1.USB Wired Interface
8.2.1.1.Definition
8.2.1.2.Market Estimation and Penetration, 2015 – 2022
8.2.1.3.Market Forecast, 2023 – 2031
8.2.1.4.Compound Annual Growth Rate (CAGR)
8.2.1.5.Regional Bifurcation
8.2.1.5.1.North America
8.2.1.5.1.1.Market Estimation, 2015 – 2022
8.2.1.5.1.2.Market Forecast, 2023 – 2031
8.2.1.5.2.Europe
8.2.1.5.2.1.Market Estimation, 2015 – 2022
8.2.1.5.2.2.Market Forecast, 2023 – 2031
8.2.1.5.3.Asia Pacific
8.2.1.5.3.1.Market Estimation, 2015 – 2022
8.2.1.5.3.2.Market Forecast, 2023 – 2031
8.2.1.5.4.Middle East and Africa
8.2.1.5.4.1.Market Estimation, 2015 – 2022
8.2.1.5.4.2.Market Forecast, 2023 – 2031
8.2.1.5.5.Latin America
8.2.1.5.5.1.Market Estimation, 2015 – 2022
8.2.1.5.5.2.Market Forecast, 2023 – 2031
8.2.2.HDMI Wired Interface
8.2.2.1.Definition
8.2.2.2.Market Estimation and Penetration, 2015 – 2022
8.2.2.3.Market Forecast, 2023 – 2031
8.2.2.4.Compound Annual Growth Rate (CAGR)
8.2.2.5.Regional Bifurcation
8.2.2.5.1.North America
8.2.2.5.1.1.Market Estimation, 2015 – 2022
8.2.2.5.1.2.Market Forecast, 2023 – 2031
8.2.2.5.2.Europe
8.2.2.5.2.1.Market Estimation, 2015 – 2022
8.2.2.5.2.2.Market Forecast, 2023 – 2031
8.2.2.5.3.Asia Pacific
8.2.2.5.3.1.Market Estimation, 2015 – 2022
8.2.2.5.3.2.Market Forecast, 2023 – 2031
8.2.2.5.4.Middle East and Africa
8.2.2.5.4.1.Market Estimation, 2015 – 2022
8.2.2.5.4.2.Market Forecast, 2023 – 2031
8.2.2.5.5.Latin America
8.2.2.5.5.1.Market Estimation, 2015 – 2022
8.2.2.5.5.2.Market Forecast, 2023 – 2031
8.2.3.Display Port Wired Interface
8.2.3.1.Definition
8.2.3.2.Market Estimation and Penetration, 2015 – 2022
8.2.3.3.Market Forecast, 2023 – 2031
8.2.3.4.Compound Annual Growth Rate (CAGR)
8.2.3.5.Regional Bifurcation
8.2.3.5.1.North America
8.2.3.5.1.1.Market Estimation, 2015 – 2022
8.2.3.5.1.2.Market Forecast, 2023 – 2031
8.2.3.5.2.Europe
8.2.3.5.2.1.Market Estimation, 2015 – 2022
8.2.3.5.2.2.Market Forecast, 2023 – 2031
8.2.3.5.3.Asia Pacific
8.2.3.5.3.1.Market Estimation, 2015 – 2022
8.2.3.5.3.2.Market Forecast, 2023 – 2031
8.2.3.5.4.Middle East and Africa
8.2.3.5.4.1.Market Estimation, 2015 – 2022
8.2.3.5.4.2.Market Forecast, 2023 – 2031
8.2.3.5.5.Latin America
8.2.3.5.5.1.Market Estimation, 2015 – 2022
8.2.3.5.5.2.Market Forecast, 2023 – 2031
8.2.4.Thunderbolt Wired Interface
8.2.4.1.Definition
8.2.4.2.Market Estimation and Penetration, 2015 – 2022
8.2.4.3.Market Forecast, 2023 – 2031
8.2.4.4.Compound Annual Growth Rate (CAGR)
8.2.4.5.Regional Bifurcation
8.2.4.5.1.North America
8.2.4.5.1.1.Market Estimation, 2015 – 2022
8.2.4.5.1.2.Market Forecast, 2023 – 2031
8.2.4.5.2.Europe
8.2.4.5.2.1.Market Estimation, 2015 – 2022
8.2.4.5.2.2.Market Forecast, 2023 – 2031
8.2.4.5.3.Asia Pacific
8.2.4.5.3.1.Market Estimation, 2015 – 2022
8.2.4.5.3.2.Market Forecast, 2023 – 2031
8.2.4.5.4.Middle East and Africa
8.2.4.5.4.1.Market Estimation, 2015 – 2022
8.2.4.5.4.2.Market Forecast, 2023 – 2031
8.2.4.5.5.Latin America
8.2.4.5.5.1.Market Estimation, 2015 – 2022
8.2.4.5.5.2.Market Forecast, 2023 – 2031
8.3.Key Segment for Channeling Investments
8.3.1.By Component Type
9.Global Wired Interface Market Analysis and Forecasts, 2023 – 2031
9.1.Overview
9.2.Global Wired Interface Market Revenue (US$ Mn) and Forecasts, By Application
9.2.1.Smartphone
9.2.1.1.Definition
9.2.1.2.Market Estimation and Penetration, 2015 – 2022
9.2.1.3.Market Forecast, 2023 – 2031
9.2.1.4.Compound Annual Growth Rate (CAGR)
9.2.1.5.Regional Bifurcation
9.2.1.5.1.North America
9.2.1.5.1.1.Market Estimation, 2015 – 2022
9.2.1.5.1.2.Market Forecast, 2023 – 2031
9.2.1.5.2.Europe
9.2.1.5.2.1.Market Estimation, 2015 – 2022
9.2.1.5.2.2.Market Forecast, 2023 – 2031
9.2.1.5.3.Asia Pacific
9.2.1.5.3.1.Market Estimation, 2015 – 2022
9.2.1.5.3.2.Market Forecast, 2023 – 2031
9.2.1.5.4.Middle East and Africa
9.2.1.5.4.1.Market Estimation, 2015 – 2022
9.2.1.5.4.2.Market Forecast, 2023 – 2031
9.2.1.5.5.Latin America
9.2.1.5.5.1.Market Estimation, 2015 – 2022
9.2.1.5.5.2.Market Forecast, 2023 – 2031
9.2.2.Tablet
9.2.2.1.Definition
9.2.2.2.Market Estimation and Penetration, 2015 – 2022
9.2.2.3.Market Forecast, 2023 – 2031
9.2.2.4.Compound Annual Growth Rate (CAGR)
9.2.2.5.Regional Bifurcation
9.2.2.5.1.North America
9.2.2.5.1.1.Market Estimation, 2015 – 2022
9.2.2.5.1.2.Market Forecast, 2023 – 2031
9.2.2.5.2.Europe
9.2.2.5.2.1.Market Estimation, 2015 – 2022
9.2.2.5.2.2.Market Forecast, 2023 – 2031
9.2.2.5.3.Asia Pacific
9.2.2.5.3.1.Market Estimation, 2015 – 2022
9.2.2.5.3.2.Market Forecast, 2023 – 2031
9.2.2.5.4.Middle East and Africa
9.2.2.5.4.1.Market Estimation, 2015 – 2022
9.2.2.5.4.2.Market Forecast, 2023 – 2031
9.2.2.5.5.Latin America
9.2.2.5.5.1.Market Estimation, 2015 – 2022
9.2.2.5.5.2.Market Forecast, 2023 – 2031
9.2.3.PC and Laptop
9.2.3.1.Definition
9.2.3.2.Market Estimation and Penetration, 2015 – 2022
9.2.3.3.Market Forecast, 2023 – 2031
9.2.3.4.Compound Annual Growth Rate (CAGR)
9.2.3.5.Regional Bifurcation
9.2.3.5.1.North America
9.2.3.5.1.1.Market Estimation, 2015 – 2022
9.2.3.5.1.2.Market Forecast, 2023 – 2031
9.2.3.5.2.Europe
9.2.3.5.2.1.Market Estimation, 2015 – 2022
9.2.3.5.2.2.Market Forecast, 2023 – 2031
9.2.3.5.3.Asia Pacific
9.2.3.5.3.1.Market Estimation, 2015 – 2022
9.2.3.5.3.2.Market Forecast, 2023 – 2031
9.2.3.5.4.Middle East and Africa
9.2.3.5.4.1.Market Estimation, 2015 – 2022
9.2.3.5.4.2.Market Forecast, 2023 – 2031
9.2.3.5.5.Latin America
9.2.3.5.5.1.Market Estimation, 2015 – 2022
9.2.3.5.5.2.Market Forecast, 2023 – 2031
9.2.4.Television
9.2.4.1.Definition
9.2.4.2.Market Estimation and Penetration, 2015 – 2022
9.2.4.3.Market Forecast, 2023 – 2031
9.2.4.4.Compound Annual Growth Rate (CAGR)
9.2.4.5.Regional Bifurcation
9.2.4.5.1.North America
9.2.4.5.1.1.Market Estimation, 2015 – 2022
9.2.4.5.1.2.Market Forecast, 2023 – 2031
9.2.4.5.2.Europe
9.2.4.5.2.1.Market Estimation, 2015 – 2022
9.2.4.5.2.2.Market Forecast, 2023 – 2031
9.2.4.5.3.Asia Pacific
9.2.4.5.3.1.Market Estimation, 2015 – 2022
9.2.4.5.3.2.Market Forecast, 2023 – 2031
9.2.4.5.4.Middle East and Africa
9.2.4.5.4.1.Market Estimation, 2015 – 2022
9.2.4.5.4.2.Market Forecast, 2023 – 2031
9.2.4.5.5.Latin America
9.2.4.5.5.1.Market Estimation, 2015 – 2022
9.2.4.5.5.2.Market Forecast, 2023 – 2031
9.2.5.Virtual Reality
9.2.5.1.Definition
9.2.5.2.Market Estimation and Penetration, 2015 – 2022
9.2.5.3.Market Forecast, 2023 – 2031
9.2.5.4.Compound Annual Growth Rate (CAGR)
9.2.5.5.Regional Bifurcation
9.2.5.5.1.North America
9.2.5.5.1.1.Market Estimation, 2015 – 2022
9.2.5.5.1.2.Market Forecast, 2023 – 2031
9.2.5.5.2.Europe
9.2.5.5.2.1.Market Estimation, 2015 – 2022
9.2.5.5.2.2.Market Forecast, 2023 – 2031
9.2.5.5.3.Asia Pacific
9.2.5.5.3.1.Market Estimation, 2015 – 2022
9.2.5.5.3.2.Market Forecast, 2023 – 2031
9.2.5.5.4.Middle East and Africa
9.2.5.5.4.1.Market Estimation, 2015 – 2022
9.2.5.5.4.2.Market Forecast, 2023 – 2031
9.2.5.5.5.Latin America
9.2.5.5.5.1.Market Estimation, 2015 – 2022
9.2.5.5.5.2.Market Forecast, 2023 – 2031
9.2.6.Drones
9.2.6.1.Definition
9.2.6.2.Market Estimation and Penetration, 2015 – 2022
9.2.6.3.Market Forecast, 2023 – 2031
9.2.6.4.Compound Annual Growth Rate (CAGR)
9.2.6.5.Regional Bifurcation
9.2.6.5.1.North America
9.2.6.5.1.1.Market Estimation, 2015 – 2022
9.2.6.5.1.2.Market Forecast, 2023 – 2031
9.2.6.5.2.Europe
9.2.6.5.2.1.Market Estimation, 2015 – 2022
9.2.6.5.2.2.Market Forecast, 2023 – 2031
9.2.6.5.3.Asia Pacific
9.2.6.5.3.1.Market Estimation, 2015 – 2022
9.2.6.5.3.2.Market Forecast, 2023 – 2031
9.2.6.5.4.Middle East and Africa
9.2.6.5.4.1.Market Estimation, 2015 – 2022
9.2.6.5.4.2.Market Forecast, 2023 – 2031
9.2.6.5.5.Latin America
9.2.6.5.5.1.Market Estimation, 2015 – 2022
9.2.6.5.5.2.Market Forecast, 2023 – 2031
9.2.7.Gaming Console
9.2.7.1.Definition
9.2.7.2.Market Estimation and Penetration, 2015 – 2022
9.2.7.3.Market Forecast, 2023 – 2031
9.2.7.4.Compound Annual Growth Rate (CAGR)
9.2.7.5.Regional Bifurcation
9.2.7.5.1.North America
9.2.7.5.1.1.Market Estimation, 2015 – 2022
9.2.7.5.1.2.Market Forecast, 2023 – 2031
9.2.7.5.2.Europe
9.2.7.5.2.1.Market Estimation, 2015 – 2022
9.2.7.5.2.2.Market Forecast, 2023 – 2031
9.2.7.5.3.Asia Pacific
9.2.7.5.3.1.Market Estimation, 2015 – 2022
9.2.7.5.3.2.Market Forecast, 2023 – 2031
9.2.7.5.4.Middle East and Africa
9.2.7.5.4.1.Market Estimation, 2015 – 2022
9.2.7.5.4.2.Market Forecast, 2023 – 2031
9.2.7.5.5.Latin America
9.2.7.5.5.1.Market Estimation, 2015 – 2022
9.2.7.5.5.2.Market Forecast, 2023 – 2031
9.2.8.External Hard Disk
9.2.8.1.Definition
9.2.8.2.Market Estimation and Penetration, 2015 – 2022
9.2.8.3.Market Forecast, 2023 – 2031
9.2.8.4.Compound Annual Growth Rate (CAGR)
9.2.8.5.Regional Bifurcation
9.2.8.5.1.North America
9.2.8.5.1.1.Market Estimation, 2015 – 2022
9.2.8.5.1.2.Market Forecast, 2023 – 2031
9.2.8.5.2.Europe
9.2.8.5.2.1.Market Estimation, 2015 – 2022
9.2.8.5.2.2.Market Forecast, 2023 – 2031
9.2.8.5.3.Asia Pacific
9.2.8.5.3.1.Market Estimation, 2015 – 2022
9.2.8.5.3.2.Market Forecast, 2023 – 2031
9.2.8.5.4.Middle East and Africa
9.2.8.5.4.1.Market Estimation, 2015 – 2022
9.2.8.5.4.2.Market Forecast, 2023 – 2031
9.2.8.5.5.Latin America
9.2.8.5.5.1.Market Estimation, 2015 – 2022
9.2.8.5.5.2.Market Forecast, 2023 – 2031
9.2.9.Camera
9.2.9.1.Definition
9.2.9.2.Market Estimation and Penetration, 2015 – 2022
9.2.9.3.Market Forecast, 2023 – 2031
9.2.9.4.Compound Annual Growth Rate (CAGR)
9.2.9.5.Regional Bifurcation
9.2.9.5.1.North America
9.2.9.5.1.1.Market Estimation, 2015 – 2022
9.2.9.5.1.2.Market Forecast, 2023 – 2031
9.2.9.5.2.Europe
9.2.9.5.2.1.Market Estimation, 2015 – 2022
9.2.9.5.2.2.Market Forecast, 2023 – 2031
9.2.9.5.3.Asia Pacific
9.2.9.5.3.1.Market Estimation, 2015 – 2022
9.2.9.5.3.2.Market Forecast, 2023 – 2031
9.2.9.5.4.Middle East and Africa
9.2.9.5.4.1.Market Estimation, 2015 – 2022
9.2.9.5.4.2.Market Forecast, 2023 – 2031
9.2.9.5.5.Latin America
9.2.9.5.5.1.Market Estimation, 2015 – 2022
9.2.9.5.5.2.Market Forecast, 2023 – 2031
9.2.10.Projector
9.2.10.1.Definition
9.2.10.2.Market Estimation and Penetration, 2015 – 2022
9.2.10.3.Market Forecast, 2023 – 2031
9.2.10.4.Compound Annual Growth Rate (CAGR)
9.2.10.5.Regional Bifurcation
9.2.10.5.1.North America
9.2.10.5.1.1.Market Estimation, 2015 – 2022
9.2.10.5.1.2.Market Forecast, 2023 – 2031
9.2.10.5.2.Europe
9.2.10.5.2.1.Market Estimation, 2015 – 2022
9.2.10.5.2.2.Market Forecast, 2023 – 2031
9.2.10.5.3.Asia Pacific
9.2.10.5.3.1.Market Estimation, 2015 – 2022
9.2.10.5.3.2.Market Forecast, 2023 – 2031
9.2.10.5.4.Middle East and Africa
9.2.10.5.4.1.Market Estimation, 2015 – 2022
9.2.10.5.4.2.Market Forecast, 2023 – 2031
9.2.10.5.5.Latin America
9.2.10.5.5.1.Market Estimation, 2015 – 2022
9.2.10.5.5.2.Market Forecast, 2023 – 2031
9.2.11.Wearable
9.2.11.1.Definition
9.2.11.2.Market Estimation and Penetration, 2015 – 2022
9.2.11.3.Market Forecast, 2023 – 2031
9.2.11.4.Compound Annual Growth Rate (CAGR)
9.2.11.5.Regional Bifurcation
9.2.11.5.1.North America
9.2.11.5.1.1.Market Estimation, 2015 – 2022
9.2.11.5.1.2.Market Forecast, 2023 – 2031
9.2.11.5.2.Europe
9.2.11.5.2.1.Market Estimation, 2015 – 2022
9.2.11.5.2.2.Market Forecast, 2023 – 2031
9.2.11.5.3.Asia Pacific
9.2.11.5.3.1.Market Estimation, 2015 – 2022
9.2.11.5.3.2.Market Forecast, 2023 – 2031
9.2.11.5.4.Middle East and Africa
9.2.11.5.4.1.Market Estimation, 2015 – 2022
9.2.11.5.4.2.Market Forecast, 2023 – 2031
9.2.11.5.5.Latin America
9.2.11.5.5.1.Market Estimation, 2015 – 2022
9.2.11.5.5.2.Market Forecast, 2023 – 2031
9.2.12.Home Theatre and Multimedia Device
9.2.12.1.Definition
9.2.12.2.Market Estimation and Penetration, 2015 – 2022
9.2.12.3.Market Forecast, 2023 – 2031
9.2.12.4.Compound Annual Growth Rate (CAGR)
9.2.12.5.Regional Bifurcation
9.2.12.5.1.North America
9.2.12.5.1.1.Market Estimation, 2015 – 2022
9.2.12.5.1.2.Market Forecast, 2023 – 2031
9.2.12.5.2.Europe
9.2.12.5.2.1.Market Estimation, 2015 – 2022
9.2.12.5.2.2.Market Forecast, 2023 – 2031
9.2.12.5.3.Asia Pacific
9.2.12.5.3.1.Market Estimation, 2015 – 2022
9.2.12.5.3.2.Market Forecast, 2023 – 2031
9.2.12.5.4.Middle East and Africa
9.2.12.5.4.1.Market Estimation, 2015 – 2022
9.2.12.5.4.2.Market Forecast, 2023 – 2031
9.2.12.5.5.Latin America
9.2.12.5.5.1.Market Estimation, 2015 – 2022
9.2.12.5.5.2.Market Forecast, 2023 – 2031
9.2.13.Power Bank
9.2.13.1.Definition
9.2.13.2.Market Estimation and Penetration, 2015 – 2022
9.2.13.3.Market Forecast, 2023 – 2031
9.2.13.4.Compound Annual Growth Rate (CAGR)
9.2.13.5.Regional Bifurcation
9.2.13.5.1.North America
9.2.13.5.1.1.Market Estimation, 2015 – 2022
9.2.13.5.1.2.Market Forecast, 2023 – 2031
9.2.13.5.2.Europe
9.2.13.5.2.1.Market Estimation, 2015 – 2022
9.2.13.5.2.2.Market Forecast, 2023 – 2031
9.2.13.5.3.Asia Pacific
9.2.13.5.3.1.Market Estimation, 2015 – 2022
9.2.13.5.3.2.Market Forecast, 2023 – 2031
9.2.13.5.4.Middle East and Africa
9.2.13.5.4.1.Market Estimation, 2015 – 2022
9.2.13.5.4.2.Market Forecast, 2023 – 2031
9.2.13.5.5.Latin America
9.2.13.5.5.1.Market Estimation, 2015 – 2022
9.2.13.5.5.2.Market Forecast, 2023 – 2031
9.2.14.Display Monitor
9.2.14.1.Definition
9.2.14.2.Market Estimation and Penetration, 2015 – 2022
9.2.14.3.Market Forecast, 2023 – 2031
9.2.14.4.Compound Annual Growth Rate (CAGR)
9.2.14.5.Regional Bifurcation
9.2.14.5.1.North America
9.2.14.5.1.1.Market Estimation, 2015 – 2022
9.2.14.5.1.2.Market Forecast, 2023 – 2031
9.2.14.5.2.Europe
9.2.14.5.2.1.Market Estimation, 2015 – 2022
9.2.14.5.2.2.Market Forecast, 2023 – 2031
9.2.14.5.3.Asia Pacific
9.2.14.5.3.1.Market Estimation, 2015 – 2022
9.2.14.5.3.2.Market Forecast, 2023 – 2031
9.2.14.5.4.Middle East and Africa
9.2.14.5.4.1.Market Estimation, 2015 – 2022
9.2.14.5.4.2.Market Forecast, 2023 – 2031
9.2.14.5.5.Latin America
9.2.14.5.5.1.Market Estimation, 2015 – 2022
9.2.14.5.5.2.Market Forecast, 2023 – 2031
9.2.15.USB Flash Drive
9.2.15.1.Definition
9.2.15.2.Market Estimation and Penetration, 2015 – 2022
9.2.15.3.Market Forecast, 2023 – 2031
9.2.15.4.Compound Annual Growth Rate (CAGR)
9.2.15.5.Regional Bifurcation
9.2.15.5.1.North America
9.2.15.5.1.1.Market Estimation, 2015 – 2022
9.2.15.5.1.2.Market Forecast, 2023 – 2031
9.2.15.5.2.Europe
9.2.15.5.2.1.Market Estimation, 2015 – 2022
9.2.15.5.2.2.Market Forecast, 2023 – 2031
9.2.15.5.3.Asia Pacific
9.2.15.5.3.1.Market Estimation, 2015 – 2022
9.2.15.5.3.2.Market Forecast, 2023 – 2031
9.2.15.5.4.Middle East and Africa
9.2.15.5.4.1.Market Estimation, 2015 – 2022
9.2.15.5.4.2.Market Forecast, 2023 – 2031
9.2.15.5.5.Latin America
9.2.15.5.5.1.Market Estimation, 2015 – 2022
9.2.15.5.5.2.Market Forecast, 2023 – 2031
9.2.16.Set-Top Box
9.2.16.1.Definition
9.2.16.2.Market Estimation and Penetration, 2015 – 2022
9.2.16.3.Market Forecast, 2023 – 2031
9.2.16.4.Compound Annual Growth Rate (CAGR)
9.2.16.5.Regional Bifurcation
9.2.16.5.1.North America
9.2.16.5.1.1.Market Estimation, 2015 – 2022
9.2.16.5.1.2.Market Forecast, 2023 – 2031
9.2.16.5.2.Europe
9.2.16.5.2.1.Market Estimation, 2015 – 2022
9.2.16.5.2.2.Market Forecast, 2023 – 2031
9.2.16.5.3.Asia Pacific
9.2.16.5.3.1.Market Estimation, 2015 – 2022
9.2.16.5.3.2.Market Forecast, 2023 – 2031
9.2.16.5.4.Middle East and Africa
9.2.16.5.4.1.Market Estimation, 2015 – 2022
9.2.16.5.4.2.Market Forecast, 2023 – 2031
9.2.16.5.5.Latin America
9.2.16.5.5.1.Market Estimation, 2015 – 2022
9.2.16.5.5.2.Market Forecast, 2023 – 2031
9.2.17.Others
9.2.17.1.Definition
9.2.17.2.Market Estimation and Penetration, 2015 – 2022
9.2.17.3.Market Forecast, 2023 – 2031
9.2.17.4.Compound Annual Growth Rate (CAGR)
9.2.17.5.Regional Bifurcation
9.2.17.5.1.North America
9.2.17.5.1.1.Market Estimation, 2015 – 2022
9.2.17.5.1.2.Market Forecast, 2023 – 2031
9.2.17.5.2.Europe
9.2.17.5.2.1.Market Estimation, 2015 – 2022
9.2.17.5.2.2.Market Forecast, 2023 – 2031
9.2.17.5.3.Asia Pacific
9.2.17.5.3.1.Market Estimation, 2015 – 2022
9.2.17.5.3.2.Market Forecast, 2023 – 2031
9.2.17.5.4.Middle East and Africa
9.2.17.5.4.1.Market Estimation, 2015 – 2022
9.2.17.5.4.2.Market Forecast, 2023 – 2031
9.2.17.5.5.Latin America
9.2.17.5.5.1.Market Estimation, 2015 – 2022
9.2.17.5.5.2.Market Forecast, 2023 – 2031
9.3.Key Segment for Channeling Investments
9.3.1.By Application
10.Global Wired Interface Market Analysis and Forecasts, 2023 – 2031
10.1.Overview
10.2.Global Wired Interface Market Revenue (US$ Mn) and Forecasts, By End User
10.2.1.Consumer Electronics
10.2.1.1.Definition
10.2.1.2.Market Estimation and Penetration, 2015 – 2022
10.2.1.3.Market Forecast, 2023 – 2031
10.2.1.4.Compound Annual Growth Rate (CAGR)
10.2.1.5.Regional Bifurcation
10.2.1.5.1.North America
10.2.1.5.1.1.Market Estimation, 2015 – 2022
10.2.1.5.1.2.Market Forecast, 2023 – 2031
10.2.1.5.2.Europe
10.2.1.5.2.1.Market Estimation, 2015 – 2022
10.2.1.5.2.2.Market Forecast, 2023 – 2031
10.2.1.5.3.Asia Pacific
10.2.1.5.3.1.Market Estimation, 2015 – 2022
10.2.1.5.3.2.Market Forecast, 2023 – 2031
10.2.1.5.4.Middle East and Africa
10.2.1.5.4.1.Market Estimation, 2015 – 2022
10.2.1.5.4.2.Market Forecast, 2023 – 2031
10.2.1.5.5.Latin America
10.2.1.5.5.1.Market Estimation, 2015 – 2022
10.2.1.5.5.2.Market Forecast, 2023 – 2031
10.2.2.Automotive
10.2.2.1.Definition
10.2.2.2.Market Estimation and Penetration, 2015 – 2022
10.2.2.3.Market Forecast, 2023 – 2031
10.2.2.4.Compound Annual Growth Rate (CAGR)
10.2.2.5.Regional Bifurcation
10.2.2.5.1.North America
10.2.2.5.1.1.Market Estimation, 2015 – 2022
10.2.2.5.1.2.Market Forecast, 2023 – 2031
10.2.2.5.2.Europe
10.2.2.5.2.1.Market Estimation, 2015 – 2022
10.2.2.5.2.2.Market Forecast, 2023 – 2031
10.2.2.5.3.Asia Pacific
10.2.2.5.3.1.Market Estimation, 2015 – 2022
10.2.2.5.3.2.Market Forecast, 2023 – 2031
10.2.2.5.4.Middle East and Africa
10.2.2.5.4.1.Market Estimation, 2015 – 2022
10.2.2.5.4.2.Market Forecast, 2023 – 2031
10.2.2.5.5.Latin America
10.2.2.5.5.1.Market Estimation, 2015 – 2022
10.2.2.5.5.2.Market Forecast, 2023 – 2031
10.2.3.Healthcare
10.2.3.1.Definition
10.2.3.2.Market Estimation and Penetration, 2015 – 2022
10.2.3.3.Market Forecast, 2023 – 2031
10.2.3.4.Compound Annual Growth Rate (CAGR)
10.2.3.5.Regional Bifurcation
10.2.3.5.1.North America
10.2.3.5.1.1.Market Estimation, 2015 – 2022
10.2.3.5.1.2.Market Forecast, 2023 – 2031
10.2.3.5.2.Europe
10.2.3.5.2.1.Market Estimation, 2015 – 2022
10.2.3.5.2.2.Market Forecast, 2023 – 2031
10.2.3.5.3.Asia Pacific
10.2.3.5.3.1.Market Estimation, 2015 – 2022
10.2.3.5.3.2.Market Forecast, 2023 – 2031
10.2.3.5.4.Middle East and Africa
10.2.3.5.4.1.Market Estimation, 2015 – 2022
10.2.3.5.4.2.Market Forecast, 2023 – 2031
10.2.3.5.5.Latin America
10.2.3.5.5.1.Market Estimation, 2015 – 2022
10.2.3.5.5.2.Market Forecast, 2023 – 2031
10.2.4.Retail
10.2.4.1.Definition
10.2.4.2.Market Estimation and Penetration, 2015 – 2022
10.2.4.3.Market Forecast, 2023 – 2031
10.2.4.4.Compound Annual Growth Rate (CAGR)
10.2.4.5.Regional Bifurcation
10.2.4.5.1.North America
10.2.4.5.1.1.Market Estimation, 2015 – 2022
10.2.4.5.1.2.Market Forecast, 2023 – 2031
10.2.4.5.2.Europe
10.2.4.5.2.1.Market Estimation, 2015 – 2022
10.2.4.5.2.2.Market Forecast, 2023 – 2031
10.2.4.5.3.Asia Pacific
10.2.4.5.3.1.Market Estimation, 2015 – 2022
10.2.4.5.3.2.Market Forecast, 2023 – 2031
10.2.4.5.4.Middle East and Africa
10.2.4.5.4.1.Market Estimation, 2015 – 2022
10.2.4.5.4.2.Market Forecast, 2023 – 2031
10.2.4.5.5.Latin America
10.2.4.5.5.1.Market Estimation, 2015 – 2022
10.2.4.5.5.2.Market Forecast, 2023 – 2031
10.2.5.Government and Public Sector
10.2.5.1.Definition
10.2.5.2.Market Estimation and Penetration, 2015 – 2022
10.2.5.3.Market Forecast, 2023 – 2031
10.2.5.4.Compound Annual Growth Rate (CAGR)
10.2.5.5.Regional Bifurcation
10.2.5.5.1.North America
10.2.5.5.1.1.Market Estimation, 2015 – 2022
10.2.5.5.1.2.Market Forecast, 2023 – 2031
10.2.5.5.2.Europe
10.2.5.5.2.1.Market Estimation, 2015 – 2022
10.2.5.5.2.2.Market Forecast, 2023 – 2031
10.2.5.5.3.Asia Pacific
10.2.5.5.3.1.Market Estimation, 2015 – 2022
10.2.5.5.3.2.Market Forecast, 2023 – 2031
10.2.5.5.4.Middle East and Africa
10.2.5.5.4.1.Market Estimation, 2015 – 2022
10.2.5.5.4.2.Market Forecast, 2023 – 2031
10.2.5.5.5.Latin America
10.2.5.5.5.1.Market Estimation, 2015 – 2022
10.2.5.5.5.2.Market Forecast, 2023 – 2031
10.2.6.IT and Telecom
10.2.6.1.Definition
10.2.6.2.Market Estimation and Penetration, 2015 – 2022
10.2.6.3.Market Forecast, 2023 – 2031
10.2.6.4.Compound Annual Growth Rate (CAGR)
10.2.6.5.Regional Bifurcation
10.2.6.5.1.North America
10.2.6.5.1.1.Market Estimation, 2015 – 2022
10.2.6.5.1.2.Market Forecast, 2023 – 2031
10.2.6.5.2.Europe
10.2.6.5.2.1.Market Estimation, 2015 – 2022
10.2.6.5.2.2.Market Forecast, 2023 – 2031
10.2.6.5.3.Asia Pacific
10.2.6.5.3.1.Market Estimation, 2015 – 2022
10.2.6.5.3.2.Market Forecast, 2023 – 2031
10.2.6.5.4.Middle East and Africa
10.2.6.5.4.1.Market Estimation, 2015 – 2022
10.2.6.5.4.2.Market Forecast, 2023 – 2031
10.2.6.5.5.Latin America
10.2.6.5.5.1.Market Estimation, 2015 – 2022
10.2.6.5.5.2.Market Forecast, 2023 – 2031
10.2.7.Others
10.2.7.1.Definition
10.2.7.2.Market Estimation and Penetration, 2015 – 2022
10.2.7.3.Market Forecast, 2023 – 2031
10.2.7.4.Compound Annual Growth Rate (CAGR)
10.2.7.5.Regional Bifurcation
10.2.7.5.1.North America
10.2.7.5.1.1.Market Estimation, 2015 – 2022
10.2.7.5.1.2.Market Forecast, 2023 – 2031
10.2.7.5.2.Europe
10.2.7.5.2.1.Market Estimation, 2015 – 2022
10.2.7.5.2.2.Market Forecast, 2023 – 2031
10.2.7.5.3.Asia Pacific
10.2.7.5.3.1.Market Estimation, 2015 – 2022
10.2.7.5.3.2.Market Forecast, 2023 – 2031
10.2.7.5.4.Middle East and Africa
10.2.7.5.4.1.Market Estimation, 2015 – 2022
10.2.7.5.4.2.Market Forecast, 2023 – 2031
10.2.7.5.5.Latin America
10.2.7.5.5.1.Market Estimation, 2015 – 2022
10.2.7.5.5.2.Market Forecast, 2023 – 2031
10.3.Key Segment for Channeling Investments
10.3.1.By End User
11.North America Wired Interface Market Analysis and Forecasts, 2023 – 2031
11.1.Overview
11.1.1.North America Wired Interface Market Revenue (US$ Mn)
11.2.North America Wired Interface Market Revenue (US$ Mn) and Forecasts, By Component Type
11.2.1.USB Wired Interface
11.2.2.HDMI Wired Interface
11.2.3.Display Port Wired Interface
11.2.4.Thunderbolt Wired Interface
11.3.North America Wired Interface Market Revenue (US$ Mn) and Forecasts, By Application
11.3.1.Smartphone
11.3.2.Tablet
11.3.3.PC and Laptop
11.3.4.Television
11.3.5.Virtual Reality
11.3.6.Drones
11.3.7.Gaming Console
11.3.8.External Hard Disk
11.3.9.Camera
11.3.10.Projector
11.3.11.Wearable
11.3.12.Home Theatre and Multimedia Device
11.3.13.Power Bank
11.3.14.Display Monitor
11.3.15.USB Flash Drive
11.3.16.Set-Top Box
11.3.17.Others
11.4.North America Wired Interface Market Revenue (US$ Mn) and Forecasts, By End User
11.4.1.Consumer Electronics
11.4.2.Automotive
11.4.3.Healthcare
11.4.4.Retail
11.4.5.Government and Public Sector
11.4.6.IT and Telecom
11.4.7.Others
11.5.North America Wired Interface Market Revenue (US$ Mn) and Forecasts, By Country
11.5.1.U.S
11.5.1.1.U.S Wired Interface Market Revenue (US$ Mn) and Forecasts, By Component Type
11.5.1.1.1.USB Wired Interface
11.5.1.1.2.HDMI Wired Interface
11.5.1.1.3.Display Port Wired Interface
11.5.1.1.4.Thunderbolt Wired Interface
11.5.1.2.U.S Wired Interface Market Revenue (US$ Mn) and Forecasts, By Application
11.5.1.2.1.Smartphone
11.5.1.2.2.Tablet
11.5.1.2.3.PC and Laptop
11.5.1.2.4.Television
11.5.1.2.5.Virtual Reality
11.5.1.2.6.Drones
11.5.1.2.7.Gaming Console
11.5.1.2.8.External Hard Disk
11.5.1.2.9.Camera
11.5.1.2.10.Projector
11.5.1.2.11.Wearable
11.5.1.2.12.Home Theatre and Multimedia Device
11.5.1.2.13.Power Bank
11.5.1.2.14.Display Monitor
11.5.1.2.15.USB Flash Drive
11.5.1.2.16.Set-Top Box
11.5.1.2.17.Others
11.5.1.3.U.S Wired Interface Market Revenue (US$ Mn) and Forecasts, By End User
11.5.1.3.1.Consumer Electronics
11.5.1.3.2.Automotive
11.5.1.3.3.Healthcare
11.5.1.3.4.Retail
11.5.1.3.5.Government and Public Sector
11.5.1.3.6.IT and Telecom
11.5.1.3.7.Others
11.5.2.Canada
11.5.2.1.Canada Wired Interface Market Revenue (US$ Mn) and Forecasts, By Component Type
11.5.2.1.1.USB Wired Interface
11.5.2.1.2.HDMI Wired Interface
11.5.2.1.3.Display Port Wired Interface
11.5.2.1.4.Thunderbolt Wired Interface
11.5.2.2.Canada Wired Interface Market Revenue (US$ Mn) and Forecasts, By Application
11.5.2.2.1.Smartphone
11.5.2.2.2.Tablet
11.5.2.2.3.PC and Laptop
11.5.2.2.4.Television
11.5.2.2.5.Virtual Reality
11.5.2.2.6.Drones
11.5.2.2.7.Gaming Console
11.5.2.2.8.External Hard Disk
11.5.2.2.9.Camera
11.5.2.2.10.Projector
11.5.2.2.11.Wearable
11.5.2.2.12.Home Theatre and Multimedia Device
11.5.2.2.13.Power Bank
11.5.2.2.14.Display Monitor
11.5.2.2.15.USB Flash Drive
11.5.2.2.16.Set-Top Box
11.5.2.2.17.Others
11.5.2.3.Canada Wired Interface Market Revenue (US$ Mn) and Forecasts, By End User
11.5.2.3.1.Consumer Electronics
11.5.2.3.2.Automotive
11.5.2.3.3.Healthcare
11.5.2.3.4.Retail
11.5.2.3.5.Government and Public Sector
11.5.2.3.6.IT and Telecom
11.5.2.3.7.Others
11.5.3.Mexico
11.5.3.1.Mexico Wired Interface Market Revenue (US$ Mn) and Forecasts, By Component Type
11.5.3.1.1.USB Wired Interface
11.5.3.1.2.HDMI Wired Interface
11.5.3.1.3.Display Port Wired Interface
11.5.3.1.4.Thunderbolt Wired Interface
11.5.3.2.Mexico Wired Interface Market Revenue (US$ Mn) and Forecasts, By Application
11.5.3.2.1.Smartphone
11.5.3.2.2.Tablet
11.5.3.2.3.PC and Laptop
11.5.3.2.4.Television
11.5.3.2.5.Virtual Reality
11.5.3.2.6.Drones
11.5.3.2.7.Gaming Console
11.5.3.2.8.External Hard Disk
11.5.3.2.9.Camera
11.5.3.2.10.Projector
11.5.3.2.11.Wearable
11.5.3.2.12.Home Theatre and Multimedia Device
11.5.3.2.13.Power Bank
11.5.3.2.14.Display Monitor
11.5.3.2.15.USB Flash Drive
11.5.3.2.16.Set-Top Box
11.5.3.2.17.Others
11.5.3.3.Mexico Wired Interface Market Revenue (US$ Mn) and Forecasts, By End User
11.5.3.3.1.Consumer Electronics
11.5.3.3.2.Automotive
11.5.3.3.3.Healthcare
11.5.3.3.4.Retail
11.5.3.3.5.Government and Public Sector
11.5.3.3.6.IT and Telecom
11.5.3.3.7.Others
11.5.4.Rest of North America
11.5.4.1.Rest of North America Wired Interface Market Revenue (US$ Mn) and Forecasts, By Component Type
11.5.4.1.1.USB Wired Interface
11.5.4.1.2.HDMI Wired Interface
11.5.4.1.3.Display Port Wired Interface
11.5.4.1.4.Thunderbolt Wired Interface
11.5.4.2.Rest of North America Wired Interface Market Revenue (US$ Mn) and Forecasts, By Application
11.5.4.2.1.Smartphone
11.5.4.2.2.Tablet
11.5.4.2.3.PC and Laptop
11.5.4.2.4.Television
11.5.4.2.5.Virtual Reality
11.5.4.2.6.Drones
11.5.4.2.7.Gaming Console
11.5.4.2.8.External Hard Disk
11.5.4.2.9.Camera
11.5.4.2.10.Projector
11.5.4.2.11.Wearable
11.5.4.2.12.Home Theatre and Multimedia Device
11.5.4.2.13.Power Bank
11.5.4.2.14.Display Monitor
11.5.4.2.15.USB Flash Drive
11.5.4.2.16.Set-Top Box
11.5.4.2.17.Others
11.5.4.3.Rest of North America Wired Interface Market Revenue (US$ Mn) and Forecasts, By End User
11.5.4.3.1.Consumer Electronics
11.5.4.3.2.Automotive
11.5.4.3.3.Healthcare
11.5.4.3.4.Retail
11.5.4.3.5.Government and Public Sector
11.5.4.3.6.IT and Telecom
11.5.4.3.7.Others
11.6.Key Segment for Channeling Investments
11.6.1.By Country
11.6.2.By Component Type
11.6.3.By Application
11.6.4.By End User
12.Europe Wired Interface Market Analysis and Forecasts, 2023 – 2031
12.1.Overview
12.1.1.Europe Wired Interface Market Revenue (US$ Mn)
12.2.Europe Wired Interface Market Revenue (US$ Mn) and Forecasts, By Component Type
12.2.1.USB Wired Interface
12.2.2.HDMI Wired Interface
12.2.3.Display Port Wired Interface
12.2.4.Thunderbolt Wired Interface
12.3.Europe Wired Interface Market Revenue (US$ Mn) and Forecasts, By Application
12.3.1.Smartphone
12.3.2.Tablet
12.3.3.PC and Laptop
12.3.4.Television
12.3.5.Virtual Reality
12.3.6.Drones
12.3.7.Gaming Console
12.3.8.External Hard Disk
12.3.9.Camera
12.3.10.Projector
12.3.11.Wearable
12.3.12.Home Theatre and Multimedia Device
12.3.13.Power Bank
12.3.14.Display Monitor
12.3.15.USB Flash Drive
12.3.16.Set-Top Box
12.3.17.Others
12.4.Europe Wired Interface Market Revenue (US$ Mn) and Forecasts, By End User
12.4.1.Consumer Electronics
12.4.2.Automotive
12.4.3.Healthcare
12.4.4.Retail
12.4.5.Government and Public Sector
12.4.6.IT and Telecom
12.4.7.Others
12.5.Europe Wired Interface Market Revenue (US$ Mn) and Forecasts, By Country
12.5.1.France
12.5.1.1.France Wired Interface Market Revenue (US$ Mn) and Forecasts, By Component Type
12.5.1.1.1.USB Wired Interface
12.5.1.1.2.HDMI Wired Interface
12.5.1.1.3.Display Port Wired Interface
12.5.1.1.4.Thunderbolt Wired Interface
12.5.1.2.France Wired Interface Market Revenue (US$ Mn) and Forecasts, By Application
12.5.1.2.1.Smartphone
12.5.1.2.2.Tablet
12.5.1.2.3.PC and Laptop
12.5.1.2.4.Television
12.5.1.2.5.Virtual Reality
12.5.1.2.6.Drones
12.5.1.2.7.Gaming Console
12.5.1.2.8.External Hard Disk
12.5.1.2.9.Camera
12.5.1.2.10.Projector
12.5.1.2.11.Wearable
12.5.1.2.12.Home Theatre and Multimedia Device
12.5.1.2.13.Power Bank
12.5.1.2.14.Display Monitor
12.5.1.2.15.USB Flash Drive
12.5.1.2.16.Set-Top Box
12.5.1.2.17.Others
12.5.1.3.France Wired Interface Market Revenue (US$ Mn) and Forecasts, By End User
12.5.1.3.1.Consumer Electronics
12.5.1.3.2.Automotive
12.5.1.3.3.Healthcare
12.5.1.3.4.Retail
12.5.1.3.5.Government and Public Sector
12.5.1.3.6.IT and Telecom
12.5.1.3.7.Others
12.5.2.The UK
12.5.2.1.The UK Wired Interface Market Revenue (US$ Mn) and Forecasts, By Component Type
12.5.2.1.1.USB Wired Interface
12.5.2.1.2.HDMI Wired Interface
12.5.2.1.3.Display Port Wired Interface
12.5.2.1.4.Thunderbolt Wired Interface
12.5.2.2.The UK Wired Interface Market Revenue (US$ Mn) and Forecasts, By Application
12.5.2.2.1.Smartphone
12.5.2.2.2.Tablet
12.5.2.2.3.PC and Laptop
12.5.2.2.4.Television
12.5.2.2.5.Virtual Reality
12.5.2.2.6.Drones
12.5.2.2.7.Gaming Console
12.5.2.2.8.External Hard Disk
12.5.2.2.9.Camera
12.5.2.2.10.Projector
12.5.2.2.11.Wearable
12.5.2.2.12.Home Theatre and Multimedia Device
12.5.2.2.13.Power Bank
12.5.2.2.14.Display Monitor
12.5.2.2.15.USB Flash Drive
12.5.2.2.16.Set-Top Box
12.5.2.2.17.Others
12.5.2.3.The UK Wired Interface Market Revenue (US$ Mn) and Forecasts, By End User
12.5.2.3.1.Consumer Electronics
12.5.2.3.2.Automotive
12.5.2.3.3.Healthcare
12.5.2.3.4.Retail
12.5.2.3.5.Government and Public Sector
12.5.2.3.6.IT and Telecom
12.5.2.3.7.Others
12.5.3.Spain
12.5.3.1.Spain Wired Interface Market Revenue (US$ Mn) and Forecasts, By Component Type
12.5.3.1.1.USB Wired Interface
12.5.3.1.2.HDMI Wired Interface
12.5.3.1.3.Display Port Wired Interface
12.5.3.1.4.Thunderbolt Wired Interface
12.5.3.2.Spain Wired Interface Market Revenue (US$ Mn) and Forecasts, By Application
12.5.3.2.1.Smartphone
12.5.3.2.2.Tablet
12.5.3.2.3.PC and Laptop
12.5.3.2.4.Television
12.5.3.2.5.Virtual Reality
12.5.3.2.6.Drones
12.5.3.2.7.Gaming Console
12.5.3.2.8.External Hard Disk
12.5.3.2.9.Camera
12.5.3.2.10.Projector
12.5.3.2.11.Wearable
12.5.3.2.12.Home Theatre and Multimedia Device
12.5.3.2.13.Power Bank
12.5.3.2.14.Display Monitor
12.5.3.2.15.USB Flash Drive
12.5.3.2.16.Set-Top Box
12.5.3.2.17.Others
12.5.3.3.Spain Wired Interface Market Revenue (US$ Mn) and Forecasts, By End User
12.5.3.3.1.Consumer Electronics
12.5.3.3.2.Automotive
12.5.3.3.3.Healthcare
12.5.3.3.4.Retail
12.5.3.3.5.Government and Public Sector
12.5.3.3.6.IT and Telecom
12.5.3.3.7.Others
12.5.4.Germany
12.5.4.1.Germany Wired Interface Market Revenue (US$ Mn) and Forecasts, By Component Type
12.5.4.1.1.USB Wired Interface
12.5.4.1.2.HDMI Wired Interface
12.5.4.1.3.Display Port Wired Interface
12.5.4.1.4.Thunderbolt Wired Interface
12.5.4.2.Germany Wired Interface Market Revenue (US$ Mn) and Forecasts, By Application
12.5.4.2.1.Smartphone
12.5.4.2.2.Tablet
12.5.4.2.3.PC and Laptop
12.5.4.2.4.Television
12.5.4.2.5.Virtual Reality
12.5.4.2.6.Drones
12.5.4.2.7.Gaming Console
12.5.4.2.8.External Hard Disk
12.5.4.2.9.Camera
12.5.4.2.10.Projector
12.5.4.2.11.Wearable
12.5.4.2.12.Home Theatre and Multimedia Device
12.5.4.2.13.Power Bank
12.5.4.2.14.Display Monitor
12.5.4.2.15.USB Flash Drive
12.5.4.2.16.Set-Top Box
12.5.4.2.17.Others
12.5.4.3.Germany Wired Interface Market Revenue (US$ Mn) and Forecasts, By End User
12.5.4.3.1.Consumer Electronics
12.5.4.3.2.Automotive
12.5.4.3.3.Healthcare
12.5.4.3.4.Retail
12.5.4.3.5.Government and Public Sector
12.5.4.3.6.IT and Telecom
12.5.4.3.7.Others
12.5.5.Italy
12.5.5.1.Italy Wired Interface Market Revenue (US$ Mn) and Forecasts, By Component Type
12.5.5.1.1.USB Wired Interface
12.5.5.1.2.HDMI Wired Interface
12.5.5.1.3.Display Port Wired Interface
12.5.5.1.4.Thunderbolt Wired Interface
12.5.5.2.Italy Wired Interface Market Revenue (US$ Mn) and Forecasts, By Application
12.5.5.2.1.Smartphone
12.5.5.2.2.Tablet
12.5.5.2.3.PC and Laptop
12.5.5.2.4.Television
12.5.5.2.5.Virtual Reality
12.5.5.2.6.Drones
12.5.5.2.7.Gaming Console
12.5.5.2.8.External Hard Disk
12.5.5.2.9.Camera
12.5.5.2.10.Projector
12.5.5.2.11.Wearable
12.5.5.2.12.Home Theatre and Multimedia Device
12.5.5.2.13.Power Bank
12.5.5.2.14.Display Monitor
12.5.5.2.15.USB Flash Drive
12.5.5.2.16.Set-Top Box
12.5.5.2.17.Others
12.5.5.3.Italy Wired Interface Market Revenue (US$ Mn) and Forecasts, By End User
12.5.5.3.1.Consumer Electronics
12.5.5.3.2.Automotive
12.5.5.3.3.Healthcare
12.5.5.3.4.Retail
12.5.5.3.5.Government and Public Sector
12.5.5.3.6.IT and Telecom
12.5.5.3.7.Others
12.5.6.Nordic Countries
12.5.6.1.Nordic Countries Wired Interface Market Revenue (US$ Mn) and Forecasts, By Component Type
12.5.6.1.1.USB Wired Interface
12.5.6.1.2.HDMI Wired Interface
12.5.6.1.3.Display Port Wired Interface
12.5.6.1.4.Thunderbolt Wired Interface
12.5.6.2.Nordic Countries Wired Interface Market Revenue (US$ Mn) and Forecasts, By Application
12.5.6.2.1.Smartphone
12.5.6.2.2.Tablet
12.5.6.2.3.PC and Laptop
12.5.6.2.4.Television
12.5.6.2.5.Virtual Reality
12.5.6.2.6.Drones
12.5.6.2.7.Gaming Console
12.5.6.2.8.External Hard Disk
12.5.6.2.9.Camera
12.5.6.2.10.Projector
12.5.6.2.11.Wearable
12.5.6.2.12.Home Theatre and Multimedia Device
12.5.6.2.13.Power Bank
12.5.6.2.14.Display Monitor
12.5.6.2.15.USB Flash Drive
12.5.6.2.16.Set-Top Box
12.5.6.2.17.Others
12.5.6.3.Nordic Countries Wired Interface Market Revenue (US$ Mn) and Forecasts, By End User
12.5.6.3.1.Consumer Electronics
12.5.6.3.2.Automotive
12.5.6.3.3.Healthcare
12.5.6.3.4.Retail
12.5.6.3.5.Government and Public Sector
12.5.6.3.6.IT and Telecom
12.5.6.3.7.Others
12.5.6.4.Nordic Countries Wired Interface Market Revenue (US$ Mn) and Forecasts, By Country
12.5.6.4.1.Denmark
12.5.6.4.2.Finland
12.5.6.4.3.Iceland
12.5.6.4.4.Sweden
12.5.6.4.5.Norway
12.5.7.Benelux Union
12.5.7.1.Benelux Union Wired Interface Market Revenue (US$ Mn) and Forecasts, By Component Type
12.5.7.1.1.USB Wired Interface
12.5.7.1.2.HDMI Wired Interface
12.5.7.1.3.Display Port Wired Interface
12.5.7.1.4.Thunderbolt Wired Interface
12.5.7.2.Benelux Union Wired Interface Market Revenue (US$ Mn) and Forecasts, By Application
12.5.7.2.1.Smartphone
12.5.7.2.2.Tablet
12.5.7.2.3.PC and Laptop
12.5.7.2.4.Television
12.5.7.2.5.Virtual Reality
12.5.7.2.6.Drones
12.5.7.2.7.Gaming Console
12.5.7.2.8.External Hard Disk
12.5.7.2.9.Camera
12.5.7.2.10.Projector
12.5.7.2.11.Wearable
12.5.7.2.12.Home Theatre and Multimedia Device
12.5.7.2.13.Power Bank
12.5.7.2.14.Display Monitor
12.5.7.2.15.USB Flash Drive
12.5.7.2.16.Set-Top Box
12.5.7.2.17.Others
12.5.7.3.Benelux Union Wired Interface Market Revenue (US$ Mn) and Forecasts, By End User
12.5.7.3.1.Consumer Electronics
12.5.7.3.2.Automotive
12.5.7.3.3.Healthcare
12.5.7.3.4.Retail
12.5.7.3.5.Government and Public Sector
12.5.7.3.6.IT and Telecom
12.5.7.3.7.Others
12.5.7.4.Benelux Union Wired Interface Market Revenue (US$ Mn) and Forecasts, By Country
12.5.7.4.1.Belgium
12.5.7.4.2.The Netherlands
12.5.7.4.3.Luxembourg
12.5.8.Rest of Europe
12.5.8.1.Rest of Europe Wired Interface Market Revenue (US$ Mn) and Forecasts, By Component Type
12.5.8.1.1.USB Wired Interface
12.5.8.1.2.HDMI Wired Interface
12.5.8.1.3.Display Port Wired Interface
12.5.8.1.4.Thunderbolt Wired Interface
12.5.8.2.Rest of Europe Wired Interface Market Revenue (US$ Mn) and Forecasts, By Application
12.5.8.2.1.Smartphone
12.5.8.2.2.Tablet
12.5.8.2.3.PC and Laptop
12.5.8.2.4.Television
12.5.8.2.5.Virtual Reality
12.5.8.2.6.Drones
12.5.8.2.7.Gaming Console
12.5.8.2.8.External Hard Disk
12.5.8.2.9.Camera
12.5.8.2.10.Projector
12.5.8.2.11.Wearable
12.5.8.2.12.Home Theatre and Multimedia Device
12.5.8.2.13.Power Bank
12.5.8.2.14.Display Monitor
12.5.8.2.15.USB Flash Drive
12.5.8.2.16.Set-Top Box
12.5.8.2.17.Others
12.5.8.3.Rest of Europe Wired Interface Market Revenue (US$ Mn) and Forecasts, By End User
12.5.8.3.1.Consumer Electronics
12.5.8.3.2.Automotive
12.5.8.3.3.Healthcare
12.5.8.3.4.Retail
12.5.8.3.5.Government and Public Sector
12.5.8.3.6.IT and Telecom
12.5.8.3.7.Others
12.6.Key Segment for Channeling Investments
12.6.1.By Country
12.6.2.By Component Type
12.6.3.By Application
12.6.4.By End User
13.Asia Pacific Wired Interface Market Analysis and Forecasts, 2023 – 2031
13.1.Overview
13.1.1.Asia Pacific Wired Interface Market Revenue (US$ Mn)
13.2.Asia Pacific Wired Interface Market Revenue (US$ Mn) and Forecasts, By Component Type
13.2.1.USB Wired Interface
13.2.2.HDMI Wired Interface
13.2.3.Display Port Wired Interface
13.2.4.Thunderbolt Wired Interface
13.3.Asia Pacific Wired Interface Market Revenue (US$ Mn) and Forecasts, By Application
13.3.1.Smartphone
13.3.2.Tablet
13.3.3.PC and Laptop
13.3.4.Television
13.3.5.Virtual Reality
13.3.6.Drones
13.3.7.Gaming Console
13.3.8.External Hard Disk
13.3.9.Camera
13.3.10.Projector
13.3.11.Wearable
13.3.12.Home Theatre and Multimedia Device
13.3.13.Power Bank
13.3.14.Display Monitor
13.3.15.USB Flash Drive
13.3.16.Set-Top Box
13.3.17.Others
13.4.Asia Pacific Wired Interface Market Revenue (US$ Mn) and Forecasts, By End User
13.4.1.Consumer Electronics
13.4.2.Automotive
13.4.3.Healthcare
13.4.4.Retail
13.4.5.Government and Public Sector
13.4.6.IT and Telecom
13.4.7.Others
13.5.Asia Pacific Wired Interface Market Revenue (US$ Mn) and Forecasts, By Country
13.5.1.China
13.5.1.1.China Wired Interface Market Revenue (US$ Mn) and Forecasts, By Component Type
13.5.1.1.1.USB Wired Interface
13.5.1.1.2.HDMI Wired Interface
13.5.1.1.3.Display Port Wired Interface
13.5.1.1.4.Thunderbolt Wired Interface
13.5.1.2.China Wired Interface Market Revenue (US$ Mn) and Forecasts, By Application
13.5.1.2.1.Smartphone
13.5.1.2.2.Tablet
13.5.1.2.3.PC and Laptop
13.5.1.2.4.Television
13.5.1.2.5.Virtual Reality
13.5.1.2.6.Drones
13.5.1.2.7.Gaming Console
13.5.1.2.8.External Hard Disk
13.5.1.2.9.Camera
13.5.1.2.10.Projector
13.5.1.2.11.Wearable
13.5.1.2.12.Home Theatre and Multimedia Device
13.5.1.2.13.Power Bank
13.5.1.2.14.Display Monitor
13.5.1.2.15.USB Flash Drive
13.5.1.2.16.Set-Top Box
13.5.1.2.17.Others
13.5.1.3.China Wired Interface Market Revenue (US$ Mn) and Forecasts, By End User
13.5.1.3.1.Consumer Electronics
13.5.1.3.2.Automotive
13.5.1.3.3.Healthcare
13.5.1.3.4.Retail
13.5.1.3.5.Government and Public Sector
13.5.1.3.6.IT and Telecom
13.5.1.3.7.Others
13.5.2.Japan
13.5.2.1.Japan Wired Interface Market Revenue (US$ Mn) and Forecasts, By Component Type
13.5.2.1.1.USB Wired Interface
13.5.2.1.2.HDMI Wired Interface
13.5.2.1.3.Display Port Wired Interface
13.5.2.1.4.Thunderbolt Wired Interface
13.5.2.2.Japan Wired Interface Market Revenue (US$ Mn) and Forecasts, By Application
13.5.2.2.1.Smartphone
13.5.2.2.2.Tablet
13.5.2.2.3.PC and Laptop
13.5.2.2.4.Television
13.5.2.2.5.Virtual Reality
13.5.2.2.6.Drones
13.5.2.2.7.Gaming Console
13.5.2.2.8.External Hard Disk
13.5.2.2.9.Camera
13.5.2.2.10.Projector
13.5.2.2.11.Wearable
13.5.2.2.12.Home Theatre and Multimedia Device
13.5.2.2.13.Power Bank
13.5.2.2.14.Display Monitor
13.5.2.2.15.USB Flash Drive
13.5.2.2.16.Set-Top Box
13.5.2.2.17.Others
13.5.2.3.Japan Wired Interface Market Revenue (US$ Mn) and Forecasts, By End User
13.5.2.3.1.Consumer Electronics
13.5.2.3.2.Automotive
13.5.2.3.3.Healthcare
13.5.2.3.4.Retail
13.5.2.3.5.Government and Public Sector
13.5.2.3.6.IT and Telecom
13.5.2.3.7.Others
13.5.3.India
13.5.3.1.India Wired Interface Market Revenue (US$ Mn) and Forecasts, By Component Type
13.5.3.1.1.USB Wired Interface
13.5.3.1.2.HDMI Wired Interface
13.5.3.1.3.Display Port Wired Interface
13.5.3.1.4.Thunderbolt Wired Interface
13.5.3.2.India Wired Interface Market Revenue (US$ Mn) and Forecasts, By Application
13.5.3.2.1.Smartphone
13.5.3.2.2.Tablet
13.5.3.2.3.PC and Laptop
13.5.3.2.4.Television
13.5.3.2.5.Virtual Reality
13.5.3.2.6.Drones
13.5.3.2.7.Gaming Console
13.5.3.2.8.External Hard Disk
13.5.3.2.9.Camera
13.5.3.2.10.Projector
13.5.3.2.11.Wearable
13.5.3.2.12.Home Theatre and Multimedia Device
13.5.3.2.13.Power Bank
13.5.3.2.14.Display Monitor
13.5.3.2.15.USB Flash Drive
13.5.3.2.16.Set-Top Box
13.5.3.2.17.Others
13.5.3.3.India Wired Interface Market Revenue (US$ Mn) and Forecasts, By End User
13.5.3.3.1.Consumer Electronics
13.5.3.3.2.Automotive
13.5.3.3.3.Healthcare
13.5.3.3.4.Retail
13.5.3.3.5.Government and Public Sector
13.5.3.3.6.IT and Telecom
13.5.3.3.7.Others
13.5.4.New Zealand
13.5.4.1.New Zealand Wired Interface Market Revenue (US$ Mn) and Forecasts, By Component Type
13.5.4.1.1.USB Wired Interface
13.5.4.1.2.HDMI Wired Interface
13.5.4.1.3.Display Port Wired Interface
13.5.4.1.4.Thunderbolt Wired Interface
13.5.4.2.New Zealand Wired Interface Market Revenue (US$ Mn) and Forecasts, By Application
13.5.4.2.1.Smartphone
13.5.4.2.2.Tablet
13.5.4.2.3.PC and Laptop
13.5.4.2.4.Television
13.5.4.2.5.Virtual Reality
13.5.4.2.6.Drones
13.5.4.2.7.Gaming Console
13.5.4.2.8.External Hard Disk
13.5.4.2.9.Camera
13.5.4.2.10.Projector
13.5.4.2.11.Wearable
13.5.4.2.12.Home Theatre and Multimedia Device
13.5.4.2.13.Power Bank
13.5.4.2.14.Display Monitor
13.5.4.2.15.USB Flash Drive
13.5.4.2.16.Set-Top Box
13.5.4.2.17.Others
13.5.4.3.New Zealand Wired Interface Market Revenue (US$ Mn) and Forecasts, By End User
13.5.4.3.1.Consumer Electronics
13.5.4.3.2.Automotive
13.5.4.3.3.Healthcare
13.5.4.3.4.Retail
13.5.4.3.5.Government and Public Sector
13.5.4.3.6.IT and Telecom
13.5.4.3.7.Others
13.5.5.Australia
13.5.5.1.Australia Wired Interface Market Revenue (US$ Mn) and Forecasts, By Component Type
13.5.5.1.1.USB Wired Interface
13.5.5.1.2.HDMI Wired Interface
13.5.5.1.3.Display Port Wired Interface
13.5.5.1.4.Thunderbolt Wired Interface
13.5.5.2.Australia Wired Interface Market Revenue (US$ Mn) and Forecasts, By Application
13.5.5.2.1.Smartphone
13.5.5.2.2.Tablet
13.5.5.2.3.PC and Laptop
13.5.5.2.4.Television
13.5.5.2.5.Virtual Reality
13.5.5.2.6.Drones
13.5.5.2.7.Gaming Console
13.5.5.2.8.External Hard Disk
13.5.5.2.9.Camera
13.5.5.2.10.Projector
13.5.5.2.11.Wearable
13.5.5.2.12.Home Theatre and Multimedia Device
13.5.5.2.13.Power Bank
13.5.5.2.14.Display Monitor
13.5.5.2.15.USB Flash Drive
13.5.5.2.16.Set-Top Box
13.5.5.2.17.Others
13.5.5.3.Australia Wired Interface Market Revenue (US$ Mn) and Forecasts, By End User
13.5.5.3.1.Consumer Electronics
13.5.5.3.2.Automotive
13.5.5.3.3.Healthcare
13.5.5.3.4.Retail
13.5.5.3.5.Government and Public Sector
13.5.5.3.6.IT and Telecom
13.5.5.3.7.Others
13.5.6.South Korea
13.5.6.1.South Korea Wired Interface Market Revenue (US$ Mn) and Forecasts, By Component Type
13.5.6.1.1.USB Wired Interface
13.5.6.1.2.HDMI Wired Interface
13.5.6.1.3.Display Port Wired Interface
13.5.6.1.4.Thunderbolt Wired Interface
13.5.6.2.South Korea Wired Interface Market Revenue (US$ Mn) and Forecasts, By Application
13.5.6.2.1.Smartphone
13.5.6.2.2.Tablet
13.5.6.2.3.PC and Laptop
13.5.6.2.4.Television
13.5.6.2.5.Virtual Reality
13.5.6.2.6.Drones
13.5.6.2.7.Gaming Console
13.5.6.2.8.External Hard Disk
13.5.6.2.9.Camera
13.5.6.2.10.Projector
13.5.6.2.11.Wearable
13.5.6.2.12.Home Theatre and Multimedia Device
13.5.6.2.13.Power Bank
13.5.6.2.14.Display Monitor
13.5.6.2.15.USB Flash Drive
13.5.6.2.16.Set-Top Box
13.5.6.2.17.Others
13.5.6.3.South Korea Wired Interface Market Revenue (US$ Mn) and Forecasts, By End User
13.5.6.3.1.Consumer Electronics
13.5.6.3.2.Automotive
13.5.6.3.3.Healthcare
13.5.6.3.4.Retail
13.5.6.3.5.Government and Public Sector
13.5.6.3.6.IT and Telecom
13.5.6.3.7.Others
13.5.7.Southeast Asia
13.5.7.1.Southeast Asia Wired Interface Market Revenue (US$ Mn) and Forecasts, By Component Type
13.5.7.1.1.USB Wired Interface
13.5.7.1.2.HDMI Wired Interface
13.5.7.1.3.Display Port Wired Interface
13.5.7.1.4.Thunderbolt Wired Interface
13.5.7.2.Southeast Asia Wired Interface Market Revenue (US$ Mn) and Forecasts, By Application
13.5.7.2.1.Smartphone
13.5.7.2.2.Tablet
13.5.7.2.3.PC and Laptop
13.5.7.2.4.Television
13.5.7.2.5.Virtual Reality
13.5.7.2.6.Drones
13.5.7.2.7.Gaming Console
13.5.7.2.8.External Hard Disk
13.5.7.2.9.Camera
13.5.7.2.10.Projector
13.5.7.2.11.Wearable
13.5.7.2.12.Home Theatre and Multimedia Device
13.5.7.2.13.Power Bank
13.5.7.2.14.Display Monitor
13.5.7.2.15.USB Flash Drive
13.5.7.2.16.Set-Top Box
13.5.7.2.17.Others
13.5.7.3.Southeast Asia Wired Interface Market Revenue (US$ Mn) and Forecasts, By End User
13.5.7.3.1.Consumer Electronics
13.5.7.3.2.Automotive
13.5.7.3.3.Healthcare
13.5.7.3.4.Retail
13.5.7.3.5.Government and Public Sector
13.5.7.3.6.IT and Telecom
13.5.7.3.7.Others
13.5.7.4.Southeast Asia Wired Interface Market Revenue (US$ Mn) and Forecasts, By Country
13.5.7.4.1.Indonesia
13.5.7.4.2.Thailand
13.5.7.4.3.Malaysia
13.5.7.4.4.Singapore
13.5.7.4.5.Rest of Southeast Asia
13.5.8.Rest of Asia Pacific
13.5.8.1.Rest of Asia Pacific Wired Interface Market Revenue (US$ Mn) and Forecasts, By Component Type
13.5.8.1.1.USB Wired Interface
13.5.8.1.2.HDMI Wired Interface
13.5.8.1.3.Display Port Wired Interface
13.5.8.1.4.Thunderbolt Wired Interface
13.5.8.2.Rest of Asia Pacific Wired Interface Market Revenue (US$ Mn) and Forecasts, By Application
13.5.8.2.1.Smartphone
13.5.8.2.2.Tablet
13.5.8.2.3.PC and Laptop
13.5.8.2.4.Television
13.5.8.2.5.Virtual Reality
13.5.8.2.6.Drones
13.5.8.2.7.Gaming Console
13.5.8.2.8.External Hard Disk
13.5.8.2.9.Camera
13.5.8.2.10.Projector
13.5.8.2.11.Wearable
13.5.8.2.12.Home Theatre and Multimedia Device
13.5.8.2.13.Power Bank
13.5.8.2.14.Display Monitor
13.5.8.2.15.USB Flash Drive
13.5.8.2.16.Set-Top Box
13.5.8.2.17.Others
13.5.8.3.Rest of Asia Pacific Wired Interface Market Revenue (US$ Mn) and Forecasts, By End User
13.5.8.3.1.Consumer Electronics
13.5.8.3.2.Automotive
13.5.8.3.3.Healthcare
13.5.8.3.4.Retail
13.5.8.3.5.Government and Public Sector
13.5.8.3.6.IT and Telecom
13.5.8.3.7.Others
13.6.Key Segment for Channeling Investments
13.6.1.By Country
13.6.2.By Component Type
13.6.3.By Application
13.6.4.By End User
14.Middle East and Africa Wired Interface Market Analysis and Forecasts, 2023 – 2031
14.1.Overview
14.1.1.Middle East and Africa Wired Interface Market Revenue (US$ Mn)
14.2.Middle East and Africa Wired Interface Market Revenue (US$ Mn) and Forecasts, By Component Type
14.2.1.USB Wired Interface
14.2.2.HDMI Wired Interface
14.2.3.Display Port Wired Interface
14.2.4.Thunderbolt Wired Interface
14.3.Middle East and Africa Wired Interface Market Revenue (US$ Mn) and Forecasts, By Application
14.3.1.Smartphone
14.3.2.Tablet
14.3.3.PC and Laptop
14.3.4.Television
14.3.5.Virtual Reality
14.3.6.Drones
14.3.7.Gaming Console
14.3.8.External Hard Disk
14.3.9.Camera
14.3.10.Projector
14.3.11.Wearable
14.3.12.Home Theatre and Multimedia Device
14.3.13.Power Bank
14.3.14.Display Monitor
14.3.15.USB Flash Drive
14.3.16.Set-Top Box
14.3.17.Others
14.4.Middle East and Africa Wired Interface Market Revenue (US$ Mn) and Forecasts, By End User
14.4.1.Consumer Electronics
14.4.2.Automotive
14.4.3.Healthcare
14.4.4.Retail
14.4.5.Government and Public Sector
14.4.6.IT and Telecom
14.4.7.Others
14.5.Middle East and Africa Wired Interface Market Revenue (US$ Mn) and Forecasts, By Country
14.5.1.Saudi Arabia
14.5.1.1.Saudi Arabia Wired Interface Market Revenue (US$ Mn) and Forecasts, By Component Type
14.5.1.1.1.USB Wired Interface
14.5.1.1.2.HDMI Wired Interface
14.5.1.1.3.Display Port Wired Interface
14.5.1.1.4.Thunderbolt Wired Interface
14.5.1.2.Saudi Arabia Wired Interface Market Revenue (US$ Mn) and Forecasts, By Application
14.5.1.2.1.Smartphone
14.5.1.2.2.Tablet
14.5.1.2.3.PC and Laptop
14.5.1.2.4.Television
14.5.1.2.5.Virtual Reality
14.5.1.2.6.Drones
14.5.1.2.7.Gaming Console
14.5.1.2.8.External Hard Disk
14.5.1.2.9.Camera
14.5.1.2.10.Projector
14.5.1.2.11.Wearable
14.5.1.2.12.Home Theatre and Multimedia Device
14.5.1.2.13.Power Bank
14.5.1.2.14.Display Monitor
14.5.1.2.15.USB Flash Drive
14.5.1.2.16.Set-Top Box
14.5.1.2.17.Others
14.5.1.3.Saudi Arabia Wired Interface Market Revenue (US$ Mn) and Forecasts, By End User
14.5.1.3.1.Consumer Electronics
14.5.1.3.2.Automotive
14.5.1.3.3.Healthcare
14.5.1.3.4.Retail
14.5.1.3.5.Government and Public Sector
14.5.1.3.6.IT and Telecom
14.5.1.3.7.Others
14.5.2.UAE
14.5.2.1.UAE Wired Interface Market Revenue (US$ Mn) and Forecasts, By Component Type
14.5.2.1.1.USB Wired Interface
14.5.2.1.2.HDMI Wired Interface
14.5.2.1.3.Display Port Wired Interface
14.5.2.1.4.Thunderbolt Wired Interface
14.5.2.2.UAE Wired Interface Market Revenue (US$ Mn) and Forecasts, By Application
14.5.2.2.1.Smartphone
14.5.2.2.2.Tablet
14.5.2.2.3.PC and Laptop
14.5.2.2.4.Television
14.5.2.2.5.Virtual Reality
14.5.2.2.6.Drones
14.5.2.2.7.Gaming Console
14.5.2.2.8.External Hard Disk
14.5.2.2.9.Camera
14.5.2.2.10.Projector
14.5.2.2.11.Wearable
14.5.2.2.12.Home Theatre and Multimedia Device
14.5.2.2.13.Power Bank
14.5.2.2.14.Display Monitor
14.5.2.2.15.USB Flash Drive
14.5.2.2.16.Set-Top Box
14.5.2.2.17.Others
14.5.2.3.UAE Wired Interface Market Revenue (US$ Mn) and Forecasts, By End User
14.5.2.3.1.Consumer Electronics
14.5.2.3.2.Automotive
14.5.2.3.3.Healthcare
14.5.2.3.4.Retail
14.5.2.3.5.Government and Public Sector
14.5.2.3.6.IT and Telecom
14.5.2.3.7.Others
14.5.3.Egypt
14.5.3.1.Egypt Wired Interface Market Revenue (US$ Mn) and Forecasts, By Component Type
14.5.3.1.1.USB Wired Interface
14.5.3.1.2.HDMI Wired Interface
14.5.3.1.3.Display Port Wired Interface
14.5.3.1.4.Thunderbolt Wired Interface
14.5.3.2.Egypt Wired Interface Market Revenue (US$ Mn) and Forecasts, By Application
14.5.3.2.1.Smartphone
14.5.3.2.2.Tablet
14.5.3.2.3.PC and Laptop
14.5.3.2.4.Television
14.5.3.2.5.Virtual Reality
14.5.3.2.6.Drones
14.5.3.2.7.Gaming Console
14.5.3.2.8.External Hard Disk
14.5.3.2.9.Camera
14.5.3.2.10.Projector
14.5.3.2.11.Wearable
14.5.3.2.12.Home Theatre and Multimedia Device
14.5.3.2.13.Power Bank
14.5.3.2.14.Display Monitor
14.5.3.2.15.USB Flash Drive
14.5.3.2.16.Set-Top Box
14.5.3.2.17.Others
14.5.3.3.Egypt Wired Interface Market Revenue (US$ Mn) and Forecasts, By End User
14.5.3.3.1.Consumer Electronics
14.5.3.3.2.Automotive
14.5.3.3.3.Healthcare
14.5.3.3.4.Retail
14.5.3.3.5.Government and Public Sector
14.5.3.3.6.IT and Telecom
14.5.3.3.7.Others
14.5.4.Kuwait
14.5.4.1.Kuwait Wired Interface Market Revenue (US$ Mn) and Forecasts, By Component Type
14.5.4.1.1.USB Wired Interface
14.5.4.1.2.HDMI Wired Interface
14.5.4.1.3.Display Port Wired Interface
14.5.4.1.4.Thunderbolt Wired Interface
14.5.4.2.Kuwait Wired Interface Market Revenue (US$ Mn) and Forecasts, By Application
14.5.4.2.1.Smartphone
14.5.4.2.2.Tablet
14.5.4.2.3.PC and Laptop
14.5.4.2.4.Television
14.5.4.2.5.Virtual Reality
14.5.4.2.6.Drones
14.5.4.2.7.Gaming Console
14.5.4.2.8.External Hard Disk
14.5.4.2.9.Camera
14.5.4.2.10.Projector
14.5.4.2.11.Wearable
14.5.4.2.12.Home Theatre and Multimedia Device
14.5.4.2.13.Power Bank
14.5.4.2.14.Display Monitor
14.5.4.2.15.USB Flash Drive
14.5.4.2.16.Set-Top Box
14.5.4.2.17.Others
14.5.4.3.Kuwait Wired Interface Market Revenue (US$ Mn) and Forecasts, By End User
14.5.4.3.1.Consumer Electronics
14.5.4.3.2.Automotive
14.5.4.3.3.Healthcare
14.5.4.3.4.Retail
14.5.4.3.5.Government and Public Sector
14.5.4.3.6.IT and Telecom
14.5.4.3.7.Others
14.5.5.South Africa
14.5.5.1.South Africa Wired Interface Market Revenue (US$ Mn) and Forecasts, By Component Type
14.5.5.1.1.USB Wired Interface
14.5.5.1.2.HDMI Wired Interface
14.5.5.1.3.Display Port Wired Interface
14.5.5.1.4.Thunderbolt Wired Interface
14.5.5.2.South Africa Wired Interface Market Revenue (US$ Mn) and Forecasts, By Application
14.5.5.2.1.Smartphone
14.5.5.2.2.Tablet
14.5.5.2.3.PC and Laptop
14.5.5.2.4.Television
14.5.5.2.5.Virtual Reality
14.5.5.2.6.Drones
14.5.5.2.7.Gaming Console
14.5.5.2.8.External Hard Disk
14.5.5.2.9.Camera
14.5.5.2.10.Projector
14.5.5.2.11.Wearable
14.5.5.2.12.Home Theatre and Multimedia Device
14.5.5.2.13.Power Bank
14.5.5.2.14.Display Monitor
14.5.5.2.15.USB Flash Drive
14.5.5.2.16.Set-Top Box
14.5.5.2.17.Others
14.5.5.3.South Africa Wired Interface Market Revenue (US$ Mn) and Forecasts, By End User
14.5.5.3.1.Consumer Electronics
14.5.5.3.2.Automotive
14.5.5.3.3.Healthcare
14.5.5.3.4.Retail
14.5.5.3.5.Government and Public Sector
14.5.5.3.6.IT and Telecom
14.5.5.3.7.Others
14.5.6.Rest of Middle East & Africa
14.5.6.1.Rest of Middle East & Africa Wired Interface Market Revenue (US$ Mn) and Forecasts, By Component Type
14.5.6.1.1.USB Wired Interface
14.5.6.1.2.HDMI Wired Interface
14.5.6.1.3.Display Port Wired Interface
14.5.6.1.4.Thunderbolt Wired Interface
14.5.6.2.Rest of Middle East & Africa Wired Interface Market Revenue (US$ Mn) and Forecasts, By Application
14.5.6.2.1.Smartphone
14.5.6.2.2.Tablet
14.5.6.2.3.PC and Laptop
14.5.6.2.4.Television
14.5.6.2.5.Virtual Reality
14.5.6.2.6.Drones
14.5.6.2.7.Gaming Console
14.5.6.2.8.External Hard Disk
14.5.6.2.9.Camera
14.5.6.2.10.Projector
14.5.6.2.11.Wearable
14.5.6.2.12.Home Theatre and Multimedia Device
14.5.6.2.13.Power Bank
14.5.6.2.14.Display Monitor
14.5.6.2.15.USB Flash Drive
14.5.6.2.16.Set-Top Box
14.5.6.2.17.Others
14.5.6.3.Rest of Middle East & Africa Wired Interface Market Revenue (US$ Mn) and Forecasts, By End User
14.5.6.3.1.Consumer Electronics
14.5.6.3.2.Automotive
14.5.6.3.3.Healthcare
14.5.6.3.4.Retail
14.5.6.3.5.Government and Public Sector
14.5.6.3.6.IT and Telecom
14.5.6.3.7.Others
14.6.Key Segment for Channeling Investments
14.6.1.By Country
14.6.2.By Component Type
14.6.3.By Application
14.6.4.By End User
15.Latin America Wired Interface Market Analysis and Forecasts, 2023 – 2031
15.1.Overview
15.1.1.Latin America Wired Interface Market Revenue (US$ Mn)
15.2.Latin America Wired Interface Market Revenue (US$ Mn) and Forecasts, By Component Type
15.2.1.USB Wired Interface
15.2.2.HDMI Wired Interface
15.2.3.Display Port Wired Interface
15.2.4.Thunderbolt Wired Interface
15.3.Latin America Wired Interface Market Revenue (US$ Mn) and Forecasts, By Application
15.3.1.Smartphone
15.3.2.Tablet
15.3.3.PC and Laptop
15.3.4.Television
15.3.5.Virtual Reality
15.3.6.Drones
15.3.7.Gaming Console
15.3.8.External Hard Disk
15.3.9.Camera
15.3.10.Projector
15.3.11.Wearable
15.3.12.Home Theatre and Multimedia Device
15.3.13.Power Bank
15.3.14.Display Monitor
15.3.15.USB Flash Drive
15.3.16.Set-Top Box
15.3.17.Others
15.4.Latin America Wired Interface Market Revenue (US$ Mn) and Forecasts, By End User
15.4.1.Consumer Electronics
15.4.2.Automotive
15.4.3.Healthcare
15.4.4.Retail
15.4.5.Government and Public Sector
15.4.6.IT and Telecom
15.4.7.Others
15.5.Latin America Wired Interface Market Revenue (US$ Mn) and Forecasts, By Country
15.5.1.Brazil
15.5.1.1.Brazil Wired Interface Market Revenue (US$ Mn) and Forecasts, By Component Type
15.5.1.1.1.USB Wired Interface
15.5.1.1.2.HDMI Wired Interface
15.5.1.1.3.Display Port Wired Interface
15.5.1.1.4.Thunderbolt Wired Interface
15.5.1.2.Brazil Wired Interface Market Revenue (US$ Mn) and Forecasts, By Application
15.5.1.2.1.Smartphone
15.5.1.2.2.Tablet
15.5.1.2.3.PC and Laptop
15.5.1.2.4.Television
15.5.1.2.5.Virtual Reality
15.5.1.2.6.Drones
15.5.1.2.7.Gaming Console
15.5.1.2.8.External Hard Disk
15.5.1.2.9.Camera
15.5.1.2.10.Projector
15.5.1.2.11.Wearable
15.5.1.2.12.Home Theatre and Multimedia Device
15.5.1.2.13.Power Bank
15.5.1.2.14.Display Monitor
15.5.1.2.15.USB Flash Drive
15.5.1.2.16.Set-Top Box
15.5.1.2.17.Others
15.5.1.3.Brazil Wired Interface Market Revenue (US$ Mn) and Forecasts, By End User
15.5.1.3.1.Consumer Electronics
15.5.1.3.2.Automotive
15.5.1.3.3.Healthcare
15.5.1.3.4.Retail
15.5.1.3.5.Government and Public Sector
15.5.1.3.6.IT and Telecom
15.5.1.3.7.Others
15.5.2.Argentina
15.5.2.1.Argentina Wired Interface Market Revenue (US$ Mn) and Forecasts, By Component Type
15.5.2.1.1.USB Wired Interface
15.5.2.1.2.HDMI Wired Interface
15.5.2.1.3.Display Port Wired Interface
15.5.2.1.4.Thunderbolt Wired Interface
15.5.2.2.Argentina Wired Interface Market Revenue (US$ Mn) and Forecasts, By Application
15.5.2.2.1.Smartphone
15.5.2.2.2.Tablet
15.5.2.2.3.PC and Laptop
15.5.2.2.4.Television
15.5.2.2.5.Virtual Reality
15.5.2.2.6.Drones
15.5.2.2.7.Gaming Console
15.5.2.2.8.External Hard Disk
15.5.2.2.9.Camera
15.5.2.2.10.Projector
15.5.2.2.11.Wearable
15.5.2.2.12.Home Theatre and Multimedia Device
15.5.2.2.13.Power Bank
15.5.2.2.14.Display Monitor
15.5.2.2.15.USB Flash Drive
15.5.2.2.16.Set-Top Box
15.5.2.2.17.Others
15.5.2.3.Argentina Wired Interface Market Revenue (US$ Mn) and Forecasts, By End User
15.5.2.3.1.Consumer Electronics
15.5.2.3.2.Automotive
15.5.2.3.3.Healthcare
15.5.2.3.4.Retail
15.5.2.3.5.Government and Public Sector
15.5.2.3.6.IT and Telecom
15.5.2.3.7.Others
15.5.3.Rest of Latin America
15.5.3.1.Rest of Latin America Wired Interface Market Revenue (US$ Mn) and Forecasts, By Component Type
15.5.3.1.1.USB Wired Interface
15.5.3.1.2.HDMI Wired Interface
15.5.3.1.3.Display Port Wired Interface
15.5.3.1.4.Thunderbolt Wired Interface
15.5.3.2.Rest of Latin America Wired Interface Market Revenue (US$ Mn) and Forecasts, By Application
15.5.3.2.1.Smartphone
15.5.3.2.2.Tablet
15.5.3.2.3.PC and Laptop
15.5.3.2.4.Television
15.5.3.2.5.Virtual Reality
15.5.3.2.6.Drones
15.5.3.2.7.Gaming Console
15.5.3.2.8.External Hard Disk
15.5.3.2.9.Camera
15.5.3.2.10.Projector
15.5.3.2.11.Wearable
15.5.3.2.12.Home Theatre and Multimedia Device
15.5.3.2.13.Power Bank
15.5.3.2.14.Display Monitor
15.5.3.2.15.USB Flash Drive
15.5.3.2.16.Set-Top Box
15.5.3.2.17.Others
15.5.3.3.Rest of Latin America Wired Interface Market Revenue (US$ Mn) and Forecasts, By End User
15.5.3.3.1.Consumer Electronics
15.5.3.3.2.Automotive
15.5.3.3.3.Healthcare
15.5.3.3.4.Retail
15.5.3.3.5.Government and Public Sector
15.5.3.3.6.IT and Telecom
15.5.3.3.7.Others
15.6.Key Segment for Channeling Investments
15.6.1.By Country
15.6.2.By Component Type
15.6.3.By Application
15.6.4.By End User
16.Competitive Benchmarking
16.1.Brand Benchmarking
16.2.Market Share Analysis, 2022
16.3.Global Presence and Growth Strategies
16.3.1.Mergers and Acquisitions
16.3.2.Product Launches
16.3.3.Investments Trends
16.3.4.R&D Initiatives
17.Player Profiles
17.1.Amphenol Corporation
17.1.1.Company Details
17.1.2.Company Overview
17.1.3.Product Offerings
17.1.4.Key Developments
17.1.5.Financial Analysis
17.1.6.SWOT Analysis
17.1.7.Business Strategies
17.2.Analog Devices, Inc.
17.2.1.Company Details
17.2.2.Company Overview
17.2.3.Product Offerings
17.2.4.Key Developments
17.2.5.Financial Analysis
17.2.6.SWOT Analysis
17.2.7.Business Strategies
17.3.Infineon Technologies AG
17.3.1.Company Details
17.3.2.Company Overview
17.3.3.Product Offerings
17.3.4.Key Developments
17.3.5.Financial Analysis
17.3.6.SWOT Analysis
17.3.7.Business Strategies
17.4.Microchip Technology Inc.
17.4.1.Company Details
17.4.2.Company Overview
17.4.3.Product Offerings
17.4.4.Key Developments
17.4.5.Financial Analysis
17.4.6.SWOT Analysis
17.4.7.Business Strategies
17.5.Molex
17.5.1.Company Details
17.5.2.Company Overview
17.5.3.Product Offerings
17.5.4.Key Developments
17.5.5.Financial Analysis
17.5.6.SWOT Analysis
17.5.7.Business Strategies
17.6.ROHM Co., Ltd.
17.6.1.Company Details
17.6.2.Company Overview
17.6.3.Product Offerings
17.6.4.Key Developments
17.6.5.Financial Analysis
17.6.6.SWOT Analysis
17.6.7.Business Strategies
17.7.Semiconductor Components Industries, LLC
17.7.1.Company Details
17.7.2.Company Overview
17.7.3.Product Offerings
17.7.4.Key Developments
17.7.5.Financial Analysis
17.7.6.SWOT Analysis
17.7.7.Business Strategies
17.8.STMicroelectronics
17.8.1.Company Details
17.8.2.Company Overview
17.8.3.Product Offerings
17.8.4.Key Developments
17.8.5.Financial Analysis
17.8.6.SWOT Analysis
17.8.7.Business Strategies
17.9.TE Connectivity
17.9.1.Company Details
17.9.2.Company Overview
17.9.3.Product Offerings
17.9.4.Key Developments
17.9.5.Financial Analysis
17.9.6.SWOT Analysis
17.9.7.Business Strategies
17.10.Texas Instruments Incorporated
17.10.1.Company Details
17.10.2.Company Overview
17.10.3.Product Offerings
17.10.4.Key Developments
17.10.5.Financial Analysis
17.10.6.SWOT Analysis
17.10.7.Business Strategies
17.11.Other Market Participants
18.Key Findings

.

**Exclusive for Multi-User and Enterprise User.

.

Global Wired Interface Market Segmentation

By Component Type

 USB Wired Interface
 HDMI Wired Interface
 Display Port Wired Interface
 Thunderbolt Wired Interface

By Application

 Smartphone
 Tablet
 PC and Laptop
 Television
 Virtual Reality
 Drones
 Gaming Console
 External Hard Disk
 Camera
 Projector
 Wearable
 Home Theatre and Multimedia Device
 Power Bank
 Automotive
 Display Monitor
 USB Flash Drive
 Set-Top Box

By End Users

 Consumer Electronics
 Automotive
 Healthcare
 Retail
 Government & Public Sector
 IT and Telecom
 Others

By Region

 North America (U.S., Canada, Mexico, Rest of North America)
 Europe (France, The UK, Spain, Germany, Italy, Nordic Countries (Denmark, Finland, Iceland, Sweden, Norway), Benelux Union (Belgium, The Netherlands, Luxembourg), Rest of Europe
 Asia Pacific (China, Japan, India, New Zealand, Australia, South Korea, Southeast Asia (Indonesia, Thailand, Malaysia, Singapore, Rest of Southeast Asia), Rest of Asia Pacific)
 Middle East & Africa (Saudi Arabia, UAE, Egypt, Kuwait, South Africa, Rest of Middle East & Africa)
 Latin America (Brazil, Argentina, Rest of Latin America)

**Note: The report covers cross-segmentation analysis by region further into countries

The Niche Research approach encompasses both primary and secondary research methods to provide comprehensive insights. While primary research is the cornerstone of our studies, we also incorporate secondary research sources such as company annual reports, premium industry databases, press releases, industry journals, and white papers.

Within our primary research, we actively engage with various industry stakeholders, conducting paid interviews and surveys. Our meticulous analysis extends to every market participant in major countries, allowing us to thoroughly examine their portfolios, calculate market shares, and segment revenues.

Our data collection primarily focuses on individual countries within our research scope, enabling us to estimate regional market sizes. Typically, we employ a bottom-up approach, meticulously tracking trends in different countries. We analyze growth drivers, constraints, technological innovations, and opportunities for each country, ultimately arriving at regional figures.Our process begins by examining the growth prospects of each country. Building upon these insights, we project growth and trends for the entire region. Finally, we utilize our proprietary model to refine estimations and forecasts.

Our data validation standards are integral to ensuring the reliability and accuracy of our research findings. Here’s a breakdown of our data validation processes and the stakeholders we engage with during our primary research:

  • Supply Side Analysis: We initiate a supply side analysis by directly contacting market participants, through telephonic interviews and questionnaires containing both open-ended and close-ended questions. We gather information on their portfolios, segment revenues, developments, and growth strategies.
  • Demand Side Analysis: To gain insights into adoption trends and consumer preferences, we reach out to target customers and users (non-vendors). This information forms a vital part of the qualitative analysis section of our reports, covering market dynamics, adoption trends, consumer behavior, spending patterns, and other related aspects.
  • Consultant Insights: We tap into the expertise of our partner consultants from around the world to obtain their unique viewpoints and perspectives. Their insights contribute to a well-rounded understanding of the markets under investigation.
  • In-House Validation: To ensure data accuracy and reliability, we conduct cross-validation of data points and information through our in-house team of consultants and utilize advanced data modeling tools for thorough verification.

The forecasts we provide are based on a comprehensive assessment of various factors, including:

  • Market Trends and Past Performance (Last Five Years): We accurately analyze market trends and performance data from preceding five years to identify historical patterns and understand the market’s evolution.
  • Historical Performance and Growth of Market Participants: We assess the historical performance and growth trajectories of key market participants. This analysis provides insights into the competitive landscape and individual company strategies.
  • Market Determinants Impact Analysis (Next Eight Years): We conduct a rigorous analysis of the factors that are projected to influence the market over the next eight years. This includes assessing both internal and external determinants that can shape market dynamics.
  • Drivers and Challenges for the Forecast Period:Identify the factors expected to drive market growth during the forecast period, as well as the challenges that the industry may face. This analysis aids in deriving an accurate growth rate projection.
  • New Acquisitions, Collaborations, or Partnerships: We keep a close watch on any new acquisitions, collaborations, or partnerships within the industry. These developments can have a significant impact on market dynamics and competitiveness.
  • Macro and Micro Factors Analysis:A thorough examination of both macro-level factors (e.g., economic trends, regulatory changes) and micro-level factors (e.g., technological advancements, consumer preferences) that may influence the market during the forecast period.
  • End-User Sentiment Analysis: To understand the market from the end-user perspective, we conduct sentiment analysis. This involves assessing the sentiment, preferences, and feedback of the end-users, which can provide valuable insights into market trends.
  • Perspective of Primary Participants: Insights gathered directly from primary research participants play a crucial role in shaping our forecasts. Their perspectives and experiences provide valuable qualitative data.
  • Year-on-Year Growth Trend: We utilize a year-on-year growth trend based on historical market growth and expected future trends. This helps in formulating our growth projections, aligning them with the market’s historical performance.

Research process adopted by TNR involves multiple stages, including data collection, validation, quality checks, and presentation. It’s crucial that the data and information we provide add value to your existing market understanding and expertise. We have also established partnerships with business consulting, research, and survey organizations across regions and globally to collaborate on regional analysis and data validation, ensuring the highest level of accuracy and reliability in our reports.


Procure Comprehensive Study of

Global Wired Interface Market

Online Only

  • Online Access
  • Read Only File
  • Validity 3 Months
  • Print, Copy, Paste & Download
  • PPT, Excel
  • Cost-Free Report in the Next Update
$3300
Buy Now

Single User

  • Access to One User on One System
  • Read Only File
  • Validity 6 Months
  • Limited Print,Copy, Paste
  • PPT, Excel
  • Cost-Free Report in the Next Update
$4200
Buy Now

Multi User

  • Access to Fiver Users
  • PDF File
  • Validity 1 Year
  • Upto FivePrints
  • Cost-Free Report in the Next Update
  • PPT, Excel
$6000
Buy Now

Enterprise User

  • Access to Unlimited Users
  • PDF, PPT, Excel
  • Unlimited Validity, Prints&Downloads
  • 1 Hour Cost-Free & Dedicated Analyst Support
  • 10% Cost-Free Customization
  • Cost-Free Report Update Twice in a Year
  • Recommendations for Business Strategies
  • Authorization to Quote TNR, The Niche Research
$7300
Buy Now

Library Access

  • Online Access to Content Publications
  • Access Player Profiles Online
  • Get Immediate Access to Newly Added Content
  • Acquire 12 PDF Downloads
  • Acquire 5 Excel Data Sets
  • Gain Access to 290+ PDFs of Company Profiles
  • Round-the-clock Email and Phone Assistance
  • Dashboard Usage and Trends
  • Renewal & Upgrade Assistance
  • Assessing Customization Options and Alerts for New Reports
$10788
Buy Now
*Taxes/Fees, if applicable will be added during checkout. All prices in USD

Why TNR The Niche Research?

  • Unwavering Commitment to Excellence

  • Veteran Team of Researchers

  • Accurate and Timely Insights

  • Ethical Practices and Customized Service

  • Uninterrupted Availability Around the Clock

Scroll to Top