Global Zero Emission Freight Transport Service Market By Mode of Transport, By Vehicle Type, By Power Source, By Service Type, By End Use Industry, By Region & Segmental Insights Trends and Forecast, 2024 – 2034
- Industry: Automotive & Transportation
- Report ID: TNR-110-1300
- Number of Pages: 420
- Table/Charts : Yes
- September, 2024
- Base Year : 2024
- No. of Companies : 10+
- No. of Countries : 29
- Views : 10064
- Covid Impact Covered: Yes
- War Impact Covered: Yes
- Formats : PDF, Excel, PPT
Zero emission freight transport service refers to the transportation of goods using vehicles and technologies that do not produce harmful emissions, such as carbon dioxide (CO2) or other pollutants. The global zero emission freight transport service market is emerging as a key driver for reducing greenhouse gas emissions and promoting sustainability in logistics.
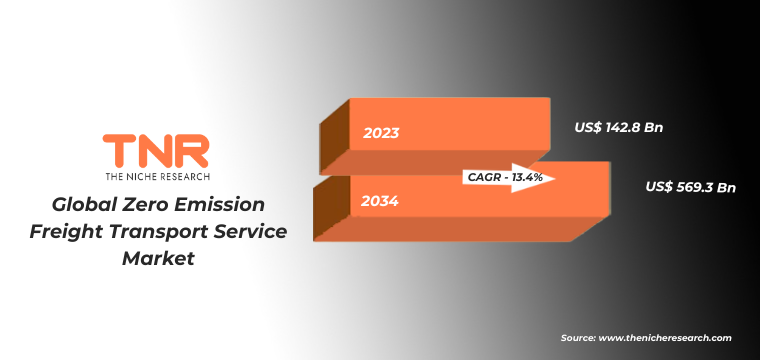
This service uses electric, hydrogen fuel cell, and hybrid vehicles to transport goods without emitting carbon dioxide or other pollutants. Its importance lies in addressing environmental concerns and regulatory pressures to meet emissions reduction targets. The service helps companies meet corporate sustainability goals while reducing dependence on fossil fuels. Applications of zero emission freight transport include urban deliveries, long-haul trucking, and maritime transport. It plays a vital role in transforming the logistics industry, particularly as e-commerce and global trade continue to grow, requiring more environmentally responsible solutions. “In terms of revenue, the global zero emission freight transport service market was worth US$ 142.8 Bn in 2023, anticipated to witness a CAGR of 13.4% during 2024 – 2034”.
Global Zero Emission Freight Transport Service Market Dynamics
Global Zero Emission Freight Transport Service Market Growth Drivers:
- Environmental Regulations and Policies: Stringent government regulations aimed at reducing carbon emissions are driving the growth of the Zero Emission Freight Transport Service Market. Nations worldwide are adopting policies and incentives to promote cleaner transportation methods, encouraging businesses to transition to zero-emission solutions.
- Rising Demand for Sustainable Logistics: Increasing consumer and corporate demand for eco-friendly practices is boosting the adoption of zero emission freight services. Companies are shifting toward sustainable logistics to align with their environmental goals, reducing their carbon footprint and enhancing brand reputation in the process.
Global Zero Emission Freight Transport Service Market Restraints:
- High Initial Investment Costs: The high cost of purchasing and maintaining zero-emission vehicles, such as electric or hydrogen-powered trucks, is a significant restraint. Businesses face financial barriers in transitioning their fleets, which slows the widespread adoption of zero-emission freight transport services.
- Limited Charging and Refueling Infrastructure: The lack of widespread charging stations and hydrogen refueling infrastructure hinders the growth of zero emission freight transport services. Without sufficient infrastructure, companies face operational challenges in long-haul routes, limiting the scalability of these eco-friendly transportation options.
Global Zero Emission Freight Transport Service Market Opportunities:
- Advancements in Battery and Fuel Cell Technology: Technological advancements in battery storage and hydrogen fuel cells present significant opportunities for the Zero Emission Freight Transport Service Market. Improved efficiency, reduced costs, and longer driving ranges will make zero-emission vehicles more accessible and practical for widespread adoption.
- Government Incentives and Subsidies: The availability of government incentives, subsidies, and tax credits for zero-emission vehicle purchases and infrastructure development offers significant opportunities. These financial supports encourage businesses to invest in zero-emission freight transport services, accelerating market growth and driving sustainable logistics solutions globally.
Global Zero Emission Freight Transport Service Market Trends:
- Increased Adoption of Electric Trucks: The global trend toward electrification in logistics is accelerating, with major companies adopting electric trucks for short- and medium-distance freight transport. This shift reflects growing investments in electric vehicle technology and an expanding network of charging infrastructure.
- Expansion of Hydrogen Fuel Cell Vehicles: Hydrogen fuel cell vehicles are gaining traction in the zero-emission freight market, particularly for long-haul transportation. As technology advances and hydrogen refueling stations expand, more logistics companies are exploring hydrogen-powered solutions to complement battery-electric vehicles for extended routes.
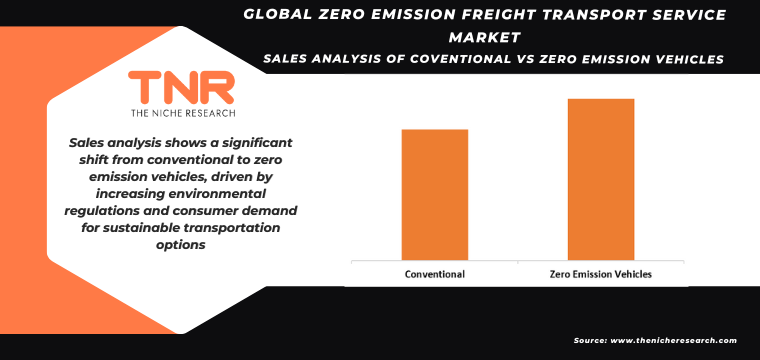
Sales Analysis of Conventional vs Zero Emission Vehicles:
Sales analysis reveals a growing shift from conventional to zero emission vehicles, driven by increasing environmental regulations and consumer demand for sustainable options. Zero emission vehicles are seeing rising sales, reflecting a significant market transition towards cleaner, greener transportation solutions.
Global Zero Emission Freight Transport Service Market Segmental Analysis:
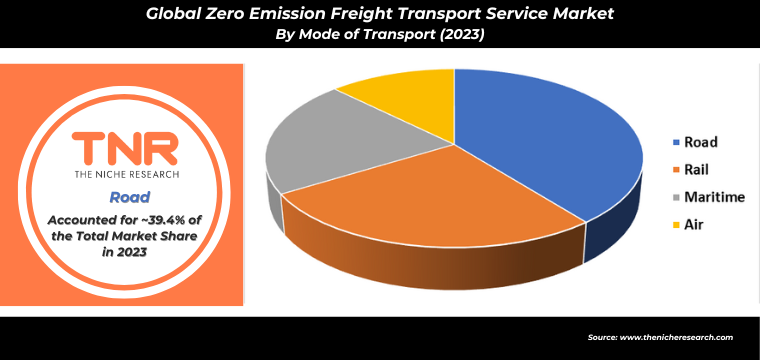
Zero Emission Freight Transport Service Market By Mode of Transport
- Road
- Rail
- Maritime
- Air
In 2023, roadways led the global zero emission freight transport service market with a substantial revenue share of 39.4%. This dominance is driven by the high adoption of electric and hydrogen-powered trucks for goods transportation. Road transport offers flexibility and direct access to various destinations, making it a preferred choice for zero-emission solutions. The significant investment in electric vehicle infrastructure and advancements in battery technology further bolster the growth and adoption of zero emission freight services in the roadway segment.
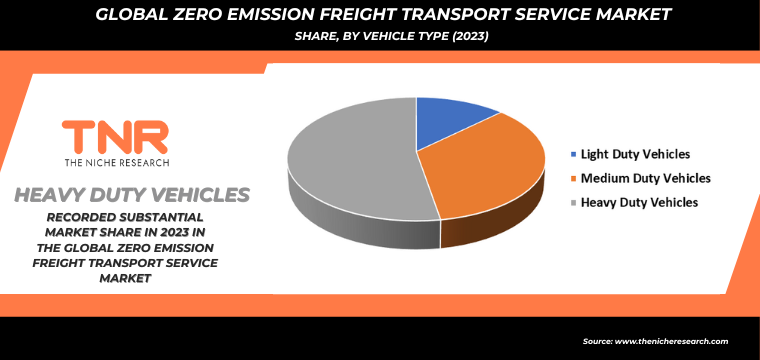
Zero Emission Freight Transport Service Market By Vehicle Type
- Light Duty Vehicles
- Medium Duty Vehicles
- Heavy Duty Vehicles
Medium-duty vehicles are projected to be the fastest-growing segment in the global zero emission freight transport service market, capturing a notable revenue share of 34.7%. This growth is driven by their versatility in handling a range of logistics tasks, including urban deliveries and regional transportation. Advances in electric and hydrogen technologies enhance the efficiency and appeal of medium-duty vehicles, positioning them as a key focus for zero-emission freight solutions.
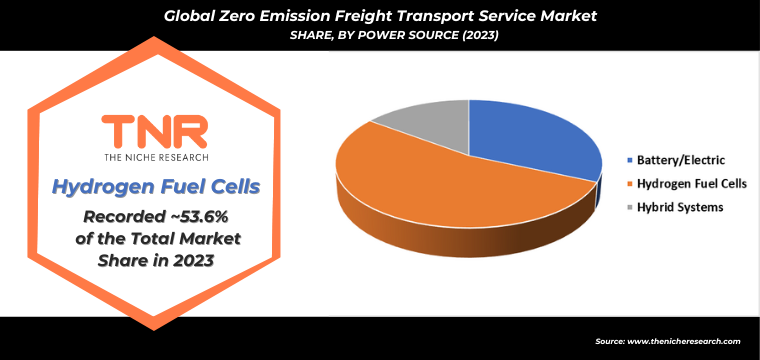
Zero Emission Freight Transport Service Market By Power Source
- Battery/Electric
- Hydrogen Fuel Cells
- Hybrid Systems
Hydrogen fuel cells dominated the global zero emission freight transport service market in 2023, commanding a significant revenue share of 53.6%. This leadership is attributed to hydrogen’s advantages in providing long-range and rapid refueling capabilities compared to battery-electric systems. As infrastructure for hydrogen refueling expands and technology advances, hydrogen fuel cells are increasingly adopted for heavy-duty and long-haul freight transport. Their ability to support extensive routes with minimal downtime makes them a pivotal component in zero-emission logistics.
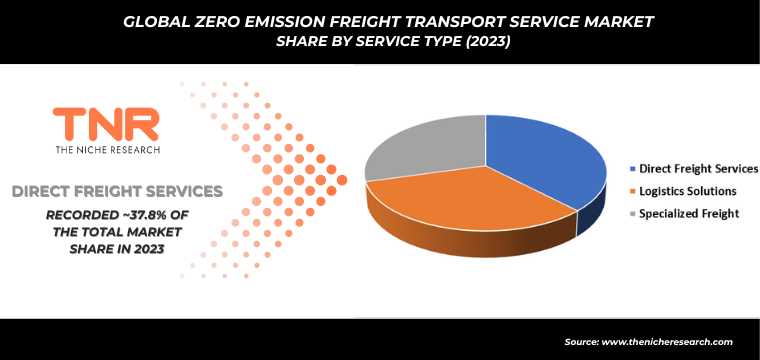
Zero Emission Freight Transport Service Market By Service Type
- Direct Freight Services
- Inter-city Freight
- Intra-city Freight
- Logistics Solutions
- Specialized Freight
- Temperature-Controlled Transport
- Hazardous Materials Transport
- Others
In 2023, specialized freight emerged as the second-largest segment in the global zero emission freight transport service market, holding a substantial revenue share of 29.4%. This segment includes tailored transport solutions for specific cargo types, such as temperature-sensitive goods and high-value items. The growth is driven by the need for specialized handling and transportation methods that meet zero-emission standards while maintaining efficiency. Increased demand for such services highlights the sector’s role in advancing sustainable logistics practices.
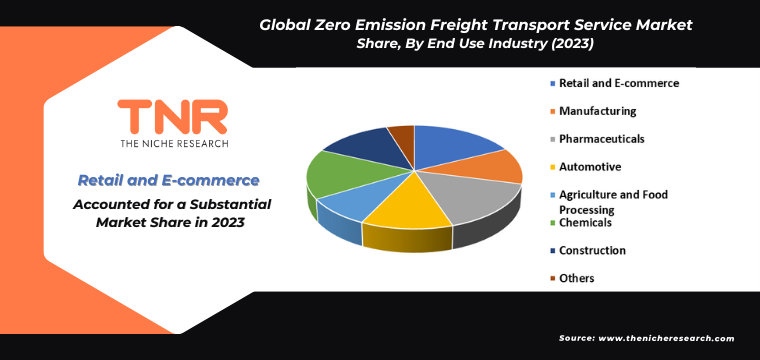
Zero Emission Freight Transport Service Market By End Use Industry
- Retail and E-commerce
- Manufacturing
- Pharmaceuticals
- Automotive
- Agriculture and Food Processing
- Chemicals
- Construction
- Others
Retail and e-commerce sectors led the global zero emission freight transport service market in 2023, capturing a significant revenue share of 17.6%. This dominance reflects the rapid growth in online shopping and the increasing focus on sustainable delivery solutions. Retailers and e-commerce companies are adopting zero-emission freight services to meet consumer demand for eco-friendly practices and comply with environmental regulations, driving innovation and expansion in sustainable logistics for the sector.
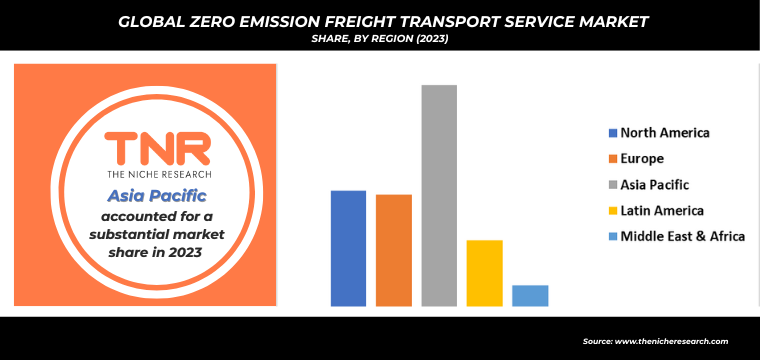
Zero Emission Freight Transport Service Market By Region
- North America (U.S., Canada, Mexico, Rest of North America)
- Europe (France, The UK, Spain, Germany, Italy, Nordic Countries (Denmark, Finland, Iceland, Sweden, Norway), Benelux Union (Belgium, The Netherlands, Luxembourg), Rest of Europe)
- Asia Pacific (China, Japan, India, New Zealand, Australia, South Korea, Southeast Asia (Indonesia, Thailand, Malaysia, Singapore, Rest of Southeast Asia), Rest of Asia Pacific)
- Middle East & Africa (Saudi Arabia, UAE, Egypt, Kuwait, South Africa, Rest of Middle East & Africa)
- Latin America (Brazil, Argentina, Rest of Latin America)
Latin America is projected to be the fastest-growing region in the zero emission freight transport service market during the forecast period, driven by increasing government support for sustainable transportation initiatives, rising investments in green infrastructure, and a growing focus on reducing emissions. Additionally, expanding urbanization and logistical demands in major Latin American cities are prompting companies to adopt zero-emission freight solutions to meet regulatory requirements and enhance their environmental footprint.
Transportation Sector CO2 Emissions:
The transportation sector is a major contributor to CO2 emissions, accounting for a significant portion of global greenhouse gas output. Emissions primarily stem from fossil fuel combustion in vehicles, ships, and planes. Efforts to mitigate this impact include transitioning to zero-emission vehicles, enhancing fuel efficiency, and investing in alternative fuels.
Governments and organizations are implementing regulations and incentives to reduce transportation-related CO2 emissions, aiming to meet climate targets and improve air quality through sustainable practices and advanced technologies.
![]()
Competitive Landscape
Companies in the global zero emission freight transport service market are spearheading innovation by launching advanced technologies such as electric and hydrogen fuel cell vehicles. These initiatives include projects like Hyundai Motor’s NorCAL ZERO Project and Climate Pledge’s Laneshift Initiative, which aim to transform freight transportation with eco-friendly solutions.
Concurrently, governments are implementing stringent regulations and offering incentives to support these advancements. Initiatives such as subsidies for zero-emission vehicle purchases, investments in charging infrastructure, and emission reduction targets are driving the transition, encouraging companies to adopt and invest in sustainable freight technologies.
- In May 2024, Hyundai Motor took the lead in advancing zero-emission freight transportation in the U.S. with the introduction of the NorCAL ZERO Project.
- In March 2024, the Climate Pledge initiated the Laneshift Initiative in Mexico City to promote the use of zero-emission freight vehicles.
Global Zero Emission Freight Transport Service Market Scope:
| Report Specifications | Details |
| Market Revenue in 2023 | US$ 142.8 Bn |
| Market Size Forecast by 2034 | US$ 569.3 Bn |
| Growth Rate (CAGR) | 13.4% |
| Historic Data | 2016 – 2022 |
| Base Year for Estimation | 2023 |
| Forecast Period | 2024 – 2034 |
| Report Inclusions | Market Size & Estimates, Market Dynamics, Competitive Scenario, Trends, Growth Factors, Market Determinants, Key Investment Segmentation, Product/Service/Solutions Benchmarking |
| Segments Covered | By Mode of Transport, By Vehicle Type, By Power Source, By Service Type, By End Use Industry, By Region |
| Regions Covered | North America, Europe, Asia Pacific, Middle East & Africa, Latin America |
| Countries Covered | U.S., Canada, Mexico, Rest of North America, France, The UK, Spain, Germany, Italy, Nordic Countries (Denmark, Finland, Iceland, Sweden, Norway), Benelux Union (Belgium, The Netherlands, Luxembourg), Rest of Europe, China, Japan, India, New Zealand, Australia, South Korea, Southeast Asia (Indonesia, Thailand, Malaysia, Singapore, Rest of Southeast Asia), Rest of Asia Pacific, Saudi Arabia, UAE, Egypt, Kuwait, South Africa, Rest of Middle East & Africa, Brazil, Argentina, Rest of Latin America |
| Key Players | C.H. Robinson Worldwide, Inc., CEVA Logistics, DB Schenker, DHL Express (Deutsche Post DHL Group), DSV Panalpina A/S, FedEx Corporation, GEODIS, Hitachi Transport System, Ltd., Maersk Group, UPS (United Parcel Service, Inc.), XPO Logistics, Inc., Yusen Logistics Co., Ltd. |
| Customization Scope | Customization allows for the inclusion/modification of content pertaining to geographical regions, countries, and specific market segments. |
| Pricing & Procurement Options | Explore purchase options tailored to your specific research requirements |
| Contact Details | Consult With Our Expert
Japan (Toll-Free): +81 663-386-8111 South Korea (Toll-Free): +82-808- 703-126 Saudi Arabia (Toll-Free): +966 800-850-1643 United Kingdom: +44 753-710-5080 United States: +1 302-232-5106 E-mail: askanexpert@thenicheresearch.com
|
Some of the players operating in the zero emission freight transport service market are
- H. Robinson Worldwide, Inc.
- CEVA Logistics
- DB Schenker
- DHL Express (Deutsche Post DHL Group)
- DSV Panalpina A/S
- FedEx Corporation
- GEODIS
- Hitachi Transport System, Ltd.
- Maersk Group
- UPS (United Parcel Service, Inc.)
- XPO Logistics, Inc.
- Yusen Logistics Co., Ltd.
- Other Industry Participants
Report Layout:
Table of Contents
Note: This ToC is tentative and can be changed according to the research study conducted during the course of report completion.
**Exclusive for Multi-User and Enterprise User.
Global Zero Emission Freight Transport Service Market:
By Mode of Transport
- Road
- Rail
- Maritime
- Air
By Vehicle Type
- Light Duty Vehicles
- Medium Duty Vehicles
- Heavy Duty Vehicles
By Power Source
- Battery/Electric
- Hydrogen Fuel Cells
- Hybrid Systems
By Service Type
- Direct Freight Services
- Inter-city Freight
- Intra-city Freight
- Logistics Solutions
- Specialized Freight
- Temperature-Controlled Transport
- Hazardous Materials Transport
- Others
By End Use Industry
- Retail and E-commerce
- Manufacturing
- Pharmaceuticals
- Automotive
- Agriculture and Food Processing
- Chemicals
- Construction
- Others
By Region
- North America
- S.
- Canada
- Mexico
- Rest of North America
- Europe
- France
- The UK
- Spain
- Germany
- Italy
- Nordic Countries
- Denmark
- Finland
- Iceland
- Sweden
- Norway
- Benelux Union
- Belgium
- The Netherlands
- Luxembourg
- Rest of Europe
- Asia Pacific
- China
- Japan
- India
- New Zealand
- Australia
- South Korea
- Southeast Asia
- Indonesia
- Thailand
- Malaysia
- Singapore
- Rest of Southeast Asia
- Rest of Asia Pacific
- Middle East & Africa
- Saudi Arabia
- UAE
- Egypt
- Kuwait
- South Africa
- Rest of Middle East & Africa
- Latin America
- Brazil
- Argentina
- Rest of Latin America
The Niche Research approach encompasses both primary and secondary research methods to provide comprehensive insights. While primary research is the cornerstone of our studies, we also incorporate secondary research sources such as company annual reports, premium industry databases, press releases, industry journals, and white papers.
Within our primary research, we actively engage with various industry stakeholders, conducting paid interviews and surveys. Our meticulous analysis extends to every market participant in major countries, allowing us to thoroughly examine their portfolios, calculate market shares, and segment revenues.
Our data collection primarily focuses on individual countries within our research scope, enabling us to estimate regional market sizes. Typically, we employ a bottom-up approach, meticulously tracking trends in different countries. We analyze growth drivers, constraints, technological innovations, and opportunities for each country, ultimately arriving at regional figures.Our process begins by examining the growth prospects of each country. Building upon these insights, we project growth and trends for the entire region. Finally, we utilize our proprietary model to refine estimations and forecasts.
Our data validation standards are integral to ensuring the reliability and accuracy of our research findings. Here’s a breakdown of our data validation processes and the stakeholders we engage with during our primary research:
- Supply Side Analysis: We initiate a supply side analysis by directly contacting market participants, through telephonic interviews and questionnaires containing both open-ended and close-ended questions. We gather information on their portfolios, segment revenues, developments, and growth strategies.
- Demand Side Analysis: To gain insights into adoption trends and consumer preferences, we reach out to target customers and users (non-vendors). This information forms a vital part of the qualitative analysis section of our reports, covering market dynamics, adoption trends, consumer behavior, spending patterns, and other related aspects.
- Consultant Insights: We tap into the expertise of our partner consultants from around the world to obtain their unique viewpoints and perspectives. Their insights contribute to a well-rounded understanding of the markets under investigation.
- In-House Validation: To ensure data accuracy and reliability, we conduct cross-validation of data points and information through our in-house team of consultants and utilize advanced data modeling tools for thorough verification.
The forecasts we provide are based on a comprehensive assessment of various factors, including:
- Market Trends and Past Performance (Last Five Years): We accurately analyze market trends and performance data from preceding five years to identify historical patterns and understand the market’s evolution.
- Historical Performance and Growth of Market Participants: We assess the historical performance and growth trajectories of key market participants. This analysis provides insights into the competitive landscape and individual company strategies.
- Market Determinants Impact Analysis (Next Eight Years): We conduct a rigorous analysis of the factors that are projected to influence the market over the next eight years. This includes assessing both internal and external determinants that can shape market dynamics.
- Drivers and Challenges for the Forecast Period:Identify the factors expected to drive market growth during the forecast period, as well as the challenges that the industry may face. This analysis aids in deriving an accurate growth rate projection.
- New Acquisitions, Collaborations, or Partnerships: We keep a close watch on any new acquisitions, collaborations, or partnerships within the industry. These developments can have a significant impact on market dynamics and competitiveness.
- Macro and Micro Factors Analysis:A thorough examination of both macro-level factors (e.g., economic trends, regulatory changes) and micro-level factors (e.g., technological advancements, consumer preferences) that may influence the market during the forecast period.
- End-User Sentiment Analysis: To understand the market from the end-user perspective, we conduct sentiment analysis. This involves assessing the sentiment, preferences, and feedback of the end-users, which can provide valuable insights into market trends.
- Perspective of Primary Participants: Insights gathered directly from primary research participants play a crucial role in shaping our forecasts. Their perspectives and experiences provide valuable qualitative data.
- Year-on-Year Growth Trend: We utilize a year-on-year growth trend based on historical market growth and expected future trends. This helps in formulating our growth projections, aligning them with the market’s historical performance.
Research process adopted by TNR involves multiple stages, including data collection, validation, quality checks, and presentation. It’s crucial that the data and information we provide add value to your existing market understanding and expertise. We have also established partnerships with business consulting, research, and survey organizations across regions and globally to collaborate on regional analysis and data validation, ensuring the highest level of accuracy and reliability in our reports.