United States Pain Management Therapeutics Market By Drug Class, By Route of Administration, By Indication, By Distribution Channel, By Region & Segmental Insights Trends and Forecast, 2024 – 2034
- Industry: Healthcare
- Report ID: TNR-110-1246
- Number of Pages: 420
- Table/Charts : Yes
- August, 2024
- Base Year : 2024
- No. of Companies : 10+
- No. of Countries : 29
- Views : 10077
- Covid Impact Covered: Yes
- War Impact Covered: Yes
- Formats : PDF, Excel, PPT
The United States pain management therapeutics market is poised for robust growth, driven by an aging population, increasing prevalence of chronic pain conditions, and advancements in pharmaceutical formulations. Key trends include the rising adoption of non-opioid pain treatments due to the opioid crisis, and the integration of personalized medicine in pain management.
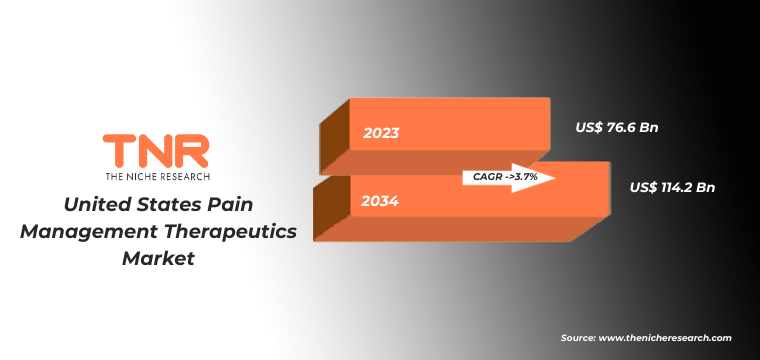
Opportunities abound in the development of novel therapies targeting neuropathic and cancer pain, as well as in the expansion of digital health platforms for pain monitoring and management. Furthermore, regional growth in the Southeast highlights potential for market expansion. As healthcare expenditure rises and regulatory environments become more supportive, the market is expected to see continued innovation and increased demand across all segments. In terms of revenue, the United States pain management therapeutics market was worth US$ 76.6 Bn in 2023, anticipated to witness a CAGR of 3.7% during 2024 – 2034.
United States Pain Management Therapeutics Market Dynamics
United States Pain Management Therapeutics Market Growth Driver:
The United States pain management therapeutics market is driven by the increasing prevalence of chronic pain conditions, such as arthritis, neuropathic pain, and post-surgical pain. The aging population further amplifies demand, as older adults are more susceptible to these conditions. Additionally, advancements in drug formulations and delivery systems, along with the growing preference for non-opioid treatments in response to the opioid crisis, are boosting market growth. Favorable government initiatives and rising healthcare expenditure are also contributing to the expansion of pain management options, enhancing patient access and driving market demand.
United States Pain Management Therapeutics Market Restraint:
Despite significant growth prospects, the United States pain management therapeutics market faces restraints such as stringent regulatory scrutiny, particularly regarding opioid-based treatments due to the ongoing opioid crisis. This has led to a cautious approach in prescribing pain medications, limiting market expansion. Additionally, the high cost of advanced pain management therapies and limited reimbursement coverage pose challenges for widespread adoption. The market also contends with potential side effects associated with long-term use of pain medications, which can lead to patient reluctance and decreased adherence, further impacting market growth.
United States Pain Management Therapeutics Market Opportunity:
The United States pain management therapeutics market presents substantial opportunities, particularly in the development of non-opioid pain treatments, including biologics and personalized medicine approaches. As the demand for safer and more effective pain management solutions grows, there is potential for innovation in drug delivery systems, such as transdermal patches and injectables. Additionally, the integration of digital health platforms and telemedicine for remote pain management offers new avenues for market expansion. Emerging trends in personalized pain management, driven by advances in genomics, also present significant growth opportunities for pharmaceutical companies.
United States Pain Management Therapeutics Market Trend:
Key trends in the United States pain management therapeutics market include the shift towards non-opioid pain treatments, driven by the need to address the opioid crisis. There is also a growing emphasis on personalized medicine, with therapies tailored to individual patient profiles becoming more prevalent. The market is seeing increased adoption of minimally invasive pain management techniques and innovative drug delivery systems. The rise of telemedicine and digital health solutions for pain management reflects a broader trend towards integrating technology into patient care. These trends are shaping the future of pain management, emphasizing safety, efficacy, and patient-centered approaches.
United States Pain Management Therapeutics Market Segmental Analysis:
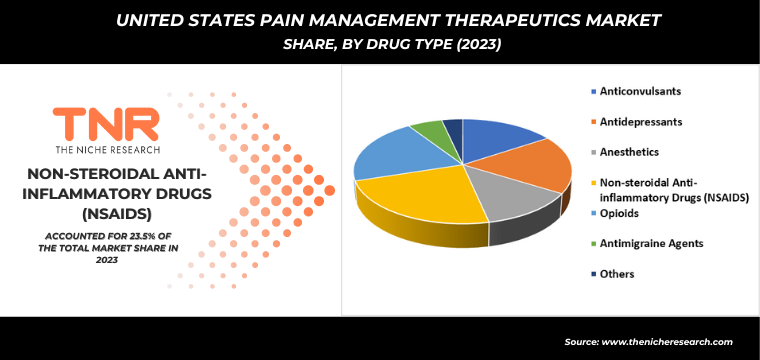
United States Pain Management Therapeutics Market By Drug Class
- Anticonvulsants
- Antidepressants
- Anesthetics
- Non-steroidal Anti-inflammatory Drugs (NSAIDS)
- Opioids
- Antimigraine Agents
- Others
Opioids segment has rapidly emerged as the fastest-growing segment in the United States pain management therapeutics market, driven by the high efficacy of opioids in treating moderate to severe pain, particularly in chronic pain conditions and post-surgical settings. Despite concerns over addiction and regulatory scrutiny, the demand for opioids persists due to their potent analgesic properties and established role in pain management protocols. The segment’s growth is further supported by ongoing research into abuse-deterrent formulations, which aim to minimize the risk of misuse. Additionally, opioids remain a critical option for managing pain in cancer patients, where alternatives may be less effective.
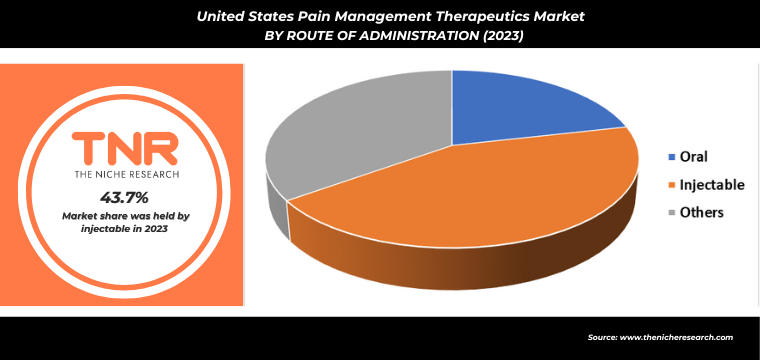
United States Pain Management Therapeutics Market By Route of Administration
- Oral
- Injectable
- Others
In 2023, injectables segment dominated the United States pain management therapeutics market, capturing a substantial revenue share of 43.7%. This dominance is attributed to the high effectiveness of injectable therapies in providing rapid and targeted pain relief, especially for severe and chronic pain conditions. The segment’s growth is fueled by increasing demand for nerve blocks, epidural injections, and other minimally invasive procedures. Additionally, advancements in injectable drug formulations and the rising preference for outpatient pain management procedures have further solidified the segment’s leading position in the market.
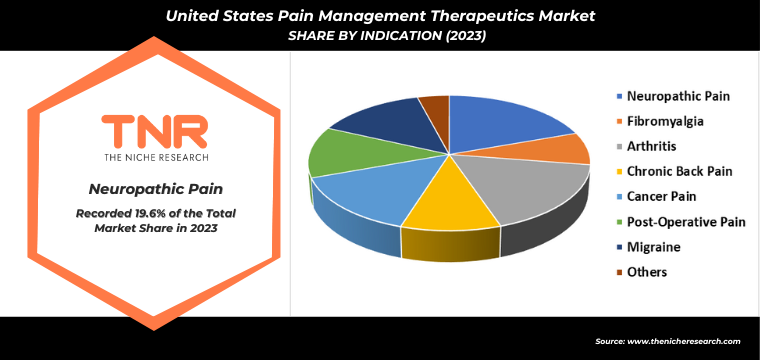
United States Pain Management Therapeutics Market By Indication
- Neuropathic Pain
- Fibromyalgia
- Arthritis
- Osteoarthritis
- Rheumatoid Arthritis
- Chronic Back Pain
- Cancer Pain
- Post-Operative Pain
- Migraine
- Others
Neuropathic pain emerged as the dominant segment in the United States pain management therapeutics market in 2023, capturing a significant revenue share of 19.6%. This prominence is driven by the increasing prevalence of conditions like diabetic neuropathy, shingles, and multiple sclerosis, which commonly result in neuropathic pain. The segment’s growth is further supported by advancements in treatment options, including anticonvulsants, antidepressants, and emerging biologics. Additionally, the rising awareness among healthcare providers about the complexity of neuropathic pain and the need for specialized therapies has contributed to the segment’s substantial market share.
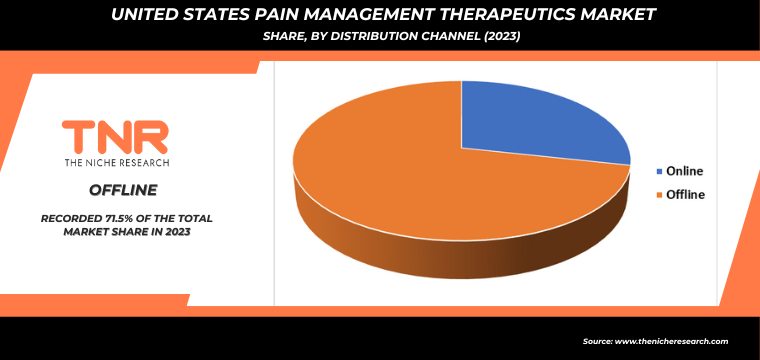
United States Pain Management Therapeutics Market By Distribution Channel
- Online
- Offline
- Hospitals Pharmacies
- Retail Pharmacies
- Others
By distribution channel, offline segment dominated the United States pain management therapeutics market with a revenue share of 71.5% in 2023. This dominance is largely attributed to the continued preference for purchasing medications through traditional channels such as hospital pharmacies, retail pharmacies, and specialty drug stores. Patients and healthcare providers favor these channels due to the immediacy of access, the ability to consult with pharmacists directly, and the reliability of obtaining prescribed medications promptly. Additionally, the well-established infrastructure of offline channels and strong relationships with healthcare providers contribute to their leading position in the market, despite the growing presence of online pharmacies.
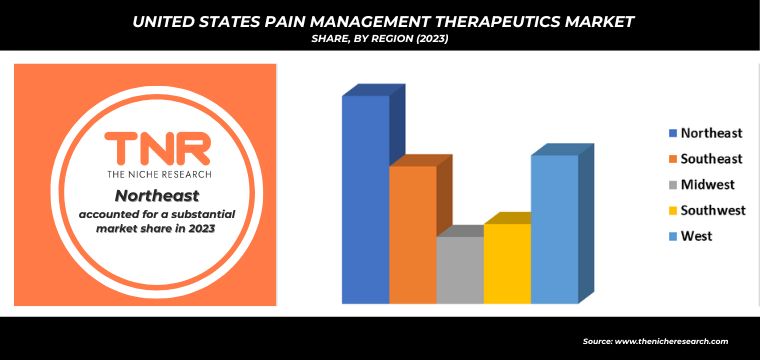
United States Pain Management Therapeutics Market By Region
- Northeast
- Southeast
- Midwest
- Southwest
- West
West region is projected to be the fastest-growing region in the United States pain management therapeutics market during the forecast period. The region’s robust healthcare infrastructure, especially in states like California, enables the adoption of cutting-edge pain management therapies. High healthcare spending and a tech-savvy population further boost the demand for innovative treatments. Additionally, the West has a growing elderly population, increasing the prevalence of chronic pain conditions. The region’s focus on integrating digital health technologies and personalized medicine into pain management also contributes to its rapid market expansion.
Competitive Landscape
The competitive landscape of the United States pain management therapeutics market features key players like Pfizer, Johnson & Johnson, and Abbott Laboratories. These companies focus on innovation, strategic partnerships, and expanding their portfolios to address diverse pain management needs and drive market growth.
Some of the players operating in the United States pain management therapeutics market are
- Abbott Laboratories
- AstraZeneca
- Baxter International Inc.
- Boehringer Ingelheim International GmbH
- Bristol-Myers Squibb Company
- Eli Lilly and Company
- GlaxoSmithKline plc
- Johnson & Johnson
- Merck & Co., Inc.
- Novartis International AG
- Pfizer Inc.
- Sanofi S.A.
- Other Industry Participants
United States Pain Management Therapeutics Market Scope
| Report Specifications | Details |
| Market Revenue in 2023 | US$ 76.6 Bn |
| Market Size Forecast by 2034 | US$ 114.2 Bn |
| Growth Rate (CAGR) | 3.7% |
| Historic Data | 2016 – 2022 |
| Base Year for Estimation | 2023 |
| Forecast Period | 2024 – 2034 |
| Report Inclusions | Market Size & Estimates, Market Dynamics, Competitive Scenario, Trends, Growth Factors, Market Determinants, Key Investment Segmentation, Product/Service/Solutions Benchmarking |
| Segments Covered | By Drug Class, By Route of Administration, By Indication, By Distribution Channel, By Region |
| Regions Covered | Northeast, Southeast, Midwest, Southwest, West |
| Key Players | Abbott Laboratories, AstraZeneca, Baxter International Inc., Boehringer Ingelheim International GmbH, Bristol-Myers Squibb Company, Eli Lilly and Company, GlaxoSmithKline plc, Johnson & Johnson, Merck & Co., Inc., Novartis International AG, Pfizer Inc., Sanofi S.A. |
| Customization Scope | Customization allows for the inclusion/modification of content pertaining to geographical regions, countries, and specific market segments. |
| Pricing & Procurement Options | Explore purchase options tailored to your specific research requirements |
| Contact Details | Consult With Our Expert
Japan (Toll-Free): +81 663-386-8111 South Korea (Toll-Free): +82-808- 703-126 Saudi Arabia (Toll-Free): +966 800-850-1643 United Kingdom: +44 753-710-5080 United States: +1 302-232-5106 E-mail: askanexpert@thenicheresearch.com
|
Report Layout:
Table of Contents
Note: This ToC is tentative and can be changed according to the research study conducted during the course of report completion.
**Exclusive for Multi-User and Enterprise User.
United States Pain Management Therapeutics Market
By Drug Class
- Anticonvulsants
- Antidepressants
- Anesthetics
- Non-steroidal Anti-inflammatory Drugs (NSAIDS)
- Opioids
- Antimigraine Agents
- Others
By Route of Administration
- Oral
- Injectable
- Others
By Indication
- Neuropathic Pain
- Fibromyalgia
- Arthritis
- Osteoarthritis
- Rheumatoid Arthritis
- Chronic Back Pain
- Cancer Pain
- Post-Operative Pain
- Migraine
- Others
By Distribution Channel
- Online
- Offline
- Hospitals Pharmacies
- Retail Pharmacies
- Others
By Region
- Northeast
- Southeast
- Midwest
- Southwest
- West
The Niche Research approach encompasses both primary and secondary research methods to provide comprehensive insights. While primary research is the cornerstone of our studies, we also incorporate secondary research sources such as company annual reports, premium industry databases, press releases, industry journals, and white papers.
Within our primary research, we actively engage with various industry stakeholders, conducting paid interviews and surveys. Our meticulous analysis extends to every market participant in major countries, allowing us to thoroughly examine their portfolios, calculate market shares, and segment revenues.
Our data collection primarily focuses on individual countries within our research scope, enabling us to estimate regional market sizes. Typically, we employ a bottom-up approach, meticulously tracking trends in different countries. We analyze growth drivers, constraints, technological innovations, and opportunities for each country, ultimately arriving at regional figures.Our process begins by examining the growth prospects of each country. Building upon these insights, we project growth and trends for the entire region. Finally, we utilize our proprietary model to refine estimations and forecasts.
Our data validation standards are integral to ensuring the reliability and accuracy of our research findings. Here’s a breakdown of our data validation processes and the stakeholders we engage with during our primary research:
- Supply Side Analysis: We initiate a supply side analysis by directly contacting market participants, through telephonic interviews and questionnaires containing both open-ended and close-ended questions. We gather information on their portfolios, segment revenues, developments, and growth strategies.
- Demand Side Analysis: To gain insights into adoption trends and consumer preferences, we reach out to target customers and users (non-vendors). This information forms a vital part of the qualitative analysis section of our reports, covering market dynamics, adoption trends, consumer behavior, spending patterns, and other related aspects.
- Consultant Insights: We tap into the expertise of our partner consultants from around the world to obtain their unique viewpoints and perspectives. Their insights contribute to a well-rounded understanding of the markets under investigation.
- In-House Validation: To ensure data accuracy and reliability, we conduct cross-validation of data points and information through our in-house team of consultants and utilize advanced data modeling tools for thorough verification.
The forecasts we provide are based on a comprehensive assessment of various factors, including:
- Market Trends and Past Performance (Last Five Years): We accurately analyze market trends and performance data from preceding five years to identify historical patterns and understand the market’s evolution.
- Historical Performance and Growth of Market Participants: We assess the historical performance and growth trajectories of key market participants. This analysis provides insights into the competitive landscape and individual company strategies.
- Market Determinants Impact Analysis (Next Eight Years): We conduct a rigorous analysis of the factors that are projected to influence the market over the next eight years. This includes assessing both internal and external determinants that can shape market dynamics.
- Drivers and Challenges for the Forecast Period:Identify the factors expected to drive market growth during the forecast period, as well as the challenges that the industry may face. This analysis aids in deriving an accurate growth rate projection.
- New Acquisitions, Collaborations, or Partnerships: We keep a close watch on any new acquisitions, collaborations, or partnerships within the industry. These developments can have a significant impact on market dynamics and competitiveness.
- Macro and Micro Factors Analysis:A thorough examination of both macro-level factors (e.g., economic trends, regulatory changes) and micro-level factors (e.g., technological advancements, consumer preferences) that may influence the market during the forecast period.
- End-User Sentiment Analysis: To understand the market from the end-user perspective, we conduct sentiment analysis. This involves assessing the sentiment, preferences, and feedback of the end-users, which can provide valuable insights into market trends.
- Perspective of Primary Participants: Insights gathered directly from primary research participants play a crucial role in shaping our forecasts. Their perspectives and experiences provide valuable qualitative data.
- Year-on-Year Growth Trend: We utilize a year-on-year growth trend based on historical market growth and expected future trends. This helps in formulating our growth projections, aligning them with the market’s historical performance.
Research process adopted by TNR involves multiple stages, including data collection, validation, quality checks, and presentation. It’s crucial that the data and information we provide add value to your existing market understanding and expertise. We have also established partnerships with business consulting, research, and survey organizations across regions and globally to collaborate on regional analysis and data validation, ensuring the highest level of accuracy and reliability in our reports.